Deformation Failure Mechanism of Deep Vertical Shaft in Jinchuan Mining Area

1
Key Laboratory of Shale Gas and Geoengineering, Institute of Geology and Geophysics, Chinese Academy of Science, Beijing 100029, China
2
Innovation Academy for Earth Science, Chinese Academy of Science, Beijing 100029, China
3
University of Chinese Academy of Science, Beijing 100049, China
*
Author to whom correspondence should be addressed.
Sustainability 2020, 12(6), 2226; https://0-doi-org.brum.beds.ac.uk/10.3390/su12062226
Submission received: 31 January 2020
/
Revised: 27 February 2020
/
Accepted: 11 March 2020
/
Published: 12 March 2020
(This article belongs to the Section Sustainable Engineering and Science)
Abstract
:Vertical shafts play an important role in the safe operation of mines. The stability of vertical shafts has always been a difficult problem in mining engineering, especially with the increasing of mining depth. In order to keep the engineering works stable, it is necessary to make the deformation failure mechanism of vertical shafts clear. This paper describes a case study of the deformation and failure mechanisms of the vertical shaft in Jinchuan No. 2 mining area in Gansu Province, China. Long-term deformation trends and characteristics of the vertical shaft are analyzed through ground movement and GPS monitoring of ground fissures. Then, based on previous research experience and a detailed field investigation, the modes, influencing factors, and mechanisms of deformation failure in the vertical shaft are studied. To further investigate the mechanism of shaft deformation failure and damage process under mining, the Universal Discrete Element Code (UDEC) software with Trigon approach is employed to build the numerical model of the vertical shaft. Through displacement, stress, and damage analysis, the time, location, and cause of vertical shaft failure during mining are explicitly illustrated. The results suggest that the upper and lower parts of the fault are activated in different ways. The damage to the vertical shaft is still developing at a very high rate under mining with filling method. All our results throw light on the nature of deformation and failure of vertical shafts, and several suggestions for the engineering of deep vertical shafts are finally put forward, providing a reference for other engineering.
1. Introduction
The vertical shaft is the necessary passage to the deep stratum, like the “throat” of underground mines. It plays a pivotal role in the safe operation of mines. According to incomplete statistics, deformation and failure of vertical shafts have occurred in more than a dozen large mines in China, and the repair fees alone could reach hundreds of millions of dollars [1]. As the area affected by underground mining is not always correctly estimated when selecting a site for a vertical shaft, cracking and deformation of vertical shafts often occur in some mines. With the increase of shaft depth, stability of vertical shafts becomes a vital item in mining safety in a more complicated geological environment [2].
The deformation of vertical shafts is mainly affected by mining besides shaft excavation in underground mining. Regional rock mass movement and deformation caused by deep mining have occurred in many large underground metal mines. It had a significant impact on the mine and nearby shafts, and the suffering area was unexpected. Such an example of 1500 m between mining boundary and affected area with a mining depth of only 450 m is the Tower Colliery mine in Australia [3]. The inclined deformation and large deformation of shafts in Luzhong mining area and Xiaoguanzhuang iron mine due to rock mass movement were described in the literature [4]. Besides, faults often induce the dislocation of vertical shafts, such as the X41 shaft at Mount Isa, a copper mine in Australia [5]. Aiming at the cause of mining-induced deformation of vertical shafts, scholars have done a lot of research and obtained many valuable results [6]. The factors that affect the deformation of vertical shafts include geological factors and engineering factors. The former mainly refers to the structures and properties of rock mass, especially properties of discontinuities. Weak structural planes or contact surfaces of different lithology often have weak strength and poor integrity, which can easily be damaged. The latter often acts as a trigger. Vibration of underground machinery or vehicles can cause additional loads, and the stress in equilibrium state is disturbed. It causes rock mass deformation, movement, destruction, and fault activation effects, which pose a serious threat to shaft safety [7]. Research on vertical shafts has been going on for a long time, and elastic and viscoelastic analytical solutions of vertical shafts have been proposed by researchers [8]. In recent years, scholars studied the deformation failure mode of vertical shafts mainly through numerical simulation methods [9,10,11] and physical simulation experiments [12,13,14]. Field deformation monitoring [15] was also an effective means to investigate the deformation failure mechanism of vertical shafts. In addition, many researchers proposed various wellbore safety protection and reinforcement measures for different problems [16,17,18].
At present, the researches on vertical shafts mainly focus on coal measure strata. There is little research on the mechanism of vertical shaft deformation and failure in deep inclined metallic deposit mined via the backfill method. Meanwhile the effect of faults on vertical shafts is still unclear. There is no existing engineering experience for reference. Therefore, it is necessary to study the deformation failure mechanism of vertical shafts systematically and comprehensively.
Jinchuan No. 2 mining area is located in a high ground stress area. Large-scale rock mass movements have appeared on the ground surface affected by underground mining [19]. The vertical shaft along No. 14 exploratory line, which is within the range of rock movement, has undergone several serious deformations and damages since it was put into use. The purpose of this paper is to comprehensively reveal the mechanism of shaft deformation and failure, and provide reference and technical support for preventing engineering disasters. In this regard, this paper takes the ventilation shaft along No. 14 exploratory line as an example to analyze the modes, influencing factors, laws, and mechanisms of deformation failure in the vertical shaft based on long-term monitoring and a detailed field investigation. In order to further investigate the mechanism of shaft deformation failure and damage process, UDEC trigon method is employed and the model of the shaft is built. The time, location, and cause of vertical shaft failure under mining are described in the intensive discussion and analysis.
2. Geological Background
2.1. The Engineering Status
Jinchuan Nickel Mine is one of the world’s largest copper-nickel deposits, located in central Gansu province, China (Figure 1a). It accounts for 80% of China’s nickel production, known as China’s Nickel Capital. Mine backfill method is employed in underground mining in No. 2 mining area currently. The engineering geological conditions are very complex due to intense tectonic movement [20]. The main ventilating shaft in No. 2 mining district of Jinchuan Nickel Mine, which was built in November 2000, is situated along the No. 14 exploratory line (Figure 1b). It plays a vital role in the ventilation of transport tunnel systems. The shaft was designed as a circular cross-section with 7.1 m in diameter and 715.5 m in depth. The elevation is from 1717 m to 1001.5 m. Several caving and collapse accidents occurred in the shaft in the past though supported by concrete, which caused great economic losses. There are two major faults, F16 and Fc, that threaten the vertical shaft in the study area. F16 is one of the main faults controlling the whole mining area, with a total length of 4 km. The dip angle is about 70°, dipping SW. The nearest distance between F16 and the vertical shaft is about 40 m. Fc crosses the wellbore at the depth of 207 m with a dip angle of 58°. The surrounding rock mainly consists of ultrabasic rock, diabase, granite, and marble, and detailed geological conditions are illustrated in Table 1.
2.2. Geological Structure and In-Situ Stress
The geological history is very complex in Jinchuan mining area. Multiphase geological tectonic movement occurred in the past including Indosinian, Yanshan, Luliang, etc. The study area is situated on the north of Longshou uplift belt and near the Chaoshui depression zone on the north, adjacent to the Caledonian fold belt of Qilian Mountain to the south. Tectonic blocks, which are all bounded by deep-large faults, have great influence on mineralization and occurrence environment of the mining area. As shown in Figure 2, the northern two, including Chaoshui depression belt and Longshou Mountain uplift belt, belong to the Sino-Korean quasi-platform, while the southern two, including Hexi Corridor transition zone and Calidonian fold belt of Qilian Mountain, belong to the Eurasian plate.
The main structure is a monoclinic structure in the No. 2 mining area, which inclines to the southwest. The joints, which intersect with the fault diagonally, are composed of two groups: NNE and NWW in the mining area. Complex geological conditions, high in-situ stress, weak structural planes, and cataclastic rock mass all adversely affect shaft stability.
The in-situ stress in Jinchuan No. 2 mining area has been studied for decades, and the characteristics of the in-situ stress are summarized as follows [21]:
- The in-situ stress is the compressive stress, and the maximum principal stress is the horizontal stress.
- The value of in-situ stress increases with depth, reaching a maximum of about 50 MPa at 850 m.
- The direction of the maximum principal stress is NE-NNE, which is almost perpendicular to the orebody.
- The minimum principal stress is much smaller than the maximum one with the increase of depth. The relationship between the three principal stresses and depth is approximately linear.
2.3. Rock Mass Properties
The influence of rock mass quality on the stability of shaft engineering is obvious. Numerous field investigations have shown that the characteristics of structural planes play a decisive role in the basic mechanical properties of rock mass and dominating the deformation and failure mode in the Jinchuan Mine area [22]. Various weak structural planes are well-developed, especially along the strike direction, leading to a great reduction of mechanical parameters of rock mass. Structural planes develop dynamically over time under the action of external disturbances (mainly referring to mining). Therefore, progressive deterioration of rock mass mechanical properties occurs.
In addition, the existence of faults significantly reduces the quality of rock mass. The surrounding rocks near the fault are mostly loose structures with slickensides. The fracture zone contains a mass of fault gouge and crushed stone. So, rock masses near faults are even less stable, undoubtedly. The effect of water on rock mass properties is not considered because of dry climate in this district.
Properties of intact rocks in the study area are listed in Table 2. These values were evaluated from laboratory compression tests with MTS Exceed 40. The RQD (Rock Quality Designation) values of rock masses were obtained from drill cores. The properties of rock mass are derived from the properties of rock according to the empirical formula. The deformation modulus of intact rock was converted into rock mass by the following relation between RQD and the deformation modulus ratio Em/Er [23]:
where Em and Er are modulus of rock mass and intact rock, respectively.
The strength of rock mass was then achieved by using the relation between Em/Er and the unconfined compressive strength ratio [24]:
where , , q are the compression strength of rock mass and intact rock, a constant, respectively.
The rock mass strength parameters obtained by conversion are given in Table 1. The tensile strength of rock masses was estimated as 1/10 of the compression strength.
3. Deformation Failure Characteristics of Vertical Shaft
3.1. Long-Term Monitoring
Long-term monitoring is the most direct means to study the law and mechanism of deformation and failure [25]. Generally, monitoring methods include installation of displacement meter, stress meter, inclinometer in the key area. The monitoring of vertical shaft is more difficult because the shaft is a deep vertical facility, differing from horizontal roadways. Therefore, direct monitoring and indirect monitoring were adopted to get more information about the vertical shaft.
3.1.1. Direct Monitoring
Direct monitoring means that the deformation and stress of the surrounding rock is measured directly. Large area deformation monitoring faces great difficulties. Researchers tried to monitor the strain with FBGST (Fiber Bragg Grating Sensing Technology). The fibers were embedded into the surrounding rock so that they could be in close contact with the surrounding rock. Then the strains were obtained by the variation of optical frequency. However, the fibers were repeatedly damaged by underground vehicles and water due to the complicated underground operation and rugged environment. The monitoring failed to achieve the desired results regretfully.
3.1.2. Indirect Monitoring
Indirect monitoring includes the monitoring of rock movement, roadways connected with the vertical shaft, and ground rupture. Although the monitoring results can’t tell the deformation and failure of the shaft directly, they have great reference significance for the development trend of shaft deformation.
Fortunately, Long-term GPS ground movement monitoring network has been built in Jinchuan Mine area since 2001 [26]. Z-12-type GPS receiver and antenna (Ashtech, USA) were employed to receive data from 289 monitoring points. Four sets of equipment were used for synchronous monitoring. One set of equipment was fixed on the datum, and the others were placed at different monitoring points to form a synchronous monitoring triangulation network. The displacement accuracies, which were 3 mm + 0.5 ppm in the horizontal direction and 5 mm + 1 ppm in the horizontal direction, can meet the requirements for the measurement of ground movement. The survey time of each segment was 1–2 h, and the static model program was used for data collection with an interval of 10 s. The mean square error of the points was calculated to be about ±1.96 mm, and the accuracy of the monitoring data was confirmed to meet the requirements. According to the latest monitoring results, large area and severe strata movement have occurred, leading to a nearly circular depression with the increase of mining depth (Figure 3a,b). The settlement center is between No. 14 and No. 18 exploratory lines. The maximum value of the cumulative three-dimensional displacement is 3850 mm in No. 2 mining district during sixteen and a half years (2001.4~2017.10). The maximum vertical settlement is 3478 mm, and the maximum horizontal displacement is 2307 mm. These monitoring points that show maximum values are situated along or near No. 14 exploratory line. The vertical shaft, which is also located on this exploratory line, is the most threatened engineering facility by mining in No. 2 mining area.
Ground movement has a close relationship with underground deformation. Field investigation often shows that the seriously deformed and damaged roadway is located on the plane projection of the settlement center. It can be seen from the displacement distribution that the ventilating shaft is located at the edge of the mining-induced subsidence basin, 340 m far from the settlement center. The strata around here are under tension effect, and the displacement vector is especially significant.
The character of ground movement in the vicinity of the vertical shaft is consistent with the deformation character of the whole mining district. The displacement curves of No. 14 exploratory line are shown in Figure 4a, and the subsidence even tended to increase rapidly in recent years. The cumulative three-dimensional displacement of the wellhead is 1355 mm during sixteen and a half years (2001.4~2017.10) (Figure 4b). The cumulative settlement is 1225 mm (Figure 4c), and the cumulative horizontal displacement is 522 mm (Figure 4d). The monitoring curves show that the cumulative displacement values have increased almost linearly so far and the deformation is developing steadily.
The ground fissures began to expand at an accelerating pace as the mining depth increases, and have already developed to the edge of the shaft, which has a great impact on its stability. Through three field surveys (in 2000, 2008, and 2016, see Figure 5), fifty ground fissures have been found. Most fissures have propagated to some degree since 2000. Several of them tend to be integrated along the ore body strike, and the apertures are visibly widened. It can be seen from the fissure distribution that two roughly parallel fissure zones have been formed, and the extension direction is basically the same as the strike of ore body. The Fissure zone 1 is growing between No. 4 and No. 26 exploratory line with the total length of about 1.1 km. Numerous fissures in this zone are mostly single fissures, and many of them have a potential tendency to cross over. The Fissure zone 2 is growing between No. 4 and No. 30 exploratory line, 0.5 km far from Fissure zone 1. The total length is about 1300 m, and 930 m of them have coalesced. Alarmingly, the maximum width of the fissure has reached 70 cm. The vertical shaft is adjacent to Fissure zone 2 and is inevitably affected. Once connected fissures lead to large area collapse, the shaft will suffer unimaginable damage.
3.2. Field Investigation
Site investigation is the most intuitive and basic investigation method, which can give specific insight into the deformation and failure of the shaft. In this paper, a detailed site investigation was carried out on the vertical shaft along the No. 14 exploratory line in No. 2 mining area and the roadways connecting with it. The strength, structure, and deformation failure characteristics of rock mass were studied, which provided data for further analysis.
By rough statistics during the field investigation at roadways, four types of rock mass structures exist in the study area (Figure 6). The proportions of these rock mass structures and coefficient of integrity are shown in Figure 7. These structural planes cut, inlay, and combine with each other to form a discrete fracture network. Hence, that high rock strength but low rock mass strength is one of the most salience feature in the study area.
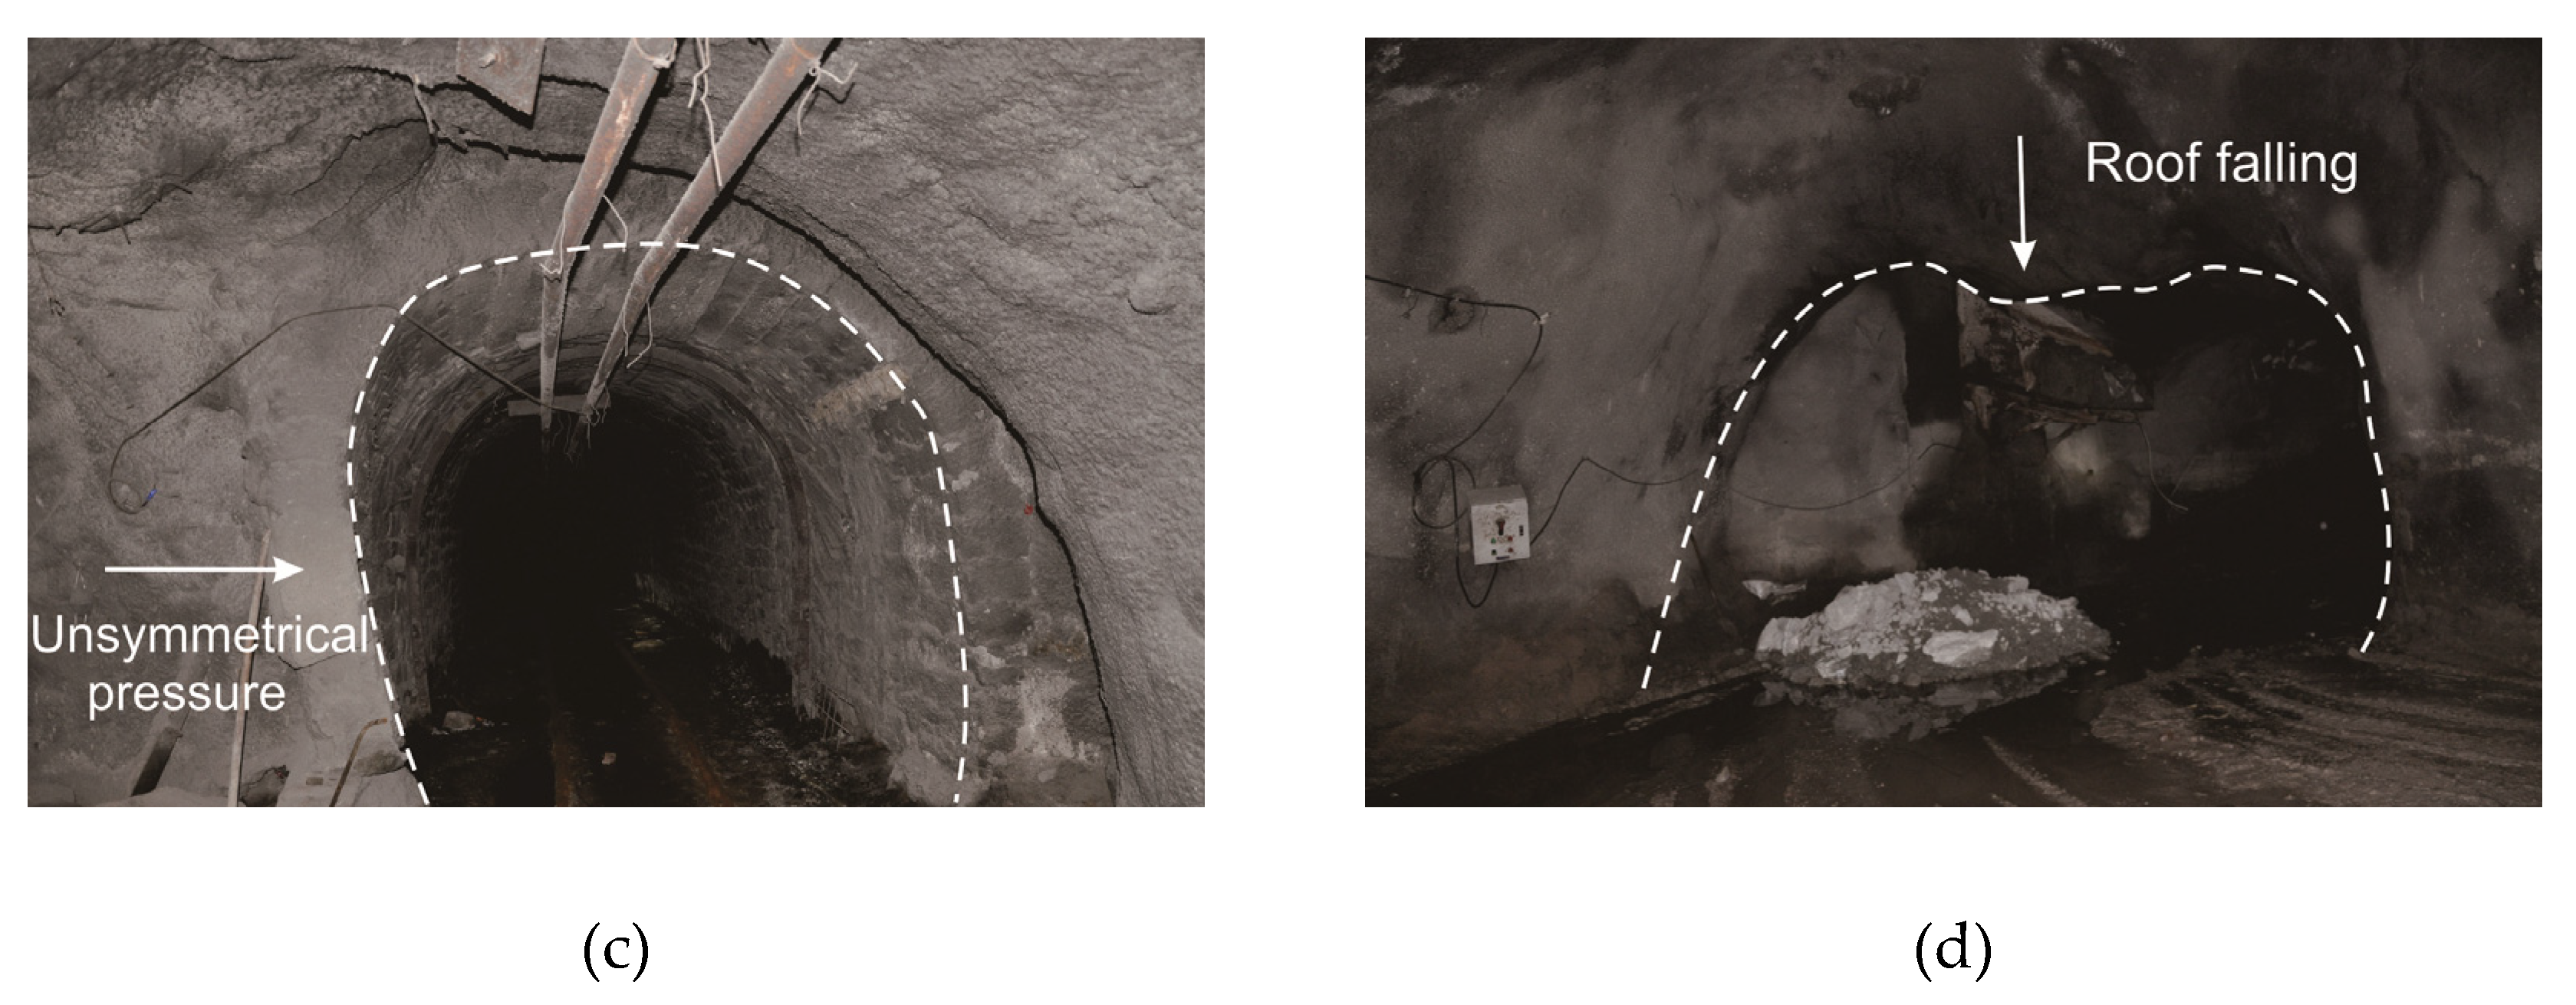
The deformation of strata varies at different depth. During the investigation of the roadway connected to the vertical shaft, the main forms of deformation at 1000 m, 1100 m, 1200 m, 1300 m level were found to be roof cracking, rib spalling, unsymmetrical pressure, and roof falling, respectively, as shown in Figure 8. This actually reflects the complexity of the stress environment, and the surrounding rock of the vertical shaft may have different deformation mechanisms at different depths.
3.3. Deformation Failure Modes
Based on the detailed field investigation of the main ventilation shaft, several deformation and failure form of vertical shaft are summarized as follows.
3.3.1. Dislocation Cracking
Dislocation cracking appeared in the northwest and southeast of the shaft lining with shapes of annular, vertical, echelon, or x-shaped intersecting (Figure 9a–c). This phenomenon could occur for three reasons. The first was the concentration of horizontal stress, which lead to lateral dilation and even shear fracture when horizontal extrusion pressure exceeded the strength of surrounding rock. The second was mining. The surrounding rock moved towards the goaf while the overlying rock bent due to mining effect. As a result, the rock mass slipped along the bedding and the shaft wall was broken. The third was weak intercalation. The shaft walls were staggered by the sliding of weak intercalation.
3.3.2. Rib Spalling
Rib spalling was the most common form of destruction found in the survey (Figure 9d) while the mechanism was shearing or tension in effect. In some cases, there were only penetrating longitudinal cracks in the sidewall and a small number of blocks fell. Some were more serious. The concrete lining was broken and grew to spalling (Figure 9e), while a cavity was formed between the lining and its surrounding rock.
3.3.3. Falling Objects Hit the Shaft Lining
A hole was found in the southeast side of the shaft at about 170 m from the wellhead (Figure 9f). It was preliminarily determined from the distribution of falling rocks that the fall mainly occurred in the northwest side of the shaft wall.
3.4. Influencing Factors of the Deformation Failure
Jinchuan mining area is in an unstable complex stress environment, and various factors affecting shaft stability interact with each other. Based on the field investigation and analysis, the main influencing factors are summarized into the following three types.
3.4.1. In-Situ Stress
The in-situ stress environment is very complex in Jinchuan mining area, and the stress state in the deep is more complicated than that in the shallow. The phenomenon of high ground stress is obvious. Local stress state will also change with the complexity of stope structure. Therefore, the occurrence environment of the vertical shaft is different from top to the bottom.
3.4.2. Rock Mass Structure
3.4.3. Mining-Induced Stress
Continuous mining activities, blasting vibration, large forklifts, and other dynamic loads cause stress redistribution. The weak structural planes are gradually loosening, accelerating the deformation and failure of the surrounding rock.
4. Deformation Failure Mechanism of Vertical Shaft
4.1. Mining-Induced Deformation and Failure
Stress field characteristics, rock mass properties, and dynamic response all change significantly with the increasing of mining depth. The failure process of deep rock mass often has essential differences with the shallow one under high ground stress and nonlinear dynamic load. The vertical shaft along the No. 14 exploratory line has undergone several repairs before, but the mechanism of deformation and failure is still unclear. Therefore, the time, location, and cause of shaft failure under mining need to be further studied.
4.2. Numerical Modeling with DEM
The discrete element method (DEM) has been widely used in rock mechanics problems caused by mining in recent years. It has already shown superiority in dealing with discontinuous medium problems. The discontinuous medium in UDEC is represented by a discrete block aggregate. The discontinuities are set to contacts between the blocks, allowing the discrete blocks to move and rotate, including complete detachment while new contacts are automatically identified during calculation. The discrete element method (DEM) can not only represent the fracture state and nonlinear mechanical characteristics of the surrounding rock, but also can reveal the failure process of the vertical shaft by simulating the behavior of the surrounding rock [29]. So, it is adopted in this paper.
4.2.1. UDEC Trigon Approach
Most previous studies used regular distribution of joints to simulate the geological structure of the surrounding rock, but it is difficult to characterize the real structural characteristics and real mechanical behavior of the rock mass. In this study, UDEC Trigon model is developed. The trigon blocks are generated by cutting UDEC Voronoi polygonal blocks into triangular fine blocks connected by contacts. In the numerical simulations, rock masses are represented as aggregations of trigon blocks [30]. Each block is assigned certain material properties and obeys Newton’s laws under external forces, and failure can only occur along the contacts. This method is suitable for simulating the discrete fracture network in the study area because of broken rock masses and well-developed structural planes.
In a UDEC Trigon model, a linear stress-displacement relation is assumed for the contacts. The response is governed by the normal stiffness () and limited by the tensile strength () in the normal direction while governed by the shear stiffness () and limited by the shear strength () in the shear direction. Thus in the normal direction, if
then
or else, if
Then
and tensile failure occurs in the contact.
In the shear direction, if
then
or else, if
Then
and shear failure occurs in the contact.
Where and are the effective normal stress increment and shear stress increment. and are the normal displacement increment and elastic shear displacement increment. and are the cohesion and friction angle, respectively.
4.2.2. Rock Property Calibration
The microscopic physical mechanical parameter of the blocks and contacts were calibrated against the rock mass properties listed in Table 2. These were in preparation for using an assembly of triangular blocks to represent rock masses [31]. The mechanical parameter values of contacts shown in Table 3 were obtained by creating a numerical model with the Trigon logic and simulating unconfined compression tests. The calibration model had the similar block size as the shaft model to eliminate the effect of mesh size. The results in Figure 10 fit well with the laboratory experiment. The calibration results of rock mass properties in UEDC Trigon are provided in Table 4 and Figure 11. The failed contacts were assumed to have zero cohesion and zero tension strength and residual friction angle in this study [32].
4.2.3. Model Configuration
A numerical model of the vertical shaft was established by UDEC Trigon approach to investigate the mechanism of shaft deformation and the fault effect under backfill mining, see Figure 12. The main features were abstracted from the engineering geological conditions illustrated in Figure 1 and Table 1, and the model was simplified as necessary. The model had dimensions of 2000 m 1000 m (length height), containing 5446 blocks. Trigon blocks with average side length less than 3 m were adopted only in the key areas, including the surrounding rock of vertical shaft and fault, to improve computational efficiency. Voronoi blocks with average side length less than 15 m were created in other areas to simulate fractured rock masses. According to the preliminary calculation results of the generalized model, the ground surface morphology of the profile had little influence on the simulation results, which could be ignored. Therefore, the surface was simplified to a horizontal plane. A vertical gradient stress was applied on the top boundary to represent overburden stress. The horizontal displacement of the lateral boundaries was fixed, and the horizontal and vertical displacements of the bottom boundary were constrained.
The Mohr–Coulomb elastoplastic constitutive model was used in this model. The mined-out orebody was represented by a null model. The material parameters of the goaf were assigned to represent the filling after each layer of ore body was mined out, and the filling material parameters came from the Jinchuan Nickel Cobalt Research and Design Institute. In order to better represent the deformation and deterioration of backfill materials, the strain softening constitutive model was adopted. A FISH program was used to determine whether the joint was broken every 1000 steps, and the broken joints then will be marked. The strength parameters of the broken joints will change as a function with the increasing time step (Figure 13) [33], and a FISH program was used to simulate the process of parameter weakening.
4.3. Analysis of Mining-Induced Deformation and Failure
4.3.1. Displacement Analysis
Figure 14 shows displacement curves of the ground surface calculated by the model, which was basically consistent with the trend of measured displacement (Figure 4a). This indicates that the model can roughly reflect the deformation of the engineering rock mass under the working conditions.
Figure 15 shows the x-displacement and y-displacement cloud diagrams of the surrounding rock around the vertical shaft at different mining stages, respectively. It can be seen that the wellhead suffered severe deformation. The shaft was located in the compression zone caused by mining so that the wellhead was subjected to strong compression. The horizontal deformation was obviously asymmetric in the lateral of the vertical shaft, and the convergence of the lateral wall increased gradually with time (Figure 15a). In the first mining stage, the shaft wall moved toward the center almost synchronously from top to bottom. Then the rate of deformation in the middle part of the shaft started to become higher from the second mining stage. The phenomenon of displacement localization became obvious from the third stage. The displacement increased faster in some locations, while the change was small in others. A special region with larger horizontal displacement was finally formed on the left side of the wall at an altitude of −200 to −400 m, and the right side at an altitude of −30 to −300 m. The maximum horizontal displacement of the shaft wall was about 1.6 m, except for the collapse of the wellhead. The abnormal displacement area was around the fault Fc, and this indicated that Fc was the main cause of abnormal displacement. It can be claimed that the fault Fc had been activated by mining. The existence of inclined fault greatly increased the possibility of rock mass moving along the gently inclined structural plane. The asynchronous horizontal displacement of rock mass and the change in the direction of displacement had enormous destructive effect on the shaft. If the stress produced by rock strata movement exceeded the shear strength, then shear failure would occur.
As the depth of mining increased, the vertical displacement showed a trend of rapid growth (Figure 15b). However, it varied greatly from the top to the bottom of the wellbore. In brief, the upper part settled while the bottom rose. Moreover, the settlement was larger on the left side, and the rise was more prominent on the right side. The maximum settlement of shaft wall was about 1.5 m, and the maximum rise was about 0.7 m, except for the collapse of the wellhead. This was related to rock mass movement and activation of fault F16 caused by mining, which will be discussed below.
It can be seen from the calculation model that five pairs of monitoring points are set along the fault F16. The distance from each monitoring point to the fault is 5 m, and each pair is evenly spaced. Figure 16 shows the vertical displacement difference and horizontal displacement difference of each pair of monitoring points in the final stage. The positive value means that the settlement of the monitoring point on the right is greater than that on the left in Figure 16a, and the horizontal displacement of the monitoring point on the right along the positive X axis is greater in Figure 16b. It clearly reflects the dislocation of both sides of the fault during mining process in the numerical model. The displacement difference changed with the increasing mining depth as the stage progressed. Interestingly, different parts of the fault moved in different ways. The shallow and middle parts of fault were activated as a normal fault, and these parts were subjected to tension. The deep part was activated as a reverse fault, and the part was squeezed.
4.3.2. Stress Analysis
The simulated evolution processes of maximum principal stress and minimum principal stress around the vertical shaft at different stages of mining are shown in Figure 17a,b. As can be seen from Figure 17a, stress concentration occurred at a distance from the surface of the shaft in the first mining stage. The stress around the wellbore surface was relatively small. It indicated that the wellbore surface had been already fractured due to the unloading effect of shaft excavation and the bearing capacity of surrounding rock decreased. When the deviatoric stress reached the compressive strength, the surrounding rock was destroyed. With the progress of mining stage, the stress concentration spread further to the depth. Stress relaxation occurred on both sides of wellbore. The stress relaxation zone around the shaft was increasing rapidly, especially on the bottom near the goaf. It is observed from Figure 17b that the surface of the wellbore bore high tensile stress, and the range gradually spread to the depth with mining. The left portion of the bottom of the wellbore expanded the fastest and the tensile stress zone spread to goaf.
4.3.3. Crack and Damage Analysis
The essence of rock deformation and failure is the formation and development of internal micro-cracks, including the growth and coalescence of micro-cracks and the formation of macroscopic cracks. It has been confirmed by a great deal of engineering practices that the instability of underground engineering is closely related to crack propagation. Therefore, it is of great significance to capture the generation and evolution process of cracks around the vertical shaft successfully. Figure 18 shows the evolution of shear cracks and tension cracks. In the first mining stage, shear cracks first appeared near the surface of the vertical shaft, and only a few tensile cracks appeared near the Fc fault. With the progress of mining stage, the stress relaxation zone of the surrounding rock gradually expanded to the deep. The shear crack began to lengthen and gradually developed deeper. The tensile fracture zone first formed near the fault with the release of stress. Then it expanded further and formed tensile fracture zone near the wellhead and the bottom of the wellbore, especially the left part, corresponding to stress evolution. The number of cracks increased rapidly, and the cracks tended to break through and form macroscopic cracks. The surrounding rock of the shaft finally would break, expand, and flake due to tensile failure, with friction and immobilization between blocks almost disappearing.
Figure 19a shows progressive damage in the surrounding rock of the vertical shaft during mining. The concept “damage” was expressed as the ratio of the length of fractured contact to the total length of all contacts within the area of interest, which is shown in Figure 12 [34]. Microseismic activity is a good tool to study the evolution process of microcracks and the mechanism of rock mass instability. The failure of block contacts can be regarded as the cause of microseismic activity in the UDEC trigon method. Therefore, we simulated microseismic activity by recording the increased number of cracks in a certain time step, and the results are shown in Figure 19b,c. It can be seen that the microseismic activity began to increase from the second half of the first mining stage, and the number of microcracks increased significantly. A large number of shear cracks were first formed, and then tensile cracks began to appear. With the increase of mining depth, the number of microcracks maintained a high growth rate despite the use of filling mining method. From the trend of the curve, it can be inferred that the damage will continue to develop rapidly as long as the mining continues to go deeper. The filling method failed to limit the damage of the shaft.
4.4. The Mechanism of Mining-Induced Deformation and Failure
These results suggested that rock mass movement and fault activation caused by mining are the main causes of shaft deformation and failure. Due to the effect of initial excavation and unloading, the surrounding rock of the wellbore tended to move towards the free face. The rock mass was highly fractured and the quality deteriorated gradually. The overall strength of the rock mass was reduced, and the flexibility was increased. Therefore, rock mass was more prone to deformation and movement.
On the one hand, the gravitational potential energy would be transformed into the work to move, deform, and destroy the rock mass after the ore body was gradually extracted. The vertical shaft, which was located in the surface compression zone, was bound to bear the pressure and shear force because of diverse settlement in the vertical direction and diverse movement in the horizontal direction. On the other hand, the existence of faults destroyed the deformation coordination condition of rock mass. The fault cracked and mobilized under mining. The activation of the fault F16 caused relative displacement between the hanging wall and foot wall. The upper part of the fault moved as a normal fault and the lower part moved as a reverse fault. The dividing line was roughly 600 m below the ground surface, as shown in Figure 20. The fault F16 was very close to the shaft, and the closest distance was only 40 m. The range of fault influence increased with the intensification of fault activation and gradually extended to the surrounding rock of the shaft. As a consequence, the surrounding rock was severely deformed. Thus, the upper part of the shaft tended to move down and the bottom tended to move up together with the activated fault. Meanwhile, the laterals were subjected to shear forces of different magnitude and direction. The fault Fc ran through the shaft, and the rock mass of the fracture zone was extremely broken under mining. It is the most likely location of partial wellbore disconnected and block caving. Therefore, the damage of the vertical shaft continues to intensify in this way under continuous mining.
4.5. Suggestions for the Engineering of Deep Vertical Shaft
Although the research on vertical shaft deformation and failure has been carried out for a long time and obtained many excellent results, there are still a variety of common problems in the design phase and engineering practice. The geological environment is more complicated in the deep due to the uneven high pressure, the weak structural plane, the strong mining-induced stress, etc. Based on the summary of previous research results, the following three suggestions are proposed.
4.5.1. Reasonable Location
The selection of shaft construction location is crucial to the long-term stability. Location selection should not only be based on the engineering geological characteristics and stress distribution of the site, but also focus on the impact of faults or large structure planes. Mining-induced fault activation greatly enlarges the affected area and produces strong deformation and damage effect to the surrounding rock. Therefore, detailed investigation should be carried out before the location selection to avoid the affected area of the fault as much as possible.
4.5.2. Timely Monitoring
Timely monitoring and information feedback is the best way to obtain first-hand information of deformation. Vertical shafts run through different strata from top to bottom, and the stress environment and rock mass properties cannot be exactly the same. It is necessary to monitor the deformation at different elevations and positions as far as possible so as to provide a reliable theoretical basis for the prediction of shaft instability risk.
4.5.3. Targeted Support
Support schemes and parameters should suit the remedy to the case. A detailed field investigation should be performed, and the influencing factors should be thoroughly understood. Support of weak parts should be strengthened according to the failure mode.
5. Conclusions
This paper presents a case study on the deformation and failure mechanisms of the vertical shaft. The vertical shaft of Jinchuan No. 2 mining area in China is a typical vertical shaft threatened with serious damage. To achieve the goal, long-term deformation monitoring, field investigation, and numerical simulation method were used in this study. The engineering geological conditions in the study area were poor, and the rock mass was extremely weak based on surveys, tests, and analyses. Long-term monitoring shows that the shaft is located at the edge of the mining subsidence basin and the edge of the ground fissures zone. The cumulative 3D displacement, settlement, and horizontal displacement of the wellhead reached 1355 mm, 1225 mm, and 522 mm, respectively. The deformation characteristics around the shaft were consistent with those of the whole mining area and the deformation was still increasing approximately linearly. Dislocation cracking, rib spalling, and falling objects hitting the shaft lining were summarized as the main forms of vertical shaft failure whose influencing factors mainly include in-site stress, rock mass structure, and mining-induced stress. Mining-induced fault activation was demonstrated by numerical simulations. The upper part of the fault F16 moved as a normal fault, and the lower part moved as a reverse fault. The dividing line was roughly 600 m below the ground surface. The shaft was subjected to larger compression force and shear force locally. The fault Fc that traversed the shaft was most likely to cause the well wall to be broken and the block to fall. The UDEC trigon approach provided a way to capture the process of damage evolution. Though using filling method, the damage was still developing at a very high rate. The damage of the vertical shaft continues to intensify, and the shaft is predicted to be destroyed in the way described in the paper under continuous mining. This case study could bring about references for studies of vertical shafts failure and provide advice for the planning and construction of vertical shafts.
Author Contributions
Conceptualization, Q.S. and F.M.; data curation, J.G.; funding acquisition, F.M.; investigation, Q.S., G.L., and X.F.; methodology, G.L.; project administration, F.M.; software, Q.S.; writing—original draft, Q.S.; writing—review & editing, Q.S. All authors have read and agreed to the published version of the manuscript.
Funding
This research was funded by the National Science Foundation of China grant number [41772341, 41831293]. Grateful appreciation is expressed for these supports.
Conflicts of Interest
The authors declare no conflict of interest.
References
- Ma, F.; Deng, Q.; Cunningham, D.; Yuan, R.; Zhao, H. Vertical shaft collapse at the Jinchuan Nickel Mine, Gansu Province, China: Analysis of contributing factors and causal mechanisms. Environ. Earth Sci. 2013, 69, 21–28. [Google Scholar] [CrossRef]
- Diering, D.H. Ultra-deep level mining—Future requirements. J. S. Afr. Inst. Min. Metall. 1997, 97, 249–255. [Google Scholar]
- Hebblewhite, B. Regional horizontal movements associated with longwall mining. In Proceedings of the 19th International Ground Control in Mining Conference, Morgantown, VA, USA, 1 August 2000. [Google Scholar]
- Li, W.X.; Zhao, S.T.; Liang, X.L.; Dai, L.F. Influence of underground mining on shaft towers in Luzhong mining areas. Yanshilixue Yu Gongcheng Xuebao/Chin. J. Rock Mech. Eng. 2006, 25, 74–78. [Google Scholar]
- Bruneau, G.; Tyler, D.B.; Hadjigeorgiou, J.; Potvin, Y. Influence of faulting on a mine shaft-a case study: Part I-Background and instrumentation. Int. J. Rock Mech. Min. Sci. 2003, 40, 95–111. [Google Scholar] [CrossRef]
- Kontogianni, V.A.; Stiros, S.C. Induced deformation during tunnel excavation: Evidence from geodetic monitoring. Eng. Geol. 2005, 79, 115–126. [Google Scholar] [CrossRef]
- Xia, K.; Chen, C.; Zheng, Y.; Zhang, H.; Liu, X.; Deng, Y.; Yang, K. Engineering geology and ground collapse mechanism in the Chengchao Iron-ore Mine in China. Eng. Geol. 2019, 249, 129–147. [Google Scholar] [CrossRef]
- Lekhnitskii, S.G.; Fern, P.; Brandstatter, J.J.; Dill, E.H. Theory of Elasticity of an Anisotropic Elastic Body. Phys. Today 1964, 84, 17–18. [Google Scholar] [CrossRef]
- Dias, T.G.S.; Farias, M.M.; Assis, A.P. Large diameter shafts for underground infrastructure. Tunn. Undergr. Space Technol. 2015, 45, 181–189. [Google Scholar] [CrossRef]
- Mitelman, A.; Elmo, D.; Stead, D. Development of a spring analogue approach for the study of pillars and shafts. Int. J. Min. Sci. Technol. 2018, 28, 267–274. [Google Scholar] [CrossRef]
- Walton, G.; Kim, E.; Sinha, S.; Sturgis, G.; Berberick, D. Investigation of shaft stability and anisotropic deformation in a deep shaft in Idaho, United States. Int. J. Rock Mech. Min. Sci. 2018, 105, 160–171. [Google Scholar] [CrossRef]
- Xu, J.; Li, X.; Han, C. A study of fault step from open excavation and its size. J. Eng. Geol. 2007, 15, 38–44. [Google Scholar]
- Zhao, H.; Ma, F.; Xu, J.; Guo, J.; Yuan, G. Experimental investigations of fault reactivation induced by slope excavations in China. Bull. Eng. Geol. Environ. 2014, 73, 891–901. [Google Scholar] [CrossRef]
- Cho, J.; Lim, H.; Jeong, S.; Kim, K. Analysis of lateral earth pressure on a vertical circular shaft considering the 3D arching effect. Tunn. Undergr. Space Technol. 2015, 48, 11–19. [Google Scholar] [CrossRef]
- Liu, Z.H.; Gao, Q.; Yang, Z.Q. Application of FBG sensor in shaft structural deformation monitoring of JINCHUAN Mine No.3. Adv. Mater. Res. 2011, 243–249, 5420–5426. [Google Scholar] [CrossRef]
- Liao, L.; de la Fuente, A.; Cavalaro, S.; Aguado, A. Design procedure and experimental study on fibre reinforced concrete segmental rings for vertical shafts. Mater. Des. 2016, 92, 590–601. [Google Scholar] [CrossRef]
- Pujades, E.; Vázquez-Suñé, E.; Carrera, J.; Vilarrasa, V.; De Simone, S.; Jurado, A.; Ledesma, A.; Ramos, G.; Lloret, A. Deep enclosures versus pumping to reduce settlements during shaft excavations. Eng. Geol. 2014, 169, 100–111. [Google Scholar] [CrossRef]
- Zhao, X.; Zhou, G.; Zhao, G.; Kuang, L.; Hu, X. Fracture controlling of vertical shaft lining using grouting into neighboring soil deposits: A case study. Soils Found. 2017, 57, 882–891. [Google Scholar] [CrossRef]
- Hui, X.; Ma, F.; Zhao, H.; Xu, J. Monitoring and statistical analysis of mine subsidence at three metal mines in China. Bull. Eng. Geol. Environ. 2018, 78, 3983–4001. [Google Scholar] [CrossRef]
- Li, G.; Ma, F.; Guo, J.; Zhao, H.; Liu, G. Study on deformation failure mechanism and support technology of deep soft rock roadway. Eng. Geol. 2019, 264, 105–262. [Google Scholar] [CrossRef]
- Wu, M.L.; Ma, Y.; Liao, C.T. Study of recent state of stress in depth 1000 m of Jinchuan mine. Chin. J. Rock Mech. Eng. 2008, 27 (Suppl. 2), 3785–3790. [Google Scholar]
- Zhao, H.; Ma, F.; Xu, J.; Guo, J. In situ stress field inversion and its application in mining-induced rock mass movement. Int. J. Rock Mech. Min. Sci. 2012, 53, 120–128. [Google Scholar] [CrossRef]
- Zhang, L.; Einstein, H.H. Using RQD to estimate the deformation modulus of rock masses. Int. J. Rock Mech. Min. Sci. 2004, 41, 337–341. [Google Scholar] [CrossRef]
- Singh, M.; Rao, K.S. Empirical methods to estimate the strength of jointed rock masses. Eng. Geol. 2005, 77, 127–137. [Google Scholar] [CrossRef]
- Xia, K.; Chen, C.; Fu, H.; Pan, Y.; Deng, Y. Mining-induced ground deformation in tectonic stress metal mines: A case study. Eng. Geol. 2016, 210, 212–230. [Google Scholar] [CrossRef]
- Ma, F.; Zhao, H.; Yuan, R.; Guo, J. Ground movement resulting from underground backfill mining in a nickel mine (Gansu Province, China). Nat. Hazards 2015, 77, 1475–1490. [Google Scholar] [CrossRef]
- Zhang, Z.; Chen, F.; Li, N.; Swoboda, G.; Liu, N. Influence of fault on the surrounding rock stability of a tunnel: Location and thickness. Tunn. Undergr. Space Technol. 2017, 61, 1–11. [Google Scholar] [CrossRef]
- Zhao, H.; Ma, F.; Li, G.; Ding, D.; Wen, Y. Deformation and destruction of mine workings caused by excavation-induced fault activation. Met. Mine 2008, 384, 9–12. [Google Scholar]
- UDEC User Manual; Itasca Consulting Group, Inc.: Minneapolis, MN, USA, 2008.
- Gao, F.Q.; Stead, D. The application of a modified Voronoi logic to brittle fracture modelling at the laboratory and field scale. Int. J. Rock Mech. Min. Sci. 2014, 68, 1–14. [Google Scholar] [CrossRef]
- Yang, S.; Chen, M.; Jing, H.; Chen, K.; Meng, B. A case study on large deformation failure mechanism of deep soft rock roadway in Xin’An coal mine, China. Eng. Geol. 2017, 217, 89–101. [Google Scholar] [CrossRef]
- Zhang, S.; Zhang, D.; Wang, H.; Liang, S. Discrete element simulation of the control technology of large section roadway along a fault to drivage under strong mining. J. Geophys. Eng. 2018, 15, 2642–2657. [Google Scholar] [CrossRef] [Green Version]
- Jiang, Q.; Feng, X.; Chen, G. Study on constitutive model of hard rock considering surrounding rock deterioration under high geostresses. Chin. J. Rock Mech. Eng. 2008, 27, 144–152. [Google Scholar]
- Gao, F.; Stead, D.; Kang, H. Simulation of roof shear failure in coal mine roadways using an innovative UDEC Trigon approach. Comput. Geotech. 2014, 61, 33–41. [Google Scholar] [CrossRef]
Figure 1.
(a) Location and geological sketch map of the Jinchuan Mine area. (b) Geologic profile of the No. 14 exploratory line.
Figure 1.
(a) Location and geological sketch map of the Jinchuan Mine area. (b) Geologic profile of the No. 14 exploratory line.

Figure 2.
Geological structure in the study area.

Figure 3.
Displacement contour of mining area (2001.4~2017.10). (a) Contour map of vertical displacements (unit: mm); (b) contour map of horizontal displacements (unit: mm).
Figure 3.
Displacement contour of mining area (2001.4~2017.10). (a) Contour map of vertical displacements (unit: mm); (b) contour map of horizontal displacements (unit: mm).

Figure 4.
Displacement monitoring curve (2001.4~2017.10). (a) Settlement curves of No. 14 exploratory line; (b) cumulative three-dimensional displacement of the vertical shaft; (c) cumulative vertical displacement of the vertical shaft; (d) cumulative horizontal displacement of the vertical shaft.
Figure 4.
Displacement monitoring curve (2001.4~2017.10). (a) Settlement curves of No. 14 exploratory line; (b) cumulative three-dimensional displacement of the vertical shaft; (c) cumulative vertical displacement of the vertical shaft; (d) cumulative horizontal displacement of the vertical shaft.

Figure 5.
Displacement vector of GPS points and ground fissures.

Figure 6.
Rock mass structures in the study area. (a) Rhombic structure; (b) lamellar structure; (c) cataclastic structure; (d) loose structure.
Figure 6.
Rock mass structures in the study area. (a) Rhombic structure; (b) lamellar structure; (c) cataclastic structure; (d) loose structure.


Figure 7.
Different rock mass structures and coefficient of integrity in the study area.

Figure 8.
Four levels of roadway deformation and failure near the vertical shaft. (a) 1000 m level; (b) 1100 m level; (c) 1200 m level; (d) 1300 m level.
Figure 8.
Four levels of roadway deformation and failure near the vertical shaft. (a) 1000 m level; (b) 1100 m level; (c) 1200 m level; (d) 1300 m level.


Figure 9.
Failure modes in the ventilation shaft of Jinchuan Mine area. (a) Annular crack; (b) x-shaped crack and vertical crack; (c) echelon crack; (d) spalling; (e) bed separation; (f) falling objects hit the wall.
Figure 9.
Failure modes in the ventilation shaft of Jinchuan Mine area. (a) Annular crack; (b) x-shaped crack and vertical crack; (c) echelon crack; (d) spalling; (e) bed separation; (f) falling objects hit the wall.


Figure 10.
Uniaxial compression tests performed on samples with Universal Discrete Element Code (UDEC) Trigon approach.
Figure 10.
Uniaxial compression tests performed on samples with Universal Discrete Element Code (UDEC) Trigon approach.

Figure 11.
Simulated stress-strain curves for the rock mass.

Figure 12.
Numerical calculation model for the vertical shaft.

Figure 13.
Process of mechanical parameter deterioration. ( is strain; is equivalent plastic strain; is initial cohesion; is residual cohesion; is initial internal friction angle; is residual internal friction angle.) Downward stratified cemented filling mining method was adopted in the mining area. The level and mining sequence of the ore body in the model are simplified, shown in the Figure 12 and Table 5. The width of ore body and fault zone was determined according to the geological cross-section diagrams and preliminary trial calculations. Five monitoring points groups and a monitoring line were set up on both sides of the fault and the ground surface to monitor the displacement, respectively.

Figure 14.
Simulated ground surface settlement curve.

Figure 15.
Displacement cloud diagrams around the vertical shaft at different mining stages. (a) Right direction is positive, and left direction is negative. (b) Upward direction is positive, and downward direction is negative.
Figure 15.
Displacement cloud diagrams around the vertical shaft at different mining stages. (a) Right direction is positive, and left direction is negative. (b) Upward direction is positive, and downward direction is negative.

Figure 16.
Displacement difference of monitoring points between the hanging wall and foot wall. (a) Vertical displacement difference. (b) Horizontal displacement difference.
Figure 16.
Displacement difference of monitoring points between the hanging wall and foot wall. (a) Vertical displacement difference. (b) Horizontal displacement difference.

Figure 17.
Simulated evolutionary process of principal stress around the vertical shaft at different mining stages. (a) Maximum principal stress; (b) minimum principal stress.
Figure 17.
Simulated evolutionary process of principal stress around the vertical shaft at different mining stages. (a) Maximum principal stress; (b) minimum principal stress.

Figure 18.
Crack propagation process around the vertical shaft. (Red lines represent tension cracks, and blue lines represent shear cracks.).
Figure 18.
Crack propagation process around the vertical shaft. (Red lines represent tension cracks, and blue lines represent shear cracks.).

Figure 19.
Simulated damage development and seismicity. (a) Damage development. (b) Shear fracture events. (c) Tension fracture events.
Figure 19.
Simulated damage development and seismicity. (a) Damage development. (b) Shear fracture events. (c) Tension fracture events.

Figure 20.
Schematic diagram of shaft damage mechanism.


Table 1.
Geological conditions of the vertical shaft.
| Elevation Range (m) | Lithology | Fracture Density (strip/m) | Moisture Content | Geologic Description |
|---|---|---|---|---|
| 1717~1510 | Peridotite | 4~6 | 1717~1655: no water 1655~1510: from water seepage, dripping to gushing water | Lithological contact zone (below 1567 m), poor engineering geological conditions |
| 1510~1489.2 | Ultrabasic rock and granite contact zone | 3~5 | Gushing water, gushing mud | A small fault at 1510 m containing massive fault gouge and breccia |
| 1489.2~1043 | Granite | 4~13 | No water | Several small faults, lithological contact fracture zone |
| 1043~1039.5 | Diabase | 4~12 | No water | Well-developed fissures and fragmented rock mass |
| 1039.5~1001 | Breccia, mylonite | 1~2 | Water seepage | F16 fault zone, extremely poor engineering geological conditions |
Table 2.
Mechanical parameters of intact rock properties and rock mass properties.
| Lithology | Intact Rock | Rock Mass | ||||
|---|---|---|---|---|---|---|
| RQD | ||||||
| Migmatite | 95.20 | 70.90 | 56.20 | 27.43 | 9.68 | 2.74 |
| Marble | 79.30 | 75.10 | 50.60 | 19.67 | 8.07 | 1.97 |
| Orebody | 107.80 | 79.30 | 42.10 | 21.30 | 5.92 | 2.13 |
| Fault | 35.50 | 25.00 | 22.00 | 4.09 | 0.79 | 0.41 |
Table 3.
Calibrated mechanical parameters in the UEDC Trigon model.
| Properties | Migmatite | Marble | Orebody | Fault |
|---|---|---|---|---|
| Blocks density (kg/m3) | 2740 | 2800 | 2970 | 2400 |
| Poisson’s ratio of blocks | 0.22 | 0.30 | 0.34 | 0.25 |
| Normal stiffness of contacts (GPa/m) | 4656 | 6562 | 6121 | 860 |
| Shear stiffness of contacts (GPa/m) | 1862 | 2625 | 2448 | 344 |
| Contact cohesion (MPa) | 5.6 | 2.8 | 1.2 | 0.5 |
| Contact friction angle (°) | 30 | 34 | 34 | 30 |
| Contact tensile strength (MPa) | 1.0 | 0.6 | 0.4 | 0.05 |
Table 4.
Physical mechanical parameters obtained by fitting.
| Lithology | Young’s Modulus (GPa) | Compressive Strength (MPa) | ||||
|---|---|---|---|---|---|---|
| Target | Calibrated | Error (%) | Target | Calibrated | Error (%) | |
| Migmatite | 9.68 | 10.12 | 4.5 | 27.43 | 27.60 | 0.62 |
| Marble | 8.07 | 7.75 | 3.9 | 19.67 | 19.46 | 1.1 |
| Orebody | 5.92 | 5.6 | 5.4 | 21.3 | 21.23 | 0.33 |
| Fault | 0.79 | 0.76 | 3.7 | 4.09 | 4.12 | 0.73 |
Table 5.
Level and mining sequence of the ore body in the model.
| No. | Level of Mine | Mining Sequence |
|---|---|---|
| I | 1300 level | Stage 1: mining I |
| II | 1250 level | Stage 2: mining II and backfill I |
| III | 1200 level | Stage 3: mining III and backfill II |
| IV | 1150 level | Stage 4: mining IV and backfill III |
| V | 1100 level | Stage 5: mining V and VII, backfill IV keep pillar |
| VI | 1000 pillar | |
| VII | 950 level |
© 2020 by the authors. Licensee MDPI, Basel, Switzerland. This article is an open access article distributed under the terms and conditions of the Creative Commons Attribution (CC BY) license (http://creativecommons.org/licenses/by/4.0/).
Share and Cite
MDPI and ACS Style
Sun, Q.; Ma, F.; Guo, J.; Li, G.; Feng, X. Deformation Failure Mechanism of Deep Vertical Shaft in Jinchuan Mining Area. Sustainability 2020, 12, 2226. https://0-doi-org.brum.beds.ac.uk/10.3390/su12062226
AMA Style
Sun Q, Ma F, Guo J, Li G, Feng X. Deformation Failure Mechanism of Deep Vertical Shaft in Jinchuan Mining Area. Sustainability. 2020; 12(6):2226. https://0-doi-org.brum.beds.ac.uk/10.3390/su12062226
Chicago/Turabian StyleSun, Qihao, Fengshan Ma, Jie Guo, Guang Li, and Xuelei Feng. 2020. "Deformation Failure Mechanism of Deep Vertical Shaft in Jinchuan Mining Area" Sustainability 12, no. 6: 2226. https://0-doi-org.brum.beds.ac.uk/10.3390/su12062226
Note that from the first issue of 2016, this journal uses article numbers instead of page numbers. See further details here.