Measurement and Convergence Analysis of Inclusive Green Growth in the Yangtze River Economic Belt Cities

1
School of Economy, Fujian Normal University, Fuzhou 350117, China
2
School of Marxism, Fujian Normal University, Fuzhou 350117, China
*
Author to whom correspondence should be addressed.
Sustainability 2020, 12(6), 2356; https://0-doi-org.brum.beds.ac.uk/10.3390/su12062356
Submission received: 9 February 2020
/
Revised: 4 March 2020
/
Accepted: 16 March 2020
/
Published: 18 March 2020
Abstract
:The inclusive green growth (IGG) model is an important tool to promote the construction of an urban ecological civilization and promote sustainable and green development, but China’s related research is still in its infancy. Targeting the problem of cross-regional research on technology set differences, this study proposes a method of combining the super-efficiency slack-based measure model and the Metafrontier Malmquist–Luenberger index to measure the IGG of 108 cities in the Yangtze River Economic Belt (YREB), and analyzes their convergence. Earlier research showed that, under the metafrontier, the upstream cities in the YREB have the highest level of technological efficiency, followed by the downstream and the midstream cities, while the midstream cities of the group frontier have the highest technological efficiency. The main source of China’s IGG is technological progress. The YREB has obvious σ-convergence characteristics overall and in the downstream cities, and absolute β-convergence characteristics both overall and in three basins. This research has significance as a reference for the gradual improvement of the IGG of cities in the YREB, and ultimately their overall coordinated development.
1. Introduction
Since the “green economy in the context of sustainable development and poverty eradication” was proposed by the United Nations Conference on sustainable development in 2012, the development concept of inclusive green growth (IGG) has attracted considerable worldwide attention [1]. The World Bank released “Inclusive Green Growth: The Road to Sustainable Development” in May 2012. The report states that inclusive, efficient and affordable green growth is essential for future economic development [2]. At the Rio+20 summit held in June, the concept of inclusive green growth was officially put forward. Herman Daly put forward a more accurate conception of sustainable development, that is, degrowth development [3]. This requires the flow of growth without exceeding the capacity of environmental regeneration and absorption. After the United Nations (UN) announced new sustainable development goals in 2016, several countries began adopting IGG as one of their development strategies. Research from both international organizations and individual researchers shows that IGG requires sustainable, inclusive and eco-friendly economic growth. It is an organic combination of two development concepts, namely green growth (GG) and inclusive growth (IG) [4]. GG is a concept that emphasizes both environmental protection and climate change mitigation. The concept of "green growth" was first proposed by the Economic and Social Commission for Asia and the Pacific at the United Nations Economic and Social Commission for Asia and the Pacific Conference in 2005 [5]. It emphasizes economic growth while taking into account the protection of resources and environment and mitigation of climate change. ESCAP regards "green growth" as one of the economic paradigms of environmentally sustainable development. The "green economy" proposed by the United Nations Environment Programme focuses more on the sustainable development of the economy, the sustainable use of natural resources and the continuous improvement of quality of life [6]. The Organization for Economic Cooperation and Development [7] believes that GG can help us mitigate climate change, environmental pollution and biodiversity loss, and make sustainable use of natural resources. On the other hand, IG is a concept embracing equal opportunities, social equity and sharing of benefits. Sugden believes that inclusive economic growth emphasizes rapid and sustainable growth, which can create, expand, and provide more access to economic opportunities, so that all members of society can participate in and share the economic growth [8]. Both GG and IG concepts focus commonly on the sustainability of economic growth. GG pays more attention to the coordination between economic growth and environmental resources, while IG considers the overall coordination between economic growth and social development. The integration of these two concepts created the concept of IGG, which can be defined as: a sustainable development mode, which can achieve economic growth, social equality, welfare, sharing of benefits, energy conservation and environmental protection, as well as comprehensive coordination of economic, social and environmental resources.
After 40 years of economic reform and “opening up” to the world, China’s economy has made remarkable progress. Its total economic volume has increased from 365 billion yuan in 1978 to 90.03 trillion yuan in 2018, with an average annual growth rate of 9.6%. According to data from the World Monetary Fund, China’s GDP surpassed Japan’s in 2010, and it has since been the world’s second largest economy after the United States. However, in recent years, it has entered a stage in a downward cycle because of the shift in economic growth. In this stage, problems such as low quality and efficiency of economic development, lack of social equality and widening income gap, depletion of natural resources and deterioration of ecological environment have become increasingly prominent [9]. Tim Jackson mentioned carbon emissions and the best values to be achieved in the future. This so-called economic growth aims to reduce prices and stimulate consumers to buy more goods, which is also a core aggravator of environmental problems [10]. There are a lot of products which provide repetitive functions and icing on the cake in our life, which is not a revolutionary change to promote economic growth. It is just an unequal investment that consumes a lot of natural resources for GDP. In the hope of common prosperity and lasting prosperity, we often choose to sacrifice the environment. This is a vicious circle where we spend a lot of money in the economy on "lowering prices to stimulate consumers to buy more goods", but not enough on rainforest or climate improvement. The 19th National Congress of the Communist Party of China attributed these problems to the contradiction of unbalanced and inadequate development, which is rooted in the lack of “inclusiveness” and “greenization” of the traditional economic growth mode. The central economic working conference held in December 2019 stressed that “they will unswervingly implement the new development concept of innovation, coordination, greenness, openness and sharing, and promote high-quality development.” Therefore, maintaining sustained economic growth while ensuring conservation of China’s natural environmental resources, social equality and justice, and transforming the mode of economic growth from extensive high-speed expansion to IGG, will become the top priority for China’s economic and social development during the 14th Five Year Plan and in the future.
The Yangtze River Economic Belt (YREB) covers 11 provinces (cities) including Shanghai, Jiangsu, Zhejiang, Anhui, Jiangxi, Hubei, Hunan, Chongqing, Sichuan, Yunnan and Guizhou, spanning an area of 2.05 million square kilometers. It has a population of 600 million, contributing to approximately 45% of the country’s GDP, and has several unique advantages and a huge potential for development. Over the last 40 years, this region has become one of the most powerful and strategic supporting regions in China, owing to influence of the economic reforms. It is also an important juncture of “one belt and one road” and plays a decisive role in the development of the country. In March 2016, when Xi Jinping passed the “Outline of the YREB Development Plan”, he highlighted that: “to promote the development of the YREB, the concept of IGG should be advanced, adhering to ecological priority, green development, and prioritizing ecological environment protection. For this purpose, all economic activities involving the Yangtze river must be based on the premise of not destroying the ecological environment”. Therefore, as one of the emerging growth poles with the highest potential in China, enhancing the level of IGG in the region has become the key to promoting high-quality development [11].
This study aims to address the following issues. First, to build a scientific and reasonable evaluation index system for IGG in the YREB. Second, to solve the problem of the distortion of IGG levels and efficiency due to technological heterogeneity between different regions. Third, to study the convergence of the differences in IGG level among the three basins of the YREB. Empirical research on these issues is not only conducive to observing and grasping the current state of green and inclusive economic growth in the process of transformation of China’s development mode, but also provides a new perspective for understanding and guiding IGG to promote high-quality economic development.
The remainder of this paper is organized as follows. Section 2 proposes a literature review focused on IGG. Section 3 introduces the IGG measurement and convergence analysis methods and formulates an evaluation index system. Section 4 measures the efficiency and growth levels of the prefecture-level cities and analyzes the convergence of the evolution trend of the differences in IGG for each of the regions in YREB. Section 5 puts forward relevant policy suggestions based on the research conclusions.
2. Definition of Inclusive Green Growth (IGG)
The natural ecosystem is the material basis for human survival and development. The sustainable development of human society can only be realized in the range of the carrying capacity of the ecosystem [12]. Wackernagel and Rees first proposed the concept of ecological footprint. This is maintaining the regional area which can meet the survival needs of a person, a region, a country, or which can accommodate the waste discharged by human beings with biological productivity [13]. The ecological footprint model is a research method that can use specific biophysical indicators to measure whether human development is in the range of ecosystem carrying capacity. This method provides an overall limit for inclusive green growth [14]. After the concept of IGG was put forward for the first time after the Rio+20 summit in 2012, many countries began adopting it as the core of their development strategies, while several researchers began studying it from different perspectives. IGG can be divided into three aspects: GG, IG and IGG [15,16,17].
Many researchers believe that the purpose of GG is to ensure economic growth while ensuring resource conservation and environmental friendliness, thereby achieving a win-win situation between economy and environment. The OECD defined GG as a way of sustainably using natural resources that can alleviate climate change and environmental pollution [7]. Lane believes that green growth is a remedial measure to revitalize the struggling global economy after the financial crisis in 2008, focusing on investment in environmental resources, ecosystem services and the construction of "natural infrastructure", such as forests, water bodies and biodiversity [18]. The definition of green growth by Quaas and Smulders have two aspects: on the one hand, environmental pollution decreases with the passage of time, which can not only increase social welfare, but also achieve the Pareto optimal allocation of resources; on the other hand, it can moderately relax the strict constraints on environmental pollution and resource use for the short-term green growth dominated by economic development [19]. Dinda suggested that GG emphasizes the coordinated development of both economy and environment, and advocates the reduction of exhaust gas and waste emissions, the improvement of resource utilization efficiency, and the protection of biodiversity [20]. Wang and Shao suggested that GG is a new development mode with low resource consumption rates and improved social welfare [21].
IG is put forward to reduce the widespread income gap, social inequality and low welfare/livelihood in developing countries. Its purpose is to combine economic growth with social equality and welfare/livelihood, so that the fruits of economic development can be shared by everyone. The term "inclusive growth" first appeared in the report “Inclusive Growth toward a Prosperous Asia: Policy Implications”. The Asian Development Bank defined inclusive growth as ensuring equal opportunities while maintaining rapid and sustainable economic growth, and ensuring more people to participate in and benefit from economic development by reducing and eliminating inequality of opportunity [22]. Subsequently, in Strategy 2010, inclusive growth was put at the top of three goals, and two key points of realizing inclusive growth strategy were put forward: first, high-speed and effective economic growth to create a wide range of opportunities; second, to enable the majority of social members to get opportunities to participate in economic activities and reasonably share from economic development [23]. Ali and Son defined IG from the perspective of equal opportunity as a growth mode that enables all sectors of society, especially the lower classes, to have equal access to employment opportunities [24]. Rauniyar and Kanbur interpreted IG as sharing the benefits from economic development among all the people, especially the poor [25]. Sugden integrated these two views, and defined IG as the state in which economic development requires the participation of all the people, who then share its benefits [8]. Overall, IG adheres to the principles of common development of economic growth, fairness and justice, equal opportunities and livelihood, where the production process and results are shared by all the people [26].
The World Bank defined IGG as a concept of “sustainable development economics”, emphasizing that sustainable development needs GG and IG [2]. Inclusive and environmentally friendly IGG is an important way to achieve sustainable development. Sterner and Damon suggested that IGG emphasizes the balance between growth, environment and inclusiveness with short-term and long-term social and environmental costs and benefits. Although it helps in improving the welfare of current and future generations, there is more room for synergizing with the overall goal of social welfare [27]. Winters defined IGG as “the ability to use natural resources cleanly and efficiently to control the impact of pollution on the environment, understanding its role in environmental management and its ability to fight and prevent natural disasters, with a resilient but inclusive growth.” [28] Bouma and Berkhout proposed comprehensive measures for inclusive green growth in the Netherlands, including sustainable trade and investment policies, sustainable use of natural resources, food safety and water supply guarantees, sustainable development of society, and innovation and sharing of environmental technology, social peace and security, good government operation mechanism and legal provisions [29].
With the development of the YREB strategy into a national strategy, a large number of scholars have studied the YREB as a research object. Wang et al. explored the impact of urban center status on green innovation efficiency based on panel data of 106 cities in the YREB. They considered that urban center and green innovation efficiency had an inverted-U-shaped relationship [30]. The impact curve of green innovation efficiency is also inverted-U-shaped, and cities with high urban centrality attract a large number of migrants from cities with low centrality. Mao and Jiang established an index system reflecting provincial technological innovation ability, and the results indicated that provincial technological innovation ability in the YREB largely showed a ladder-like distribution pattern and a center–periphery spatial structure [31]. They believed that the YREB should break the current severely polarized spatial structure and construct the spatial correlation pattern of coordinated development. Tang et al. pointed out that per-capita GDP and energy intensity have the largest impact on the increase of carbon emissions, and the urbanization rate has the largest inhibitory effect on carbon emissions in the YREB [32]. Gui et al. evaluated the urbanization efficiency of 110 cities in the YREB and further evaluated the spatial correlation characteristics of these efficiency values [33]. The results indicated a positive spatial correlation between the urbanization efficiency of cities and annual increments in agglomeration level.
Overall, GG considers the welfare of future generations, while IG considers the welfare of contemporary people [34]. However, the concepts of inclusive development and GG are lacking in most developing countries. Therefore, it is not fair to emphasize GG or IG alone, which cannot meet the needs of sustainable development in most countries. To achieve sustainable development, pursuing both GG and IG is indispensable [35]. Albagoury further analyzed that GG is not necessarily inclusive, and although its results may be conducive to improving the lives of the poor, it may also make the poor suffer more injustice [36]. As Resnick et al. pointed out, the poor may be on the losing end, depending on whether the special policies formulated by the government take the interests of the poor into consideration and ensure that they can access all the benefits due to the shift to GG strategy equally [37]. It must be acknowledged that the previously cited literature revealed the internal unity of economic growth, inclusiveness and greenness, and defines the connotation and characteristics of IGG, which is of great positive significance for improving the welfare of contemporary and future generations. However, it must be noted that that there is no universally accepted definition of IGG. Researchers across the world generally understand IGG as just “GG” with additional considerations for equal economic opportunities, though there are differences in opinion. Furthermore, because no universally recognized indicator systems or methods are available for the measurement of IGG, several contradictory results are derived due to the differences in parameter selection and measurement methods.
This study considers IGG as not only a narrow economic growth mode aimed at fighting poverty and improving social equality, but an evolution from “extensive total expansion” to “intensive and sustainable development”, while maintaining the balance between economic growth, social equality and ecological civilization. The marginal contributions of this study are as follows: (1) from the perspective of green development, this study researched the IGG of the YREB region and attempted to define an evaluation index system in the three dimensions of sustainability of economic growth, social inclusion and protection of the ecological environment. (2) The GG of bread capacity in prefecture level cities was studied from the perspective of efficiency, and a metafrontier analysis framework was proposed, which combines the super-efficiency slack-based measure (SBM) model with the Malmquist–Luenberger index. This framework can accurately measure the efficiency and growth level of IGG in prefecture-level cities of the YREB, and can be used to determine the sources of IGG growth through decomposition.
This study is structured as follows. Section 3 introduces the IGG measurement and convergence analysis methods and formulates an evaluation index system. Section 4 measures the efficiency and growth levels of the prefecture-level cities and analyzes the convergence of the evolution trend of the differences in IGG for each of the regions in YREB. Section 5 puts forward relevant policy suggestions based on the research conclusions.
3. Research Methods and Index System of IGG
3.1. Brief Introduction of Measurement Method
Tone put forward an SBM model that feeds the slack inputs and outputs directly into the objective function to solve the variable slackness [38]. Tone found that traditional SBM models were not be able to properly evaluate when multiple decision-making units (DMUs) were effective at the same time during modeling [39]. Based on the definition of IGG, this study selected a super-efficiency SBM model that also considers the unexpected output. Assuming that each DMU has N input variables, M expected outputs and I unexpected outputs, the model can be expressed mathematically as:
where represents the input, expected output and unexpected output of the DMU at time , represents the relaxation vector of the input, expected output and unexpected output, and is the density variable, i.e., the weight of each cross-sectional observation.
The actual IGG of each city cannot be accurately measured if a single shared production frontier is constructed for all DMUs, as all 108 cities in the YREB are different in aspects of economic development level and degree of opening up, industrial structure, social environment, and resource endowment. To cope with these problems, Hayami and Ruttan proposed the conceptual framework of a metafrontier production function that can measure efficiencies achieved using different production technology sets [40]. Battese and Rao further classified the DMUs into different groups following certain standards, defined the metafrontier of all DMUs and the group frontier of each DMU group using the random frontier analysis method, and estimated technical efficiencies of the metafrontier and the group frontier [41]. Rao et al. suggested that the metafrontier may not be able to envelop the group frontier, as stochastic frontier analysis (SFA) assumes that all DMUs have the potential to reach the same technical level [42]. Thus, O’Donnell et al. replaced the SFA approach with data envelopment methods and established an analytical framework that constructs the metafrontier and the group frontier using data envelopment analysis (DEA), which effectively solved the earlier problem [43].
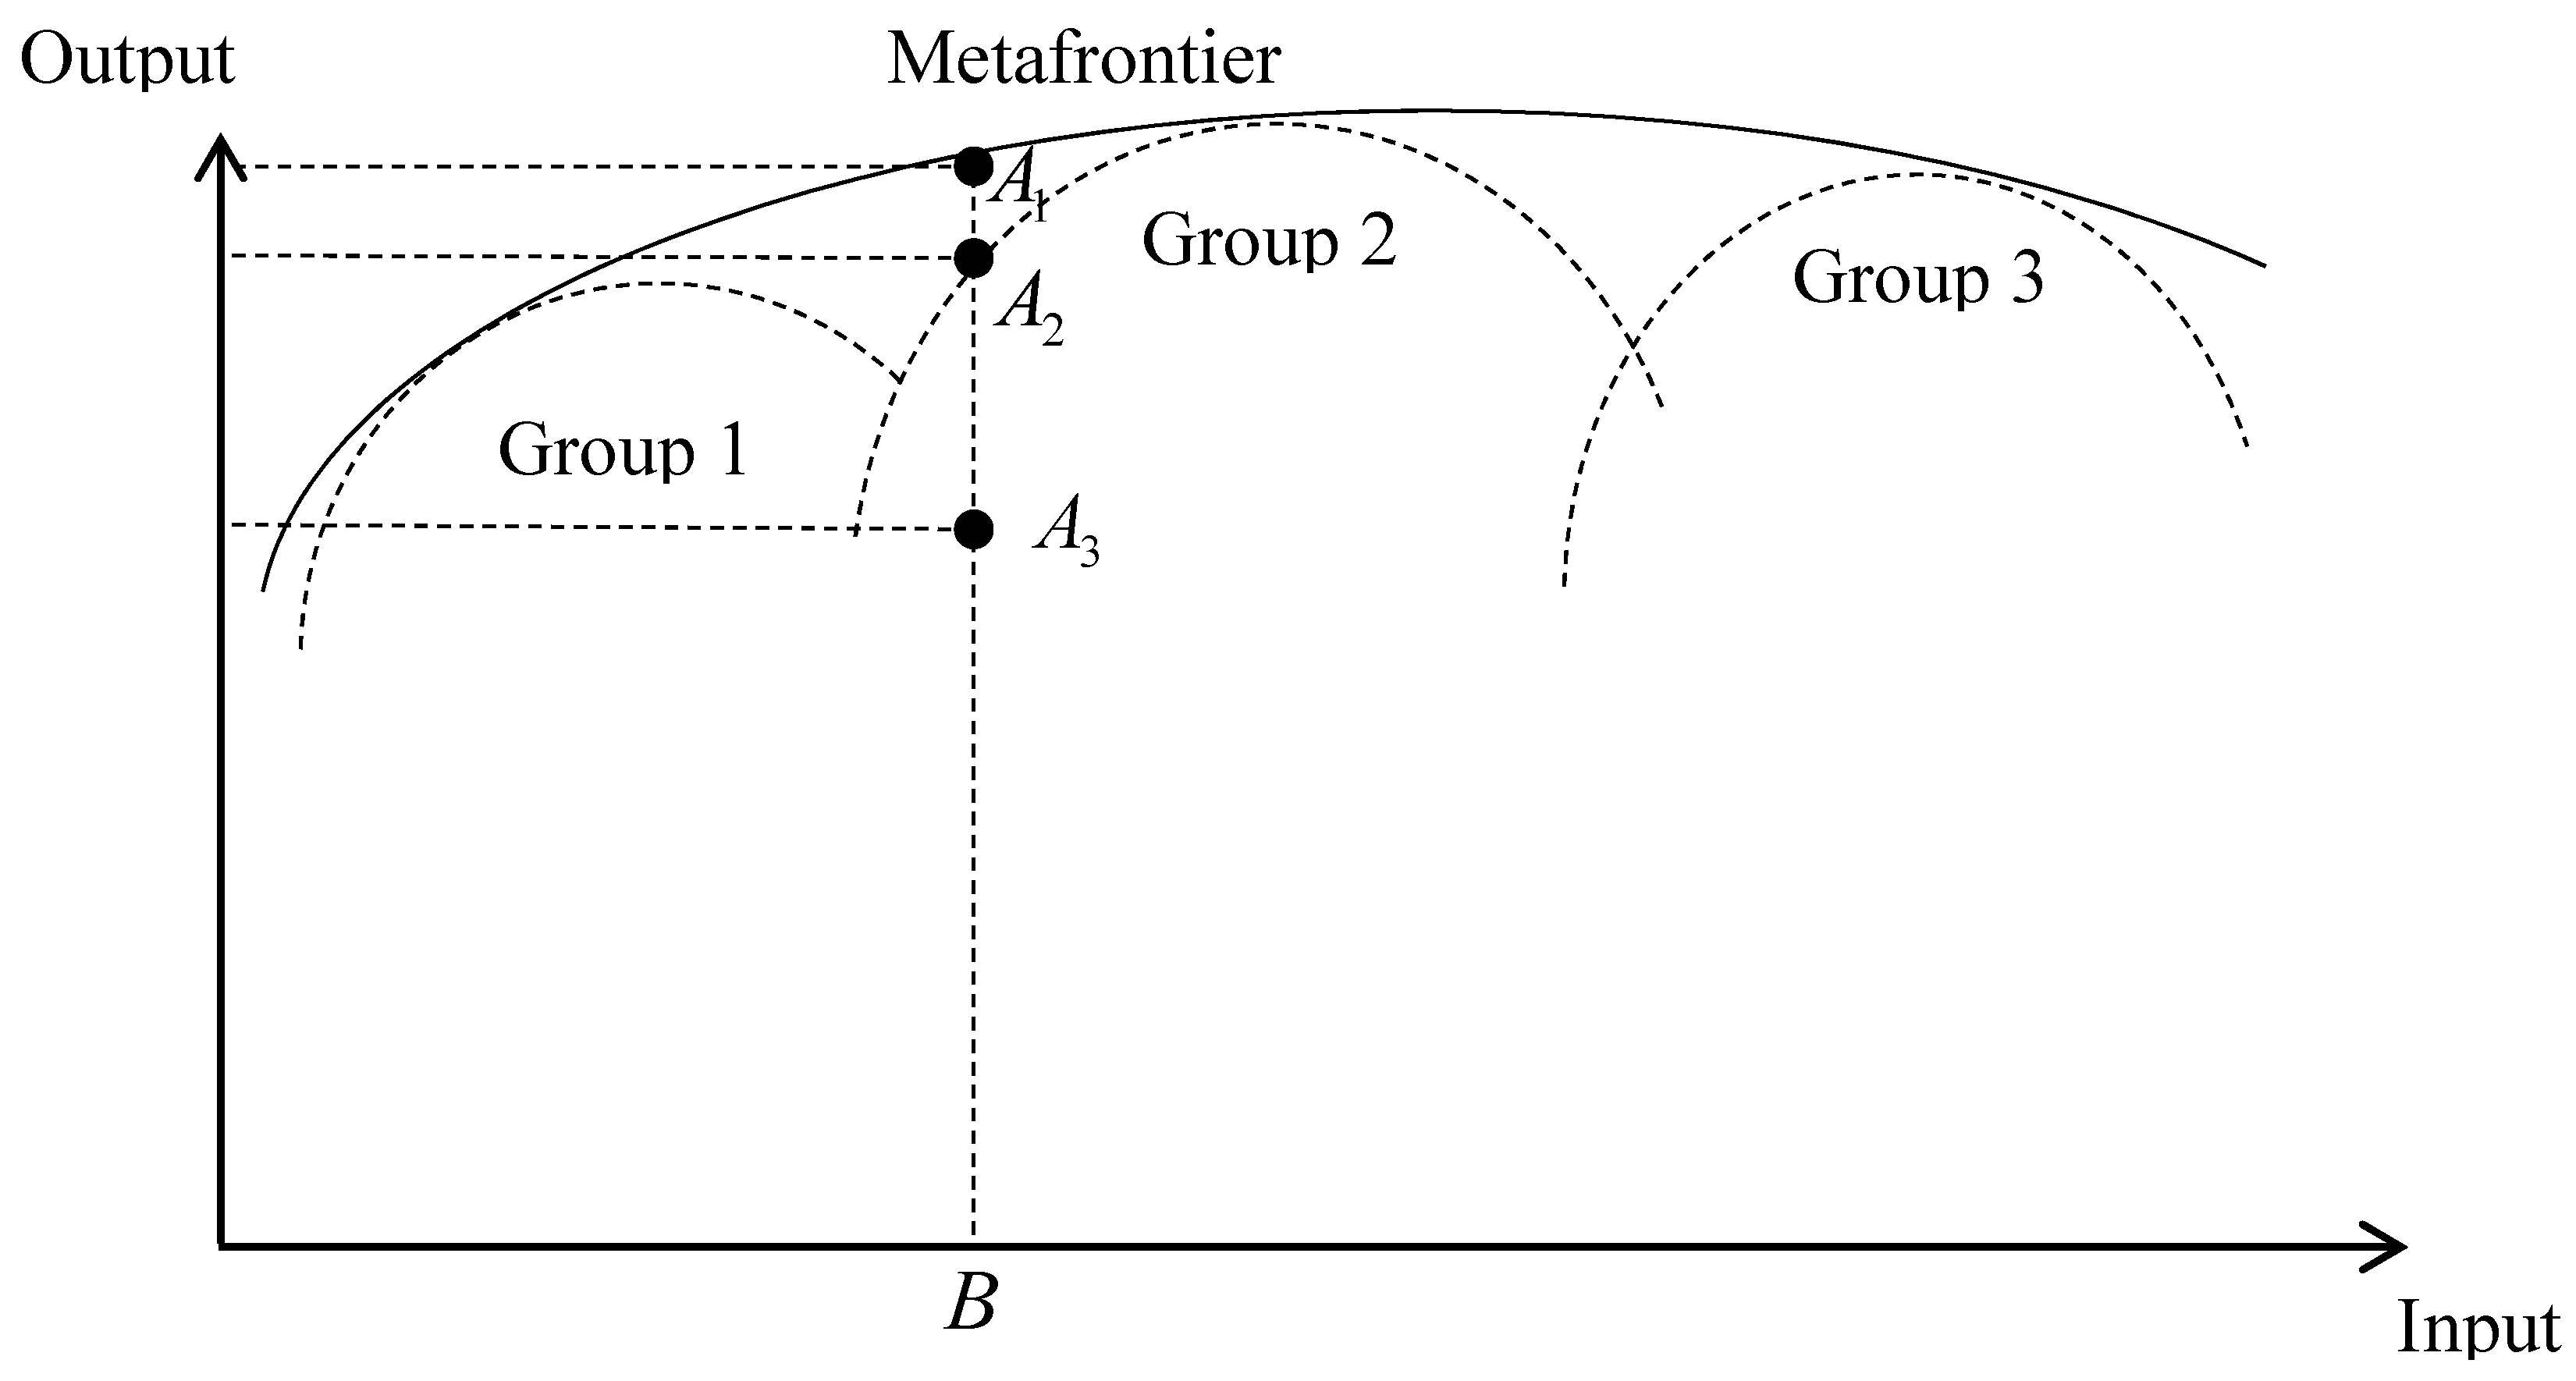
According to the meta frontier model of O’Donnell et al. (2008), we take a system of single input and output and assume that DMUs are divided into three groups, labeled 1, 2, and 3. In this study, we regard each city in the respective three regions (upstream, midstream, downstream) as a group [43]. Figure 1 expresses the method of calculating the input and output combination A3 of one DMU in group 2, with the consideration of an unexpected output. The equation for calculating the technology gap ratio (TGR) is:
where group technical efficiency (GTE) and meta technical efficiency (MTE) are equal to the directional distance functions of their respective production possibility sets. TGR reflects the deviation degree of actual output technical level from the metafrontier of the evaluated DMU and is used to measure the differences in technical efficiency of the same DMU in different frontiers. The closer the value of TGR is to one, the closer the actual production efficiency is to potential production efficiency, i.e., the higher the technical efficiency.
In terms of decomposition of the IGG level, applying the technique of Grosskopf, the Metafrontier Malmquist–Luenberger (MML) index was decomposed to form a group efficiency change index (GEC), group technical change index (GTC), pure technical catch-up (PTCU), and potential technical relative change (PTRC) [1]. The decomposition equation is as below:
PTCU > 1 implies that the difference between the actual technical production efficiency and the potential technical production efficiency is shrinking gradually, highlighting the technical catch-up, while PTRC < 1 implies that the group production frontier is catching up to the meta production frontier, which is otherwise hard to achieve.
3.2. Convergence Analysis Method
This study introduces σ-convergence and absolute β-convergence in order to test whether the IGGs of cities in the YREB have convergence characteristics. The former represents the stock levels, while the latter represents the incremental levels. First, we tested whether there was σ-convergence among the regions in YREB which can be expressed as:
where is the IGG level of the ith area at period t and N is the total number of areas. A decreasing σ over the years signifies σ convergence, while the converse signifies σ-divergence.
Absolute β-convergence represents the trend of areas with low IGG levels catching up with areas with high levels over time, with the IGG level of each area reaching the same stable value eventually. According to the research of Barro and Sala-i-Martin [1], the absolute β-convergence of regional IGG levels can be expressed as:
where and refer to the IGG levels of the ith area at periods t and t+T, respectively; a is a numerical constant; b is the coefficient of the base period level of IGG; and is a random error. If b is significantly negative, it means that the growth speed of the IGG level of each area is negatively related to its initial value, and provinces with low IGG levels tend to catch-up to cities with high levels, signifying absolute β-convergence. Otherwise, there is no absolute β-convergence. To fully utilize the sample data and create a time series measuring regression that shows continuity, this study assumed T = 1.
3.3. Construction of IGG Evaluation Index System in YREB Cities
According to the connotation of IGG, this study defines an index system considering the sustainability of economic growth, social inclusiveness and ecological environment protection. Taking into account the availability and comprehensiveness of data, the period of 2003 to 2016 was considered as the time span in this study. In addition, two types of indices were considered, input index and output index. The former includes capital input, labor input, and land and energy consumption, while the latter includes desirable output and undesirable output. The information on the specific indicators and their descriptions is given in Table 1. The relevant data was provisioned from the research data on all 108 cities from each year’s China City Statistical Yearbook and Local Statistical Bulletin. The forward (or backward) interpolation method was used to fill in any missing data. It must be noted that Tongren and Bijie cities of Guizhou Province were both established by the State Council in 2011, so they were not included in the observation sample. Table 2. provides the description of the 108 cities of the Yangtze River Economic Belt (YREB).
4. Empirical Analysis
4.1. Meta IGG Efficiency, Group IGG Efficiency and Technology Gap Ratio of YREB
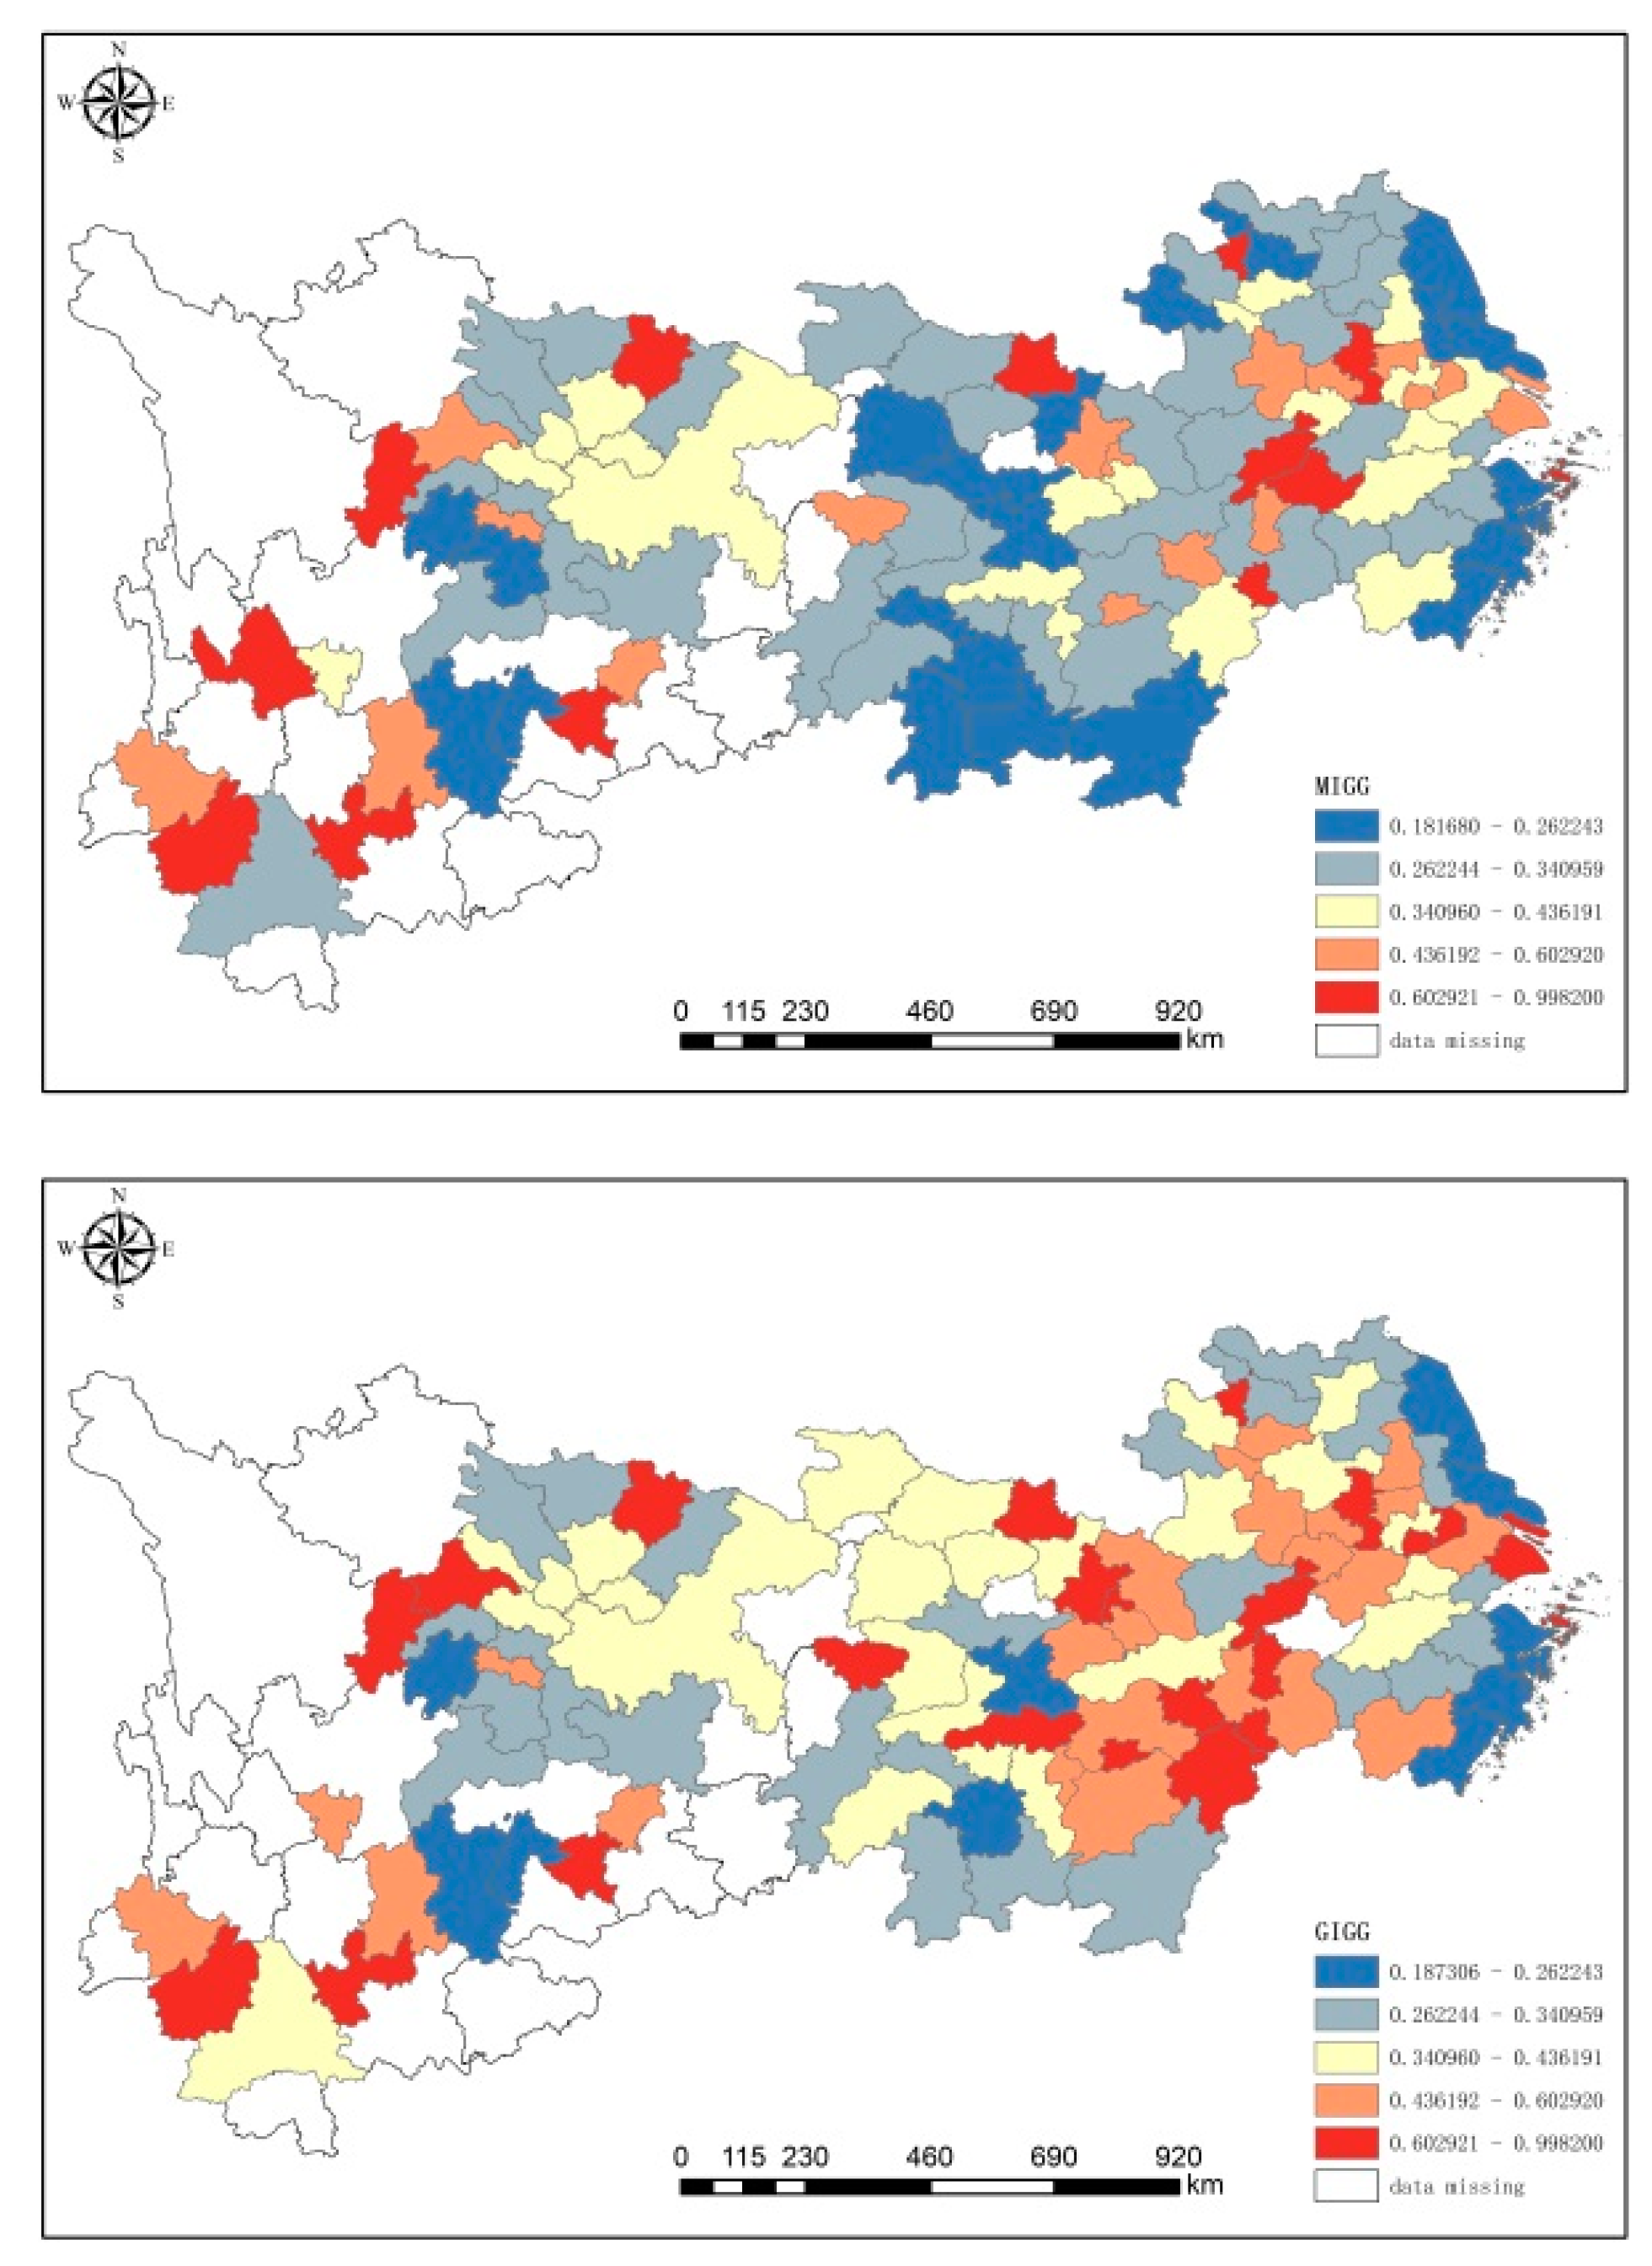
To compare the overall characteristics of IGG in the YREB at different frontier levels, the average IGG efficiencies of the 108 cities in the YREB during 2003–2016 were mapped using spatial statistics. As shown in Figure 2, the meta IGG (MIGG) and the group IGG (GIGG) efficiencies did not change much in the upstream region, suggesting that the actual technical efficiency under the front edge of the upstream city group is similar to the potential technical efficiency under the common front edge, i.e., the improvement space of the upstream cities’ IGG efficiency is not large. The MIGG efficiencies of the middle and downstream cities are significantly lower than GIGG efficiencies, indicating that the actual IGG efficiencies of the middle and downstream cities are higher. But if traditional methods were used to build the metafrontier, the conclusion that the IGG efficiency value was lower would be drawn, resulting in large deviations in the calculated results from the actual values.
As shown in Table 3, the upstream, the downstream and midstream regions are ranked from high to low correspondingly, according to the mean value of MIGG efficiencies in the YREB. Among them, the mean value of the upstream MIGG efficiencies was 0.4420, indicating that the upstream cities still have an improvement space of 55.8% under the potential technology level; this was 0.4143 for the downstream cities with 58.57% improvement space, and 0.3652 for the midstream cities with 63.48% improvement space. This indicates that the efficiency can still be improved if the potential metafrontier technology is used for production. In addition, the conclusions derived for different production frontiers in different basins were different. From the results of GIGG efficiency, the midstream cities have the highest average technical efficiency, followed by the downstream and upstream cities. This is contrary to the conclusion of building the metafrontier, highlighting that technology heterogeneity has a significant impact on the technology efficiency of different regions. During the research period of 2003–2016, the MIGG and GIGG efficiencies of the overall Yangtze river economic belt and the three basins showed an overall trend of improvement, reaching the maximum in 2016 irrespective of the metafrontier or the group frontier. The overall MIGG and GIGG efficiencies of the YREB have increased from 0.3747 and 0.4712, respectively, in 2003 to 0.6162 and 0.7352, respectively, in 2016, achieving significant progress.
The TGR of cities in the YREB reflects the close relation between the actual and the metafrontier technology levels. The greater the TGR, the higher the technical efficiency. From Table 4, it was concluded that in the three basins of the YREB, the average values of TGR of the upstream, the downstream and the midstream cities are correspondingly ranked highest to lowest, further proving the heterogeneity of production technology levels among cities in different basins. The TGR of the upstream region was 0.9462, indicating that the actual production efficiency can reach 94.62% of the potential production efficiency. Similarly, the actual production efficiency of the midstream region can reach 87.79% of the potential production efficiency, while it can reach 95.12% for the downstream region. The overall TGR of the YREB is 0.8584, which was higher than that of the midstream, but lower than that of the upstream and the downstream regions. Based on the dynamic trend of TGR in the three basins of the YREB, the TGR in the upstream region is higher than that in the middle and downstream regions in most years, indicating that the actual production efficiency in the upstream is more likely to reach the potential production efficiency in most cases, while the TGR in the downstream shows an obvious upward trend.
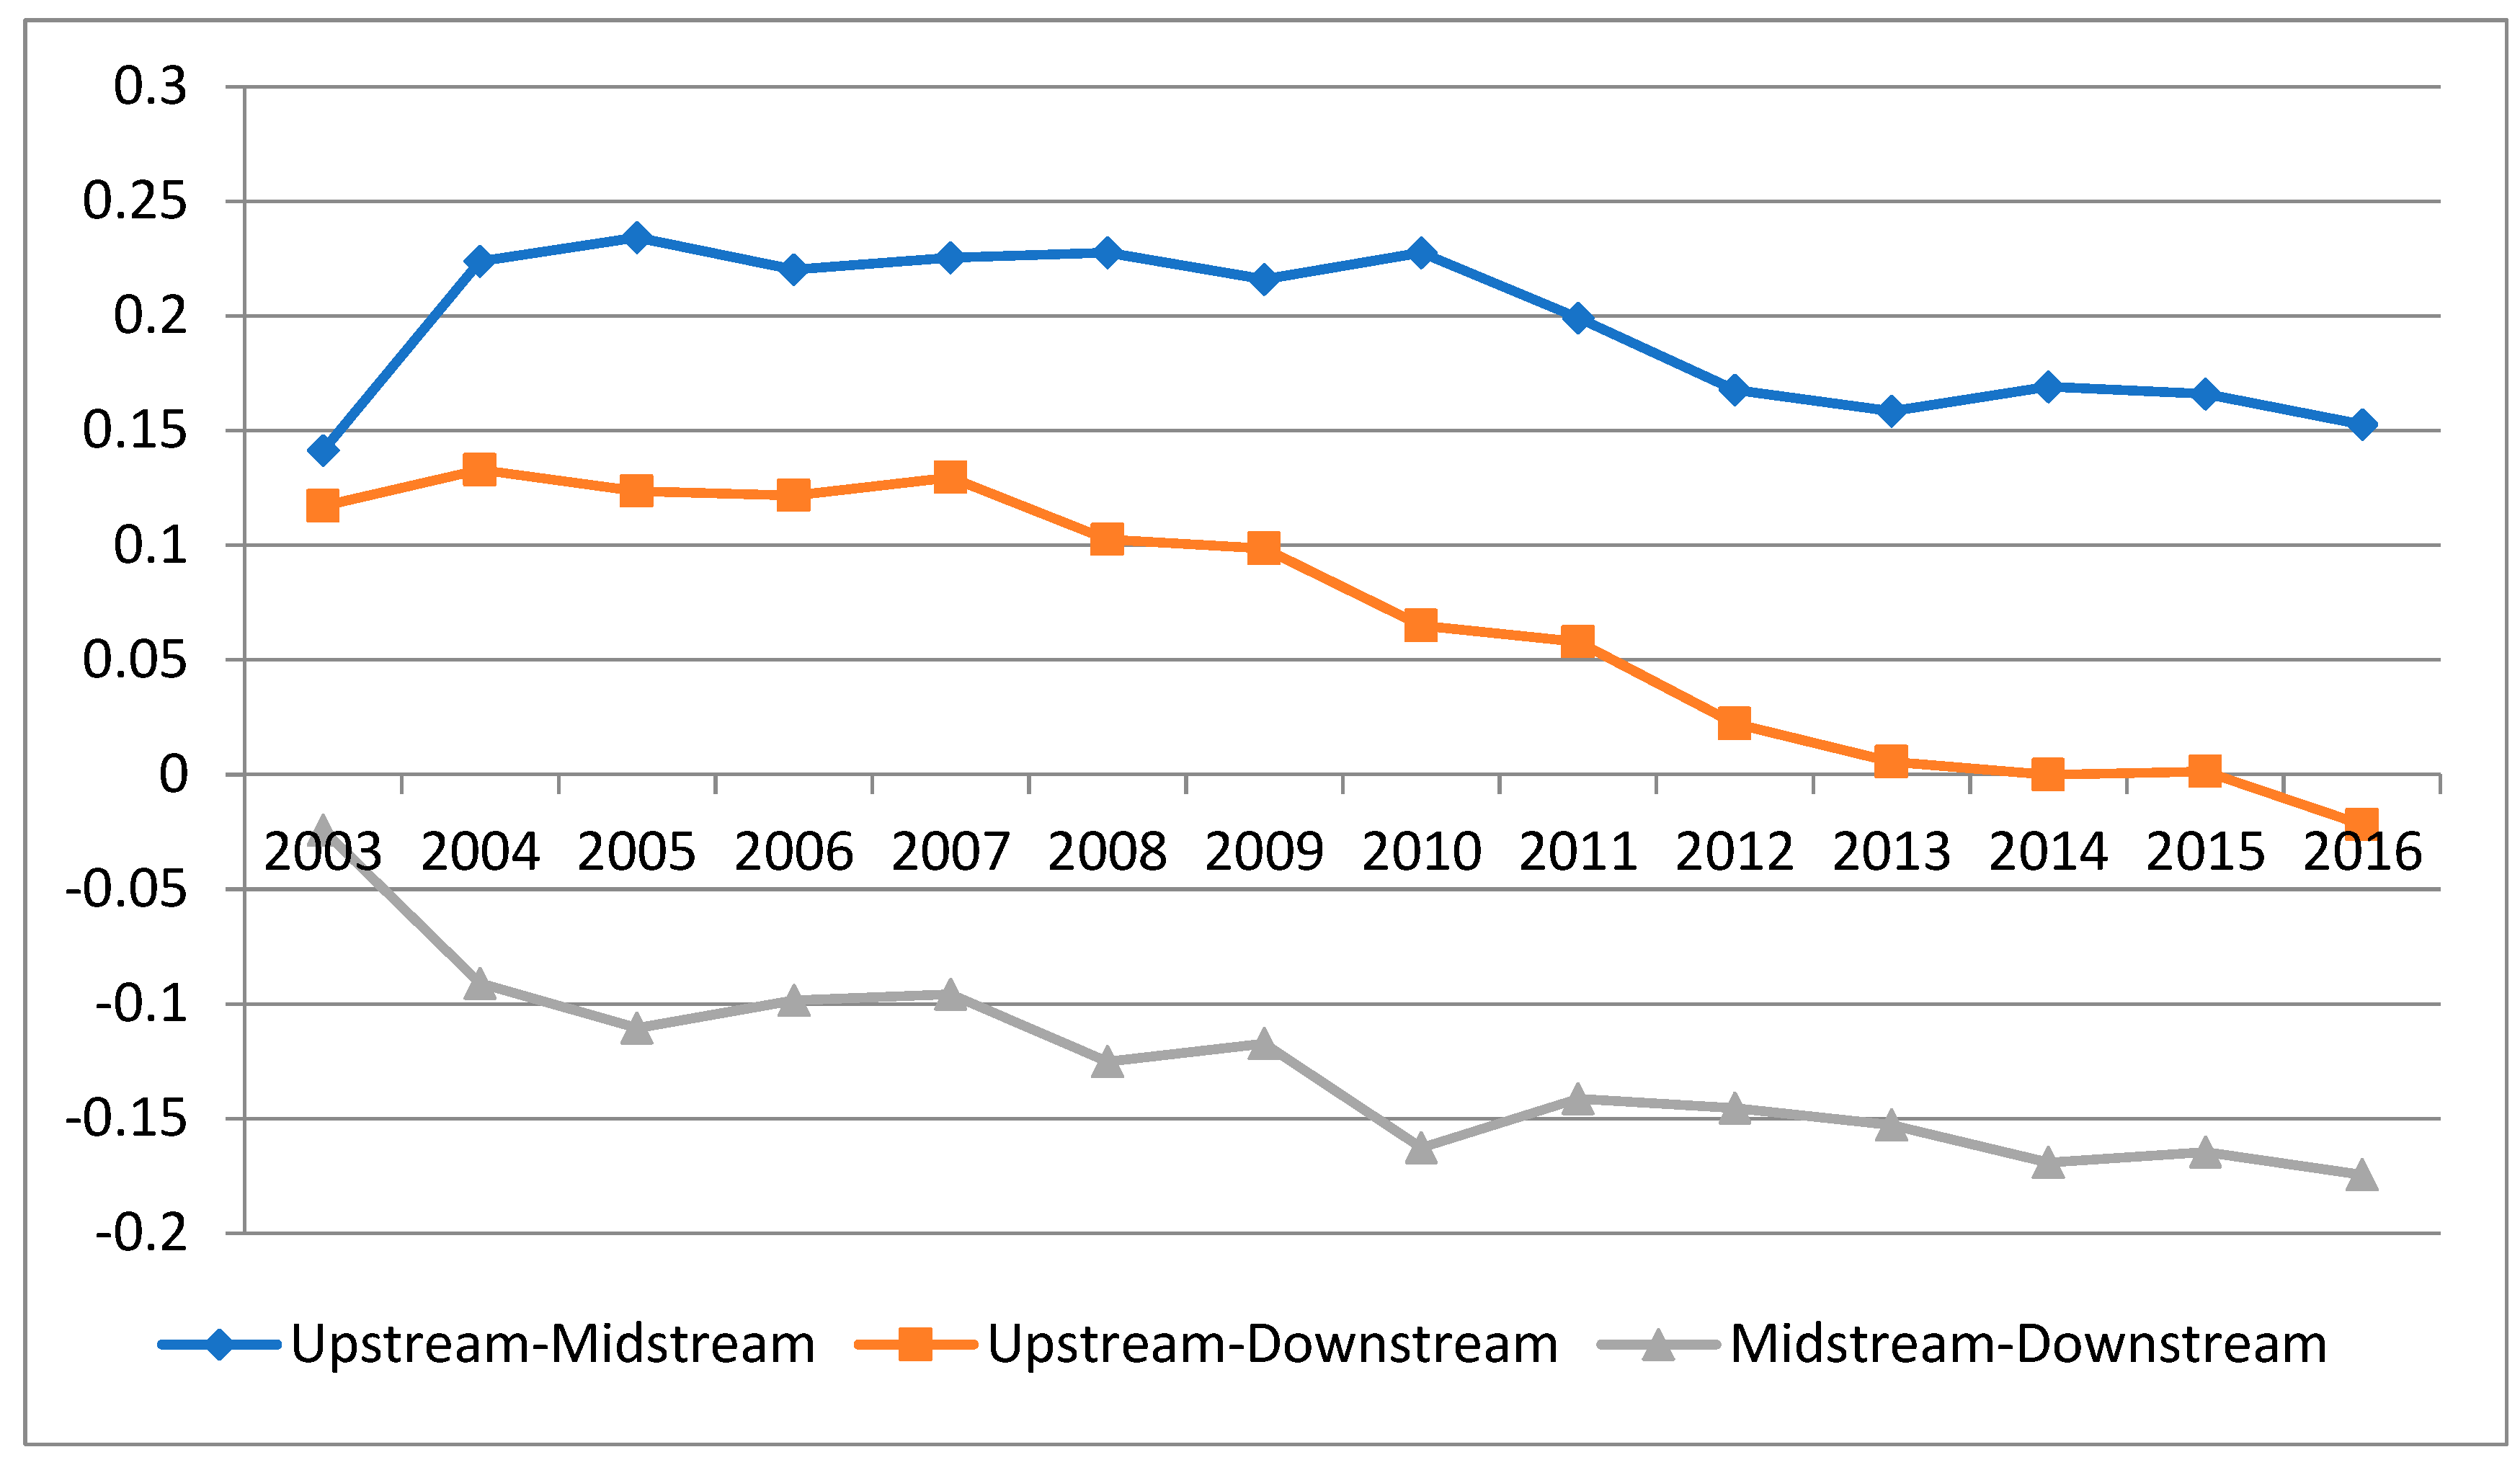
As shown in Figure 3, the TGR gap of the three basins in the YREB shows a trend of decreasing fluctuation. Before 2014, the difference of TGR between upstream and downstream regions was positive, and was shrinking. However, by 2014, the difference was negative, indicating that the actual technology level of the downstream region exceeded that of upstream region. The steady improvement in the efficiency of IGG might be due to the superior geographical location of the downstream region, the large degree of economic openness, the relatively advanced technology and management levels, the rich availability of funds and the ability to attract foreign investment and produce more talent. It is worth noting that the TGR gap between the midstream and the downstream regions is gradually widening. This is likely because of the relatively closed geographical location of the basin and a relatively backward level of economic development, blocking any technological advancements.
4.2. The Level of IGG in YREB and Its Sources
Table 4 shows the MML index, GML index and the average of their decomposition terms in the YREB and its upper, middle and downstream regions during 2003–2016. The MML/GML reflects the annual dynamic change of IGG under the metafrontier/group frontier. The IGG level in the downstream region was the highest, with an MML index reaching 1.0691, followed by the midstream region, with an MML index of 1.0488, and lastly the upstream region, with an MML index of 1.0480. The MML indices of the upper, middle and downstream regions of the YREB were greater than 1, indicating that the level of IGG in each region increased during the study period. From the perspective of technological progress and changes in technological efficiency, irrespective of the metafrontier or the group frontier, the technological progress and efficiency of the YREB and its upper, middle and downstream regions are all greater than one, which has a significant role in promoting the improvement of the IGG level in the YREB. The only exception was the average value of GEC in the downstream region, whose value was one, which does not significantly promote the improvement of GML. Among the growth sources of the overall IGG level of the YREB, MTC and GTC contributed 4.46% and 4.38% respectively, while MEC and GEC contributed only 1.03% and 0.97%, respectively, indicating that technological progress makes a more significant contribution to the overall IGG level of the YREB. Technological progress is determined as the source of improvement of the IGG levels, and technological efficiency therefore needs to be improved.
From the perspective of technology catch-up, the PTCU of the midstream region was higher than that of the upstream and downstream regions, suggesting that the cities in the midstream are the main driving forces promoting the overall development. As shown in Table 5, the actual production efficiency of the midstream is closest to the potential production efficiency of the metafrontier. Furthermore, the actual technical efficiency is catching up to the potential technical production efficiency, and the gap between them narrowed the fastest. From the perspective of the relative change in potential technology, the mean value of PTRC in the downstream region was ranked first, with a value of 1.090, while those of the upstream and midstream regions were less than one, indicating that the technical efficiency of the cities in the downstream of the YREB is higher, with the gap from metafrontier technologies being relatively small. The speed of advancement of group frontier to metafrontier was therefore slow, and is difficult to catch up with technology.
The mean value of PTRC in the midstream region of the Yangtze river is 0.9946, which was ranked last among the three regions in the YREB. This may be due to the weak capacity of the midstream region in terms of the sustainability of economic growth, social inclusiveness and ecological environment protection. The midstream cities still have great potential and space for technological progress though the technical level is relatively low.
4.3. Regional Convergence of the Level of IGG in YREB Cities
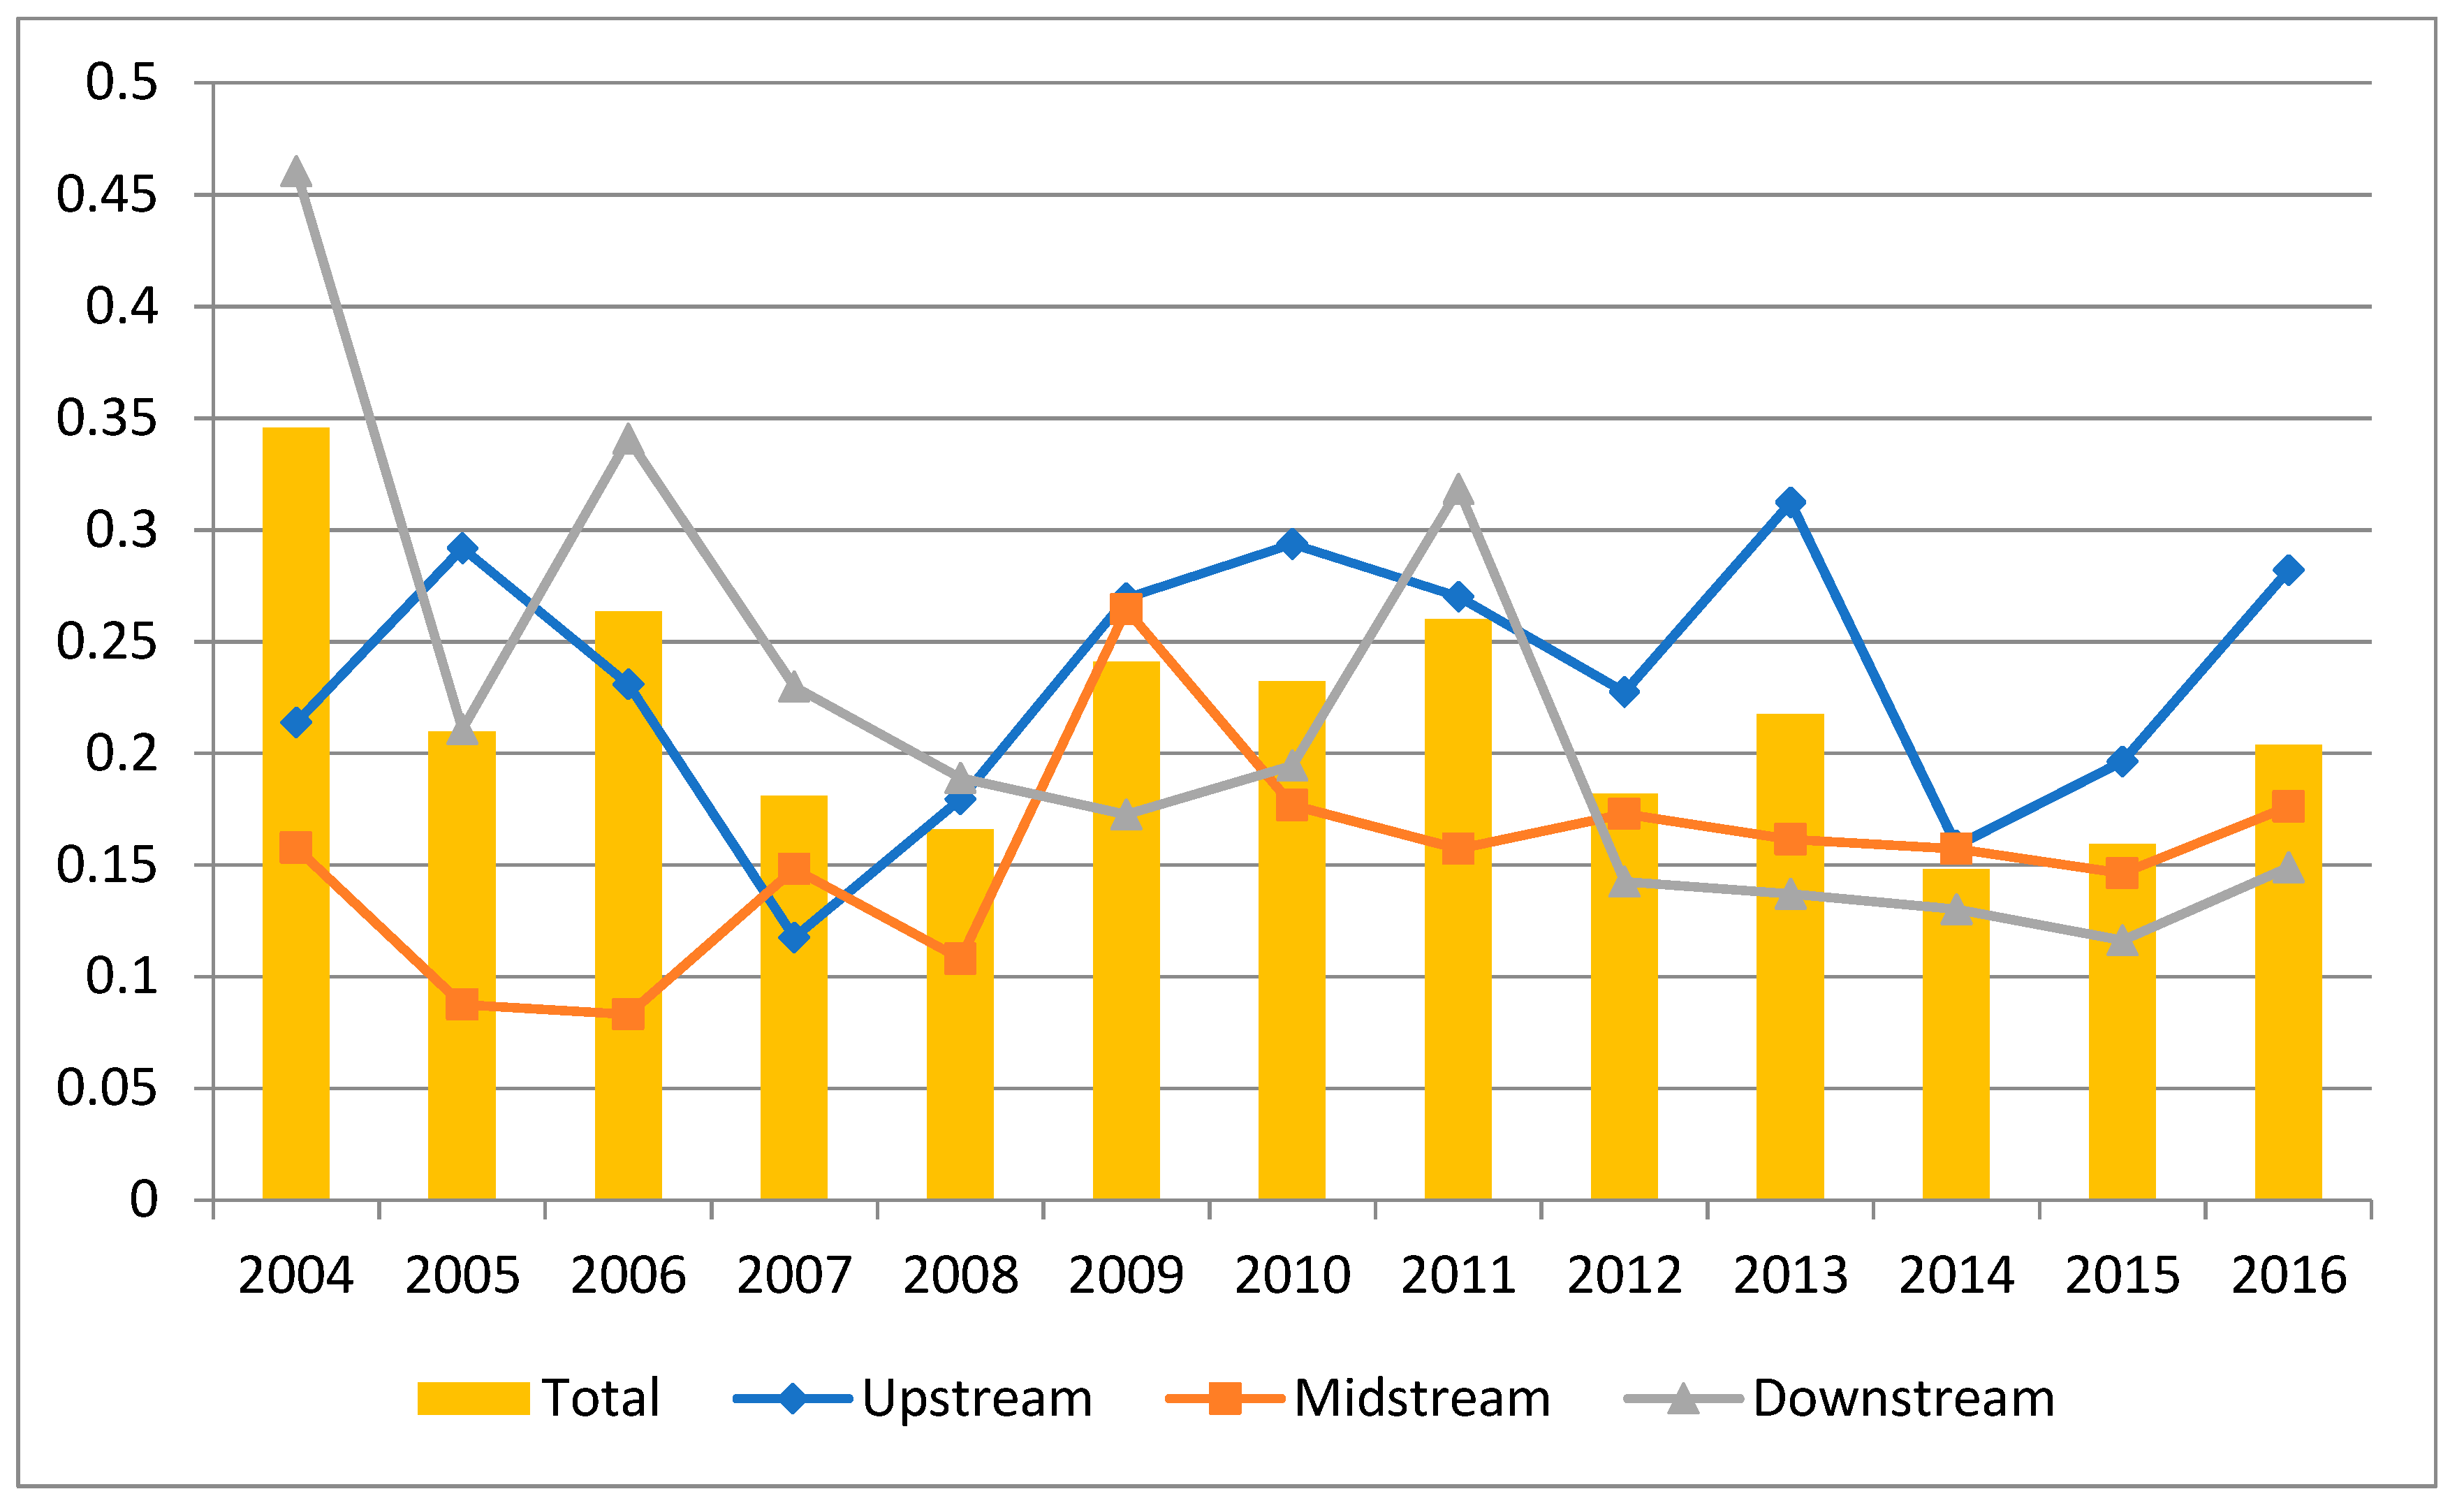
The evolution trend of the IGG σ values in the YREB is shown in Figure 4. It can be seen that the overall IGG level of the YREB showed obvious characteristics of σ convergence during the study period but showed variations in the convergence and divergence characteristics during different periods. Specifically, it shows the characteristics of σ convergence in 2004–2005, 2006–2008, 2009–2010, 2011–2012 and 2013–2014, while it shows divergent characteristics in 2005–2006, 2008–2009, 2010–2011, 2012–2013 and 2014–2016. During the study period, different regions showed different degrees of convergence, among which the cities in the upper and midstream regions showed no characteristics of σ convergence.
Table 6 shows the test results of absolute β convergence of the YREB as a whole and its upper, middle and lower basins. In this study, the Hausman test was used to select the β - convergence model, and its results showed that the fixed effect model should be selected. The test results of both the YREB as a whole and the three major basins passed the test at 1% significance level, i.e., the trend of absolute β convergence. Among them, the estimated value of the coefficient b of the absolute β convergence of the ensemble of the YREB is significantly negative, indicating that the initial level of IGG is inversely proportional to its growth rate. The ensemble of the YREB shows a tendency for absolute β convergence, and the level of IGG tends to reach a stable state. From the perspective of each river basin in the YREB, the levels of IGG in the upper, middle and downstream regions show a significant trend of absolute β convergence, indicating that cities with low IGG levels in each river basin exhibit a “catch-up” effect on cities with high level of IGG, and in the long run, these IGG levels will be stabilized.
5. Discussions and Conclusions
5.1. Discussions
First, the upstream cities/region performed the best, followed by the downstream and the midstream regions when ranked using the mean values of MIGG efficiencies in the three major basins of the YREB. In terms of the GIGG efficiency values of different production frontiers in different basins, the midstream cities have the highest average technical efficiency, followed by the downstream and the upstream cities, highlighting the significant influence of regional technical heterogeneity on technical efficiency. From the perspective of technology catch-up, midstream cities are the main driving force behind the overall development. In terms of the relative change in the potential technology, the technological efficiency of the downstream cities was relatively high, which was close to that of the metafrontier technology. The midstream region of the YREB was ranked the last among the three regions. According to Jin et al., in order to maximize the social and economic benefits and reduce the input of urban land resources to the greatest extent, the construction of ecological civilization in different areas of development varies [33]. The policies for different regions and cities in the YREB therefore should not be based on a single standard, but should explore the path of high-quality development of the YREB in accordance with local conditions, such as the development of their own economy, society and environment. Establishing a scientific long-term macro-control mechanism will help in promoting the high-quality development of the YREB.
Second, according to the improvement space and potential of production technology efficiency in the upper, middle and downstream regions of the YREB, the midstream region had the largest improvement space of efficiency when compared to the upper and downstream regions, whereas the earlier conclusion of building different production frontiers in different basins was the complete opposite. Based on the differences in the technology gap ratio in different basins, the TGR in the upstream region was the highest, followed by the downstream and the midstream regions. The TGR gap in the three basins of the YREB showed a fluctuating but decreasing trend. In 2014, the actual technology level of the downstream region surpassed that of the upstream region, and the efficiency of IGG steadily improved. The gap in the technical level between the midstream and upstream regions is growing, as is the case between the midstream and downstream regions. This conclusion is similar to the view on improving the efficiency of green innovation. Cities with higher centrality can attract a large number of immigrants from cities with lower centrality and improve the efficiency of green innovation [30]. However, the efficiency of green innovation in cities with lower centrality will decline due to the lack of talent. Therefore, the downstream cities should make rational use of their geographical advantages to speed up economic opening, attract more foreign investment and produce more talent. The cities in the upstream and midstream regions need to make full use of their resource endowment and make up for their shortcomings so that they can promote their IGG levels steadily with support from the higher production technology efficiency of the downstream cities.
Third, technological progress is the main source of improvements to the IGG level in the YREB. The current extensive production mode in China is the main reason for the slow development of IGG. Only by changing the current the production mode can we improve technical efficiency and promote the steady growth of IGG. Compared with technological progress, the improvement of technological efficiency has the definite advantages of producing a quick effect and being low cost. Maoand Jiang also believes that the technological innovation capacity of the YREB presents a trapezoidal distribution pattern to a large extent [31]. The provincial technological innovation capacity shows a significant spatial correlation. The provinces with similar levels are gathered together in space, and the provincial technological innovation capacity of the YREB shows an obvious central position. Therefore, it is of creative significance to explore how to reduce adverse factors in the process of technological efficiency improvement for improving the level of IGG in the YREB.
Fourth, the ensemble of the YREB and its downstream region had obvious characteristics of σ convergence, while the ensemble and the three major basins had obvious characteristics of absolute β convergence. Tang et al. believes that, as one of the "three major strategies" for China’s regional development, the YREB is under great pressure to reduce carbon dioxide emissions [32]. Therefore, all regions of the YREB should continue to adhere to the path of coordinated development, break the limitations of the division of administrative regions, strengthen the implementation of the unified management system of the YREB, promote full flow of resources and elements among the regions, and transfer the rich management experience and advanced technology level of the downstream region to the middle and upstream regions. Efforts should be made to narrow the gap between the three river basins, so as to steadily improve the IGG levels of all river basins and cities in the YREB to achieve overall coordinated development.
5.2. Conclusions
Considering the sustainability of economic growth, social inclusiveness and ecological environment protection, and the combination of the super-efficiency SBM model and Malmquist–Luenberger index, this study used the metafrontier production function analysis framework for cross regional research to measure IGG and its decomposition components in the YREB, to compare and analyze their driving forces in the three regions and verify the regional convergence of IGG from two different perspectives.
Due to the limitation of the availability of index data, this study does not include more indicators of urban inclusiveness in the establishment of urban IGG indicator system in the YREB. We can consider improving the indicator system in future research, which can establish a suitable model to further explore the main factors affecting the IGG and its convergence in the YREB.
Author Contributions
Conceptualization; S.C.; methodology, G.C.; software, G.C.; validation, G.C.; formal analysis, Z.Y.; investigation, Z.Y.; resources, G.C.; writing—original draft preparation, G.C.; writing—review and editing, Z.Y. and S.C.; supervision, S.C.; project administration, S.C.; funding acquisition, S.C. All authors have read and agreed to the published version of the manuscript.
Funding
This research was funded by the National Social Science Fund Key Projects of China grant number 14AGL007. And the APC was funded by Fujian Normal University.
Acknowledgments
The authors were grateful to the editor and anonymous reviewers of this paper. We thanked Xin Zhao for the technical support of DEA method.
Conflicts of Interest
The authors declare no conflict of interest.
References
- Simonis, U. Decoupling Natural Resource Use and Environmental Impacts from Economic Growth. Int. J. Soc. Econ. 2013, 40, 385–386. [Google Scholar] [CrossRef]
- World Bank. Inclusive Green Growth: The Pathway to Sustainable Development; World Bank Publications: Washington, DC, USA, 2012; p. 24. [Google Scholar]
- Herman, E.D. Beyond Growth: The Economics of Sustainable Development; Shanghai Yiwen Press: Shanghai, China, 2001. [Google Scholar]
- Luukkanen, J.; Kaivo-oja, J.; Vähäkari, N.; O’Mahony, T.; Korkeakoski, M.; Panula-Ontto, J.; Hogarth, N. Green economic development in Lao PDR: A sustainability window analysis of Green Growth Productivity and the Efficiency Gap. J. Clean. Prod. 2019, 211, 818–829. [Google Scholar] [CrossRef]
- UNESCAP. MCED 2005 Bulletin: A Summary Report of the fth Ministerial Conference on Environment and Development in Asia and the Pacific; International Institute for Sustainable Development: Souel, Korea, 2005. [Google Scholar]
- UNEP. Towards a Green Economy: Pathways to Sustainable Development and Poverty Eradication; UNEP: Nairobi, Kenya, 2011. [Google Scholar]
- OECD. Towards Green Growth, OECD Green Growth Studies; OECD Publishing: Paris, France, 2011. [Google Scholar] [CrossRef]
- Sugden, C. Is Growth in Asia and the Pacific Inclusive? Asian Dev. Bank Econ. Work. Pap. Ser. 2012, 317. [Google Scholar] [CrossRef] [Green Version]
- Weiss, M.; Cattaneo, C. Degrowth-taking stock and reviewing an emerging academic paradigm. Ecol. Econ. 2017, 137, 220–230. [Google Scholar] [CrossRef] [PubMed]
- Jackson, T. Prosperity without Growth: Economics for a Finite Planet; Earthscan: London, UK, 2010. [Google Scholar]
- Zhao, X.; Shang, Y.; Song, M. What kind of cities are more conducive to haze reduction: Agglomeration or expansion? Habitat Int. 2019, 91, 102027. [Google Scholar] [CrossRef]
- Szigeti, C.; Toth, G.; Szabo, D. Decoupling—shifts in ecological footprint intensity of nations in the last decade. Ecol. Indic. 2017, 72, 111–117. [Google Scholar] [CrossRef]
- Wackernagel, M.; Rees, W. Our Ecological Footprint: Reducing Human Impact on the Earth; New Society Publishers: Gabriola Island, BC, Canada, 1998; p. 9. [Google Scholar]
- Toth, G.; Szigeti, C. The historical ecological footprint: From over-population to over-consumption. Ecol. Indic. 2016, 60, 283–291. [Google Scholar] [CrossRef]
- Maji, I. Impact of clean energy and inclusive development on CO2 emissions in sub-Saharan Africa. J. Clean. Prod. 2019, 240, 118186. [Google Scholar] [CrossRef]
- OECD. Inclusive Green Growth: For the Future We Want; OECD: Paris, France, 2012. [Google Scholar]
- Song, M.; Wang, J. Environmental efficiency evaluation of thermal power generation in China based on a slack-based endogenous directional distance function model. Energy 2018, 161, 325–336. [Google Scholar] [CrossRef]
- Lane, J. The crisis from the point of view of evolutionary economics. Int. J. Soc. Econ. 2010, 37, 466–471. [Google Scholar] [CrossRef]
- Quaas, M.F.; Smulders, S. Brown Growth, Green Growth, and the Efficiency of Urbanization. Environ. Resour. Econ. 2018, 71, 529–549. [Google Scholar] [CrossRef] [Green Version]
- Dinda, S. A theoretical basis for green growth. MPRA Pap. 2014, 8, 177–189. [Google Scholar] [CrossRef] [Green Version]
- Wang, X.; Shao, Q. Non-linear effects of heterogeneous environmental regulations on green growth in G20 countries: Evidence from panel threshold regression. Sci Total Environ. 2019, 660, 1346–1354. [Google Scholar] [CrossRef] [PubMed]
- Asian Development Bank. Toward a New Asian development Bank in a New Asia: Report of the Eminent Persons Group; Asian Development Bank: Manila, Philippines, 2007. [Google Scholar]
- Asian Development Bank Malina. Strategy 2010; Asian Development Bank: Mandaluyong City, Metro Manila, Philippines, 2008. [Google Scholar]
- Ali, I.; Son, H. Measuring Inclusive Growth. Asian Dev. Rev. 2007, 24, 11–31. [Google Scholar]
- Rauniyar, G.; Kanbur, R. Inclusive growth and inclusive development: A review and synthesis of Asian Development Bank literature. J. Asia Pac. Econ. 2010, 15, 455–469. [Google Scholar] [CrossRef]
- Sandberg, M.; Klockars, K.; Wilén, K. Green growth or degrowth? Assessing the normative justifications for environmental sustainability and economic growth through critical social theory. J. Clean. Prod. 2019, 206, 133–141. [Google Scholar] [CrossRef]
- Sterner, T.; Damon, M. Green growth in the post-Copenhagen climate. Energy Policy 2011, 39, 7165–7173. [Google Scholar] [CrossRef]
- Winters, L. Globalization, Infrastructure, and Inclusive Growth. ADBI Work. Pap. 2014, 464. [Google Scholar] [CrossRef] [Green Version]
- Bouma, J.; Berkhout, E. Inclusive Green Growth; PBL Netherlands Environmental Assessment Agency; PBL Publication: The Hague/Bilthoven, The Netherlands, 2015; PBL publication number: 1708. [Google Scholar]
- Wang, H.; Yang, G.; Oin, J. City Centrality, Migrants and Green Inovation Efficiency: Evidence from 106 Cities in the Yangtze River Economic Belt of China. Int. J. Environ. Res. Public Health 2020, 17, 652. [Google Scholar] [CrossRef] [Green Version]
- Mao, L.; Jiang, Y. Research on Assessment and Spatial Correlation Pattern of Provincial Technology Innovation Ability in Yangtze River Economic Belt. Sci. Technol. Prog. Policy 2016, 33, 126–131. [Google Scholar]
- Tang, D.; Zhang, Y.; Bethel, B.J. An analysis of disparities and driving factors of carbon emissions in the Yangtze River Economic Belt. Sustainability 2018, 11, 2362. [Google Scholar] [CrossRef] [Green Version]
- Jin, G.; Deng, X.; Zhao, X.; Guo, B.; Yang, J. Spatiotemporal patterns in urbanization efficiency within the Yangtze River Economic Belt between 2005 and 2014. J. Geogr. Sci. 2018, 28, 1113–1126. [Google Scholar] [CrossRef] [Green Version]
- Herrera, M. Innovation for impact: Business innovation for inclusive growth. J. Bus. Res. 2016, 69, 1725–1730. [Google Scholar] [CrossRef]
- Lee, S.-H.; Park, D. Fiscal Policy and Inclusive Growth in Latin America: Lessons for Asia; Asian Development Bank Economics Working Paper Series, No. 408; Asian Development Bank: Metro Manila, Philippines, 2014. [Google Scholar] [CrossRef] [Green Version]
- Albagoury, S. Inclusive Green Growth in Africa: Ethiopia Case Study; MPRA Paper; University Library of Munich: Munich, Germany, 2016; p. 74364. [Google Scholar]
- Resnick, D.; Tarp, F.; Thurlow, J. The Political Economy of Green Growth: Cases from Southern Africa. Public Adm. Dev. 2012, 32, 215–228. [Google Scholar] [CrossRef]
- Tone, K. A slacks-based measure of efficiency in data envelopment analysis. Eur. J. Oper. Res. 2001, 130, 498–509. [Google Scholar] [CrossRef] [Green Version]
- Tone, K. A strange case of the cost and allocative efficiencies in DEA. J. Oper. Res. Soc. 2002, 53, 1225–1231. [Google Scholar] [CrossRef]
- Hayami, Y.; Ruttan, V. Agricultural Productivity Differences among Countries. Am. Econ. Rev. 1970, 60, 895–911. [Google Scholar]
- Battese, G.; Rao, D. Technology Gap, Efficiency, and a Stochastic Meta-frontier Function. Int. J. Bus. Econ. 2002, 1, 87–93. [Google Scholar]
- Rao, D.; O’Donnell, C.; Battese, G. Metafrontier Functions for the Study of Inter-Regional Productivity Differences. Working Paper No. WP01/2003. 2003. Available online: http://espace.library.uq.edu.au/view/UQ:10564 (accessed on 1 January 2003).
- O’Donnell, C.; Rao, D.; Battese, G. Meta-Frontier Frameworks for Study of Firm-Level Efficiencies and Technology Ratios. Empir. Econ. 2008, 34, 31–255. [Google Scholar] [CrossRef]
Figure 1.
Metafrontier and group frontiers.

Figure 2.
The distribution of MIGG (meta inclusive green growth) efficiency and GIGG (group inclusive green growth) efficiency in YREB cities.
Figure 2.
The distribution of MIGG (meta inclusive green growth) efficiency and GIGG (group inclusive green growth) efficiency in YREB cities.

Figure 3.
Comparison of TGR gaps of the three groups.

Figure 4.
σ convergence of the level of IGG of overall YREB, upstream, midstream and downstream.


Table 1.
Input-output indicators and description of IGG.
| Index | Variable | Description |
|---|---|---|
| Input | Capital | When selecting the capital input index, most researchers use the perpetual inventory method to calculate capital stock. However, during calculation, there is a great discrepancy in the selection of base period capital stock and depreciation rate. In the past 20 years, growth trends of data of fixed asset investment and fixed asset formation of the overall society were basically consistent; since the data envelopment method measures relative efficiency, the results would therefore not show great deviations. Hence, this paper selects aggregate fixed asset investment of the whole society as the proxy variable for capital input and 2003 was chosen as the base period. Influences of price factors were eliminated, and the unit of this index is CNY 10,000. |
| Labor | Sustainable economic growth is a prerequisite for inclusive growth. Only high and sustainable economic growth can increase the wealth of the whole society and create job opportunities. This paper selects the total number of employees in the city at the end of the year to reflect employment opportunities, and the unit of this index is 10,000 persons. | |
| Land | Land is an important production factor that cannot be moved and copied, and the price of land directly affects the current situation of national economic development and growth potential. This paper selects the area of urban construction land, and the unit of this index is 10,000 square meters. | |
| Energy | There is a lack of data on energy consumption in prefecture-level cities in China, but there is a strong correlation between electricity and energy consumption. The common practice is to use energy consumption data from such cities and the unit of this index is 10,000 kWh. | |
| Desirable output | per capital GDP | As to desirable output, per capital GDP was chosen and 2003 was also taken as the base period. The unit of this index is Yuan. |
| Afforestation | The greening of the city can reflect the inclusive development of society. The area of parks in the municipal district was selected and the unit of this index is 10,000 square meters. | |
| Undesirable output | Air pollution | When considering ecological environment protection, air pollution and water pollution were chosen with high attention at present. This paper selects industrial sulfur dioxide emission as the proxy variable for air pollution and the unit is tons. |
| Waste pollution | Industrial wastewater emission was included into the evaluation index system and the unit is 10,000 tons. |
Table 2.
Description of the 108 cities of the Yangtze River Economic Belt (YREB).
| Regions | Provinces | Cities |
|---|---|---|
| Upstream | Chongqing | Municipalities directly under the central government |
| Sichuan | Bazhong, Chengdu, Dazhou, Deyang, Guang’an, Guangyuan, Leshan, Luzhou, Meishan, Mianyang, Neijiang, Nanchong, Panzhihua, Suining, Ya’an, Yibin, Ziyang, Zigong | |
| Guizhou | Anshun, Guiyang, Liupanshui, Zunyi | |
| Yunnan | Baoshan, Kunming, Lijiang, Lincang, Pu’er, Qujing, Yuxi, Zhaotong | |
| Midstream | Jiangxi | Fuzhou, Ganzhou, Ji’an, Jingdezhen, Jiujiang, Nanchang, Pingxiang, Shangrao, Xinyu, Yichun, Yingtan |
| Hunan | Changsha, Changde, Chenzhou, Hengyang, Huaihua, Loudi, Shaoyang, Xiangtan, Yiyang, Yongzhou, Yueyang, Zhangjiajie, Zhuzhou | |
| Hubei | Ezhou, Huanggang, Huangshi, Jingmen, Jingzhou, Shiyan, Suizhou, Wuhan, Xianning, Xiangyang, Xiaogan, Yichang | |
| Downstream | Jiangsu | Changzhou, Huai’an, Lianyungang, Nanjing, Nantong, Suzhou, Suqian, Taizhou, Wuxi, Xuzhou, Yancheng, Yangzhou, Zhenjiang |
| Zhejiang | Hangzhou, Huzhou, Jiaxing, Jinhua, Lishui, Ningbo, Quzhou, Shaoxing, Taizhou, Wenzhou, Zhoushan | |
| Shanghai | Municipalities directly under the central government | |
| Anhui | Anqing, Bengbu, Bozhou, Chizhou, Chuzhou, Fuyang, Hefei, Huaibei, Huainan, Huangshan, Lu’an, Maanshan, Suzhou, Tongling, Wuhu, Xuancheng |
Table 3.
Meta inclusive green growth efficiency, group inclusive green growth efficiency, and mean values from 2003 to 2016.
Table 3.
Meta inclusive green growth efficiency, group inclusive green growth efficiency, and mean values from 2003 to 2016.
| Region | Upstream | Midstream | Downstream | Total | ||||
|---|---|---|---|---|---|---|---|---|
| Year | MIGG | GIGG | MIGG | GIGG | MIGG | GIGG | MIGG | GIGG |
| 2003 | 0.4880 | 0.5483 | 0.3597 | 0.4829 | 0.2765 | 0.3823 | 0.3747 | 0.4712 |
| 2004 | 0.3699 | 0.3901 | 0.2693 | 0.4029 | 0.3022 | 0.3673 | 0.3138 | 0.3868 |
| 2005 | 0.3666 | 0.3768 | 0.2817 | 0.4244 | 0.3078 | 0.3649 | 0.3187 | 0.3887 |
| 2006 | 0.3806 | 0.3957 | 0.2921 | 0.4255 | 0.3545 | 0.4292 | 0.3424 | 0.4168 |
| 2007 | 0.3867 | 0.3973 | 0.3055 | 0.4429 | 0.3585 | 0.4438 | 0.3503 | 0.4280 |
| 2008 | 0.3818 | 0.3994 | 0.3097 | 0.4609 | 0.3735 | 0.4469 | 0.3550 | 0.4357 |
| 2009 | 0.3716 | 0.3878 | 0.3536 | 0.5060 | 0.4002 | 0.4857 | 0.3751 | 0.4599 |
| 2010 | 0.4344 | 0.4549 | 0.3517 | 0.5260 | 0.4295 | 0.4900 | 0.4052 | 0.4903 |
| 2011 | 0.4607 | 0.4781 | 0.3754 | 0.5108 | 0.4230 | 0.4738 | 0.4197 | 0.4876 |
| 2012 | 0.4630 | 0.5056 | 0.4089 | 0.5441 | 0.4681 | 0.5133 | 0.4467 | 0.5210 |
| 2013 | 0.4347 | 0.4779 | 0.3829 | 0.5088 | 0.4421 | 0.4807 | 0.4199 | 0.4891 |
| 2014 | 0.4694 | 0.5242 | 0.4218 | 0.5763 | 0.4820 | 0.5268 | 0.4577 | 0.5425 |
| 2015 | 0.5412 | 0.5847 | 0.4489 | 0.5917 | 0.5250 | 0.5607 | 0.5050 | 0.5790 |
| 2016 | 0.6396 | 0.7370 | 0.5516 | 0.7446 | 0.6573 | 0.7240 | 0.6162 | 0.7352 |
| Mean | 0.4420 | 0.4756 | 0.3652 | 0.5106 | 0.4143 | 0.4778 | 0.4072 | 0.4880 |
Table 4.
Dynamic variable trend of TGR in YREB cities.
| TGR | Upstream | Midstream | Downstream | Total |
|---|---|---|---|---|
| 2003 | 0.9141 | 0.7726 | 0.7969 | 0.8279 |
| 2004 | 0.9630 | 0.7390 | 0.8300 | 0.8440 |
| 2005 | 0.9722 | 0.7379 | 0.8485 | 0.8529 |
| 2006 | 0.9704 | 0.7501 | 0.8486 | 0.8564 |
| 2007 | 0.9733 | 0.7479 | 0.8437 | 0.8550 |
| 2008 | 0.9625 | 0.7347 | 0.8599 | 0.8524 |
| 2009 | 0.9588 | 0.7427 | 0.8601 | 0.8539 |
| 2010 | 0.9543 | 0.7266 | 0.8894 | 0.8568 |
| 2011 | 0.9623 | 0.7629 | 0.9043 | 0.8765 |
| 2012 | 0.9375 | 0.7697 | 0.9152 | 0.8742 |
| 2013 | 0.9276 | 0.7691 | 0.9220 | 0.8729 |
| 2014 | 0.9221 | 0.7530 | 0.9222 | 0.8658 |
| 2015 | 0.9362 | 0.7702 | 0.9348 | 0.8804 |
| 2016 | 0.8925 | 0.7398 | 0.9144 | 0.8489 |
| Mean | 0.9462 | 0.7512 | 0.8779 | 0.8584 |
Table 5.
Mean values of MML index, GML index, and their decomposed indexes from 2003 to 2016.
| MEC | MTC | MML | GEC | GTC | GML | PTCU | PTRC | |
|---|---|---|---|---|---|---|---|---|
| Upstream | 1.0202 | 1.0273 | 1.0480 | 1.0252 | 1.0287 | 1.0546 | 0.9951 | 0.9987 |
| Midstream | 1.0085 | 1.0399 | 1.0488 | 1.0039 | 1.0456 | 1.0496 | 1.0046 | 0.9946 |
| Downstream | 1.0023 | 1.0666 | 1.0691 | 1.0000 | 1.0571 | 1.0571 | 1.0023 | 1.0090 |
| Total | 1.0103 | 1.0446 | 1.0553 | 1.0097 | 1.0438 | 1.0538 | 1.0007 | 1.0008 |
Table 6.
Absolute β-convergence of the level of IGG of overall YREB, upstream, midstream, and downstream regions.
Table 6.
Absolute β-convergence of the level of IGG of overall YREB, upstream, midstream, and downstream regions.
| YREB | Upstream | Midstream | Downstream | |||||
|---|---|---|---|---|---|---|---|---|
| FE | RE | FE | RE | FE | RE | FE | RE | |
| B | −1.2523 *** | −1.2180 *** | −1.2459 *** | −1.1956 *** | −1.1985 *** | −1.1815 *** | −1.2850 *** | −1.2621 *** |
| (−45.14) | (−45.39) | (−23.42) | (−23.25) | (−24.85) | (−25.33) | (−29.31) | (−29.68) | |
| A | 0.0695 *** | 0.0680 *** | 0.0608 *** | 0.0591 *** | 0.0618 *,** | 0.612 *** | 0.0829 *** | 0.0816 *** |
| (11.99) | (11.94) | (4.84) | (4.75) | (7.73) | (7.85) | (8.54) | (8.59) | |
| Hausman | 48.71 | 18.76 | 7.53 | 14.80 | ||||
| p value | 0.0000 | 0.0000 | 0.0061 | 0.0001 | ||||
| Conclusion | Fixed effect model | Fixed effect model | Fixed effect model | Fixed effect model | ||||
Note: t statistics are shown in brackets; ***, ** and * respectively represent being significant at the level of 1%, 5% and 10%.
© 2020 by the authors. Licensee MDPI, Basel, Switzerland. This article is an open access article distributed under the terms and conditions of the Creative Commons Attribution (CC BY) license (http://creativecommons.org/licenses/by/4.0/).
Share and Cite
MDPI and ACS Style
Chen, G.; Yang, Z.; Chen, S. Measurement and Convergence Analysis of Inclusive Green Growth in the Yangtze River Economic Belt Cities. Sustainability 2020, 12, 2356. https://0-doi-org.brum.beds.ac.uk/10.3390/su12062356
AMA Style
Chen G, Yang Z, Chen S. Measurement and Convergence Analysis of Inclusive Green Growth in the Yangtze River Economic Belt Cities. Sustainability. 2020; 12(6):2356. https://0-doi-org.brum.beds.ac.uk/10.3390/su12062356
Chicago/Turabian StyleChen, Guannan, Zhenhuang Yang, and Shaohui Chen. 2020. "Measurement and Convergence Analysis of Inclusive Green Growth in the Yangtze River Economic Belt Cities" Sustainability 12, no. 6: 2356. https://0-doi-org.brum.beds.ac.uk/10.3390/su12062356
Note that from the first issue of 2016, this journal uses article numbers instead of page numbers. See further details here.