Monitoring Sustainability Effects of the Bioeconomy: A Material Flow Based Approach Using the Example of Softwood Lumber and Its Core Product Epal 1 Pallet


Abstract
:1. Introduction
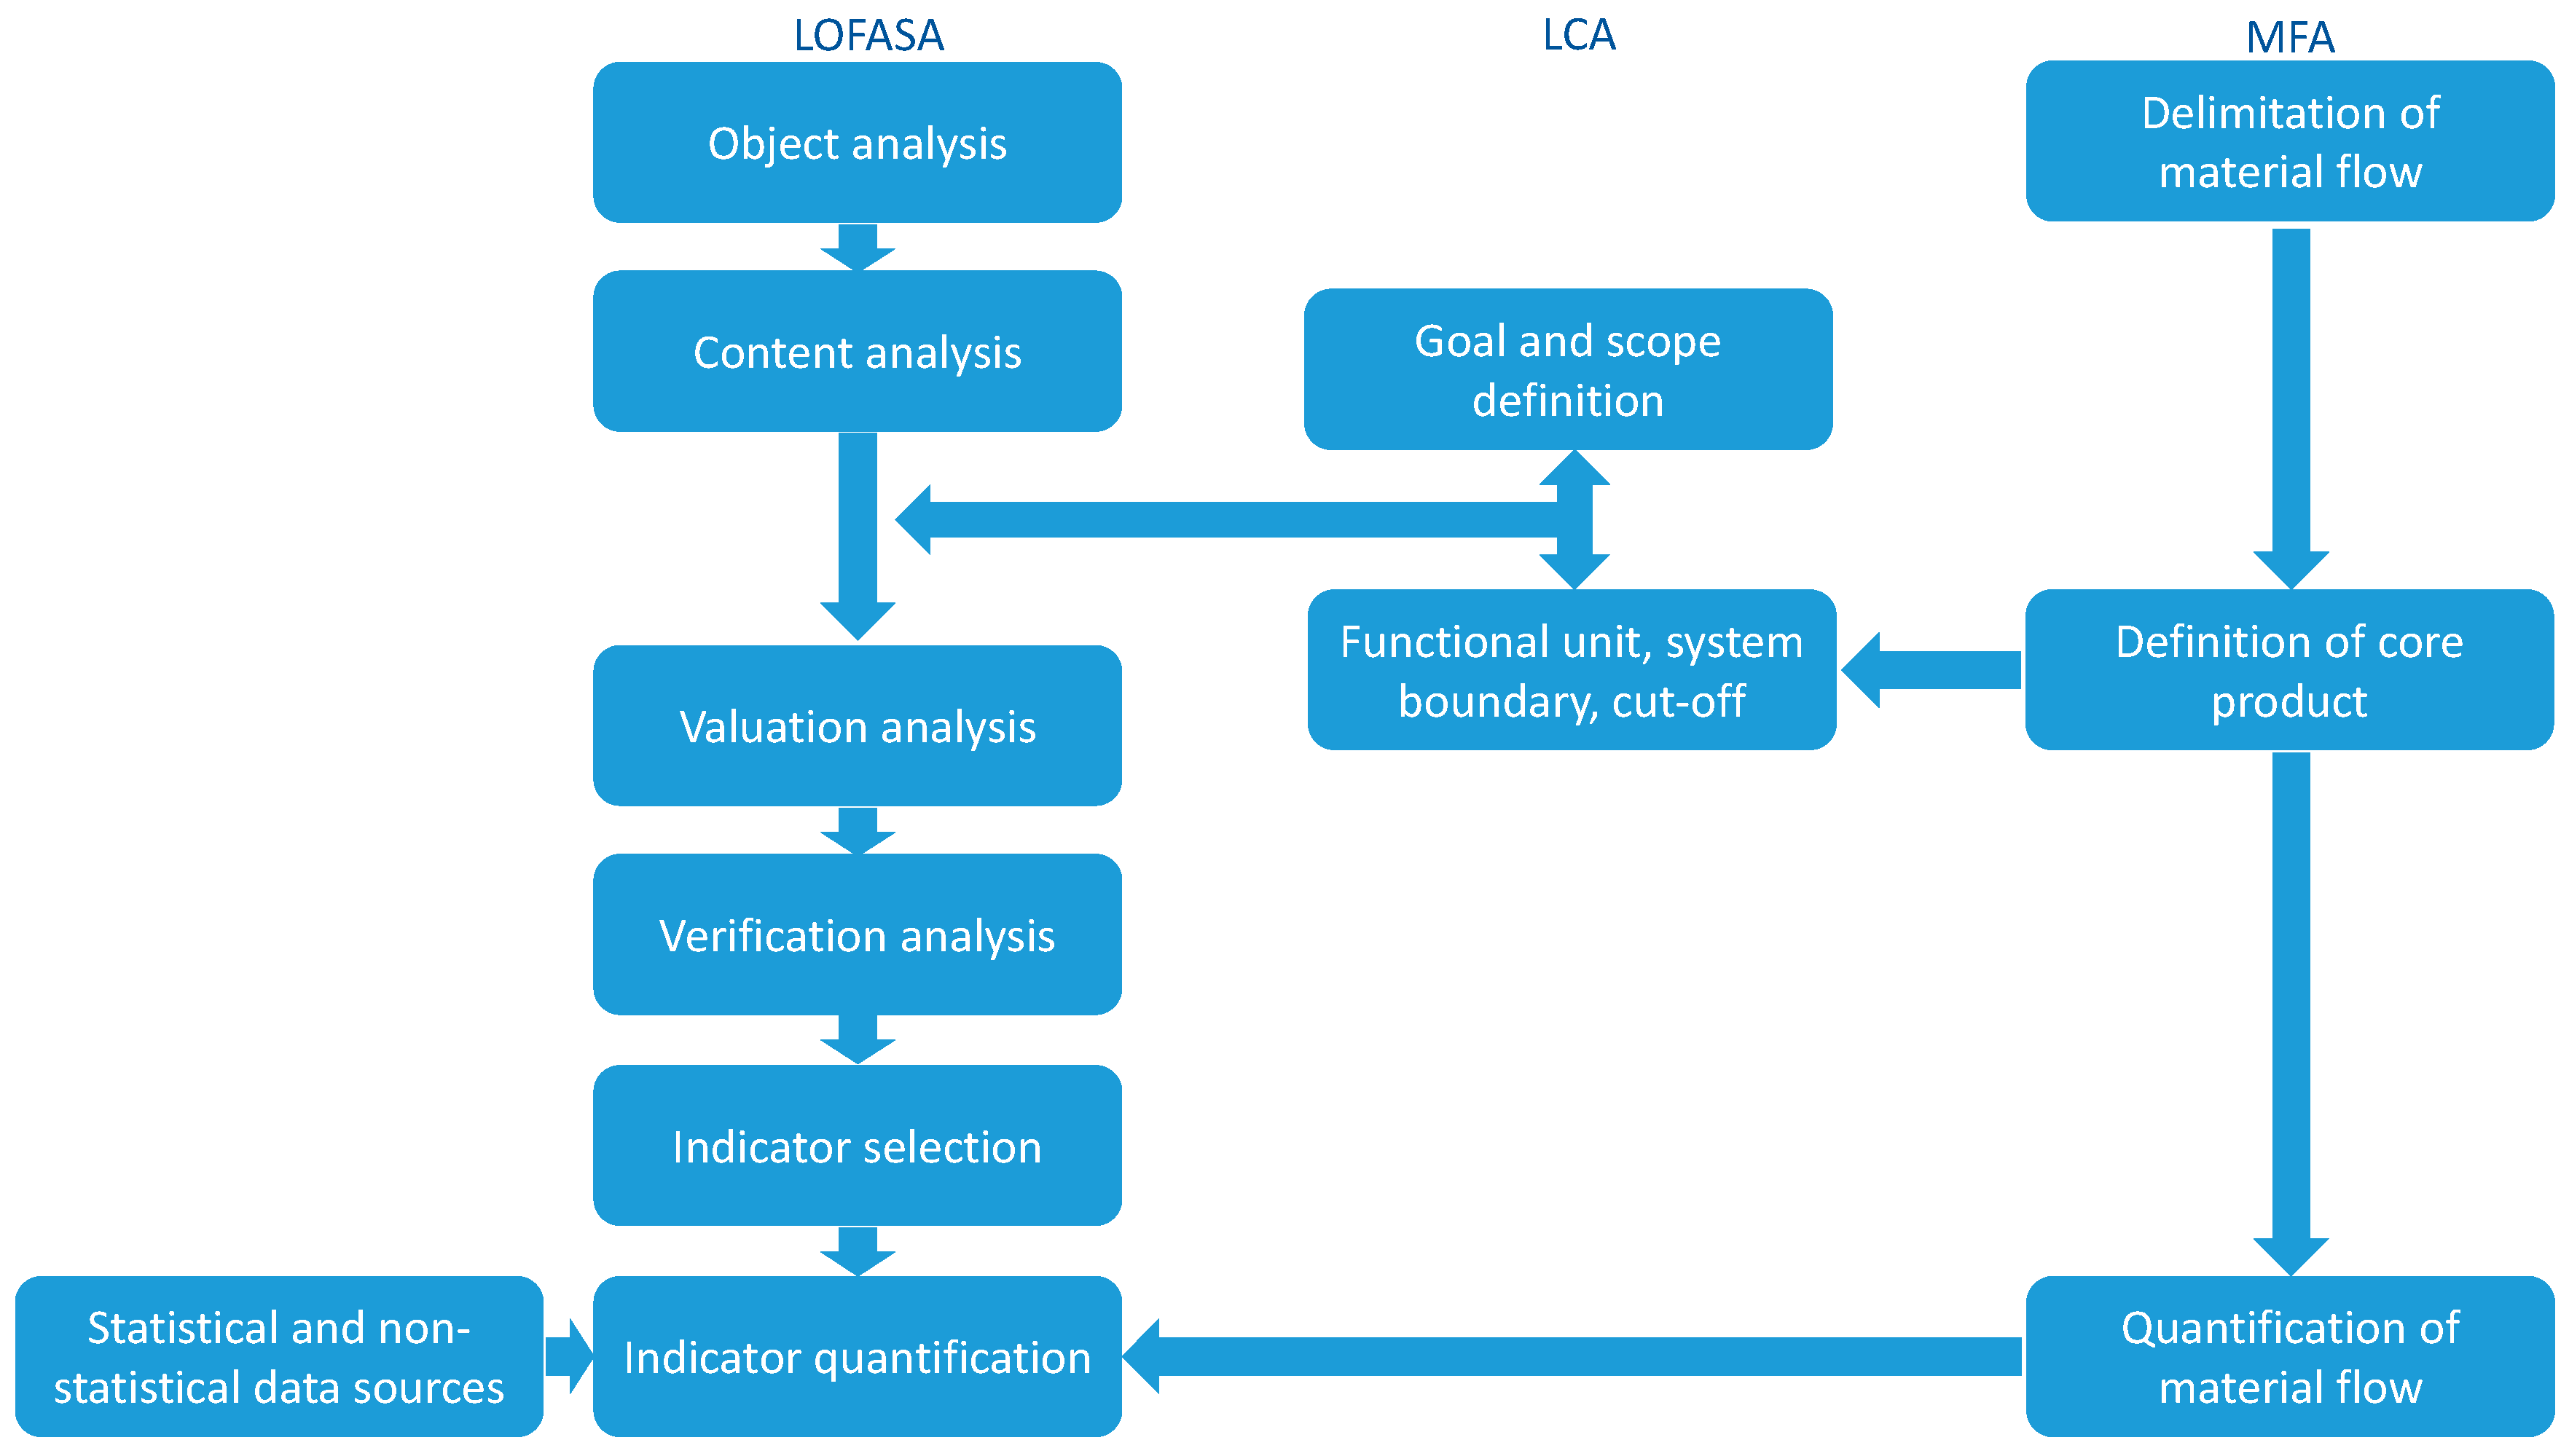
2. Methods
2.1. Definition of Bioeconomy
2.2. Material Flow Analysis
2.3. Sustainability Assessment
2.3.1. Selection of Relevant Sustainability Aspects Applying Content and Valuation Analysis
2.3.2. Goal and Scope Definition
- Predominantly based on periodically updated and reliable information,
- Transparent,
- Efficient,
- Goal oriented,
- Flexible enough to cover altered and new material flows and products of an evolving bioeconomy.
2.3.3. Functional Unit, System Boundaries, and Cutoff Criteria
2.3.4. Selection of Indicators Applying Verification Analysis
2.3.5. Quantification of Indicators
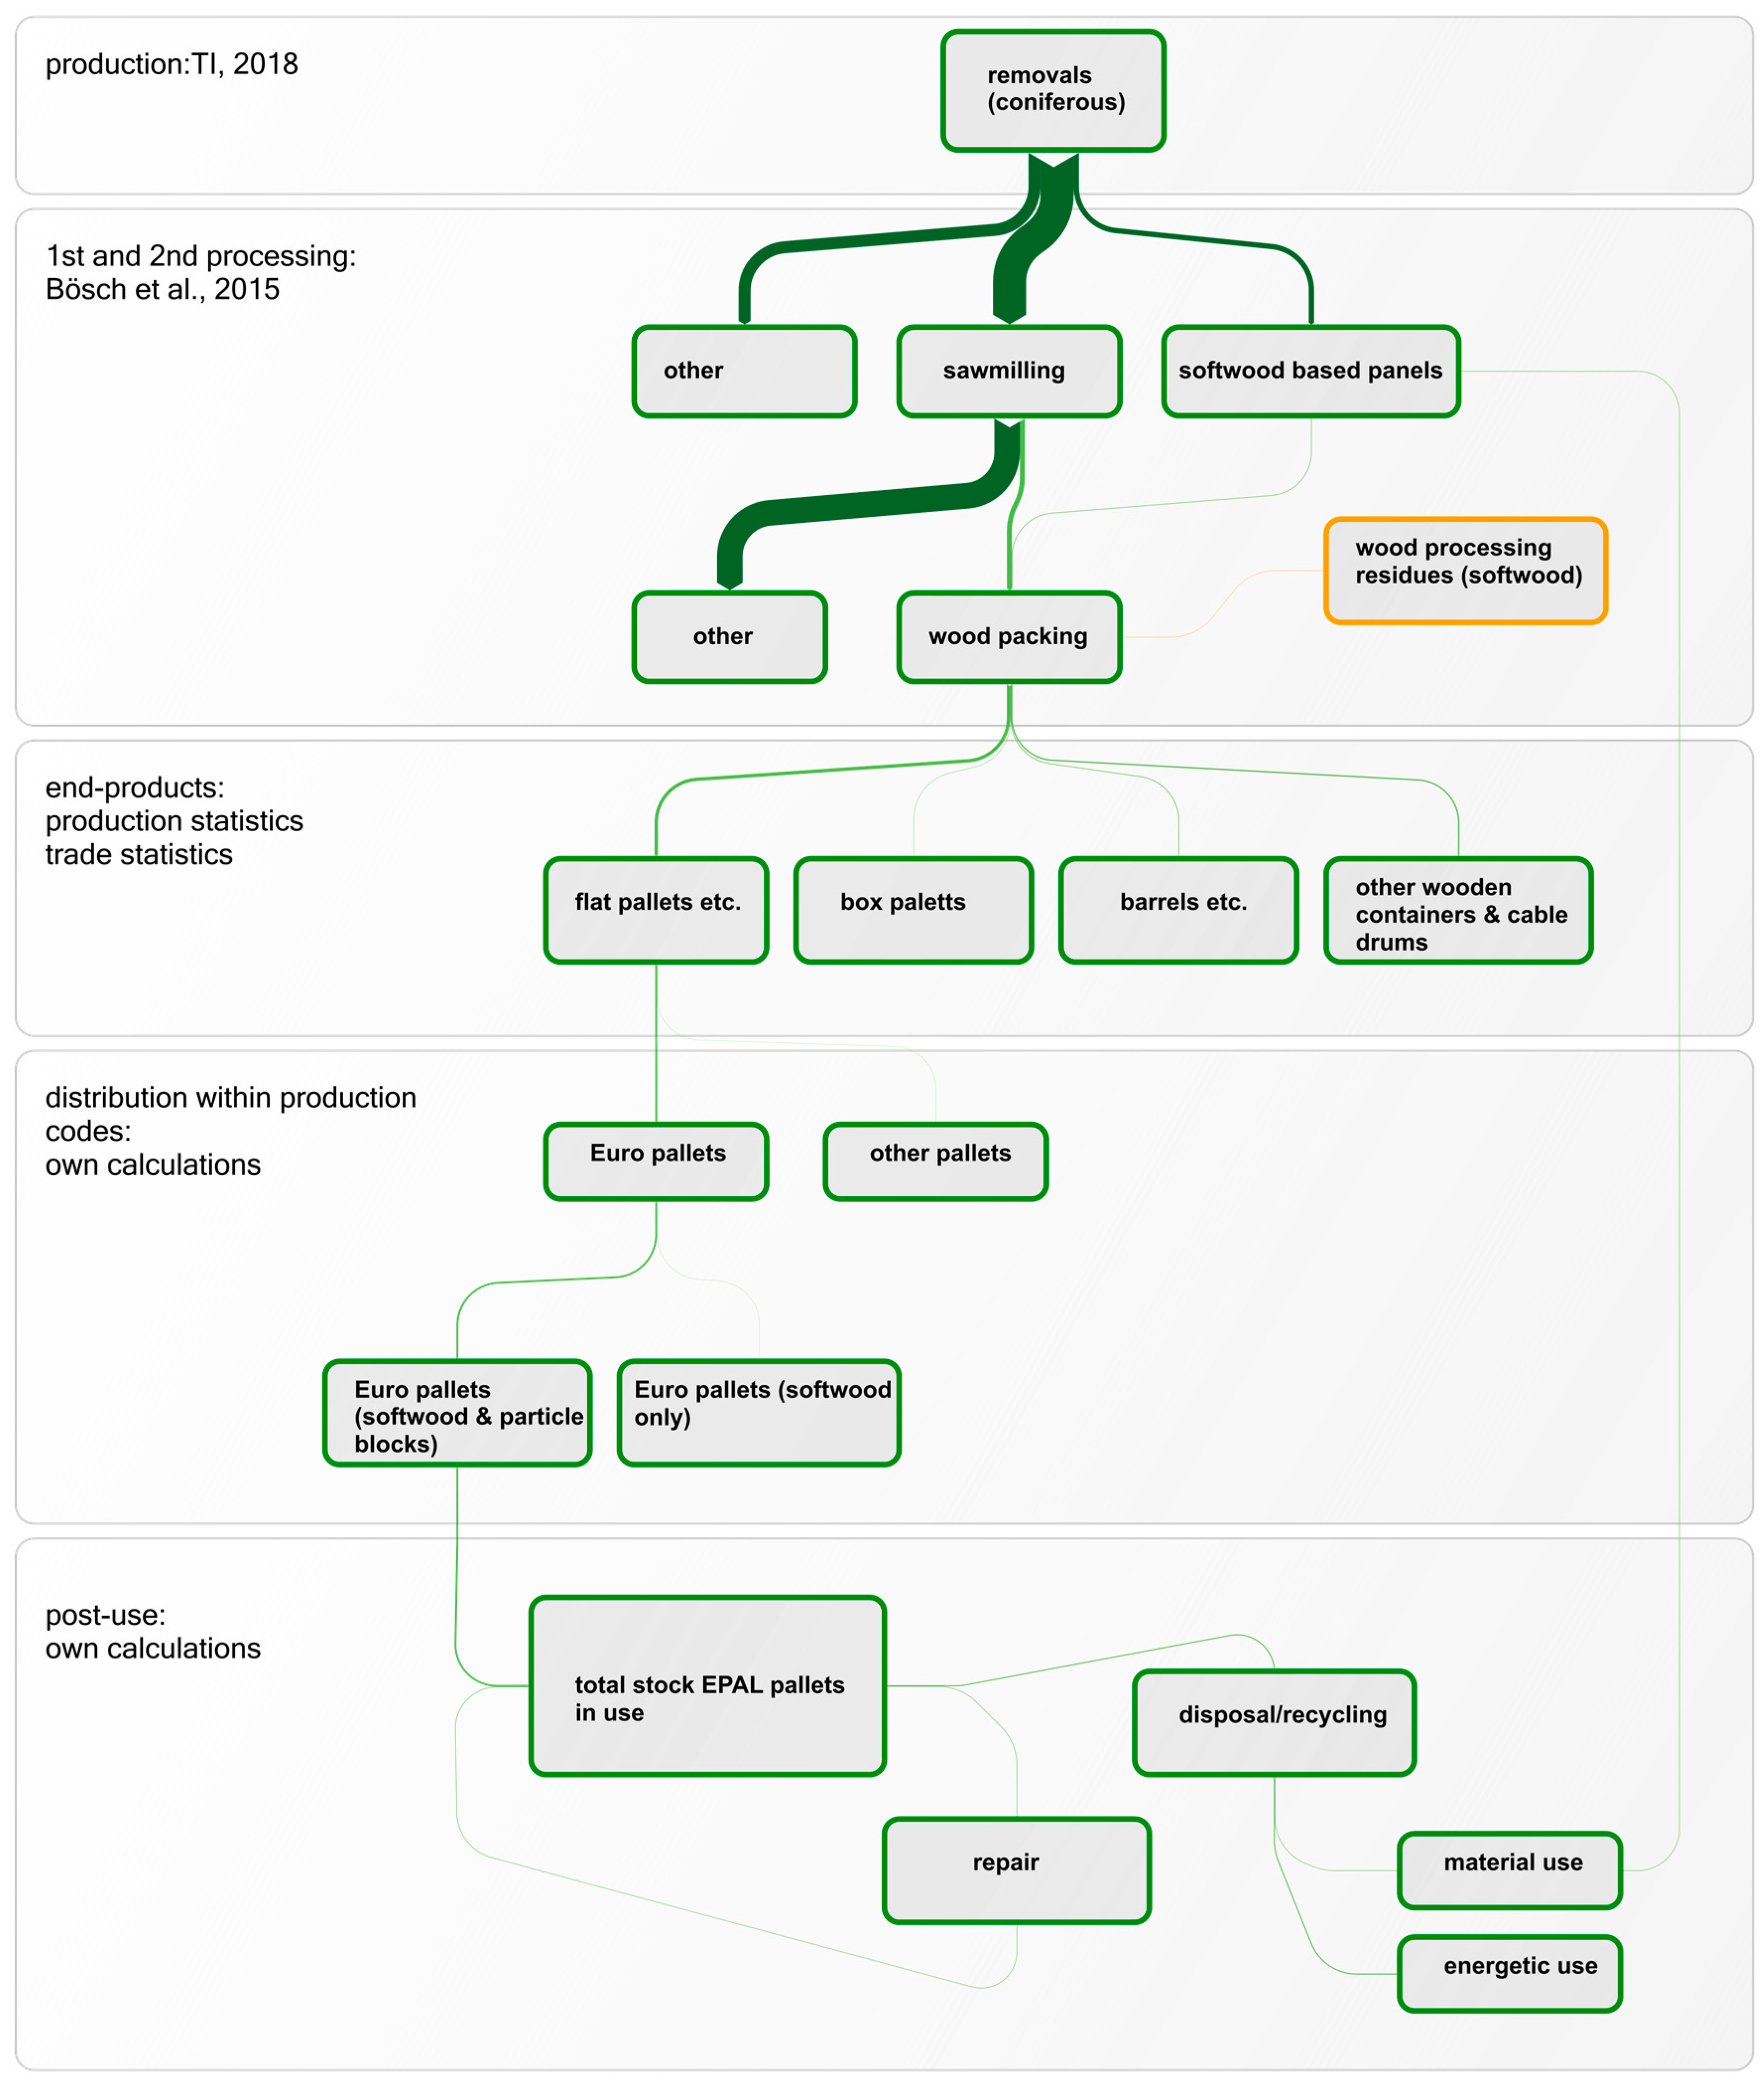
2.4. Case Study EPAL 1 Pallets
2.4.1. Material Flow Analysis of Softwood Lumber and Its Core Product EPAL 1 Pallets
2.4.2. Goal and Scope
- Relevant environmental, economic, and social effects of a material flow and its core product shall be assessed and quantified.
- The assessment is setup for comparisons with reference material flows and core products.
2.4.3. Functional Unit, System Boundaries, and Cut-off Criteria
2.4.4. Indicator Selection
Environmental Indicators
Economic Indicators
Social Indicators
3. Results
3.1. Material Flow Analysis
3.2. Sustainability Assessment
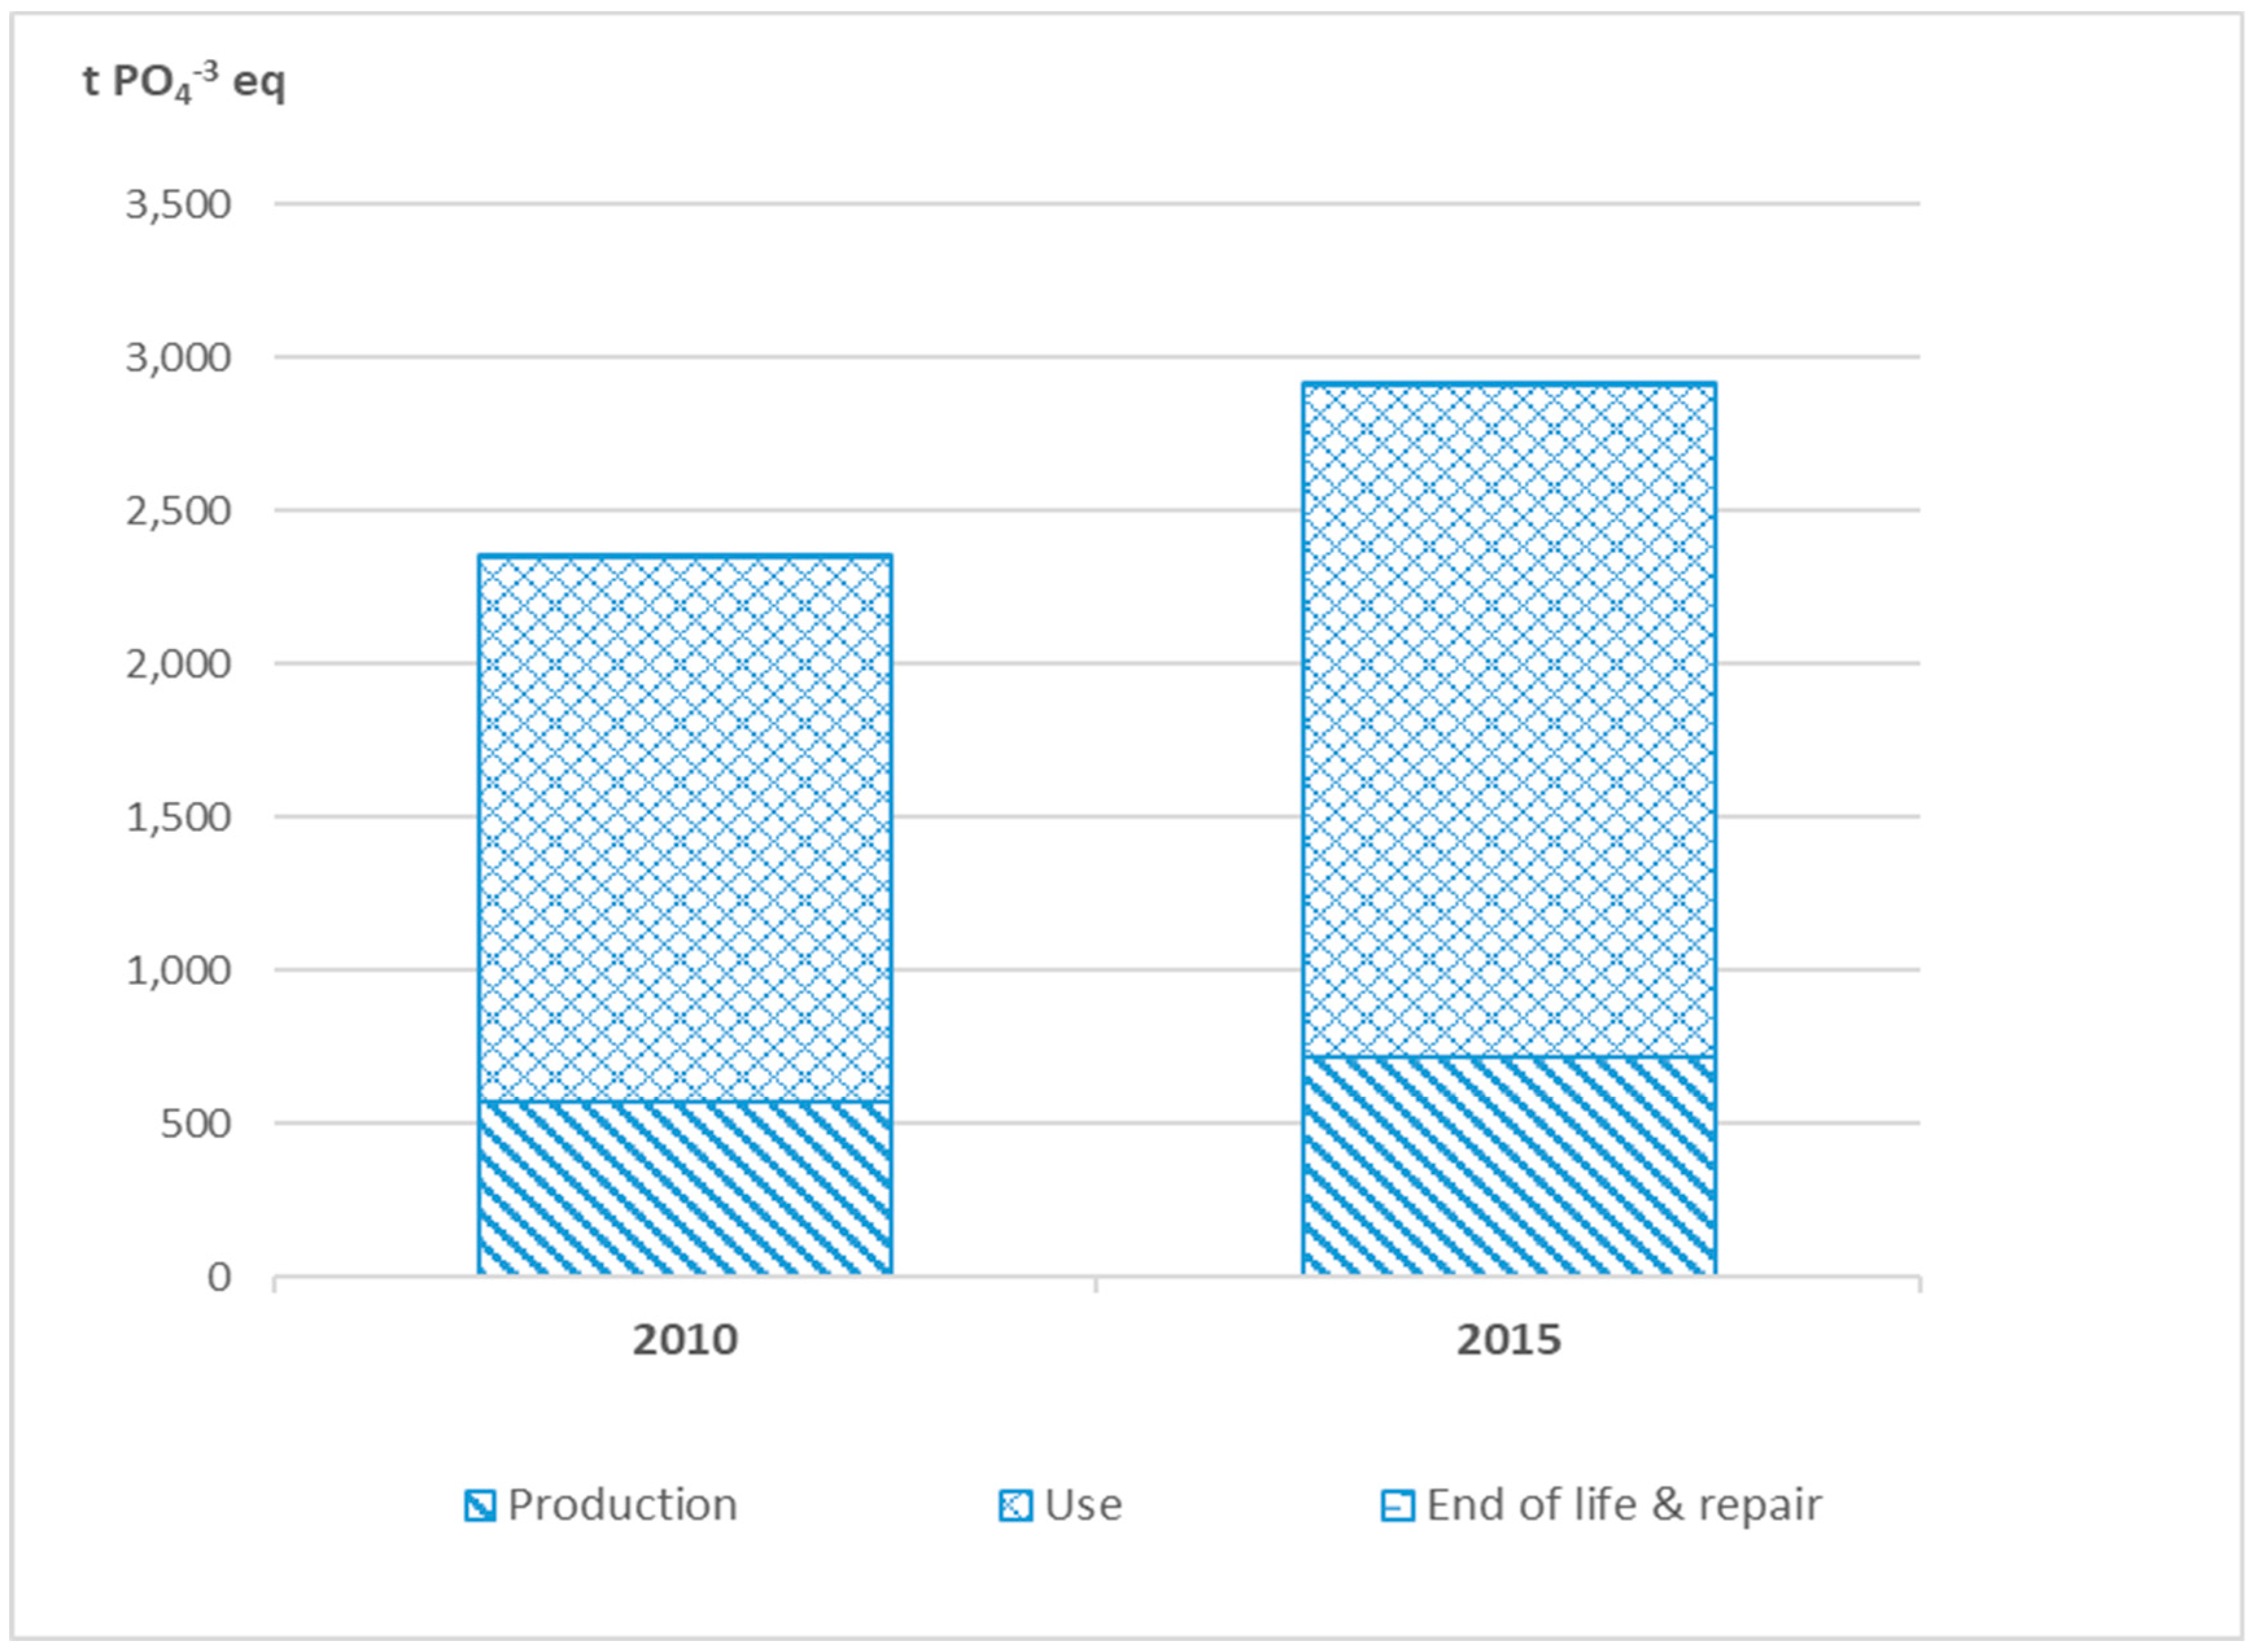
3.2.1. Environmental Indicators
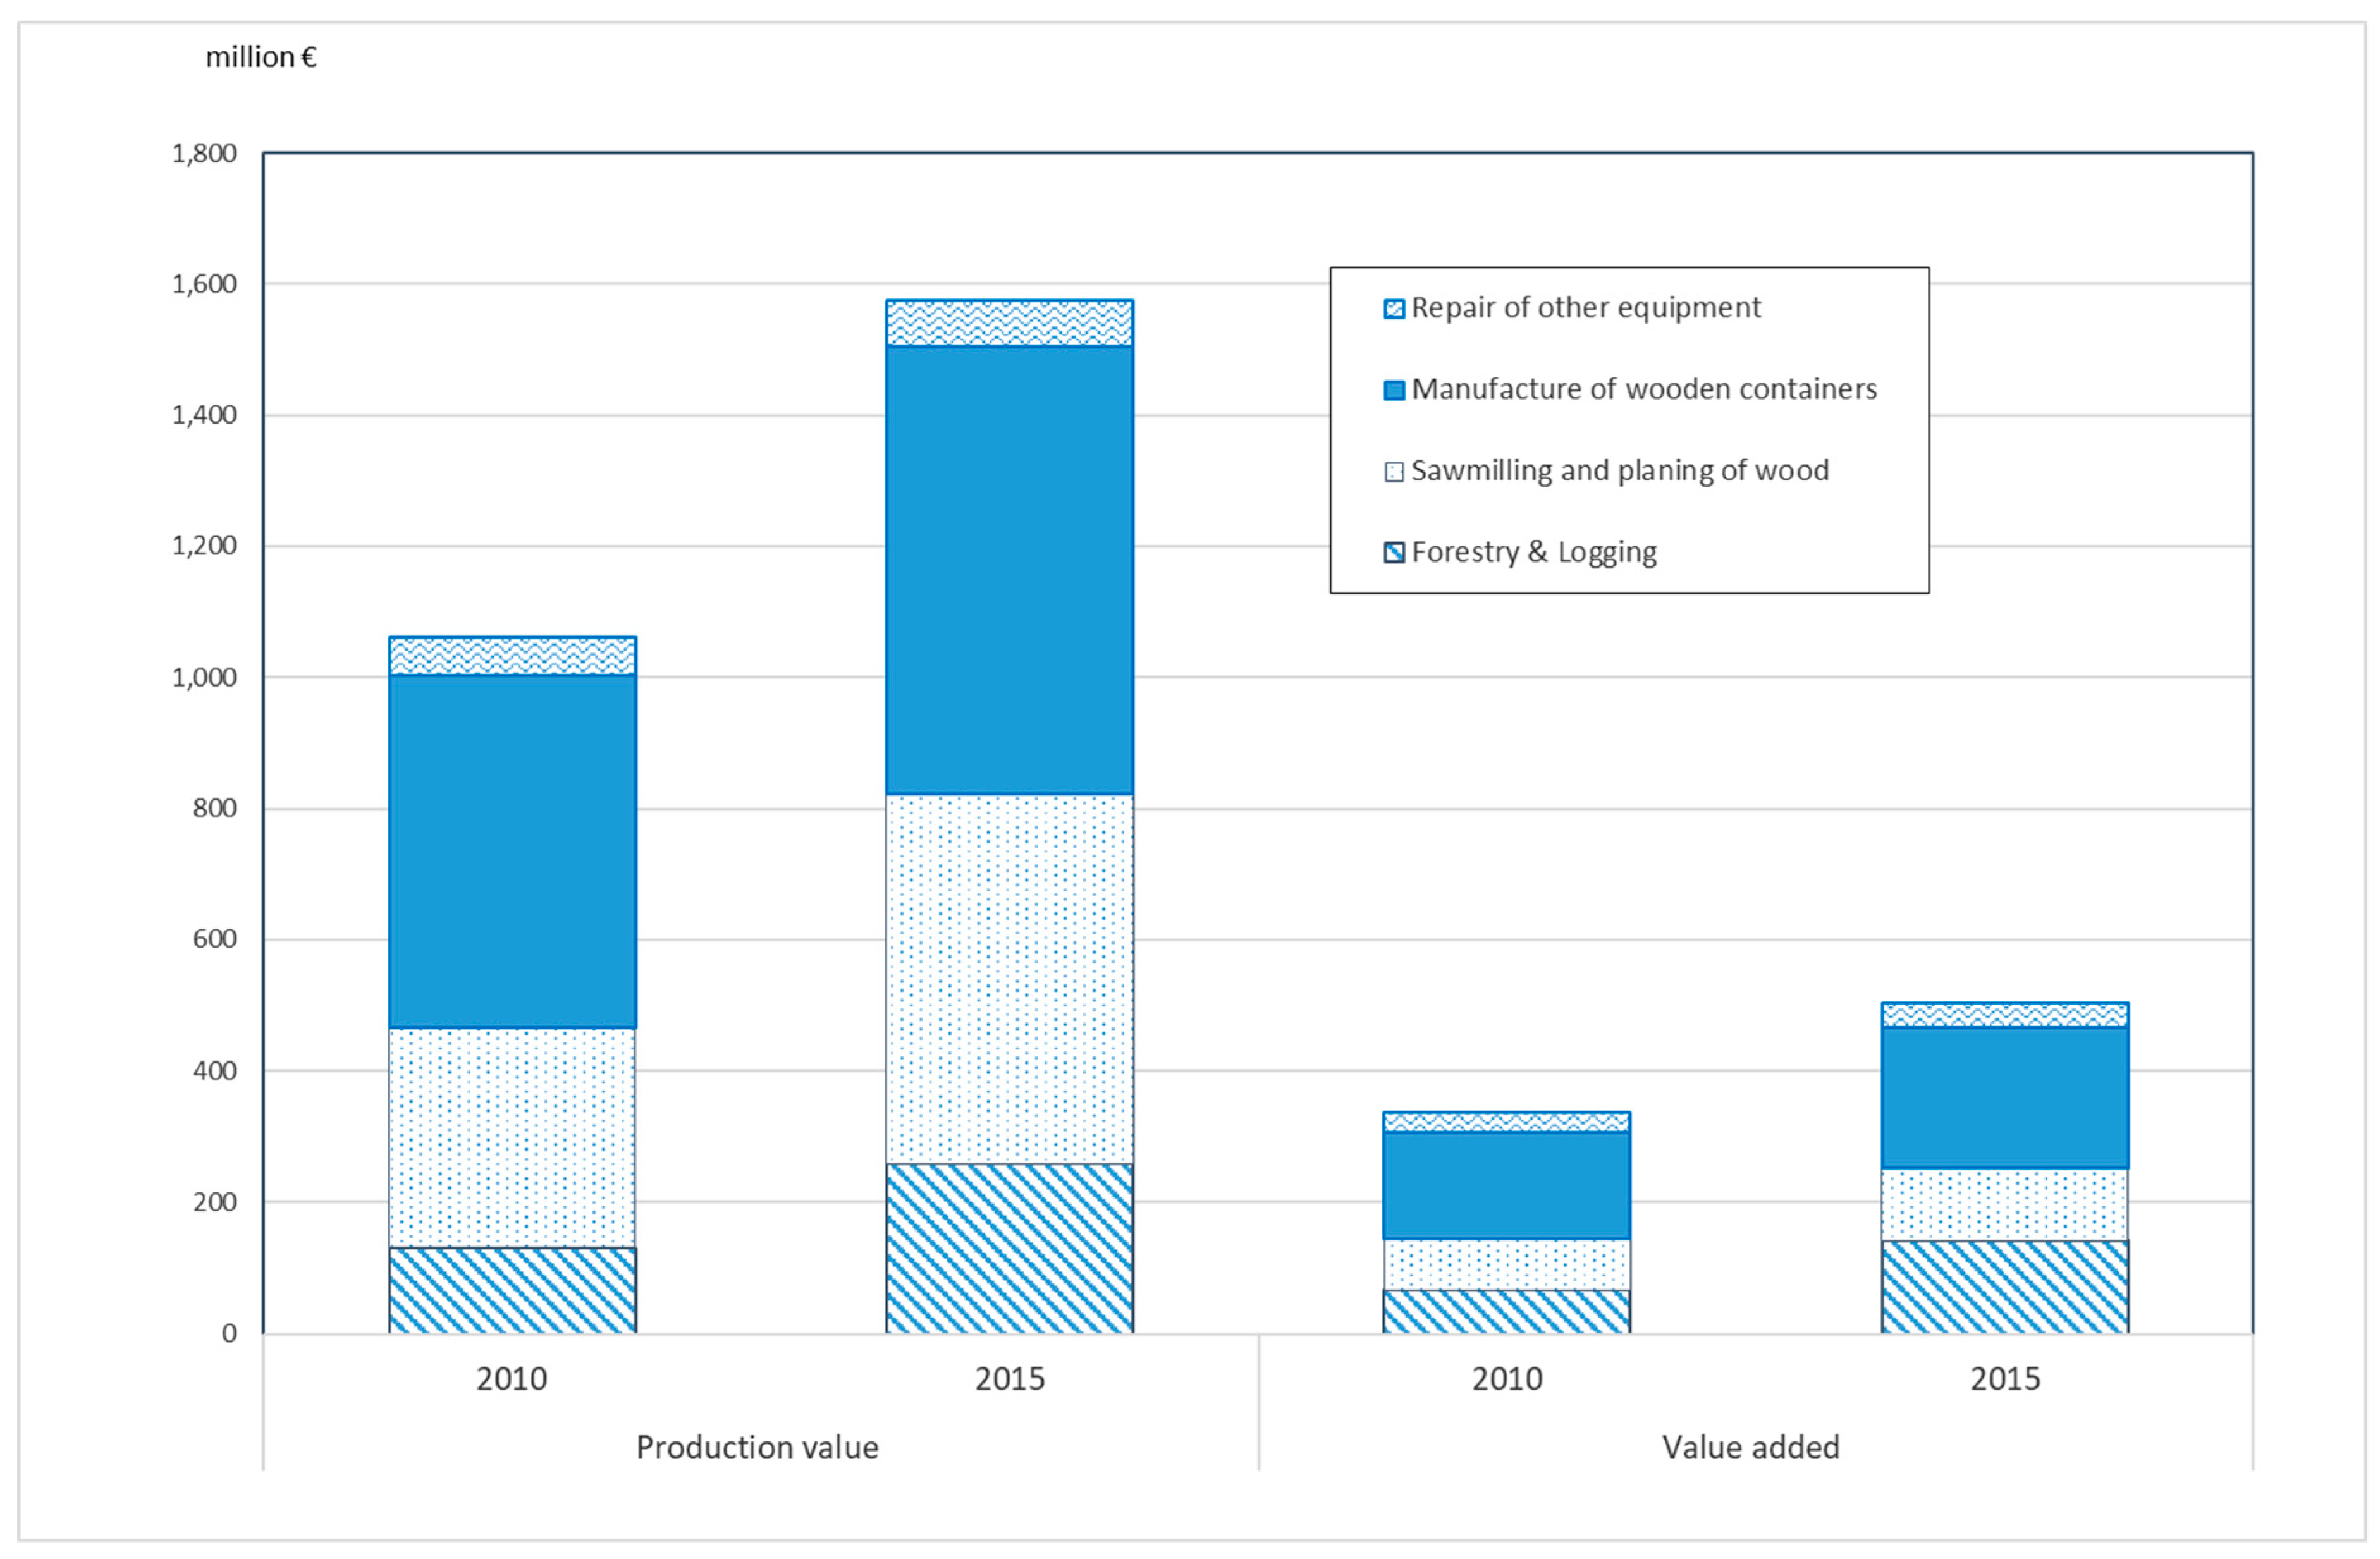
3.2.2. Economic Indicators
3.2.3. Social Indicators
4. Discussion
4.1. Material Flow Analysis
4.2. Sustainability Assessment
Author Contributions
Funding
Conflicts of Interest
Appendix A
- Softwood timber is from Germany (60%), Poland (20%), and Lithuania (20%).
- Wood for repair of pallets is from Lithuania (100%).
- We assume that production, use, and disposal of EPAL 1 pallets in Germany would have the same environmental impacts as in the Netherlands.
- The average transport distance of one pallet throughout its lifetime is 8538 km.
- The use of EPAL 1 pallets (transport activities) occurs linearly throughout the useful life of six years.
- At the end of life 67% of pallets are combusted while 33% are recycled.

| EPAL 1 Pallet Type | Impact of Production, Use, and Disposal per t EPAL 1 Pallet | Amount of Pallets, in million t | Impact of Production, Use, and Disposal of the Total Amount of EPAL 1 Pallets in Germany | |||||
|---|---|---|---|---|---|---|---|---|
| GWP, t CO2 eq. | EP, kg PO4−3 eq. | GWP, thousand t CO2 eq. | EP, t PO4−3 eq. | |||||
| Year | 2010 | 2015 | 2010 | 2015 | 2010 | 2015 | ||
| EPAL 1 (softwood lumber only) | 1.06 | 1.68 | 76 | 100 | 112 | 138 | ||
| EPAL 1 (softwood and wood particle blocks) | 1.21 | 1.76 | 1648 | 2160 | 2237 | 2774 | ||
| Total | 1724 | 2261 | 2349 | 2912 | ||||
| Thereof production: | ||||||||
| EPAL 1 (softwood lumber only) | 0.37 | 0.30 | 0.07 | 0.09 | 27 | 34 | 22 | 27 |
| EPAL 1 (softwood and wood particle blocks) | 0.51 | 0.40 | 1.37 | 1.72 | 693 | 870 | 550 | 691 |
| Total production | 1.44 | 1.81 | 719 | 903 | 572 | 718 | ||
| Thereof use 1: | ||||||||
| EPAL 1 (softwood lumber only) | 1.13 | 1.35 | 0.39 | 0.49 | 74 | 92 | 89 | 110 |
| EPAL 1 (softwood and wood particle blocks) | 1.13 | 1.35 | 7.48 | 9.24 | 1413 | 1744 | 1687 | 2083 |
| Total use | 7.87 | 9.73 | 1487 | 1836 | 1775 | 2193 | ||
| Thereof end of life and repair: | ||||||||
| EPAL 1 (softwood lumber only) | −0.44 | 0.02 | 0.06 | 0.06 | −25 | −25 | 1 | 1 |
| EPAL 1 (softwood and wood particle blocks) | −0.43 | 0.00 | 1.07 | 1.07 | −457 | −454 | 0 | 0 |
| Total end of life and repair | 1.13 | 1.12 | −482 | −479 | 1 | 1 | ||
Appendix B
| Total Production Value of the Related Economic Activity, million € | Calculated Share of the Softwood Lumber Material Flow and Its Core Product EPAL 1 Pallets in the Related Economic Activity % | Production Value of the Softwood Lumber Material Flow and Its Core Product EPAL 1 Pallets, million € | ||||
|---|---|---|---|---|---|---|
| Economic activity/year | 2010 | 2015 | 2010 | 2015 | 2010 | 2015 |
| Forestry and logging | 3776 | 5546 | 3% | 5% | 131 | 259 |
| Sawmilling and planning of wood | 4832 | 6279 | 7% | 9% | 334 | 563 |
| Manufacture of wooden containers | 1533 | 1902 | 35% | 36% | 539 | 681 |
| Repair of other equipment | 194 | 234 | 30% | 30% | 57 | 70 |
| Total | 10,335 | 13,961 | 1061 | 1574 | ||
| Total Value Added of the Related Economic Activity, million € | Calculated Share of EPAL 1 Pallets in the Related Economic Activity, % | Value Added of EPAL 1 Pallets, million € | ||||
|---|---|---|---|---|---|---|
| Economic activity/year | 2010 | 2015 | 2010 | 2015 | 2010 | 2015 |
| Forestry and Logging | 1920 | 3046 | 3% | 5% | 67 | 142 |
| Sawmilling and planning of wood | 1120 | 1239 | 7% | 9% | 78 | 111 |
| Manufacture of wooden containers | 465 | 597 | 35% | 36% | 164 | 213 |
| Repair of other equipment | 96 | 119 | 30% | 30% | 28 | 36 |
| Total | 3602 | 5001 | 336 | 503 | ||
Appendix C
| Persons Employed, thousand | Calculated Share of EPAL 1 Pallets in the Related Economic Activity, % | Persons Employed in the Production of EPAL 1 Pallets, thousand | ||||
|---|---|---|---|---|---|---|
| Economic activity/year | 2010 | 2015 | 2010 | 2015 | 2010 | 2015 |
| Forestry and Logging | 38 | 37 | 3% | 5% | 1.3 | 1.7 |
| Sawmilling and planning of wood | 25 | 23 | 7% | 9% | 1.7 | 2.0 |
| Manufacture of wooden containers | 11 | 12 | 35% | 36% | 3.7 | 4.4 |
| Repair of other equipment | 3 | 3 | 30% | 30% | 0.8 | 0.8 |
| Total | 76 | 74 | 7.5 | 8.9 | ||
| Economic Activity | Average Annual Earnings in the Related Economic Activity (thousand €) | Share of Employees in the Related Economic Activity (%) | Calculation of Weighted Average Annual Earnings in the EPAL 1 Pallet Value Chain, (thousand €) |
|---|---|---|---|
| Forestry and Logging | 38 | 16% | 6 |
| Sawmilling and planning of wood | 33 | 24% | 8 |
| Manufacture of wooden containers 1 | 32 | 52% | 17 |
| Repair of other equipment | 36 | 8% | 3 |
| Total | 100% | 34 |
References
- Goven, J.; Pavone, V. The bioeconomy as political project: A polanyian analysis. Sci. Technol. Hum. Values 2014, 40, 302–337. [Google Scholar] [CrossRef]
- McCormick, K.; Kautto, N. The bioeconomy in Europe: An overview. Sustainability 2013, 5, 2589. [Google Scholar] [CrossRef] [Green Version]
- Dieckhoff, P.; El-Chichakli, B.; Patermann, C. Bioeconomy Policy Synopsis and Analysis of Strategies in the G7; German Bioeconomy Council: Berlin, Germany, 2015; p. 58. [Google Scholar]
- Fund, C.; El-Chichakli, B.; Patermann, C. Bioeconomy Policy (Part III) Update Report of National Strategies around the World; German Bioeconomy Council: Berlin, Germany, 2018; p. 121. [Google Scholar]
- Fund, C.; El-Chichakli, B.; Patermann, C.; Dieckhoff, P. Bioeconomy Policy (Part II) Synopsis of National Strategies around the World; German Bioeconomy Council: Berlin, Germany, 2015; p. 134. [Google Scholar]
- OECD. The Bioeconomy to 2030: Designing a Policy Agenda, Main Findings; OECD: Paris, France, 2009. [Google Scholar]
- OECD. The Bioeconomy to 2030: Designing a Policy Agenda, Scoping Document; OECD: Paris, France, 2006. [Google Scholar]
- European Commission. Innovating for Sustainable Growth—A Bioeconomy for Europe; European Commission: Luxemburg, 2012; p. 60.
- BMEL. National Policy Strategy on Bioeconomy; BMEL: Berlin, Germany, 2014; p. 79. [Google Scholar]
- Ministry of the Environment. The Finnish Bioeconomy Strategy; Ministry of the Environment: Toronto, ON, Canada, 2014; p. 30.
- DST. The Bio-Economy Strategy; Department of Science and Technology: Pretoria, South Africa, 2014; p. 44.
- Aarne, M.; Hautakangas, S. The Principles for Monitoring the Bioeconomy. Available online: https://www.luke.fi/wp-content/uploads/2018/03/The-principles-for-monitoring-the-bioeconomy_2.pdf (accessed on 15 May 2018).
- BIOTECHCORP. Bioeconomy Transformation Programme—Annual Report; Malaysian Biotechnology Corporation: Kuala Lumpur, Malaysia, 2015; p. 50. [Google Scholar]
- Meier, E. Nachhaltigkeitsbewertung: Logical Framework-Ansatz zur Kontextbezogenen Operationalisierung von Nachhaltigkeit auf Basis Gesellschaftlicher Nachhaltigkeitskonzepte. Ph.D. Thesis, University of Hamburg, Hamburg, Germany, 2014. [Google Scholar]
- Bao, Z.; Zhang, S.; Chen, Y.; Liu, S.; Zhang, Y.; Wang, H. A review of material flow analysis. In Proceedings of the 2010 International Conference on Management and Service Science, Wuhan, China, 24–26 August 2010. [Google Scholar]
- Huang, C.-L.; Vause, J.; Ma, H.-w.; Yu, C.-P. Using material/substance flow analysis to support sustainable development assessment: A literature review and outlook. Resour. Conserv. Recycl. 2012, 68, 104–116. [Google Scholar] [CrossRef]
- Martinico-Perez, M.F.G.; Schandl, H.; Tanikawa, H. Sustainability indicators from resource flow trends in the Philippines. Resour. Conserv. Recycl. 2018, 138, 74–86. [Google Scholar] [CrossRef]
- Dunuwila, P.; Rodrigo, V.H.L.; Goto, N. Financial and environmental sustainability in manufacturing of crepe rubber in terms of material flow analysis, material flow cost accounting and life cycle assessment. J. Clean. Prod. 2018, 182, 587–599. [Google Scholar] [CrossRef]
- Jacobi, N.; Haas, W.; Wiedenhofer, D.; Mayer, A. Providing an economy-wide monitoring framework for the circular economy in Austria: Status quo and challenges. Resour. Conserv. Recycl. 2018, 137, 156–166. [Google Scholar] [CrossRef]
- Tran, H.P.; Schaubroeck, T.; Nguyen, D.Q.; Ha, V.H.; Huynh, T.H.; Dewulf, J. Material flow analysis for management of waste TVs from households in urban areas of Vietnam. Resour. Conserv. Recycl. 2018, 139, 78–89. [Google Scholar] [CrossRef]
- Kalmykova, Y.; Rosado, L.; Patrício, J. Resource consumption drivers and pathways to reduction: Economy, policy and lifestyle impact on material flows at the national and urban scale. J. Clean. Prod. 2016, 132, 70–80. [Google Scholar] [CrossRef] [Green Version]
- Gurría, P.; Ronzon, T.; Tamosiunas, S.; López, R.; García Condado, S.; Guillén, J.; Cazzaniga, N.; Jonsson, K.; Banja, M.; Fiore, G.; et al. Biomass Flows in the European Union: The Sankey Biomass Diagram- towards a Cross-Set Integration of Biomass; JRC Working Papers JRC106502; Joint Research Centre (Seville Site): Sevilla, Spain, 2017; p. 71. [Google Scholar]
- Kalt, G. Biomass streams in Austria: Drawing a complete picture of biogenic material flows within the national economy. Resour. Conserv. Recycl. 2015, 95, 100–111. [Google Scholar] [CrossRef]
- Baum, S.; Baier, U. Biogene Güterflüsse der Schweiz 2006. Massen- und Energieflüsse; Bundesamt für Umwelt: Bern, Switzerland, 2008; p. 115. [Google Scholar]
- Kortesmaa, T.; Jokela, A.; Salo-Kauppinen, R. (Eds.) Finland’s wood flows in 2016. In E-Yearbook of Food and Natural Resources Statistics for 2017; Natural Resources Institute Finland (Luke): Helsinki, Finland, 2018; p. 98. [Google Scholar]
- Lenglet, J.; Courtonne, J.-Y.; Caurla, S. Material flow analysis of the forest-wood supply chain: A consequential approach for log export policies in France. J. Clean. Prod. 2017, 165, 1296–1305. [Google Scholar] [CrossRef] [Green Version]
- Weimar, H. Der Holzfluss in der Bundesrepublik Deutschland 2009: Methode und Ergebnis der Modellierung des Stoffflusses von Holz; Johann Heinrich von Thünen-Institut: Hamburg, Germany, 2011. [Google Scholar]
- Bösch, M.; Jochem, D.; Weimar, H.; Dieter, M. Physical input-output accounting of the wood and paper flow in Germany. Resour. Conserv. Recycl. 2015, 94, 99–109. [Google Scholar] [CrossRef]
- Mantau, U. Wood flow analysis: Quantification of resource potentials, cascades and carbon effects. Biomass Bioenergy 2015, 79, 28–38. [Google Scholar] [CrossRef]
- Weimar, H. Holzbilanzen 2015 bis 2017 für die Bundesrepublik Deutschland und Neuberechnung der Zeitreihe der Gesamtholzbilanz ab 1995; Johann Heinrich von Thünen-Institut: Braunschweig, Germany, 2018; p. 26. [Google Scholar]
- Hekkert, M.P.; Joosten, L.A.J.; Worrell, E. Analysis of the paper and wood flow in The Netherlands. Resour. Conserv. Recycl. 2000, 30, 29–48. [Google Scholar] [CrossRef]
- Ness, B.; Urbel-Piirsalu, E.; Anderberg, S.; Olsson, L. Categorising tools for sustainability assessment. Ecol. Econ. 2007, 60, 498–508. [Google Scholar] [CrossRef]
- The Updated Pan-European Indicators for Sustainable Forest Management; Forest Europe Liaison Unit Bratislava: Bratislava, Slovakia, 2016; p. 4.
- Sustainable Development Knowledge Platform. Available online: https://sustainabledevelopment.un.org/sdgs (accessed on 25 July 2018).
- Suter, F.; Steubing, B.; Hellweg, S. Life cycle impacts and benefits of wood along the value chain: The case of Switzerland. J. Ind. Ecol. 2017, 21, 874–886. [Google Scholar] [CrossRef] [Green Version]
- Mehr, J.; Vadenbo, C.; Steubing, B.; Hellweg, S. Environmentally optimal wood use in Switzerland—Investigating the relevance of material cascades. Resour. Conserv. Recycl. 2018, 131, 181–191. [Google Scholar] [CrossRef]
- Kayo, C.; Dente, S.M.R.; Aoki-Suzuki, C.; Tanaka, D.; Murakami, S.; Hashimoto, S. Environmental impact assessment of wood use in Japan through 2050 using material flow analysis and life cycle assessment. J. Ind. Ecol. 2019, 23, 635–648. [Google Scholar] [CrossRef]
- Kloepffer, W. Life cycle sustainability assessment of products. Int. J. Life Cycle Assess. 2008, 13, 89. [Google Scholar] [CrossRef]
- Guinée, J. Life cycle sustainability assessment: What is it and what are its challenges? In Taking Stock of Industrial Ecology; Clift, R., Druckman, A., Eds.; Springer International Publishing: Cham, Switzerland, 2016; pp. 45–68. [Google Scholar]
- Martin, M.; Røyne, F.; Ekvall, T.; Moberg, Å. Life cycle sustainability evaluations of bio-based value chains: Reviewing the indicators from a swedish perspective. Sustainability 2018, 10, 547. [Google Scholar] [CrossRef] [Green Version]
- Christ, K.; Burritt, R. Material flow cost accounting: A review and agenda for future research. J. Clean. Prod. 2014, 108, 1378–1389. [Google Scholar] [CrossRef]
- Schmidt, A.; Götze, U.; Sygulla, R. Extending the scope of Material Flow Cost Accounting—Methodical refinements and use case. J. Clean. Prod. 2015, 108, 1320–1332. [Google Scholar] [CrossRef]
- Wohlgemuth, V.; Lütje, A. Using the Method of Material Flow Cost Accounting (MFCA) to Quantify Industrial Organic Waste Streams for Energetic Utilization. 2018. Available online: https://www.researchgate.net/profile/Volker_Wohlgemuth/publication/329118375_Using_the_Method_of_Material_Flow_Cost_Accounting_MFCA_to_quantify_Industrial_Organic_Waste_Streams_for_Energetic_Utilization/links/5bf686714585150b2bc9413e/Using-the-Method-of-Material-Flow-Cost-Accounting-MFCA-to-quantify-Industrial-Organic-Waste-Streams-for-Energetic-Utilization.pdf (accessed on 20 March 2020).
- Wood, R.; Hertwich, E. Economic modelling and indicators in life cycle sustainability assessment. Int. J. Life Cycle Assess. 2012, 18. [Google Scholar] [CrossRef]
- Nørup, N.; Pihl, K.; Damgaard, A.; Scheutz, C. Evaluation of a European textile sorting centre: Material flow analysis and life cycle inventory. Resour. Conserv. Recycl. 2019, 143, 310–319. [Google Scholar] [CrossRef]
- Sadhukhan, J.; Martinez-Hernandez, E. Material flow and sustainability analyses of biorefining of municipal solid waste. Bioresour. Technol. 2017, 243, 135–146. [Google Scholar] [CrossRef] [Green Version]
- Martinico-Perez, M.F.G.; Schandl, H.; Fishman, T.; Tanikawa, H. The socio-economic metabolism of an emerging economy: Monitoring progress of decoupling of economic growth and environmental pressures in the Philippines. Ecol. Econ. 2018, 147, 155–166. [Google Scholar] [CrossRef]
- Gujba, H.; Mulugetta, Y.; Azapagic, A. Environmental and economic appraisal of power generation capacity expansion plan in Nigeria. Energy Policy 2010, 38, 5636–5652. [Google Scholar] [CrossRef]
- Dubois-Iorgulescu, A.-M.; Saraiva, A.K.E.B.; Valle, R.; Rodrigues, L.M. How to define the system in social life cycle assessments? A critical review of the state of the art and identification of needed developments. Int. J. Life Cycle Assess. 2018, 23, 507–518. [Google Scholar] [CrossRef]
- Russo Garrido, S.; Parent, J.; Beaulieu, L.; Revéret, J.-P. A literature review of type I SLCA—Making the logic underlying methodological choices explicit. Int. J. Life Cycle Assess. 2018, 23, 432–444. [Google Scholar] [CrossRef]
- Hosseinijou, S.A.; Mansour, S.; Akbarpour Shirazi, M. Social life cycle assessment for material selection: A case study of building materials. Int. J. Life Cycle Assess. 2014, 19. [Google Scholar] [CrossRef]
- Wu, R.; Yang, D.; Chen, J. Social life cycle assessment revisited. Sustainability 2014, 6, 4200–4226. [Google Scholar] [CrossRef] [Green Version]
- Stamford, L.; Azapagic, A. Life cycle sustainability assessment of electricity options for the UK. Int. J. Energy Res. 2012, 36, 1263–1290. [Google Scholar] [CrossRef]
- Albrecht, S.; Brandstetter, P.; Beck, T.; Fullana-i-Palmer, P.; Grönman, K.; Baitz, M.; Deimling, S.; Sandilands, J.; Fischer, M. An extended life cycle analysis of packaging systems for fruit and vegetable transport in Europe. Int. J. Life Cycle Assess. 2013, 18, 1549–1567. [Google Scholar] [CrossRef]
- Menikpura, N.; Gheewala, S.; Bonnet, S. Framework for life cycle sustainability assessment of municipal solid waste management systems with an application to a case study in Thailand. Waste Manag. Res. 2012, 30, 708–719. [Google Scholar] [CrossRef] [PubMed]
- Vinyes, E.; Oliver-Solà, J.; Ugaya, C.; Rieradevall, J.; Gasol, C.M. Application of LCSA to used cooking oil waste management. Int. J. Life Cycle Assess. 2013, 18, 445–455. [Google Scholar] [CrossRef]
- Onat, N.C.; Kucukvar, M.; Tatari, O. Integrating triple bottom line input–output analysis into life cycle sustainability assessment framework: The case for US buildings. Int. J. Life Cycle Assess. 2014, 19, 1488–1505. [Google Scholar] [CrossRef]
- Päivinen, R.; Lindner, M.; Rosén, K.; Lexer, M.J. A concept for assessing sustainability impacts of forestry-wood chains. Eur. J. For. Res. 2012, 131, 7–19. [Google Scholar] [CrossRef]
- Spierling, S.; Knüpffer, E.; Behnsen, H.; Mudersbach, M.; Krieg, H.; Springer, S.; Albrecht, S.; Herrmann, C.; Endres, H.-J. Bio-based plastics—A review of environmental, social and economic impact assessments. J. Clean. Prod. 2018, 185, 476–491. [Google Scholar] [CrossRef]
- Aldaya, M.M.; Chapagain, A.K.; Hoekstra, A.Y.; Mekonnen, M.M. The Water Footprint Assessment Manual. Elektronische Ressource. Setting the Global Standard; Earthscan: London, UK, 2012; p. 203. [Google Scholar]
- O’Brien, M.; Bringezu, S. European timber consumption: Developing a method to account for timber flows and the EU’s global forest footprint. Ecol. Econ. 2018, 147, 322–332. [Google Scholar] [CrossRef]
- Egenolf, V.; Bringezu, S. Conceptualization of an indicator system for assessing the sustainability of the bioeconomy. Sustainability 2019, 11, 443. [Google Scholar] [CrossRef] [Green Version]
- Iost, S.; Labonte, N.; Banse, M.; Geng, N.; Jochem, D.; Schweinle, J.; Weber, S.; Weimar, H. German bioeconomy: Economic importance and concept of measurement. Ger. J. Agric. Econ. 2019, 68, 275–288. [Google Scholar]
- Eurostat What Are Economy-Wide Material Flow Accounts (EW-MFA) and What Are They for? Available online: https://ec.europa.eu/eurostat/web/environment/material-flows-and-resource-productivity (accessed on 15 January 2019).
- Mayring, P. Qualitative Content Analysis: Theoretical Foundation, Basic Procedures and Software Solution; GESIS: Klagenfurt, Austria, 2014. [Google Scholar]
- Moretti, F.; van Vliet, L.; Bensing, J.; Deledda, G.; Mazzi, M.; Rimondini, M.; Zimmermann, C.; Fletcher, I. A standardized approach to qualitative content analysis of focus group discussions from different countries. Patient Educ. Couns. 2011, 82, 420–428. [Google Scholar] [CrossRef] [PubMed] [Green Version]
- ISO. International Standard ISO 14040:2006 - Environmental Management—Life Cycle Assessment: Principles and Framework; International Standard Organisation: Geneva, Switzerland, 2006. [Google Scholar]
- DESTATIS. Güterverzeichnis für Produktionsstatistiken, Ausgabe 2009 – Erläuterungen; Bundesamt, S., Ed.; Statistische Ämter des Bundes und der Länder: Wiesbaden, Germany, 2012.
- Fellings and Use of Roundwood. Available online: https://www.thuenen.de/en/wf/figures-facts/production-and-use/fellings-and-roundwood-use/ (accessed on 7 November 2018).
- Scholtes, R.; Jansen, K. Vergelijkend LCA Onderzoek Houten en Kunststof Pallets; Nederlands Instituut voor Bouwbiologie en Ecologie: Bussum, The Netherlands, 2014; p. 97. [Google Scholar]
- FEFPEB Facts & Figures. Available online: https://www.fefpeb.eu/cms/files/Factsheets/facts-figures.pdf (accessed on 17 May 2019).
- Döring, P.; Glasenapp, S.; Mantau, U. Rohstoffmonitoring Holz: Holzwerkstoffindustrie 2015: Entwicklung der Produktionskkapazität und Holzrohstoffnutzung; Universität Hamburg, Zentrum Holzwirtschaft Arbeitsbereich, Ökonomie der Holz-und Forstwirtschaft: Hamburg, Germany, 2017; p. 24. [Google Scholar]
- Meinlschmidt, P.; Mauruschat, D.; Briesemeister, R. Altholzsituation in Europa und Deutschland. Chem. Ing. Tech. 2016, 88, 475–482. [Google Scholar] [CrossRef]
- Döring, P.; Weimar, H.; Mantau, U. Rohstoffmonitoring Holz: Einsatz von Holz in Biomasse-Großfeuerungsanlagen 2016; Universität Hamburg, Zentrum Holzwirtschaft Arbeitsbereich, Ökonomie der Holz-und Forstwirtschaft: Hamburg, Germany, 2018; p. 23. [Google Scholar]
- Schüler, K. Aufkommen und Verwertung von Verpackungsabfällen in Deutschland im Jahr 2014; Texte 64/2016; Umweltbundesamt: Dessau-Roßlau, Germany, 2016; p. 165.
- Schüler, K. Aufkommen und Verwertung von Verpackungsabfällen in Deutschland im Jahr 2016; Texte 58/2018; Umweltbundesamt: Dessau-Roßlau, Germany, 2018; p. 164.
- Döring, P.; Cords, M.; Mantau, U. Rohstoffmonitoring Holz: Altholz im Entsorgungsmarkt: Aufkommen und Verwertung 2016; Universität Hamburg, Zentrum Holzwirtschaft Arbeitsbereich, Ökonomie der Holz-und Forstwirtschaft: Hamburg, Germany, 2018; p. 20. [Google Scholar]
- Eurostat, Structural Business Statistics. Annual detailed enterprise statistics for industry (NACE Rev. 2, B-E) (sbs_na_ind_r2). In Annual, 02.02.2018 ed.; Eurostat: Luxemburg, 2010. [Google Scholar]
- Eurostat, Structural Business Statistics. Annual detailed enterprise statistics for industry (NACE Rev. 2, B-E) (sbs_na_ind_r2). In Annual, 02.02.2018 ed.; Eurostat: Luxemburg, 2015. [Google Scholar]
- Rosenkranz, L. Produktionswert der forstwirtschaft leicht rückläufig: Ergebnisse der forstwirtschaftlichen gesamtrechnung 2016—Nettounternehmensgewinn weiterhin auf hohem Niveau. Holz-Zentralblatt 2018, 144, 383. [Google Scholar]
- Eurostat Labor Force Survey, Employment in Forestry and Forest-Based Industry (for_emp_lfs) for 2010. Available online: https://ec.europa.eu/eurostat/web/lfs/data/database (accessed on 29 August 2018).
- Eurostat Labor Force Survey, Employment in Forestry and Forest-Based Industry (for_emp_lfs) for 2015. Available online: https://ec.europa.eu/eurostat/web/lfs/data/database (accessed on 29 August 2018).
- DESTATIS. Earnings Survey 2015. Special Report Made upon Request; DESTATIS: Wiesbaden, Germany, 2018.
- DESTATIS. Earnings Survey 2010. Special Report Made upon Request; DESTATIS: Wiesbaden, Germany, 2018.
- DESTATIS. Structural Earnings Survey 2014. Special Report Made upon Request; DESTATIS: Wiesbaden, Germany, 2018.
- Handbook on Life Cycle Assessment: Operational Guide to the ISO Standards; Kluwer Acad. Publ.: New York, NY, USA, 2002.
- Ronzon, T.; M’Barek, R. Socioeconomic indicators to monitor the EU’s bioeconomy in transition. Sustainability 2018, 10, 1745. [Google Scholar] [CrossRef] [Green Version]
- Eurostat Structural Business Statistics (sbs)—Reference Metadata in Euro SDMX Metadata Structure (ESMS). Available online: https://ec.europa.eu/eurostat/cache/metadata/de/sbs_esms.htm#unit_measure1522826040118 (accessed on 15 October 2018).
- Jochem, D.; Weimar, H.; Bösch, M.; Mantau, U.; Dieter, M. Estimation of wood removals and fellings in Germany: A calculation approach based on the amount of used roundwood. Eur. J. For. Res. 2015, 134, 869–888. [Google Scholar] [CrossRef]
- EPAL Hardfacts System. Available online: https://www.epal-pallets.org/das-erfolgssystem/epal-system/ (accessed on 6 May 2019).
- Bonisoli, L.; Galdeano-Gómez, E.; Piedra-Muñoz, L. Deconstructing criteria and assessment tools to build agri-sustainability indicators and support farmers’ decision-making process. J. Clean. Prod. 2018, 182, 1080–1094. [Google Scholar] [CrossRef]
- O’Brien, M.; Wechsler, D.; Bringezu, S.; Schaldach, R. Toward a systemic monitoring of the European bioeconomy: Gaps, needs and the integration of sustainability indicators and targets for global land use. Land Use Policy 2017, 66, 162–171. [Google Scholar] [CrossRef]
- Galli, A.; Wiedmann, T.; Ercin, E.; Knoblauch, D.; Ewing, B.; Giljum, S. Integrating ecological, carbon and water footprint into a “Footprint Family” of indicators: Definition and role in tracking human pressure on the planet. Ecol. Ind. 2012, 16, 100–112. [Google Scholar] [CrossRef]
- Deutsche Nachhaltigkeitsstrategie; Die Bundesregierung: Berlin, Germany, 2016; p. 256.
- Vallance, S.C.; Perkins, H.; Dixon, J. What Is Social Sustainability? A Clarification of Concepts. Geoforum 2011, 42, 342–348. [Google Scholar] [CrossRef]
- Hugé, J.; Waas, T.; Dahdouh-Guebas, F.; Koedam, N.; Block, T. A discourse-analytical perspective on sustainability assessment: Interpreting sustainable development in practice. Sustain. Sci. 2013, 8, 187–198. [Google Scholar] [CrossRef]
- Gibson, R.B. Beyond the pillars: Sustainability assessment as a framework for effective integration of social, economic and ecological considerations in significant decision-making. J. Environ. Assess. Policy Manag. 2006, 8, 259–280. [Google Scholar] [CrossRef]


| Component | Weight in kg | Volume in m³ |
|---|---|---|
| Total weight | 22.1 | 0.0444 |
| Softwood lumber | 15.8 | 0.0331 |
| Particle board blocks | 5.8 | 0.0113 |
| Nails | 0.5 |
| Sustainability Indicators | Data Sources |
|---|---|
| Environmental | |
| Global Warming Potential | Scholtes and Jansen [70] |
| Eutrophication Potential | Scholtes and Jansen [70] |
| Economic | |
| Production Value | Eurostat [78,79], Rosenkranz [80] |
| Value Added at Factor Cost | Eurostat [78,79], Rosenkranz [80] |
| Social | |
| Number of Persons Employed | Eurostat [78,79,81,82] |
| Average Annual Earnings | DESTATIS [83,84,85] |
| Processing Steps | Softwood Weight million t | ||
|---|---|---|---|
| 2010 | 2015 | ||
| Forest production | Softwood removals | 20.686 | 19.061 |
| 1st processing | Sawmilling | 13.609 | 13.095 |
| 2nd processing | Wood packaging | 2.128 | 2.624 |
| End product | Flat pallets (EPAL 1) | 1.048 | 1.316 |
| EPAL 1 (softwood and wood particle blocks) | 0.978 | 1.228 | |
| EPAL 1 (softwood only) | 0.070 | 0.088 | |
| Stock in use | EPAL 1 (softwood and wood particle blocks) | 5.349 | 6.605 |
| EPAL 1 (softwood only) | 0.385 | 0.475 | |
| Repair | EPAL 1 (softwood and wood particle blocks) | 0.175 | 0.217 |
| EPAL 1 (softwood only) | 0.009 | 0.011 | |
| Post-use (material) | EPAL 1 (softwood and wood particle blocks) | 0.253 | 0.252 |
| EPAL 1 (softwood only) | 0.018 | 0.019 | |
| Post-use (energy) | EPAL 1 (softwood and wood particle blocks) | 0.515 | 0.511 |
| EPAL 1 (softwood only) | 0.037 | 0.037 | |
| EPAL 1 Pallet Type | Impact of Production, Use, and Disposal per t EPAL 1 Pallet | Impact of Production, Use, and Disposal of the Total Amount of EPAL 1 Pallets in GERMANY | ||||
|---|---|---|---|---|---|---|
| GWP t CO2 eq. | Eutrophication kg PO4−3 eq. | GWP thousand t CO2 eq. | Eutrophication t PO4−3 eq. | |||
| Year | 2010 | 2015 | 2010 | 2015 | ||
| EPAL 1 (softwood lumber only) | 1.06 | 1.68 | 76 | 100 | 112 | 138 |
| EPAL 1 (softwood and wood particle blocks) | 1.21 | 1.76 | 1648 | 2160 | 2237 | 2774 |
| Total | 1724 | 2261 | 2349 | 2912 | ||
© 2020 by the authors. Licensee MDPI, Basel, Switzerland. This article is an open access article distributed under the terms and conditions of the Creative Commons Attribution (CC BY) license (http://creativecommons.org/licenses/by/4.0/).
Share and Cite
Schweinle, J.; Geng, N.; Iost, S.; Weimar, H.; Jochem, D. Monitoring Sustainability Effects of the Bioeconomy: A Material Flow Based Approach Using the Example of Softwood Lumber and Its Core Product Epal 1 Pallet. Sustainability 2020, 12, 2444. https://0-doi-org.brum.beds.ac.uk/10.3390/su12062444
Schweinle J, Geng N, Iost S, Weimar H, Jochem D. Monitoring Sustainability Effects of the Bioeconomy: A Material Flow Based Approach Using the Example of Softwood Lumber and Its Core Product Epal 1 Pallet. Sustainability. 2020; 12(6):2444. https://0-doi-org.brum.beds.ac.uk/10.3390/su12062444
Chicago/Turabian StyleSchweinle, Jörg, Natalia Geng, Susanne Iost, Holger Weimar, and Dominik Jochem. 2020. "Monitoring Sustainability Effects of the Bioeconomy: A Material Flow Based Approach Using the Example of Softwood Lumber and Its Core Product Epal 1 Pallet" Sustainability 12, no. 6: 2444. https://0-doi-org.brum.beds.ac.uk/10.3390/su12062444