Article

Prediction of the Number of and Care Costs for Disabled Elderly from 2020 to 2050: A Comparison between Urban and Rural Areas in China

1
State Key Laboratory of Molecular Vaccinology and Molecular Diagnostics, School of Public Health, Xiamen University, Xiamen 361102, China
2
Key Laboratory of Health Technology Assessment of Fujian Province University, School of Public Health, Xiamen University, Xiamen 361102, China
3
School of Economics, Xiamen University, Xiamen 361006, China
*
Author to whom correspondence should be addressed.
Sustainability 2020, 12(7), 2598; https://0-doi-org.brum.beds.ac.uk/10.3390/su12072598
Submission received: 22 February 2020 / Revised: 11 March 2020 / Accepted: 24 March 2020 / Published: 25 March 2020
(This article belongs to the Special Issue Sustainability of Fiscal Policy)

Abstract

:
An aging population and an increase in the proportion of elderly people who are disabled have created an unprecedented global challenge, especially in China. This study aimed to predict the number of, and the care costs for, disabled elderly from 2020 to 2050 in China. A comparison was made between urban and rural areas, and we analyzed what must be done to maintain the sustainable development of China’s long-term care insurance (LTCI) system. An overall simulation model and a Monte Carlo simulation were used to estimate the number of disabled elderly and their related care costs, in both urban and rural areas. According to the forecast, the total disabled population will increase rapidly, rising from 43.75 million in 2020 to 91.4 million in 2050. Of that total, 69.7% are expected to be urban elderly. Starting in 2020, the growth rates of the elderly with mild, moderate, and severe disabilities will be 108%, 104%, and 120%, respectively, by 2050. Accordingly, the total care costs will increase from 538.0 billion yuan in 2020 to 8530.8 billion yuan in 2050, of which 80.2% will be required in urban areas. In addition, the per capita costs of care in urban and rural areas in 2050 will be 6 times and 11 times higher than in 2020, respectively. The predicted results show that the number of disabled elderly and the related care costs will increase sharply from 2020 to 2050, especially the growth rate of the number of severely disabled elderly. This study provides strong evidence of the need for the establishment of a unified national LTCI system in China.

1. Introduction

China is a developing country with the largest population in the world [1]. According to the National Bureau of Statistics of China, 249 million people were aged over 60 years at the end of 2018 in China, accounting for 17.9% of the total population [2]. The number of disabled elderly exceeded 44 million, accounting for 19.1% of the total elderly population [3]. It is believed that an aging population will significantly increase the need for long-term care (LTC) and will require more public expenditure due to increasing disability trends [4,5]. With the change of family structure and the weakening of traditional support functions, traditional home-based care is unsustainable. The LTC of the disabled elderly places an economic and care burden on individuals and their families. This has become a common risk faced by society; elderly care also presents a significant challenge to the social insurance system. Predicting how the demand and costs of LTC will grow in the future is of great significance, if China is to meet the care needs of its disabled elderly and establish a unified national long-term care insurance (LTCI) system.

1.1. LTCI in China and Other Countries

The issue of LTC is receiving significant attention from academia and governments, due to the belief that an aging population will greatly increase the demand for LTC services and require huge public expenses [6]. Faced with an aging population, many countries have taken corresponding appropriate measures. Some countries have opted for national LTCI systems (e.g. Germany, Japan, and Korea). Some rely on self-funding, private LTCI, and a safety net of public funds as the final means of payment (e.g. the United States).
Since 1995, Germany has been implementing a public program that provides universal support for the costs of long-term services and support (LTSS) [7]. The most significant feature of the German LTCI program is its universal coverage. In Germany, LTCI participants are not only elderly people; the program includes all citizens, and participation in the scheme is mandatory. In order to ensure the financial sustainability of their LTCI program, the German insurance rate has been continuously adjusted, changing from 1% when the system was launched, to 2.55% in 2017 [8].
Japan implemented a national LTCI plan for citizens aged 65 and over in 2000, to ensure that all senior citizens’ needs are met. With a rapidly aging population, the number of elderly people in need of care was increasing. From 2000 to 2005, the costs of LTC services in Japan rose rapidly. Japan reformed its LTCI system in 2005, adjusting the income and expenditure of the fund [9]. In addition, the National Social Security Commission (2006) estimated that the costs of LTCI will continue to explode in the future, increasing from 19 to 24 trillion yen by FY2025 (i.e., from 3.2% to 4.1% of GDP). As LTC costs continue to rise, the LTCI system in Japan will face increasingly difficult sustainability issues in the future [10].
With a rapidly aging population, changes in family structure, and an increasing number of women in the labor force, the demand for LTC has also been increasing in Korea [11]. In July 2008, Korea implemented its own LTCI system, in order to protect older people from the costs of LTC. The LTCI scheme covers the population aged 65 and over, as well as citizens younger than 65 with the most severe needs [12]. In the development of LTCI, the lack of care personnel and facilities has become an obstacle to the financing of public LTCI in Korea. If unresolved, this will have a significant impact on the financial sustainability of LTCI in Korea [13].
The LTCI system in the United States is mainly composed of a public Medicaid program and the private insurance market [14]. The public Medicaid program in the United States cannot meet the total costs of the participants’ care, which has set the stage for a private LTCI market. Due to adverse selection issues, it is impossible to provide people with a premium structure that will meet the sustainability requirements. As such, the United States will face substantial sustainability problems in the future provision of LTC [6].
In China, the scale and growth rate of disabled elderly have brought a heavy burden to the development of China’s pension industry. In order to deal with the risk of disability, the Chinese government piloted the national LTCI system, based on the experience of developed countries such as Germany and Japan. In 2016, China published the “Guideline on Carrying out an LTCI System Pilot”, which focuses on the basic living and medical care costs of the severely disabled elderly [15]. The LTCI scheme has been piloted in fifteen cities, covering more than 38 million older people [16,17]. At present, however, China has not yet formed a unified national LTCI system, and the abovementioned pilot cities have implemented LTCI policies based on their own economic conditions. What should be included in the LTCI system in the future—or what is worth learning from the pilot experience to date—is not clear at present [18]. One of the greatest challenges to China’s LTCI development is the mobilization of sufficient funds [19,20]. Therefore, any information on how much will be needed to pay for LTCI is crucial for Chinese policy makers attempting to design a sustainable LTCI financing policy. As such, the measurement of LTC costs is one of the most important research topics, both today and in the future [21].

1.2. Previous Research

With the acceleration of the global aging process, foreign scholars have begun to pay closer attention to LTC services that might be used by the elderly, as well as how to design sustainable financing policies for LTCI. Scholars believe that as people age, the probability of chronic diseases increases, and the self-care ability of the elderly gradually declines. This combination of factors brings about a more urgent demand for LTC services [22,23]. At the same time, scholars have begun to focus on predicting the number of disabled elderly and the associated costs of their care. The Personal Social Services Research Unit (PSSRU) LTC finance model makes projections of future LTC demand and expenditures. The PSSRU predicts that in the United Kingdom, LTC services will have expanded by 31% between 1995 and 2031 [24]. Garber predicted the demand for beds in nursing homes in the United States by simulating the transition of the elderly population between different health conditions [25]. Harewl used the same method to predict the number of the elderly under a defined health status and medical service plan [26]. In addition, using a microsimulation model named the Integrated Analytical Model for Household Simulation (INAHSIM), Fukawa conducted a household projection in Japan for the period from 2010 to 2050 [27].
A rapidly aging population, coupled with changes in family structure, increases the financial burden placed on the government. In order to predict the number of disabled elders in China, a number of previous studies used a macro-model to predict the care needs of the elderly [28,29]. Other studies used microdata combined with a health status transfer and multi-state life table to predict the care needs [30,31]. The results all show that the number of disabled elderly and the demand for LTC services will increase rapidly in the future. In general, the average demand rate of daily life care for the elderly in China is stable at 50% to 60%; the average demand for daily life care for elderly women is 10% higher than for men [32].
It can be seen that, in recent years, the numbers of studies on the costs of elderly care in China have gradually increased. These studies not only analyze the influencing factors of the costs of elderly care, but they also make predictions on future development trends, which in turn play an important role for governments trying to formulate policies that will cope with the challenge of an aging population [33]. At the same time, previous research has been relatively limited by the lack of relevant statistical data, such that pertaining to the rate of disability, the proportion of use of different care types, and the costs of disability care and other baseline data. These studies also lack adequate research into the prediction of the number of disabled elderly, and the associated costs of their care, in urban and rural areas in China [34,35]. Therefore, this study intends to use the Chinese statistical yearbook, census data, and national survey database to predict the disability scale of the elderly in China and the associated care costs in both urban and rural areas. The aim is to provide the evidence-based basis for establishing an LTCI system that is suitable for China’s national conditions, and that will ensure the sustainable development of the LTCI system.

2. Materials and Methods

2.1. Data Sources

2.1.1. Demographic Data

In this study, the Population Administration Decision Information System (PADIS) developed by China’s Population and Development Research Center was used to predict the number of the elderly in China from 2020 to 2050. The baseline data were taken from the sixth nationwide population census data of 2010, and the assumptions of population prediction were derived from historical studies [36]. Compared with the data of China’s future population predicted by the United Nations, the error rate predicted by the system was less than 1%, and the accuracy was higher. The results are shown in Table 1.
As can be seen from Figure 1, the number of elderly people (aged 65 and over) in China will increase approximately 2 times, from 174.36 million in 2020 to 345.68 million in 2050. The predicted results showed that in 2020, the number of elderly people (aged 65 and over) in urban and rural areas will be 80.59 million and 93.76 million respectively, and will reach 215.34 million and 130.35 million respectively by 2050. Among them, people aged 65–69 years in urban areas had higher numbers than those of other age groups.

2.1.2. Disability Rate

As a potential LTC demand group, the scale and development trend of the disabled elderly is an important basis for meeting the demand for LTC and for developing the future LTCI system. Considering the survey time and data availability, this study used the data of the seventh Chinese Longitudinal Health Long Distance Survey (CLHLS), conducted in 2014. The survey included information relating to 7410 elderly people (aged over 65). Excluding the missing value and those under the age of 65 (85 people), the total sample size was 7107 (including 3187 urban elderly, or 44.84% of the total). We divided the different states of disabled elderly into the following three categories based on the Katz’s Activities of Daily Living (ADL) Scale: mild disability, moderate disability, and severe disability [37]. Equation (1) was used to calculate the disability rate of the elderly at all ages, where P i ( t ) referred to the proportion of disability level of the elderly in each age group; m i referred to the number of people with disability level i in each age group, and   m i referred to the total number of elderly people of all ages.
P i ( t ) = m i   m i
The total number of disabled elderly was 1270 (or 12.27% of the total). The number of disabled elderly aged 85 and over was the highest, accounting for 51.53% of the total elderly population after calculation. At the same time, due to the fact that the survey data of the CLHLS was over-proportionally sampled for the elderly, the sample results were weighted by the number of the actual age group population in each year when calculating the total sample disability rate. Table 2 shows the disability rate and the distribution of the elderly in different age groups in 2014. The disability rate of the elderly at different disability levels increases in line with age, ranging from 3.06% of those aged 65–69, to 28.43% of those aged 85 and above. Finally, the weighted mean disability rate of the elderly aged 65 and over was 17.87% in 2014. In addition, the growth rate is set as ±1% in this study, because of the differences in the disability rates found in previous research.

2.1.3. Proportion of Different Types of Care

Taiwan established its own LTCI system in 2008. According to data from Taiwan’s Ministry of Health and Welfare in 2016, the proportions of elderly people with mild, moderate and severe disability who chose community home-based care were 81.26%, 71.59%, and 62.45%, respectively, while the proportions of those who chose institutional care were 18.74%, 28.41%, and 37.55%, respectively [38]. As the number of disabled elderly increased, the proportion of those who chose community home-based care decreased, while the proportion of those who chose institutional care increased. Considering the cross-strait groups have similarities in terms of geographical environment, traditional concepts, customs and habits, and the proportions of different types of care are similar to the "9073" care model (90% of disabled elderly are cared for by their families, 7% of them are cared for by community home-based services, and 3% of them are cared for by institutions) advocated by China in recent years, this study adopts the proportion of LTC service in Taiwan in 2016.

2.1.4. Costs of LTC for Disabled Elderly

Compared with other provinces in China, Shanghai piloted their LTC system earlier, and perhaps for this reason, the community home-based care in Shanghai is better than elsewhere. Therefore, this study was based on the latest statistical data of the Shanghai Municipal Government and the National Bureau of Statistics [39,40]. The costs of community home-based care were measured by the accounting method. The costs of institutional care were measured by the project allocation method, adjusted according to the ratio of GDP per capita between Shanghai and the whole country. We assumed that the economic growth rate is synchronized with the income level of urban workers and that the average annual growth rate of the per capita income of urban employees in 2014–2019 is 7%, 6% in 2020–2030, and 4% in 2031–2050 [41]. In addition, considering the continuous increase of the urbanization rate in China, we assumed that the annual growth rate of rural residents’ per capita income would be maintained at 7%. Based on these assumptions, the monthly costs of the different levels and types of care in urban and rural areas in 2014 could be calculated.

2.2. Statistical Analysis

The projection of the financial needs of LTCI depends on the total population of the elderly, the rate of disability, the level of care, the choice of care types, and the impact of related variables, such as the costs of direct/indirect care in different types of care. In previous research, individual simulation models and overall simulation models were often used to project the financial needs of LTCI. The former type of model uses individual data as a unit to estimate the overall financial needs. Although this model can avoid the errors caused by total calculations, the costs of individual data acquisition are higher. The data of the overall simulation model mainly comes from the overall data, which can solve the problem of individual data being difficult to obtain. China has just begun to implement the LTCI system; a unified socialized old-age service system has not yet been formed. Therefore, it is again difficult to obtain the individual data. Therefore, we used the overall simulation model to predict the financial needs of LTCI in China during the period from 2020 to 2050. The overall simulation model of LTCI financial needs is shown in Equation (2):
T N ( t ) = i = 1 m j = 1 n L ( t ) × P i ( t ) × U i j ( t ) × C i j ( t ) × ( 1 + f j ( t ) )
where T N ( t ) refers to the total financial needs of LTCI for t years; L ( t ) refers to the number of elderly people in t years; P i ( t ) refers to the proportion of elderly with care level i for the elderly in t years; U i j ( t ) refers to the utilization ratio of type j care for the elderly with care level i in t years; C i j ( t ) . refers to the costs of using type j care for the elderly with care level i in t years; and f j ( t ) refers to the growth rate of type j care costs in t years. Also, i = 1 m j = 1 n I ( t ) × P i ( t ) × U i j ( t ) × S i j ( t ) refers to the costs of care for the disabled elderly in t years.
The Monte Carlo simulation type is based on the random number and probability statistics theory. It is to test each random variable that makes up the simulation model by random sampling to obtain the variation trend of the variable. It is also a numerical calculation type that has been widely used up till now. Complex objects can be transformed into simulation calculations of random numbers and digital characteristics, simplifying the study problem in essence and obtaining solutions with good properties [42]. In view of the above-mentioned LTCI financial needs model involving complex variables, we used a Monte Carlo simulation to predict the macro and micro variables in the overall simulation model. The number of simulations was set to 4000 times, according to previous researches [43], to obtain the best effect.

3. Results

3.1. Disability Rate and Its Distribution

Table 3 shows the disability rates and distribution of the elderly in urban and rural areas in 2014. The weighted mean disability rates of the elderly with mild, moderate, and severe disability in urban areas were 19.83%, 5.48%, and 4.29%, respectively. The weighted mean disability rates of the elderly in rural areas were 14.53%, 4.53%, and 2.16%, respectively. The mild disability rate of the 65–69-year-old group in urban areas was 12.96%, which was significantly higher than that of other disability groups (P < 0.001). In addition, in both urban and rural areas, the rate of disability increased with age (P < 0.001).

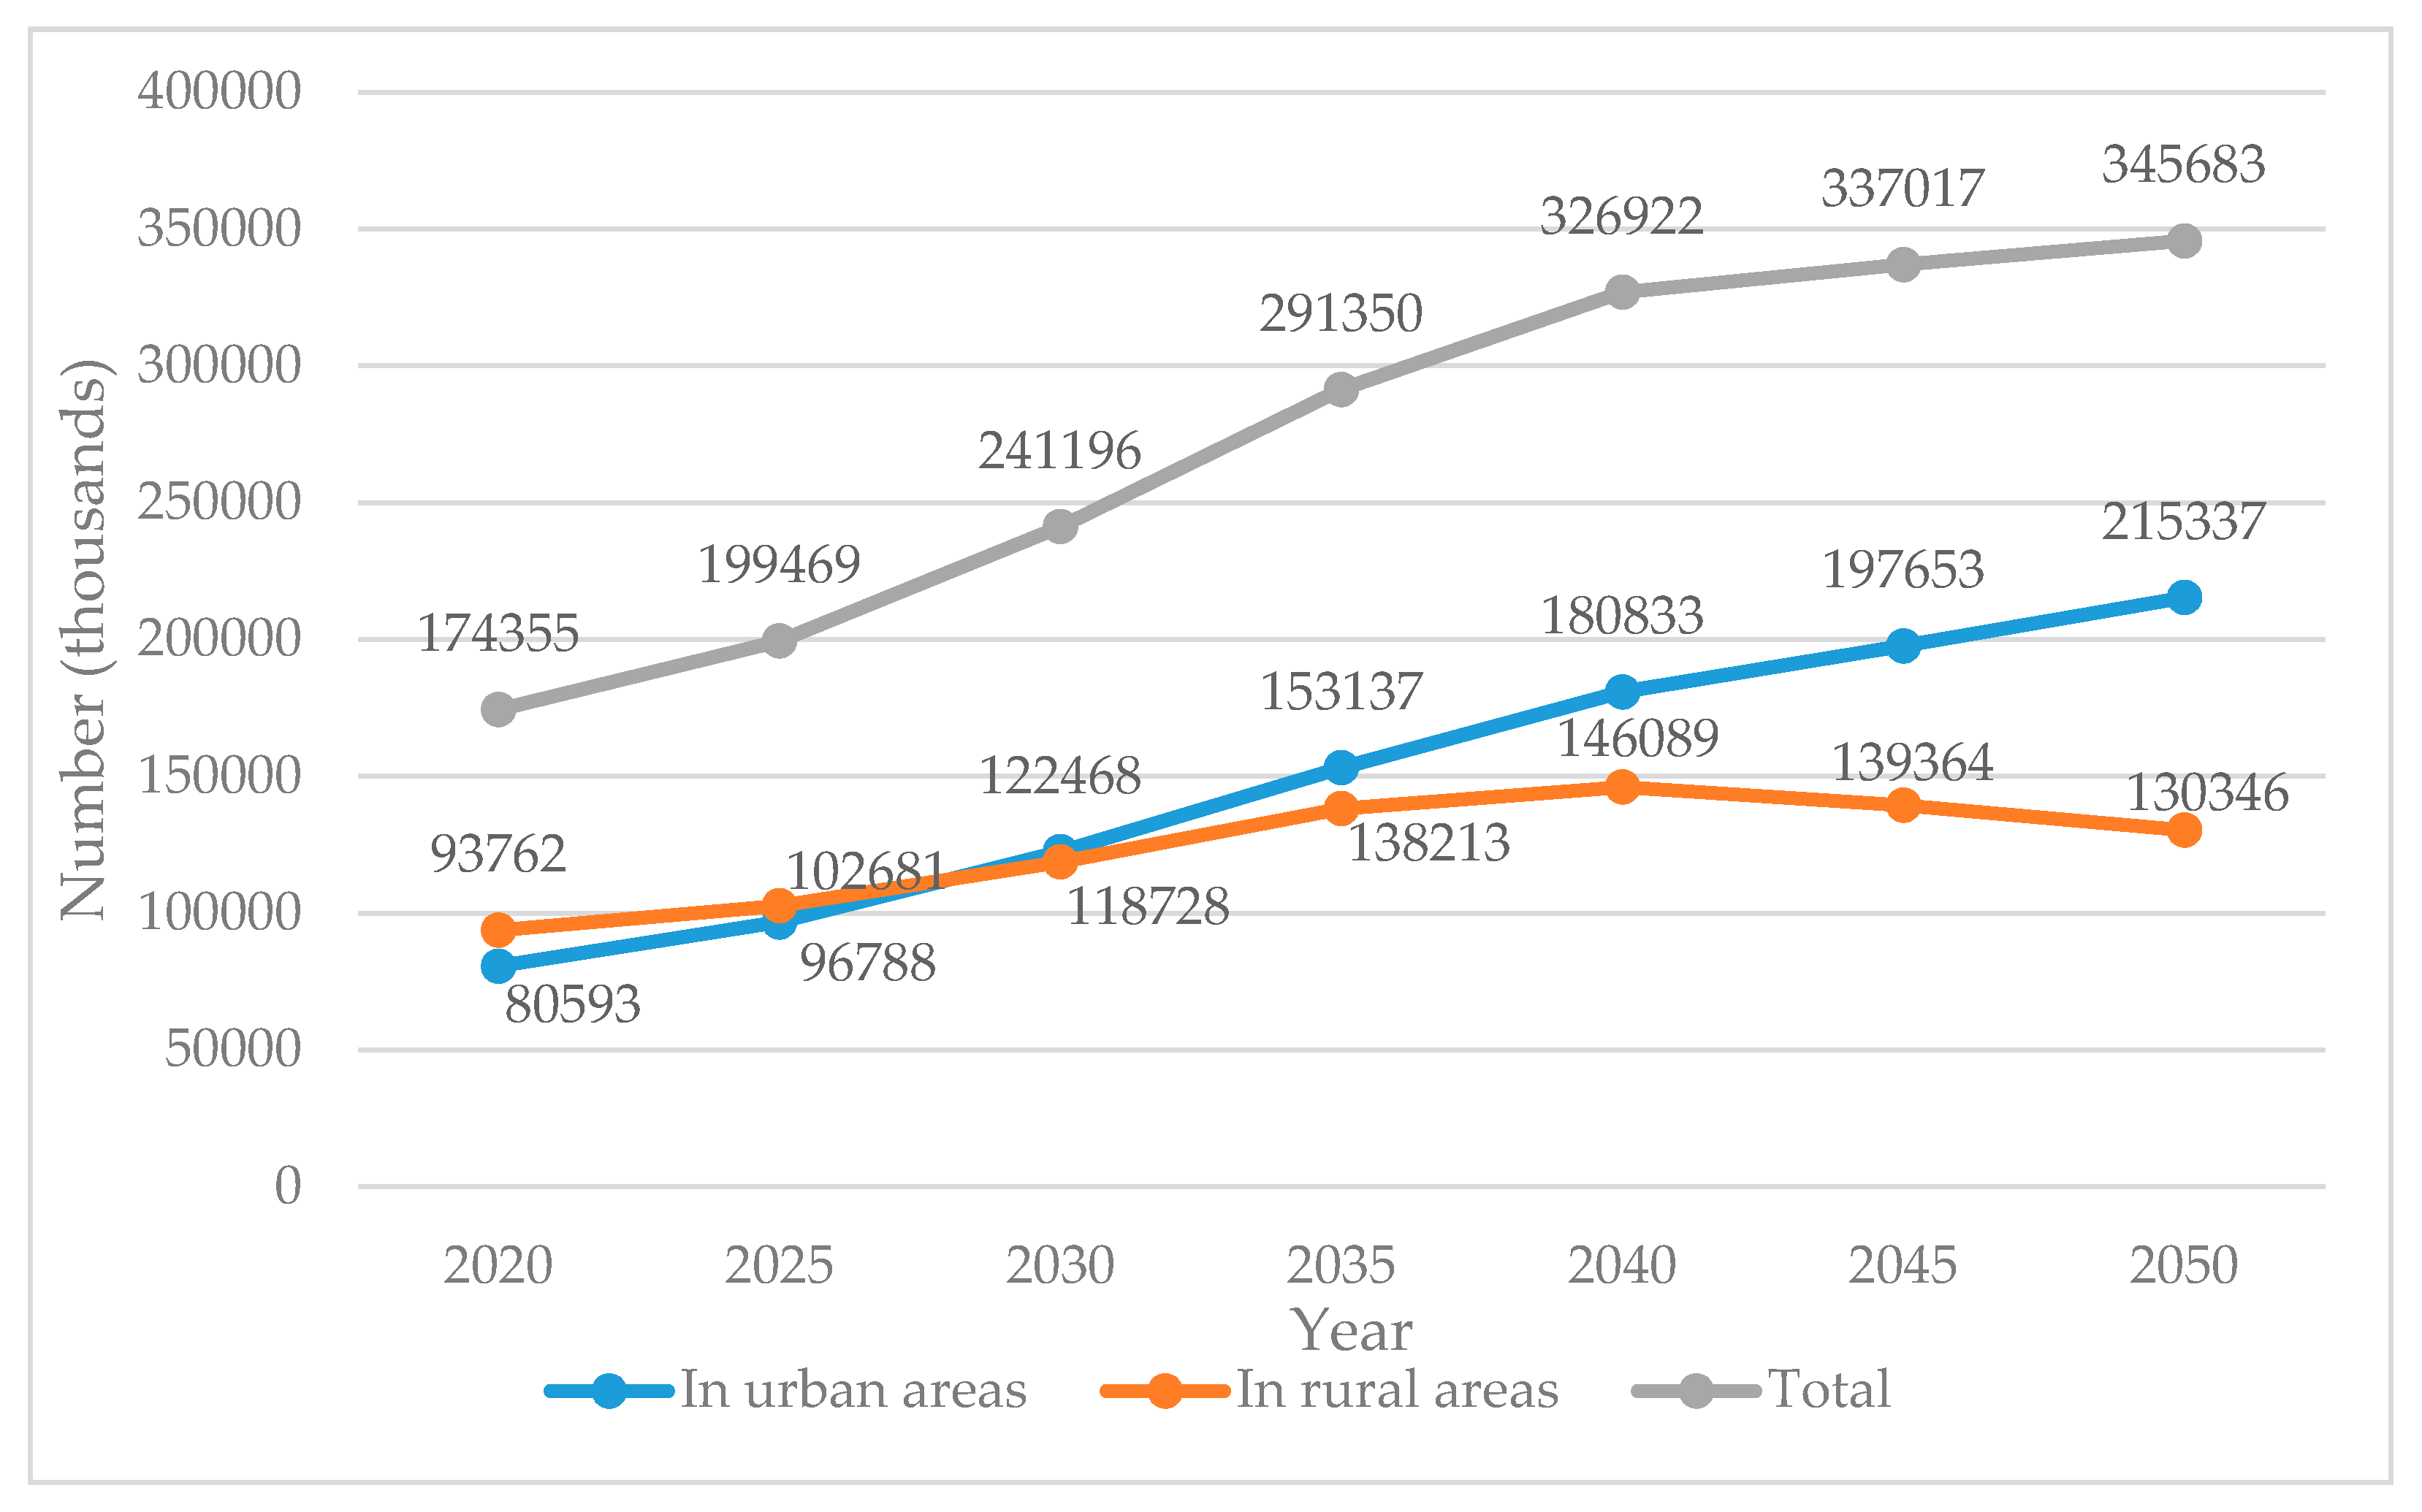
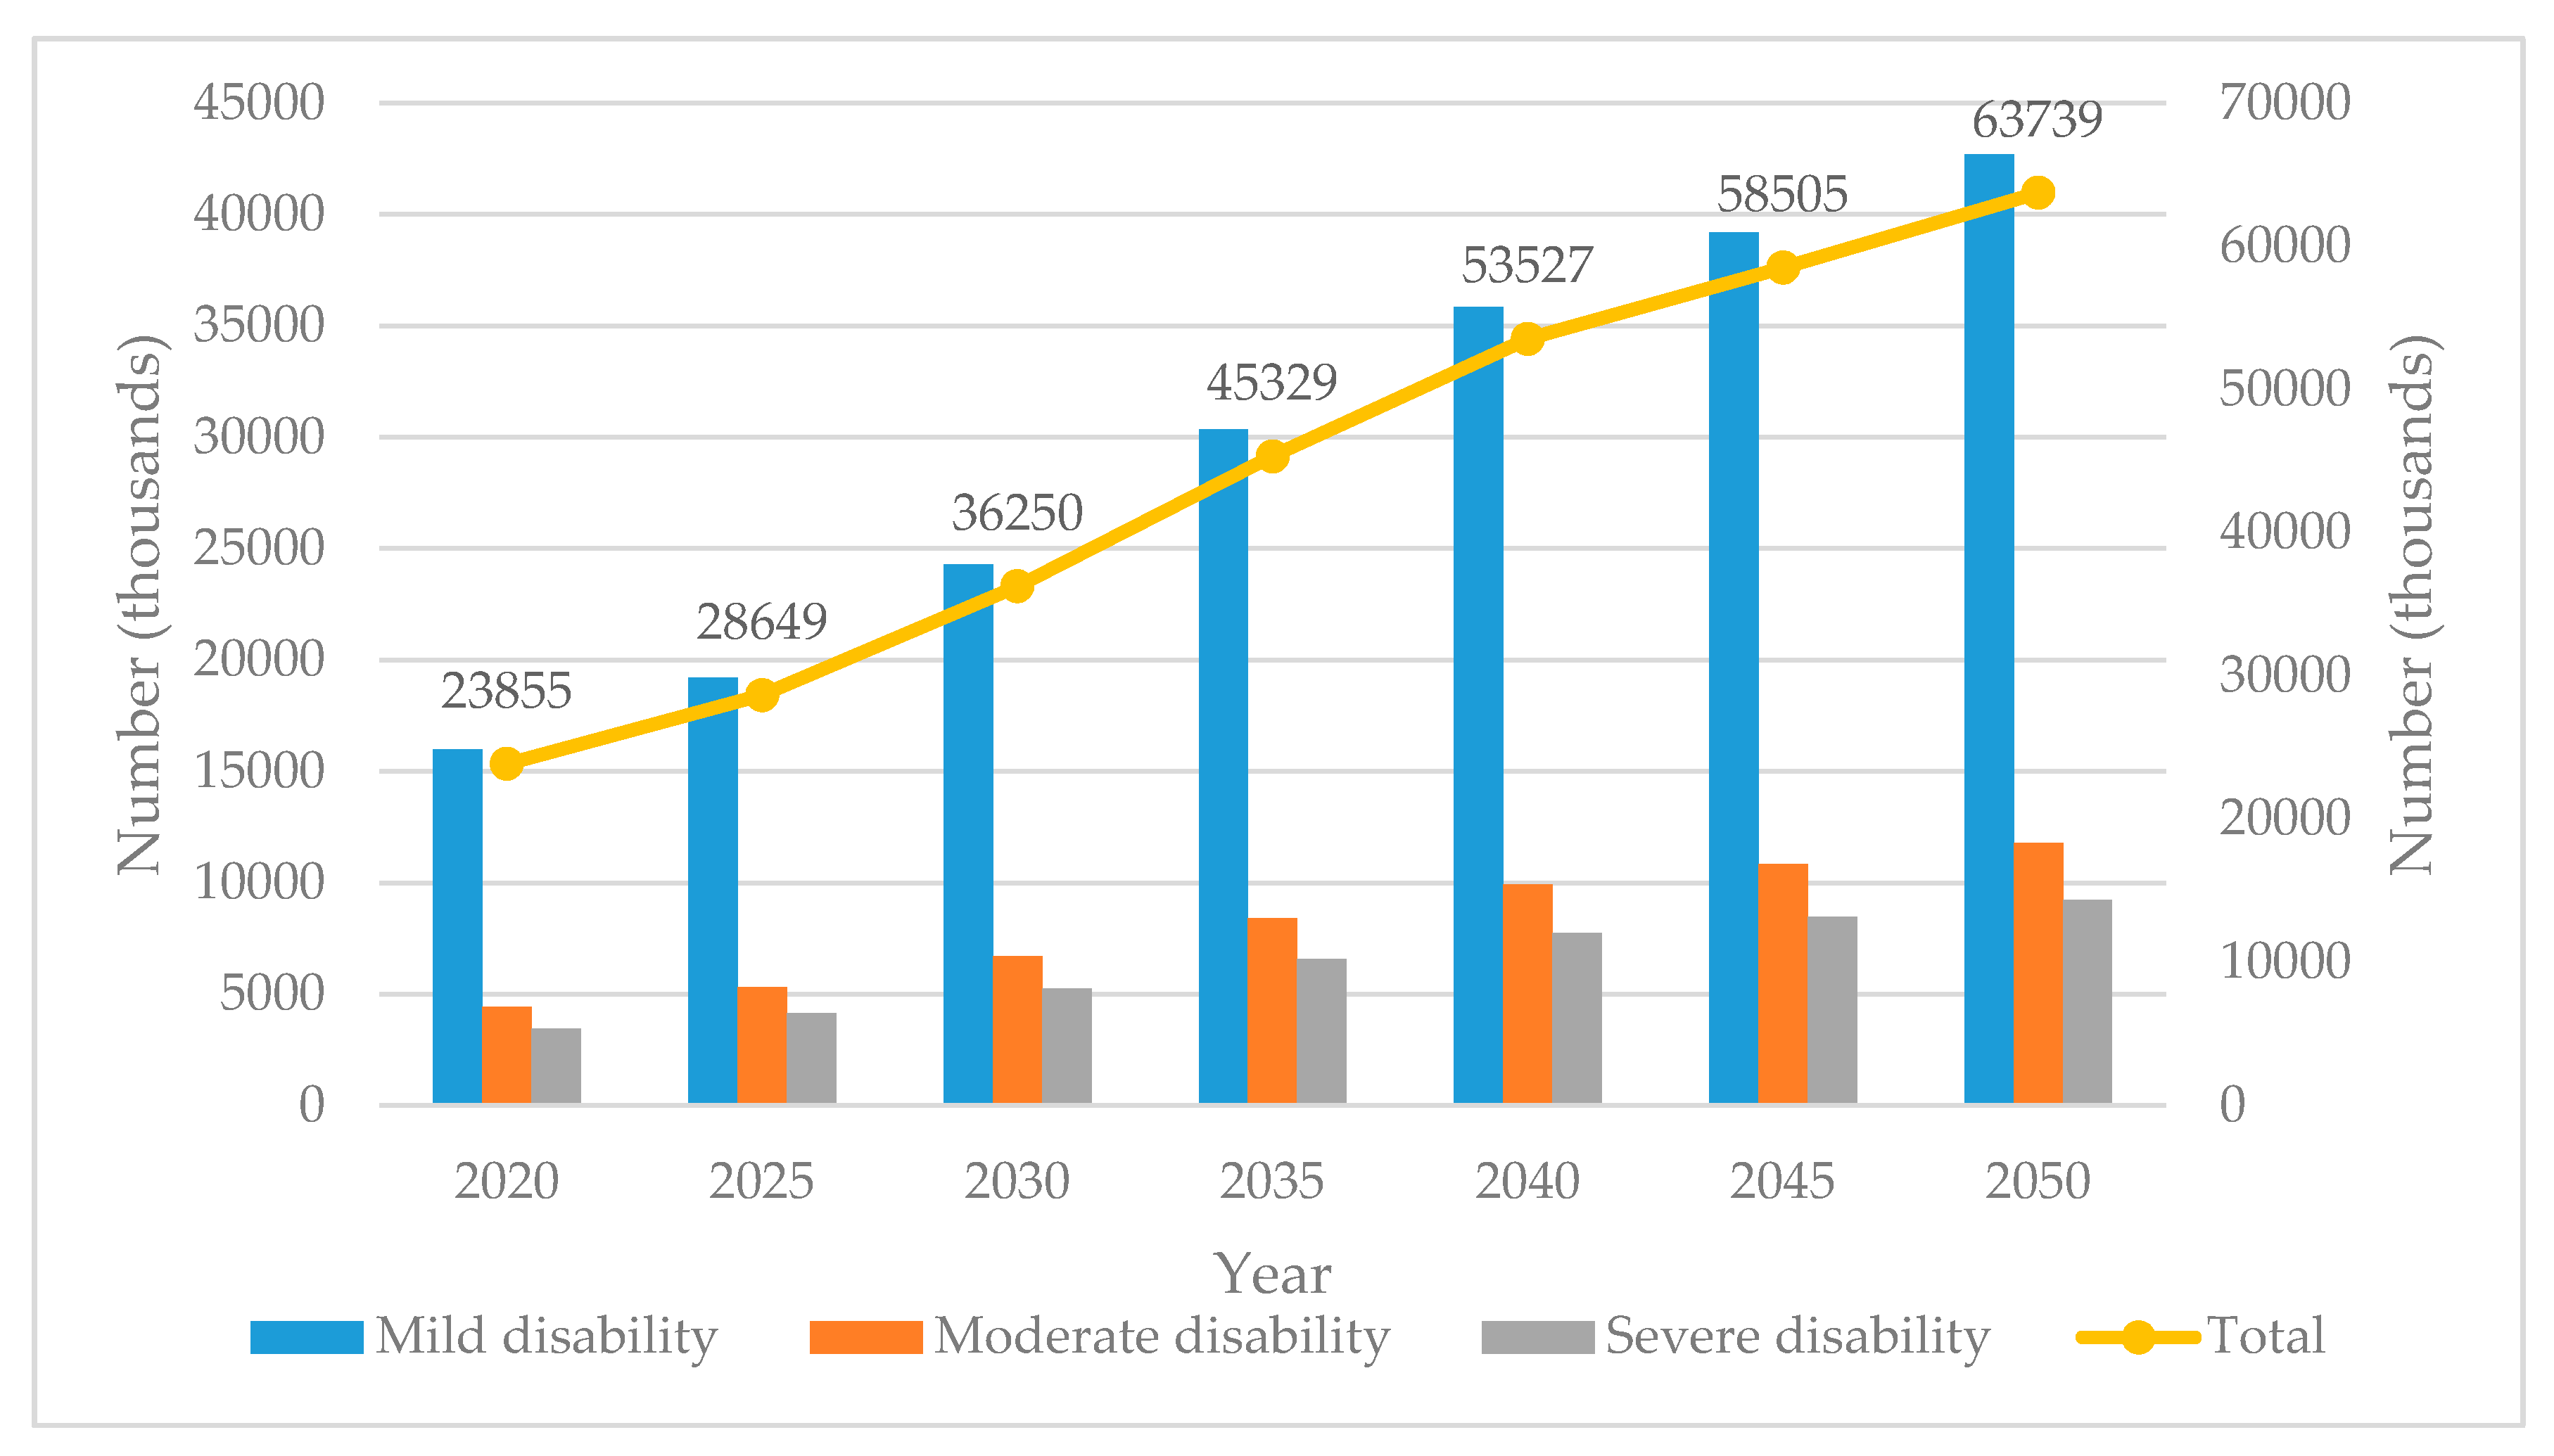
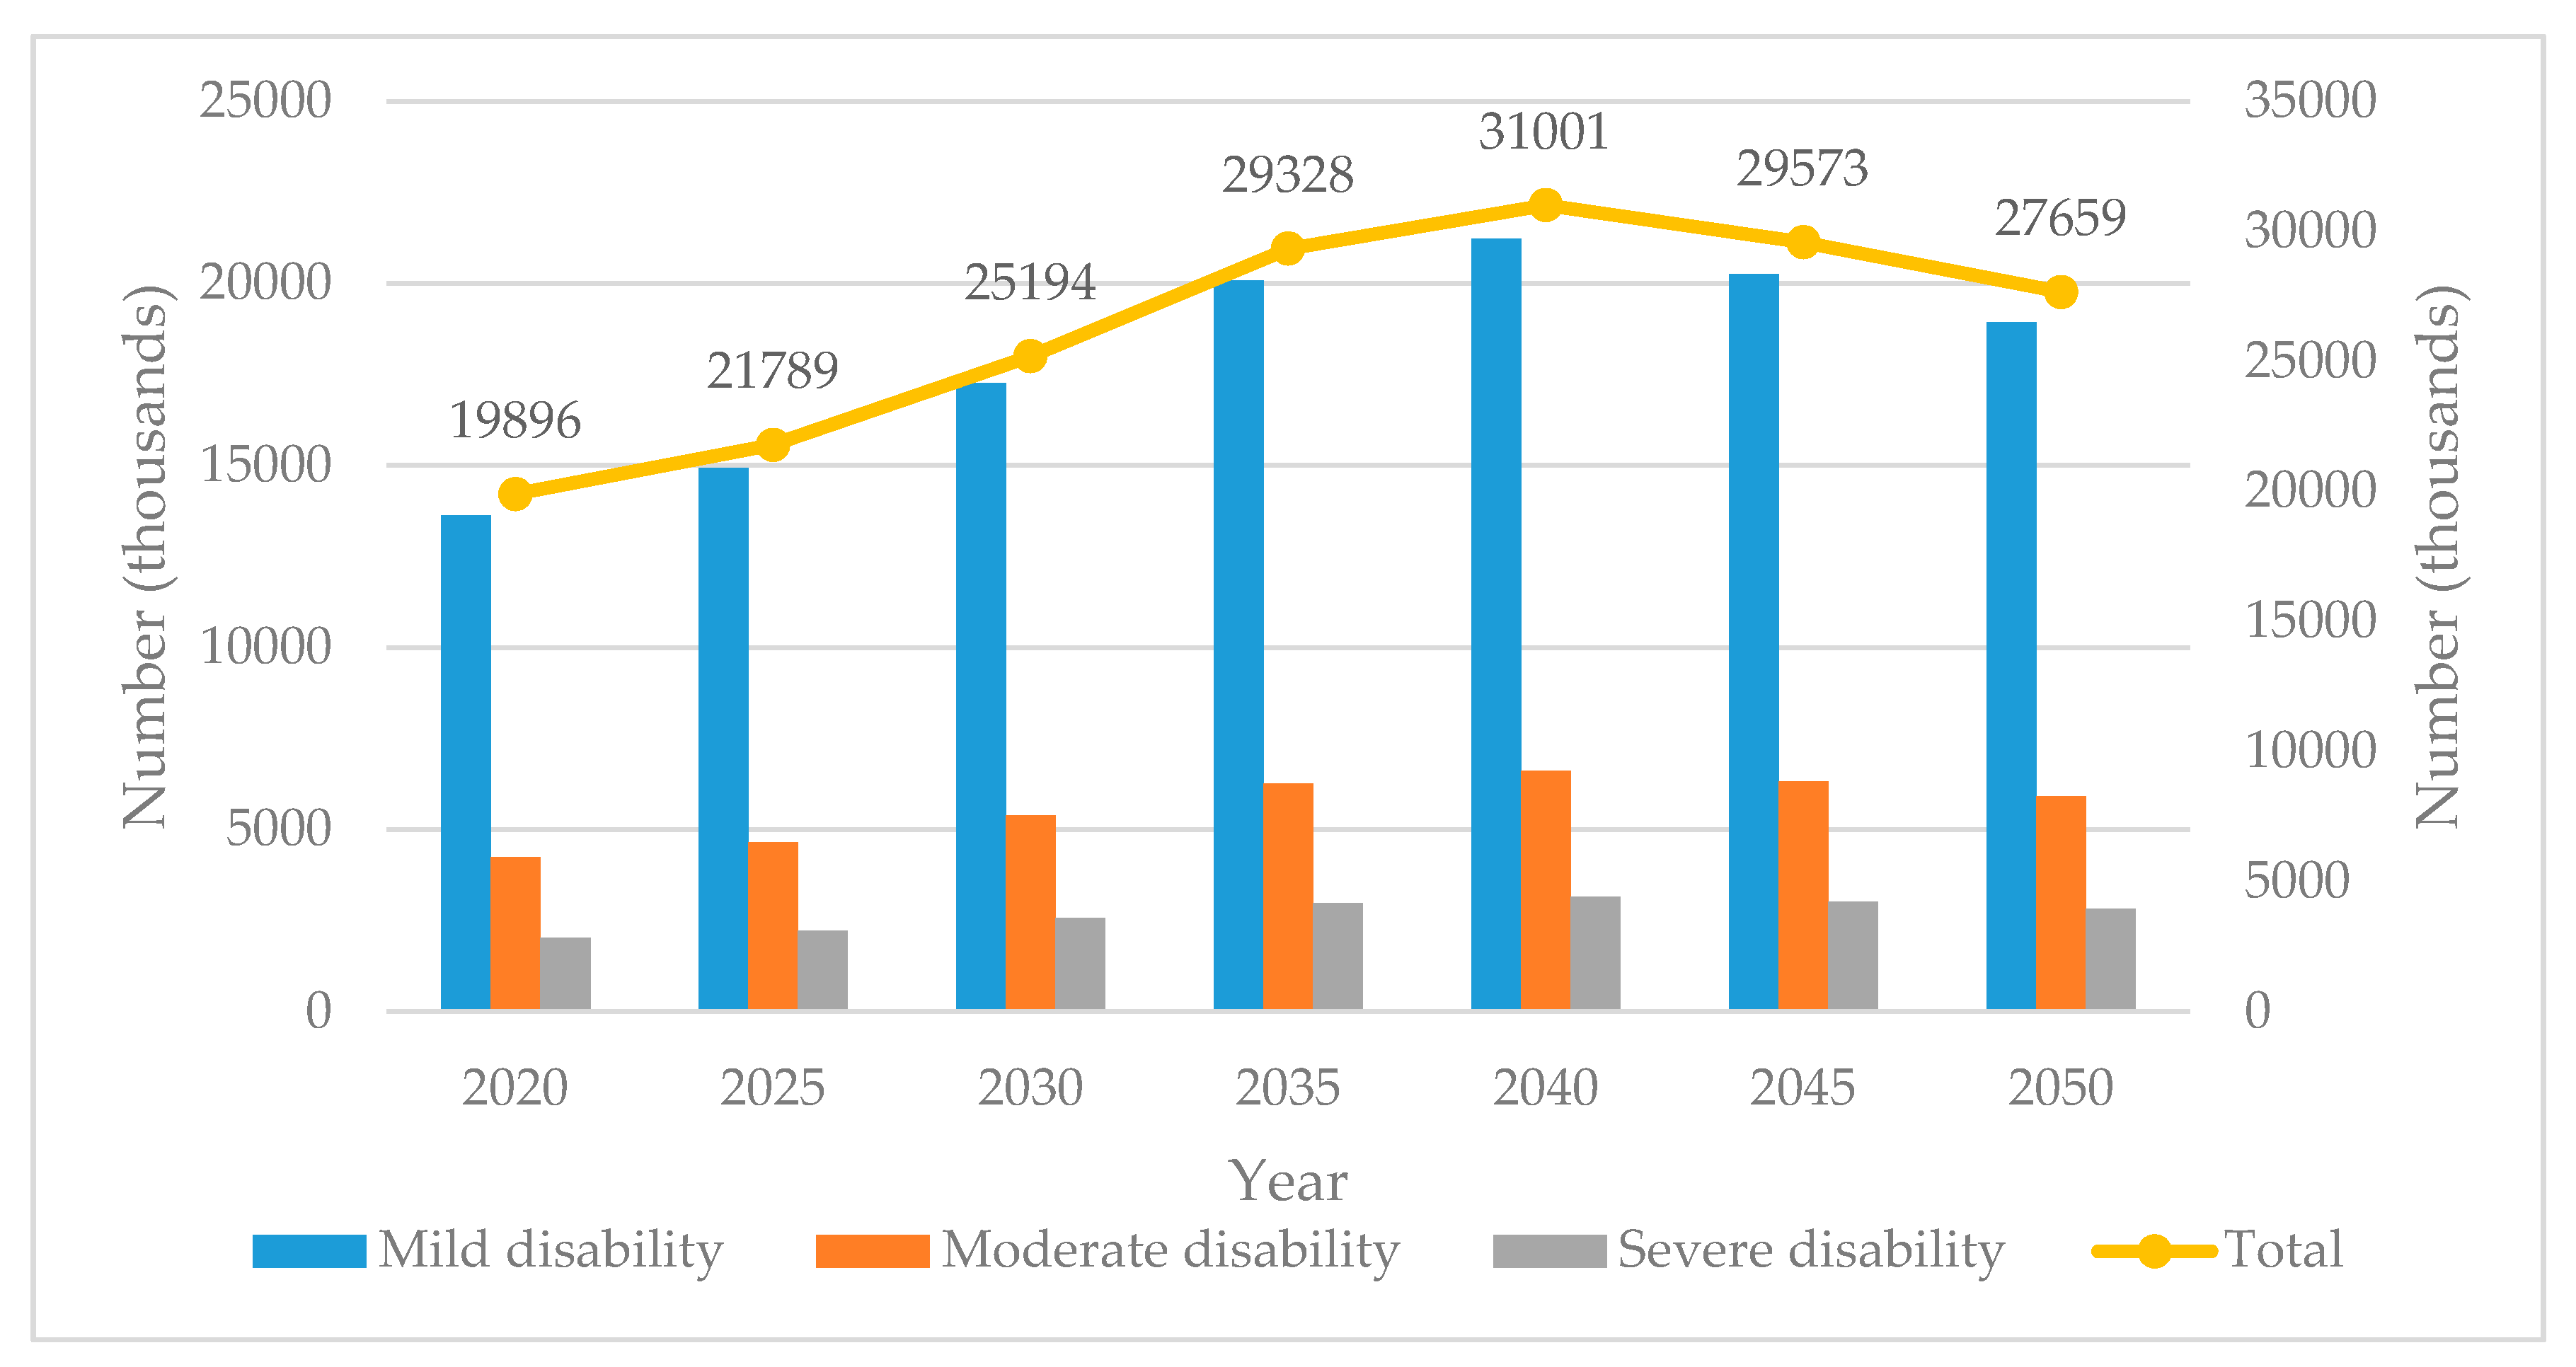
3.2. Prediction of Disabled Population

As can be seen from Table 4, in this study, the total disabled population in China will reach 43.75 million in 2020. Of that total, 54.52% will be urban elderly and 45.47% rural elderly. In addition, the total disabled population will increase rapidly, to 91.4 million, by 2050. Of that total, 69.7% will be urban elderly. In addition, the number of elderly disabled in 2050 will be more than 2.09 times the total disabled population in 2020, and 3.23 times the total disabled population in 2014. Furthermore, in 2050, the numbers of elderly people with mild, moderate, and severe disability in China will be 61.64 million, 17.71 million, and 12.05 million, respectively. Compared with 2020, the growth rates of the elderly with mild, moderate, and severe disabilities in 2050 will be 108%, 104%, and 120%, respectively. The growth rates of the elderly in urban and rural areas will be 167% and 39%, respectively. The predicted results show that the growth rate of the elderly with severe disability in China will increase sharply from 2020 to 2050, especially in China’s urban areas (Figure 2 and Figure 3).

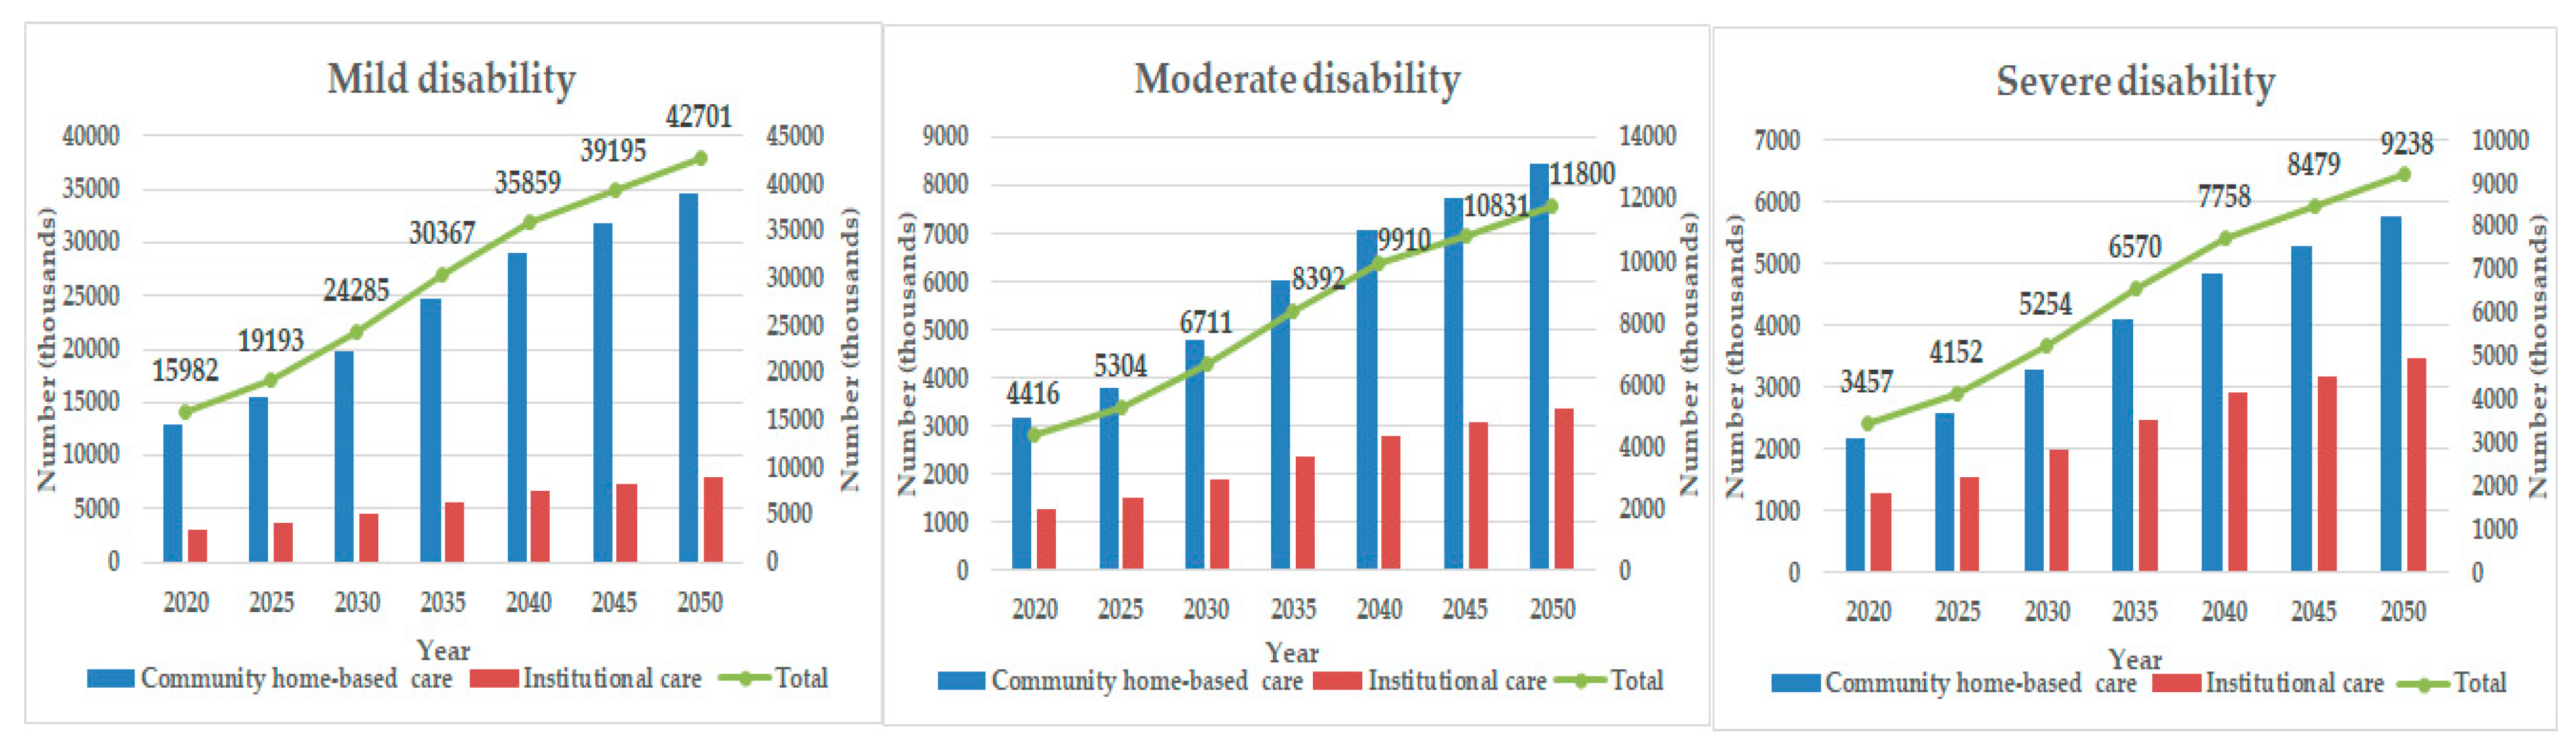
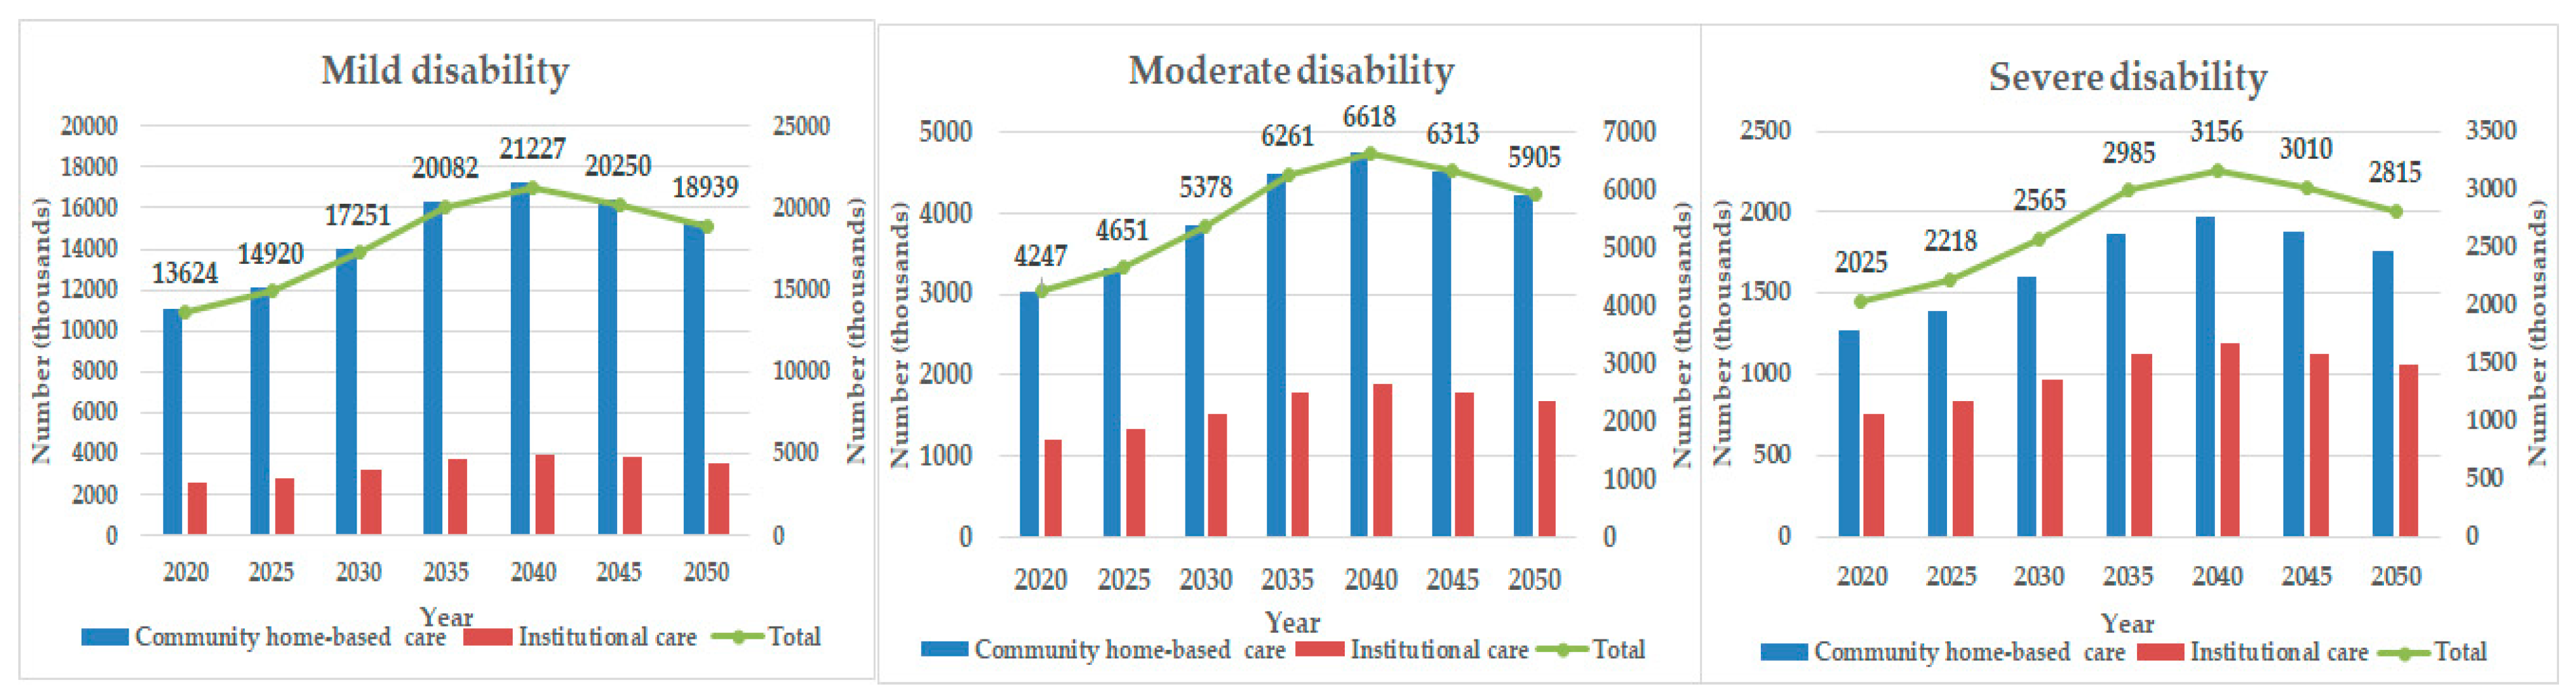
3.3. Demand for Different Care Types in Urban and Rural Areas

Based on the projected number of disabled elderly in urban and rural areas during the 2020–2050 period, and on the proportion of different care types in Taiwan in 2016, the population compositions of different care types in urban and rural areas in China from 2020 to 2050 were calculated (Figure 4 and Figure 5). It was found that in both urban and rural areas, the number of disabled elderly will increase sharply, and community home-based care will continue to be the mainstream way of providing LTC.

3.4. Projection of LTC Costs

According to data from the Shanghai Price Bureau, 2016, the costs of providing community home-based care are composed of material costs, labor costs, equipment costs, management costs, and education costs. The costs of providing institutional care are composed of labor costs, equipment costs, consumable costs, facility costs, management costs, and education costs. The predicted results showed that the main costs of community home-based elderly care are the material costs (55.51%), while the main costs of institutional care are labor costs. The results were adjusted according to the ratio of Shanghai and the per capita GDP. Table 5 shows the monthly costs of different care types and care levels in 2014. The results showed that the costs of care increased in line with the increase in care levels.
The results showed that the total care costs will increase approximately 15.9 times, from 538 billion yuan in 2020, to 8530.8 billion yuan in 2050. In addition, the total costs and growth rate of care in urban areas are higher than those in rural areas. They will increase approximately 16 times, from 427.7 billion yuan in 2020, to 6843.7 billion yuan in 2050. In addition, the per capita cost of care in urban and rural areas in 2050 will be 6 times and 11 times higher, respectively, than in 2020. The predicted results showed that the total cost of disabled elderly care will increase sharply from 2020 to 2050 (Table 6), especially from 2030 to 2050 (Figure 6).

4. Discussion

In this study, an overall simulation model and Monte Carlo simulation were used to estimate the number of disabled elderly and the costs of their care from 2020 to 2050, in both urban and rural areas in China. The results showed that the number of disabled elderly will increase sharply between 2020 and 2050, especially the severely disabled elderly. The scale and growth rate of urban disabled elderly will also be higher than those of rural areas. Also, the costs of disabled elderly care will increase sharply from 2020 to 2050, especially from 2030 to 2050.
Due to the aging population and the decrease in the number of children, traditional home-based care is losing its place in the LTC of the elderly, while the number of the elderly in China’s population is increasing sharply. These factors will require our government and society to respond promptly to the demand for care. The results show that the number of severely disabled elderly will increase faster than the numbers of mildly and moderately disabled elderly from 2020 to 2050; the scale and growth rate of urban disabled elderly will also be higher than in rural areas. One reason for this phenomenon may be that higher healthy life expectancies increase the proportion of elderly people. This in turn causes changes in the different care types and care levels, which will increase the costs and time of care [44]. The rapid development of Chinese urbanization will continue to lead to a decrease in the number of rural residents, and urban care costs are higher than the care costs in rural areas [45]. We suggest that the government needs to establish a comprehensive old-age service system that covers both urban and rural elderly, allowing individuals, families and communities to make full use of the security function of LTCI. Steps should also be taken to narrow the current LTC gap between urban and rural areas [46].
Similar to the prediction results in previous studies [21], the predicted results in this study showed that the number of disabled elderly will increase in both urban and rural areas, and community home-based care will continue to be the mainstream type of LTC. Previous research has shown that community home-based care is more popular with the elderly than institutional care [47]. However, community home-based care schemes are facing great challenges at present, including the growing future elderly population, higher healthy life expectancies, and the burden of children’s work. These challenges have greatly weakened the function of home-based care for the elderly. In addition, community home-based care is still in the development stage and needs to be constantly improved [48]. Therefore, under the influence of traditional Chinese culture and long historical practices, community home-based care will continue to be the most important way to provide care for a long time to come, and will face the challenges of informal and formal care. The Chinese government and society should focus on social security and initiate a policy product in response to the LTC problem of Chinese families [46].
At present, the solution to the financial risks of providing LTC for China’s disabled elderly is still based in the primary stage of individual or family-based and government social assistance [49]. The predicted results showed that the costs of disabled elderly care will increase sharply from 2020 to 2050. Compared with the results of previous studies [31], this study provides further evidence that the cost of care for disabled elderly people in China is rising rapidly. This will increase the government’s financial burden and cause an imbalance between the demand and supply of LTC. Therefore, it is necessary to establish a unified national LTCI system in China.
At the same time, although the total costs and growth rate in urban areas were higher than those in rural areas in our study, the per capita care costs in rural areas have increased significantly. Due to the backwardness of the economy and the shortage of medical supplies in rural areas, previous research has found that more than 50% of the disabled elderly in rural areas think that they are under economic pressure [50]. Most of them prefer community home-based care. Caregivers often need to reduce their working hours to take care of the disabled elderly. This not only reduces family income, but also increases medical costs, living costs, and the family’s overall financial burden. Therefore, how to solve the problem of LTC demand and the corresponding costs has become a core issue for any future LTCI system.
This study has a number of limitations. Firstly, due to the lack of a unified long-term insurance system in China and the lack of relevant microdata, this study refers to the data in pilot areas, which may be biased to some extent. Secondly, due to the different contents of care types, it is difficult to estimate the costs in detail, so further studies are needed to identify and quantify more LTC factors. In addition, on the basis of the prediction of the number of and care costs for disabled elderly, future research should focus on the financing mechanism of long-term care insurance based on the perspective of supply and demand, especially the contribution rate of different subjects.

5. Conclusions

In summary, the predicted results showed that the number and care costs of disabled elderly will increase sharply from 2020 to 2050. This study provides an abundance of evidence of the need for the establishment of an effective LTCI system in China. The current LTCI pilot scheme in China still needs to be improved and deepened, in order to provide relief to both individual families and the local governments in China. Therefore, the presented results suggest that the LTCI policy should be expanded to a national scale in China. Considering that financing is one of the greatest challenges to the development of China’s LTCI [51], we suggest that policy makers consider our national conditions and establish a sustainable financing policy, including funding from the government, employers, and employees. In addition, policy makers should encourage the introduction of private LTCI schemes as a supplement. At the same time, the design of any new LTCI system must take into account many factors, including the differences between urban and rural areas, the future elderly population, different coverage, and different care conditions. All of these factors will have to be addressed, in order to maintain the sustainable development of LTC in the future.

Author Contributions

L.Z., S.F. and Y.F. worked together. L.Z. designed the study design, analyzed and interpreted the data, and drafted the manuscript. S.F. participated in the statistical analysis and drafted the manuscript. Y.F. critically revised the manuscript. All authors have read and agreed to the published version of the manuscript.

Funding

This study was supported by the National Natural Science Foundation of China (grant number 81573257 & 81973144). The funders who supported this study had no role in study design, data collection and analysis, decision to publish, or preparation of the manuscript.

Acknowledgments

The authors would like to thank the Healthy Ageing and Development Research Center at Peking University, for its support with the data. We are also grateful to the students in School of Public Health, Xiamen University who participated in the data collation and analysis.

Conflicts of Interest

The authors declare no conflict of interest.

References

  1. WHO. China Country Assessment Report on Ageing and Health; WHO: Geneva, Switzerland, 2015. [Google Scholar]
  2. National Bureau of Statistics of China. 2019. Available online: http://www.stats.gov.cn/tjsj/zxfb/201902/t20190228_1651265.html (accessed on 1 December 2019).
  3. Yu, L. How to solve the problem of insufficient supply of more than 4 million registered nurses in China? Available online: http://www.cnr.cn/sxpd/ws/20190512/t20190512_524609391.shtml (accessed on 14 March 2019).
  4. Robine, J.-M.; Michel, J.-P. Looking forward to a general theory on population aging. J. Gerontol. A Biol. 2004, 59, M590–M597. [Google Scholar] [CrossRef] [PubMed] [Green Version]
  5. Matthews, Z.; Channon, A.; Van Lerberghe, W. Will There be Enough People to Care? Notes on Workforce Implications of Demographic Change 2005–2050; WHO: Geneva, Switzerland.
  6. Karlsson, M.; Mayhew, L.; Plumb, R.; Rickayzen, B. Future costs for long-term care: Cost projections for long-term care for older people in the United Kingdom. Health Policy 2006, 75, 187–213. [Google Scholar] [CrossRef] [PubMed]
  7. Nadash, P.; Doty, P.; von Schwanenflügel, M. The German long-term care insurance program: Evolution and recent developments. Gerontology 2018, 58, 588–597. [Google Scholar] [CrossRef] [PubMed]
  8. Campbell, J.C.; Ikegami, N.; Gibson, M.J. Lessons from public long-term care insurance in Germany and Japan. Health Aff. 2010, 29, 87–95. [Google Scholar] [CrossRef] [PubMed] [Green Version]
  9. Yuan, X.; Liu, H. Comparison of Long-term Care Insurance System in Japan and Germany and Implications for China. Jpn. Res. 2019, 33, 64–72. [Google Scholar]
  10. Shimizutani, S. The future of long-term care in Japan. Asia Pac. Rev. 2014, 21, 88–119. [Google Scholar] [CrossRef] [Green Version]
  11. Rhee, J.C.; Done, N.; Anderson, G.F. Considering long-term care insurance for middle-income countries: Comparing South Korea with Japan and Germany. Health Policy 2015, 119, 1319–1329. [Google Scholar] [CrossRef] [Green Version]
  12. Seok, J.E. Public long-term care insurance for the elderly in Korea: Design, characteristics, and tasks. Soc. Work. Public. Health 2010, 25, 185–209. [Google Scholar] [CrossRef]
  13. Kwon, S. Future of long-term care financing for the elderly in Korea. J. Aging Soc. Policy 2008, 20, 119–136. [Google Scholar] [CrossRef]
  14. Brown, J.R.; Finkelstein, A. The interaction of public and private insurance: Medicaid and the long-term care insurance market. Amer. Econ. Rev. 2008, 98, 1083–1102. [Google Scholar] [CrossRef] [Green Version]
  15. Yang, W.; Jingwei He, A.; Fang, L.; Mossialos, E. Financing institutional long-term care for the elderly in China: A policy evaluation of new models. Health Policy Plan. 2016, 31, 1391–1401. [Google Scholar] [CrossRef] [PubMed] [Green Version]
  16. Chang, S.; Yang, W.; Deguchi, H. Care providers, access to care, and the Long-term Care Nursing Insurance in China: An agent-based simulation. Soc. Sci. Med. 2020, 244, 112667. [Google Scholar] [CrossRef] [PubMed]
  17. Yang, J.-H.; Wang, S.-S.; Du, S.-H. Regional comparison and implications of China’s long-term care insurance system. Chin. J. Health Policy. 2018, 11, 1–7. [Google Scholar]
  18. Wang, L. Study on the Current Situation of Pilot Long-Term Care Insurance in Shanghai. Master’s Thesis, Shanghai Normal University, Shanghai, China, March 2019. [Google Scholar]
  19. Lei, X.; Feng, Y. Financing Channel of Social Long-term Care Insurance: Experience, Difficulties and Future choices. J. Northwest. Univ. 2016, 46, 108–115. [Google Scholar]
  20. Lu, Y.; Yang, C. A Review of the Construction of Long-term Care Insurance System in China. Soc. Secur. Stud. 2016, 98–105. [Google Scholar]
  21. Xu, X.; Chen, L. Projection of Long-Term Care Costs in China, 2020–2050: Based on the Bayesian Quantile Regression Method. Sustainability 2019, 11, 3530. [Google Scholar] [CrossRef] [Green Version]
  22. Moody, H.R. Environmentalism as an aging issue. Public Policy Aging Rep. 2008, 18, 1–7. [Google Scholar] [CrossRef]
  23. Wark, S. Ageing, end-of-life care, and the National Disability Insurance Scheme: What can we learn from overseas? J. Intellect. Dev. Dis. 2015, 40, 92–98. [Google Scholar] [CrossRef]
  24. Comas-Herrera, A.; Pickard, L.; Wittenberg, R.; Davies, B.P.; Darton, R. Future Demand for Long-Term Care, 2001 To 2031: Projections of Demand for Long-Term Care for Older People in England; University of Kent: Canterbury, UK, 2003. [Google Scholar]
  25. Garber, A.M.; MaCurdy, T.E. Predicting nursing home utilization among the high-risk elderly. In Issues in the Economics of Aging; University of Chicago Press: Chicago, IL, USA, 1990; pp. 173–204. [Google Scholar]
  26. Hare, W.; Alimadad, A.; Dodd, H.; Ferguson, R.; Rutherford, A. A deterministic model of home and community care client counts in British Columbia. Health Care Manage. Sci. 2009, 12, 80. [Google Scholar] [CrossRef]
  27. Fukawa, T. Household projection and its application to health/long-term care expenditures in Japan using INAHSIM-II. Soc. Sci. Comput. Rev. 2011, 29, 52–66. [Google Scholar] [CrossRef]
  28. Rong, P. Analysis of Senior Population Nursing Needs Based on Markov Model. Stat. Inf. Forum. 2009, 24, 77–80. [Google Scholar]
  29. Yu, W.; Liu, B. Elderly care system construction and demand forecast. J. Popul. 2012, 4, 3–13. [Google Scholar]
  30. Hu, H.; Li, Y.; Zhang, L. Estimation and Prediction of Demand of Chinese Elderly Long-term Care Service. Chin. Popul. Sci. 2015, 79, 89–127. [Google Scholar]
  31. Huang, F.; Wu, C. A Study of Long-Term-Care Demand of the Elderly in China: Based on Multistatus Transition Model. Econ. Res. J. 2012, 47, 119–130. [Google Scholar]
  32. Huang, K.; Lu, J. Study on Time Expectancy of Care for Daily Living of Chinese Elderly. Chin. J. Popul. Sci. 2014, 92, 101–128. [Google Scholar]
  33. Gu, D.-N.; Liu, Y.-Y. A review on latest studies on elderly care needs and costs. J. Northwest. Popul. 2008, 1, 1–6. [Google Scholar]
  34. Kang, Q.; Cao, X. A Review of Researches on Long-term Care Insurance Funding Theory. China Econ. 2019, 56, 57–61. [Google Scholar]
  35. Wen, T. A Literature Review on Financing for Long-term Care in China. J. Sichuan. Univ. Sci. 2018, 33, 18–32. [Google Scholar]
  36. Li, X. Financial Supply and Demand Balance Analysis of Long-Term Care Insurance in Jiangsu. Master’s Thesis, Nanjing University of Finance & Economics, Nanjing, China, November 2015. [Google Scholar]
  37. Zhang, L.; Zeng, Y.; Fang, Y. The effect of health status and living arrangements on long term care models among older Chinese: A cross-sectional study. PLoS ONE 2017, 12, e0182219. [Google Scholar] [CrossRef] [Green Version]
  38. Taiwan Ministry of Health and Welfare. Available online: https://www.mohw.gov.tw/mp-1.html (accessed on 14 March 2019).
  39. Government, S.M. Notice of the Municipal Government on Printing and Distributing the "Measures for Piloting Long-term Care Insurance in Shanghai". Available online: http://www.shanghai.gov.cn/nw2/nw2314/nw2319/nw12344/u26aw54809.html (accessed on 14 March 2019).
  40. National Bureau of Statistics of China. 2014. Available online: http://www.stats.gov.cn/tjsj/ndsj/2015/indexch.htm (accessed on 14 March 2019).
  41. Qi, M. Labor Supply and Labor Demand Forecasting in China, 2010-2050. Popul. Res. 2010, 34, 76–87. [Google Scholar]
  42. Zhu, L. The Monte Carlo Method and Application. Master’s Thesis, Central China Normal University, Wuhan, China, December 2014. [Google Scholar]
  43. Duan, N.; Xue, H.; Pan, Y. The selection of simulation times when calculating reliability with Monte Carlo method. Coal Mine Mach. 2002, 13–14. [Google Scholar]
  44. Zhou, F.; Zhang, J. A Summary of Research on Social Insurance and Commercial Insurance Cooperation in Long-term Care Insurance. Soc. Welfare. 2018, 18, 24–31. [Google Scholar]
  45. Tian, S.; Wang, D.; Song, F.; Li, Y. Governance strategies for the development of rural left-behind elderly human resources in the process of urbanization. Chin. J. Gerontol. 2017, 37, 2848–2850. [Google Scholar]
  46. Zhang, Y.; Yu, X. Evaluation of Long-Term Care Insurance Policy in Chinese Pilot Cities. Int. J. Environ. Res. Public Health 2019, 16, 3826. [Google Scholar] [CrossRef] [PubMed] [Green Version]
  47. Zhang, L.; Zeng, Y.; Fang, Y.; Wen, C. Study on Pension Methods and its Influential Factors among the Elderly by Using Andersen Behavior Model. Chin. J. Health. Stats. 2017, 34, 721–725. [Google Scholar]
  48. Guo, L. Research on the Development Status and Planning Design of Home-based Elderly Community in China. J. Anhui Agr. Sci. 2015, 43, 327–329. [Google Scholar]
  49. Li, Y. Calculation and Analysis of the Scale of Long-term Care Funds for Disability Elderly in China. J. Popul. 2018, 40, 78–85. [Google Scholar]
  50. Zhang, Y. Research on the long term care for disabled elderly in rural areas in the perspective of social support theory. Master’s Thesis, Nanchang University, Nanchang, China, May 2017. [Google Scholar]
  51. Wang, Q.; Zhou, Y.; Ding, X.; Ying, X. Demand for long-term care insurance in China. Int. J. Environ. Res. Public Health 2018, 15, 6. [Google Scholar] [CrossRef] [Green Version]
Figure 1. Prediction of the elderly (aged 65 and over) from 2020 to 2050.
Sustainability 12 02598 g001
Figure 2. Prediction of the disabled elderly (aged 65 and over) in urban areas from 2020 to 2050.
Sustainability 12 02598 g002
Figure 3. Prediction of the disabled elderly (aged 65 and over) in rural areas from 2020 to 2050.
Sustainability 12 02598 g003
Figure 4. Demand of different care types in urban areas from 2020 to 2050.
Sustainability 12 02598 g004
Figure 5. Demand of different care types in rural areas from 2020 to 2050.
Sustainability 12 02598 g005
Figure 6. Projection of LTC costs in urban and rural areas from 2020 to 2050.
Sustainability 12 02598 g006
Table 1. Prediction of the elderly (aged 65 and over) from 2020 to 2050 (in thousands).
YearUrban (Age Groups)Rural (Age Groups)
65–6970–7475–7980–8485+65–6970–7475–7980–8485+
202033,62221,42412,6237975494937,56525,53315,50693135845
202534,94329,78817,3728777590832,42532,75720,33010,5316638
203047,76531,17324,36912,300686141,89728,47226,43014,1437786
203557,47542,87925,80417,541943848,40737,22223,26518,77510,544
204060,33851,90735,88518,91513,78840,26643,36030,93316,86814,662
204555,43554,83343,87626,77816,73128,04336,29336,44622,97515,607
205061,26650,75646,84233,29723,17626,43425,44330,80727,53320,129
Table 2. Disability rate and distribution of the elderly in different age groups in 2014.
Age GroupsMild (%)Moderate (%)Severe (%)Total (%)
65–692.000.74 0.323.06
70–743.540.88 0.444.86
75–795.280.670.926.87
80–846.882.041.029.94
85+19.335.603.5028.43
Weighted mean16.744.943.0517.87
Note: Mild, moderate, and severe respectively represent different states of disabled elderly.
Table 3. Disability rate and distribution of the elderly in urban and rural areas in 2014.
Age GroupsUrban Rural
Mild
n (%)
Moderate
n (%)
Severe
n (%)
Mild
n (%)
Moderate
n (%)
Severe
n (%)
65–697(12.96)1(1.85)1(1.85)1(0.58)1(0.58)0(0.00)
70–749(1.94)3(0.65)2(0.43)10(2.05)4(0.82)1(0.21)
75–7943(7.21)4(0.67)9(1.51)20(3.35)4(0.67)2(0.34)
80–8442(8.38)11(2.20)9(1.80)32(5.57)11(1.91)2(0.35)
85+365(23.20)98(6.23)79(5.02)343(16.42)107(5.12)49(2.35)
Weighted mean19.83%5.48%4.29%14.53%4.53%2.16%
Note: Mild, moderate, and severe respectively represent different states of disabled elderly.
Table 4. Prediction of the disabled elderly (aged 65 and over) in urban and rural areas from 2020 to 2050 (in thousands).
YearUrban Rural Total
MildModerateSevereTotalMildModerateSevereTotal
202015,9824416345723,85513,6244247202519,89643,751
202519,1935304415228,64914,9204651221821,78950,438
203024,2856711525436,25017,2515378256525,19461,444
203530,3678392657045,32920,0826261298529,32874,657
204035,8599910775853,52721,2276618315631,00184,528
204539,19510,831847958,50520,2506313301029,57388,078
205042,70111,800923863,73918,9395905281527,65991,398
Note: Mild, moderate, and severe respectively represent different states of disabled elderly.
Table 5. The costs of different care types and levels in 2014 (unit: yuan/month).
Community Home-Based Care Institutional Care
UrbanRuralUrbanRural
Mild disability1010.16324919.02294.77
Moderate disability1515.244863595.661153.28
Severe disability2020.326484515.641448.35
Table 6. Projection of long-term care (LTC) costs in urban and rural areas from 2020 to 2050.
YearCare Costs (100 Million yuan)Per Capita Costs (yuan)
UrbanRuralTotalUrbanRuralTotal
202042771103538017,931554511,738
202577061812951826,896831717,607
203012,987349316,48035,82713,86324,845
203524,335650530,84053,68622,18037,933
204038,31510,31448,62971,58133,27052,426
204552,34813,11965,46789,47644,36066,918
205068,43716,87185,308107,37160,99684,184

