Assessing the Efficiency of Sustainable Cities Using an Empirical Approach
by
 and
and
Laura Calzada-Infante
1,*, 
Ana María López-Narbona
2,†,
Alberto Núñez-Elvira
3,† and
Javier Orozco-Messana
4 1
Department of Management and Economy, University of León, 24007 León, Spain
2
Department of Sociology, University of Malaga, 29013 Malaga, Spain
3
Centre for Health Policy, Imperial College London, London W2 1NY, UK
4
ITM, Universitat Politecnica de Valencia, 46022 Valencia, Spain
*
Author to whom correspondence should be addressed.
†
These authors contribute equally to this paper.
Sustainability 2020, 12(7), 2618; https://0-doi-org.brum.beds.ac.uk/10.3390/su12072618
Submission received: 29 January 2020
/
Revised: 16 March 2020
/
Accepted: 23 March 2020
/
Published: 26 March 2020
(This article belongs to the Collection Indicators, Assessment Tools, and Rating Systems for Mainstreaming Sustainability in Urban Planning and Development)
Abstract
:Sustainability is a multidisciplinary discipline posing a difficult problem as a result of its integrated assessment. From a broad perspective, it considers the impact of human activities (using different resources) and natural conditions on local environments. Urban development has been identified as one of the most important reasons for environmental and social degradation. To address the complexity of sustainability and its impact, policymakers need to be equipped with the right toolkit to foresee the integrated effect of projects and plans on urban sustainability more effectively in their policy design. In this paper, we propose a tool to assess the sustainable performance of urban areas through a common framework of indicators which provides an integrated measurement based on the relative efficiency of key input variables on desirable and undesirable outputs. Using Data Envelopment Analysis (DEA), we propose a procedure for determining the relative efficiency of relevant urban areas, proposing this method as a candidate for integrated sustainability measurement. The selection of variables is based on dimensions which can be addressed from a political perspective for achieving more desirable outputs, or reducing the undesirable ones, controlling for key resources as much as possible. Our analysis takes a comprehensive scope including an environmental and socioeconomic perspective. This will be useful to identify weaknesses and strengths to improve the integrated performance of cities. Our array of indicators, based on standardized key performance indicators (KPIs) will enable policymakers to gather an insightful impact of their proposals in urban sustainability carrying out a global sustainability impact assessment through DEA. The main goal is to gather the urban experience of transforming cities into smarter cities and putting technological progress at the service of their societies.
1. Introduction
The expansion of urban environments is linked to global challenges of sustainability, particularly in regions where the process of urbanization is still unfolding, or the urban metabolism is undergoing a thorough regeneration [1]. In urbanized regions such as Europe, where more than 70% of people are urban dwellers, sustainability is one of the most important challenges, especially concerning the use of energy, economic performance, de-carbonization of infrastructure, wastewater management, and other ecosystems from cities and urban communities [2]. The consumption of these resources can play a crucial role in the development of the UN sustainability goals [3].
Existing building certifications provide the most widely accepted means for correlating sustainability to greenhouse gases emissions from a life cycle assessment perspective. Examples of these are BREEAM (Building Research Establishment Environmental Assessment Method), LEED (Leadership in Energy and Environmental Design), SBTool (Sustainable Building tool) [4], Green Star, and CASBEE (Comprehensive Assessment System for Built Environment Efficiency) [5]. Such certifications significantly contribute to understanding the environmental effects of buildings through examination of life cycle assessment methodologies. They could drive consumers’ will when buying building stock, and act as important references for decision makers in both developed and developing countries.
While cities are prized for being drivers of innovation, social experimentation, and economic growth, they are complex systems by nature with an inherent ability to self-adapt to external, and internal, drivers turning them into ever changing “organisms” following their own adapting metabolism in order to face major social and environmental challenges due to uncontrolled urbanization [6]. The ability of cities to self-organize under continuous change can be explained by an assessment of the “selective and decentralized flow of matter, energy and information among its parts”. The continuous self-organization of all city elements (energy generation and distribution systems, transportation, consumption of food, goods, services, waste handling, supply of fresh water, and other ecosystem services) within a city’s metabolism can be assessed as a complex system to evaluate sustainability [7].
Therefore, each investigation or plan for a city must consider the network connecting all the parts and their links with the surrounding environments. The dynamics of the networks (flows of energy, matter, people, goods, information, and resources) are fundamental for understanding the evolving nature of cities. Network efficiency evaluation has been used for assessing sustainable performance in urban systems [8].
However, the Slack-Based Inefficiency (SBI) Urban Sustainability evaluation proposes a more realistic impact assessment technique when cities’ metrics are available and comparable (through ISO 37120 and its wide range of key performance indicators, aka key performance indicators). Big data-based techniques can also be standardized through ISO 37120 to provide finely distributed evidence that will allow future evolution of the proposed technique. Then, this efficiency outputs need to be evaluated not only from control variables but also their historical interaction that statistically incorporate the myriad effects from all players through a basic set of key performance indicators (KPIs) [9]. Moreover, urban city planners have no guidance for accommodating conflicting objectives with their limited available resources. A tool for envisioning efficient alternatives is performing a Data Envelopment Analysis (DEA) of the relevant KPIs validated from past factual data to assess future simulated performance obtained from different policy scenarios.
In the literature, Data Envelopment Analysis (DEA) is used to evaluate the efficiency of different entities called Decision Making Units (DMUs). DEA is a non-parametric technique that relies on linear programming and benefits from this approach to assess the relative efficiency of DMUs comparing their production of outputs based on their consumption of inputs. DEA was developed by Charnes et al. [10] to measure the performance of an educational program in the USA, defining efficiency as a ratio of outputs to inputs.
The use of DEA in the assessment of efficiency is wide and includes banks, ports, universities, or hospitals thanks to the flexibility of this novel data method. In the context of energy efficiency, Mardani et al. [11] review the used DEA model in energy efficiency between 2006 and 2015 in 45 high-ranking journals. In total, they classified 144 articles on different areas like energy saving, water efficiency, renewable and sustainable energy, and others providing different DEA models to evaluate energy efficiency and identifying relevant attributes to improve the energy service.
In addition, Sueyoshi et al. [12] review DEA applications on energy, the environment, and other areas to improve the degree of efficiency on operations at the industry level and the environment at the company, region and country level, since energy efficiency is one of the most cost effective ways to combat global warming and climate change. Some of these applications consider unavoidable undesirable outputs such as carbon dioxide (CO2), particulate matter 2.5 (PM2.5), solid waste, sulfur dioxide, and wastewater that are associated with desirable production and whose reductions are made possible by effective operational management [13]. However, there are other applications that do not consider undesirable outputs [14].
Used carefully, DEA potentially can facilitate analysis of the main policy issues and improve business strategies to enhance the sustainability of cities. Yang et al. [15] evaluate regional environmental efficiency in China over 10 years based on the super-efficiency DEA model to observe regional disparities. Those super-efficiency models are also useful to assess benchmark performances. Recently, Zhao et al. [16] link the socio-economic and environmental perspective in the evaluation of cities with a linked parallel system of two subsystems to understand the operational process of the sustainable development system.
We study how efficient cities use their inputs to produce desirable outputs. Our main purpose is to evaluate whether cities are using efficiently their available inputs from an environmental perspective. Then, we can deduce some sociological consequences without causal endorsement. Amongst all the alternatives available, we opt for the Slack-Based Inefficiency (SBI) model because it relies on slacks. This enables us to determine the percentages that cities should reduce their inputs in order to reach total efficiency. Efficiency is obtained by subtracting the quantity of SBI against 1, so the best performers (in the benchmark) have an efficiency score equal to 100%. Decisions on what is efficient or what is not depend on the outputs expected to achieve using available inputs from the territory to address local goals. As Gottdiener and Hutchinson [17] conclude, the human ecosystem framework may look like a shopping list of system components. However, it is crucial to realize that the most significant feature of the framework is the fact that it points out the interactions among specific natural, social, and cultural components of the metropolis. This recognition prompts ecologists to be concerned with how people use and behave in the metropolitan ecosystem in a spatially explicit way.
Therefore, further to political decisions on efficiency, we emphasize that the human ecosystem is the result of a complex interaction in which social issues such as poverty, inequality, environmental justice, and public participation in decision-making and space production, in sum equities, must be taken into account. Ahern [18] addresses the dynamic interactions between nature and society, how social change influences the environment and how environmental change shapes society.
We control for only three inputs to simplify the analysis: population, water, and energy consumption. Potentially, this could be helpful for policymakers to tackle social problems and increase awareness within the inhabitants of the metropolitan ecosystem [19]. Population is important for several reasons. Firstly, as mentioned earlier, the growing urban population puts pressure on land and services. Secondly, climate risks and hazards are unevenly distributed and socially differentiated especially in cities where there are diverse populations, with different languages, culture background, age, sex, etc. [20]. Climate change injustice happens along ethnic, gender, class, and racial lines [21,22]. Thirdly, people must participate actively in reducing the impact of the ecological crisis in cities. They are fundamental stakeholders in front of risks of natural hazards in cities and special attention should be given to vulnerable population. Furthermore, it is important that people are properly sensitized, informed, and warned about risks and hazards. Finally, inequality leads to greater environmental degradation, and a more equitable distribution of power and resources would result in improved environmental quality [23,24].
The paper is organized as follows. In Section 1, we expose the main concepts and objectives of this work, which are framed within the 2030 UN goals. In Section 2, we explain our model and carry out a statistical analysis of data. Section 3 describes the main results we got from the analysis. In Section 4, we discuss results with the existing literature. Finally, we set out our main conclusions.
2. Materials and Methods
DEA is a non-parametric technique that evaluates the efficiency of each operational unit—called Decision Making Units (DMUs)—in the model and defines the operational targets or benchmarks of the inefficient ones. The concept of efficiency assesses the production capacity of the DMUs based on their available resources. The observed data defines the Production Possibility Set (PPS), known as technology, under different assumptions. There are three types of technology: Free Disposal Hull (FDH) considers free disposal of inputs and outputs; Variable Return of Scale (VRS) considers also lineal convexity of the observed DMUs; and Constant Return of Scale (CRS) comprises VRS technology and assumes that any observed operational unit can be scaled [25]. Then, the efficient frontier (EF) is a result of the subset of DMUs that performs best in the PPS. This subset dominates since no one can produce more outputs with a smaller amount of inputs. Each inefficient DMU is projected over the EF, thereby defining its benchmark. In each dimension, the distance of an inefficient DMU to the efficient frontier is called a slack . Those DMUs on the EF are efficient and, therefore, their slacks are zero.
Inefficient DMUs have different benchmarks depending on the DEA model specification used defining as benchmarks, the most efficient operational units. The choice of DEA specification depends on the goal that the decision maker wants to analyze. For example, input-oriented models focus on reducing the amount of inputs, output-oriented models prioritize the increase the production, and non-oriented models reduce the inputs at the same time that increase the outputs. Alternatively, the benchmarks depend on the metric used (radial, directional distance function, slack-based, etc.). The first class of DEA models are radial models, like CCR [10]. These models project the DMUs over the EF, measuring the technical efficiency of each units. However, they overestimate the technical efficiency when the nonzero slacks are present. Charnes et al. [26] propose an additive model to curb this overestimation while maximizing the slacks of inputs and outputs at the same time.
In DEA, multiple models can be used to measure the performance of the evaluated units. The additive model proposed by Charnes et al. [26] is able to discriminate between efficient and inefficient DMUs. However, the different properties between this model and the CCR model are explained by the different units that the sum of slacks of inputs and outputs follow. This could justify the use of other slack-based models like the Range Adjusted Model (RAM) developed by Cooper et al. [27], which normalize the slacks of inputs and outputs, and the Slack Based Measure (SBM) model which satisfies monotonicity and unit invariance with respect to slacks developed by Tone [28]. Later, Fukuyama and Weber [29] defined the Slack Based Inefficient (SBI) model to measure the technical inefficiency while considering all slack in the input and output constraint. The SBI model we use is related to the directional technology distance function [30,31] that seeks a maximum non-radial increment in outputs while reducing inputs for a given directional vector.
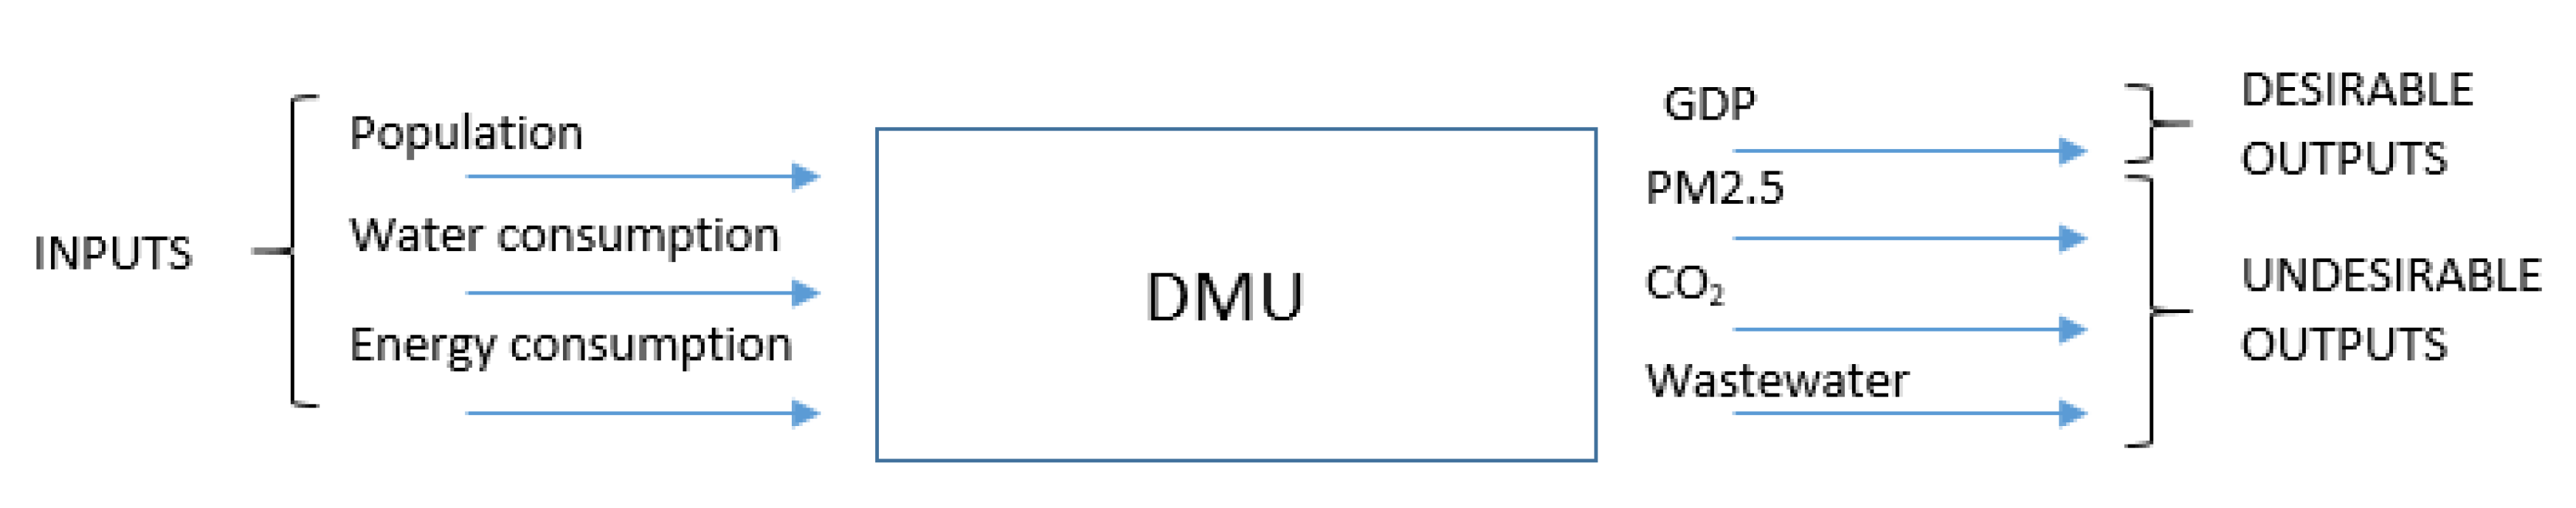
Our model estimates data from 45 cities and controls for three inputs (population, water, and energy) to produce outputs (desirable and non-desirable). Figure 1 illustrates the control variables we incorporate in our model to evaluate the efficiency of the cities. Our inputs are population (number of people living in the city), water consumption (m3), and energy consumption (MWh). The desirable output is gross domestic product (GDP) (measured in US Dollars), and the undesirable outputs are PM2.5 (measured in average level in µg/m3 experienced by the population), CO2 (thousands of equivalent CO2 Tons), and wastewater (%).
We propose the utilization of the SBI Model to evaluate the efficiency of cities. SBI models are non-oriented. This demands that the normalization of the slacks is performed with the observed values of evaluated DMUs [32]. Indeed, this is what we analyze from an empirical approach. The non-oriented feature of the SBI models reduces inputs and maximizes outputs at the same time. As SBI model assesses the inefficiency, efficiency is obtained by subtracting the coefficient from SBI against 1. We apply this model over each DMU, thereby maximizing the mean of their normalized slacks (1).
The analysis of efficiency assumes a set of observed DMUs {}, where each DMU needs inputs to produce desirable outputs . However, the production of these desirable outputs creates undesirable outputs , which are linked to the process. These undesirable outputs can be modeled under the assumption of weak disposability, implying that undesirable outputs can be reduced, but at a cost which will require the reduction of the production of desirable outputs [33]. The left part of constraints (2-4) define the efficient frontier based on DMUs, while the right part shows the slacks of the evaluated DMU . The variables represent the weak disposability assumption proposed by Kuosmanen [33]; and constraint (5) specifies that technology under Variable Returns to Scale (VRS). Thus, the EF is a lineal convexity of the observed DMUs. The reason why we set VRS is attributed to the higher discrimination assumed among DMUs than under CRS [15]. Therefore, not comparing the DMUs with other scaled DMUs offers a more realistic comparison. As a consequence, the EF under VRS technology has a higher number of DMUs than under CRS technology.
s.t.
In this model, all efficient DMUs have zero SBI value. Then, they are on the EF. Earlier, we emphasized that SBI model measures the inefficiency of DMUs. This inefficiency is defined as the average of the mean normalized slacks of the DMU grouped by inputs, undesirable outputs, and desirable outputs. Therefore, the efficiency of a DMU is determined by the parameter theta, which is calculated as follows: .
A further insight can be taken from Equations (7)–(9) which measures the normalized slack of inputs, desirable outputs, and undesirable outputs, respectively.
3. Result
3.1. Descriptive Analysis
In our analysis, we identify similar cities around the world with similar sizes. Indeed, DEA and the SBI model provide a neutral background to measure efficiency as the common goal and offer an excellent tool for a comprehensive evaluation of sustainability regardless of the different realities, climate, societies, and interactions amongst cities. This is our main hypothesis.
We selected data from the OECD data repositories with additions from the World Council from City Data. This includes 45 cities, mostly from Europe but also covers the US, Chile, and Japan. We gathered information related to population, real GDP, air pollution measured in PM2.5, CO2 footprint, energy and water consumption for each city. Table 1 summarizes the main descriptive statistics from the data source.
In Table 1, Manchester has the largest number of inhabitants and Trondheim has the lowest number of inhabitants. Lyon consumes the highest volume of fresh water and Belfast consumes the lowest volume. Porto consumes the highest total energy in 2018 and Cartagena consumes the lowest. Portland is the richest city in terms of real GDP and Cartagena is the poorest. Cracow is the most polluted city (in PM2.5) in the sample and Portland is the least. San Antonio is the highest CO2 emitter and Debrecen is the city with the lowest level of CO2 emissions. Finally, Concepcion processes the highest level of urban wastewater and Cartagena possesses the lowest. We measure which dimensions each inefficient city should improve on to reach an efficient frontier based on available data.
3.2. Regression Results
Table 2 details our estimates from the SBI model. Coefficients report normalized slacks of each city for inputs (SBI X), desirable outputs (SBI Y), and undesirable outputs (SBI YB) and the overall efficiency indicator () is shown in the last column. Almost half of the cities are efficient (20 cities). The remaining 25 cities are considered to be inefficient and only six of them (Hiroshima, Antwerp, The Hague, Nice, Lille and Bordeaux) have benchmarks that are able to produce more GDP than their current level. This means that the remaining inefficient cities could improve their performance by better managing their resources and reducing their undesirable outputs. Moreover, 56% of the inefficient DMUs have a higher normalized slack for the undesirable outputs than for the inputs.
For the inefficient units, we computed the slacks to identify the inputs each inefficient city should change to be more efficient in the management of their available resources (Table 3). Overall, inefficient cities have margin of improvement if they reduce their water consumption since the mean and the median of this slack is 54.92% and 55.64%, respectively. For population and energy, the medians are 8.96% and 11.16%, respectively and the means are 11.76% and 16.56%, respectively.
Vancouver, Hanover Linz, The Hague, Toulouse, Gothenburg, Tallinn, Utrecht, Antwerp, Rotterdam, Helsinki, Tampa-Pinellas, and Pittsburgh are the only inefficient cities that can reduce their energy consumption after comparing their performance with their benchmarks. The mean of their Energy Consumption Slacks is 0.17. In this subset of cities, only six of them (Gothenburg, Hanover, Helsinki, Vancouver, Toulouse, and Tampa-Pinellas) have as a benchmark a city with a lower population (Table 4). These six cities are the only ones that have input slacks for the three inputs. Regarding the undesirable outputs, wastewater is the variable with the lowest values of slacks (0.26 as the median and 0.28 as the mean), while CO2 is the variable with the highest slacks of all the undesirable outputs (0.42 as the median and 0.43 as the mean).
DEA allows observing which are the benchmarks for any inefficient unit and the observed efficient cities that define those benchmarks. There are 10 cities (Bilbao, Bologna, Cracow, Florence, Glasgow, Lyon, Manchester, Trondheim, Turin, and Turku) that are efficient but do not act as a benchmark for any inefficient unit, since they are outliers. On the contrary, Aarhus, Belfast, Cartagena, Copenhagen, Cork, Debrecen, Marbella, Portland, Porto, and Zurich are peers, efficient cities that define the benchmarks for those inefficient units. Copenhagen, Debrecen, and Zurich are the most used efficient cities to define the targets of the database.
Table 5 relates the influence of each efficient city (benchmark) over the inefficient cities. We show inefficient cities in rows and the efficient cities (benchmarks) that act as peers for any of the inefficient city in this dataset in columns. Table 5 shows estimates of and , which define the benchmarks. The variable searches for the peers in constraints (3-4) for the desirable and undesirable outputs due to weak disposability assumption, while the sum tracks down the peers in constraint (2) for the inputs. The coefficient takes zero value for all the inefficient units when they are using Debrecen as peer, except for Concepcion which has . This means that Concepcion has Debrecen as a peer due to its production level of desirable and undesirable outputs for its consumption of inputs, while for the rest of the inefficient cities that have Debrecen as a peer, its expertise as resource manager is a reference for them. On the contrary, Zurich acts as peer for most of the inefficient units not only for their resource management, but for their level of production too.
4. Discussion
In recent years, DEA has been widely used to assess urban sustainability [34,35,36]. From an empirical approach, the use of DEA in urban contexts assesses the performance of the cities comprising all the potential dimensions related to sustainability. DEA can be used in benchmarking, target setting, measuring returns to scale, measuring congestion, etc. Because of the capabilities of DEA models in evaluating and ranking DMUs [37]. Despite DEA being an excellent tool to guide policy makers to improve social and urban sustainability [13], it is important to acknowledge that it has to be used carefully and researchers must be aware of its limitations and strengths.
From an urban policy perspective that includes the analysis of KPIs, this paper comprehensively addresses one of the most important dilemmas in the assessment of urban sustainability. We benefit from the SBI model and assumed Variable Returns to Scale (VRS) in the production function (technology). This helps us to evaluate the performance of the cities in a more realistic way, contrary to most of existing empirical evidence [17]. A similar approach has been applied to the integrated sustainability performance assessment of Universities (based on UI GreenMetric ranking) by Puertas and Marti [38].
The result is that almost half of the cities of our sample are efficient. Half of the efficient cities perform as a benchmark for the inefficient units and the other half are outliers. Therefore, inefficient cities do not take any of those outliers as peers (benchmarks). Looking more closely at the information included in Table 4, any city can observe what are their benchmarks (and so replicate relevant policies) for any inefficient unit and the observed efficient cities that define those benchmarks. Overall efficiency is not relevant for decision makers if the city does not act as a benchmark for any inefficient unit (when efficient cities are outliers). On the other hand, Aarhus, Belfast, Cartagena, Copenhagen, Cork, Debrecen, Marbella, Portland, Porto, and Zurich are peers that define the benchmarks for the inefficient cities. Copenhagen, Debrecen and Zurich are the most commonly used efficient cities to define the targets for their independent benchmarks.
From a practical point of view, any city incorporated to the database can obtain a diagnosis first on its relative efficiency, and then on specific benchmarks from peers for setting their future (optimal) policy goals. When a city looks at its relative ranking position from the SBI efficiency model (Table 2). Later, a detailed comparison of their relative slacks and corresponding benchmarks provides information what policies have to be addressed for an optimal result on the given city. In sum, slacks inform about which variables inefficient cities should reduce (in the case of inputs or undesirable outputs) or which variables they should increase (GDP) in order to improve their performance and become more efficient cities. Bigger slacks mean that the efforts that cities should carry out are bigger in that variable.
This paper is not exempted from some limitations. First, as the model obtained with the use of DEA and SBI is the best among the possible models with the available data, the restricted available data we have coped with mean that we still can improve our model a great deal. We are committed to looking for more data in order to make a better and more complex model which reflects the reality of cities meaningfully. Second, the use of DEA and SBI invariably leads to a specific final model. In our work, SBI model searches for the maximum distance of the inefficient cities to the EF, thereby reducing their resources involving undesirable outputs whilst increasing their desirable outputs. Other models define a fixed direction of all the DMUs to be projected over the EF, while in our model each DMU follows their own direction. Third, in this paper we have focused on a concrete period for the assessment of the efficiency of the cities. We consider that a multiple period analysis could be an interesting further research area to carry on.
5. Conclusions
This paper evaluates the performance of cities utilizing the SBI model to guide that process. While this model has been tested in multiple applications, we have found none in the context of sustainability, and we are therefore excited to present our results in this forum. Apart from that, the application of this model using both desirable and undesirable outputs following the weak disposability assumption represents an excellent opportunity to give proper feedback to cities. Cities can benefit from this analysis to enhance their performance, even though there are evident limitations due to the DEA methodology, available data, and the fact that the goal proposed in the model affects the search of the benchmarks.
Looking closely at the influence of each efficient city (benchmark) over the inefficient cities (Table 5) specific policies from benchmarked cities can be monitored to ascertain their relevance on the measurement of efficiency for each city. Since all the selected cities were gathered in the data under the same standard (ISO 37120) and have similar population size, policies can be followed up to improve the decision-making processes.
The effect of specific urban policies can be explored by simulating the future evolution of inputs and outputs on this model, allowing insight into the overall effect of city decisions on the most efficient result for cities’ future. Later developments could include exploring simulations on KPI evolution for verifying reasonable performance.
Author Contributions
L.C.-I. contributions are conceptualization, formal analysis, funding acquisition, investigation, methodology, visualization and writing original draft; A.M.L.-N. contributions are funding acquisition, investigation, supervision, writing original draft, and writing the review & editing; A.N.-E. contributions are formal analysis, funding acquisition, investigation, supervision, writing original draft and writing review & editing; J.O.-M. contributions are data curation, funding acquisition, resources, investigation, supervision, writing original draft and writing review & editing. All authors have read and agreed to the published version of the manuscript.
Funding
This research was funded by the International Mentoring Foundation for the Advancement of Higher Education (IMFAHE).
Acknowledgments
We are grateful for the funding awarded and all organizational support provided by IMFAHE in their continuous effort to develop excellence in university collaboration, and anonymous reviewers for their feedback to improve this paper.
Conflicts of Interest
The authors do not identify any conflict of interest. They acknowledge that funders had no role in the design of the study; in the collection, analyses, or interpretation of data; in the writing of the manuscript, or in the decision to publish the results.
References
- Gospodini, A. Urban design: The evolution of concerns, the increasing power, challenges and perspectives. J. Urban Des. 2020, 25, 16–20. [Google Scholar] [CrossRef]
- Keskinen, M.; Sojamo, S.; Varis, O. Enhancing Security, Sustainability and Resilience in Energy, Food and Water. Sustainability 2019, 11, 7244. [Google Scholar] [CrossRef] [Green Version]
- De Kock, P.; Carta, S. Trojans of ambiguity vs. resilient regeneration: Visual meaning in cities. Constr. Econ. Build. 2019, 19. [Google Scholar]
- IISBE. “SBTool” Home. IISBE. Available online: http://www.iisbe.org/sbmethod (accessed on 20 January 2020).
- CASBEE. Certification System. Available online: http://www.ibec.or.jp/CASBEE/english/certificationE.htm (accessed on 23 January 2020).
- Addressing the Sustainable Urbanization Challenge (UN Reports). Available online: https://www.un.org/en/chronicle/article/addressing-sustainable-urbanization-challenge (accessed on 17 February 2020).
- Zellner, M.; Campbell, S.D. Planning for deep-rooted problems: What can we learn from aligning complex systems and wicked problems? Plan. Theory Pract. 2015, 16, 457–478. [Google Scholar] [CrossRef]
- Chen, Z.; Kourtzidis, S.; Tzeremes, P.; Tzeremes, N. A robust network DEA model for sustainability assessment: An application to Chinese Provinces. Oper. Res. 2020. [Google Scholar] [CrossRef]
- Labaka, L.; Maraña, P.; Giménez, R.; Hernantes, J. Defining the roadmap towards city resilience. Technol. Forecast. Soc. Chang. 2019, 146, 281–296. [Google Scholar] [CrossRef]
- Charnes, A.; Cooper, W.W.; Rhodes, E. Measuring the Efficiency of Decision Making Units. Eur. J. Oper. Res. 1978, 2, 429–444. [Google Scholar] [CrossRef]
- Mardani, A.; Zavadskas, E.K.; Streimikiene, D.; Jusoh, A.; Khoshnoudi, M. A Comprehensive Review of Data Envelopment Analysis (DEA) Approach in Energy Efficiency. Renew. Sustain. Energy Rev. 2017, 70, 1298–1322. [Google Scholar] [CrossRef]
- Sueyoshi, T.; Yuan, Y.; Goto, M. A Literature Study for DEA Applied to Energy and Environment. Energy Econ. 2017, 62, 104–124. [Google Scholar] [CrossRef]
- Yu, Y.; Wen, Z. Evaluating China’s Urban Environmental Sustainability with Data Envelopment Analysis. Ecol. Econ. 2010, 69, 1748–1755. [Google Scholar] [CrossRef]
- Hu, J.L.; Kao, C.H. Efficient Energy-Saving Targets for APEC Economies. Energy Policy 2007, 35, 373–382. [Google Scholar] [CrossRef]
- Yang, L.; Ouyang, H.; Fang, K.; Ye, L.; Zhang, J. Evaluation of Regional Environmental Efficiencies in China Based on Super-Efficiency-DEA. Ecol. Indic. 2015, 51, 13–19. [Google Scholar] [CrossRef]
- Zhao, L.; Zha, Y.; Zhuang, Y.; Liang, L. Data Envelopment Analysis for Sustainability Evaluation in China: Tackling the Economic, Environmental, and Social Dimensions. Eur. J. Oper. Res. 2019, 275, 1083–1095. [Google Scholar] [CrossRef]
- Gottdiener, M.; Hutchison, R. The New Urban Sociology, 2nd ed.; McGraw Hill: New York, NY, USA, 2018. [Google Scholar]
- Ahern, J. From fail-safe to safe-to-fail: Sustainability and resilience in the new urban world. Landsc. Urban Plan. 2011, 100, 341–343. [Google Scholar] [CrossRef] [Green Version]
- Berkowitz, A.R.; Nilon, C.H.; Hollweg, K.S. (Eds.) A NewFrontier for Science and Education; Springer: New York, NY, USA, 2003. [Google Scholar]
- Davies, M.; Guenther, B.; Leavy, J.; Mitchell, T.; Tanner, T. Climate change adaptation, disaster risk reduction and social protection: Complementary roles in agriculture and rural growth? IDS Work. Pap. 2009, 2009, 1–37. [Google Scholar] [CrossRef]
- Mohai, P.; Pellow, D.; Roberts, J.T. Environmental justice. Annu. Rev. Environ. Resour. 2009, 34, 405–430. [Google Scholar] [CrossRef]
- Adger, W.N.; Paavola, J.; Huq, S.; Mace, M.J. Fairness in Adaptation to Climate Change; MIT Press: Cambridge, MA, USA, 2006. [Google Scholar] [CrossRef]
- Agyeman, J.; Bullard, R.D.; Evans, B. Exploring the nexus: Bringing together sustainability, environmental justice and equity. Space Polity 2002, 6, 77–90. [Google Scholar] [CrossRef]
- Stymne, S.; Jackson, T. Intra-generational equity and sustainable welfare: A time series analysis for the UK and Sweden. Ecol. Econ. 2000, 33, 219–236. [Google Scholar] [CrossRef]
- Banker, R.D.; Charnes, A.; Cooper, W.W. Some Models for Estimating Technical and Scale Inefficiencies in Data Envelopment Analysis. Manag. Sci. 1984, 30, 1078–1092. [Google Scholar] [CrossRef] [Green Version]
- Charnes, A.; Cooper, W.W.; Golany, B.; Seiford, L.; Stutz, J. Foundations of Data Envelopment Analysis for Pareto-Koopmans Efficient Empirical Production Functions. J. Econ. 1985, 30, 91–107. [Google Scholar] [CrossRef]
- Cooper, W.W.; Park, K.S.; Pastor, J.T. RAM: A Range Adjusted Measure of Inefficiency for Use with Additive Models, and Relations to Other Models and Measures in DEA. J. Prod. Anal. 1999, 11, 5–42. [Google Scholar] [CrossRef]
- Tone, K. A Slacks-Based Measure of Efficiency Ciency in Data Envelopment Analysis. Eur. J. Oper. Res. 2001, 130, 498–509. [Google Scholar] [CrossRef] [Green Version]
- Fukuyama, H.; Weber, W.L. A Directional Slacks-Based Measure of Technical Inefficiency. Socio-Econ. Plan. Sci. 2009, 43, 274–287. [Google Scholar] [CrossRef]
- Chambers, R.G.; Chung, Y.; Färe, R. Benefit and Distance Functions. J. Econ. Theory 1996, 70, 407–419. [Google Scholar] [CrossRef]
- Chambers, R.G.; Chung, Y.; Färe, R. Profit, Directional Distance Function and Nerlovian Efficiency. J. Optim. Theory Appl. 1998, 98, 351–364. [Google Scholar] [CrossRef]
- Gutiérrez, E.; Aguilera, E.; Lozano, S.; Guzmán, G.I. A Two-Stage DEA Approach for Quantifying and Analysing the Inefficiency of Conventional and Organic Rain-Fed Cereals in Spain. J. Clean. Prod. 2017, 149, 335–348. [Google Scholar] [CrossRef]
- Kuosmanen, T. Weak Disposability in Nonparametric Production Analysis with Undesirable Outputs. Am. J. Agric. Econ. 2005, 87, 1077–1082. [Google Scholar] [CrossRef]
- Alfonso Piña, W.H.; Pardo Martínez, C.I. Development and Urban Sustainability: An Analysis of Efficiency Using Data Envelopment Analysis. Sustainability 2016, 8, 148. [Google Scholar] [CrossRef] [Green Version]
- Zhou, H.; Yang, Y.; Chen, Y.; Zhu, J. Data Envelopment Analysis Application in Sustainability: The Origins, Development and Future Directions. Eur. J. Oper. Res. 2018, 264, 1–16. [Google Scholar] [CrossRef]
- Yan, Y.; Shan, P.; Wang, C.; Quan, Y.; Wu, D.; Zhao, C.; Wu, G.; Deng, H. Assessment of Urban Sustainability Efficiency Based on General Data Envelopment Analysis: A Case Study of Two Cities in Western and Eastern China. Environ. Monit. Assess. 2017, 189, 191. [Google Scholar] [CrossRef]
- Izadikhah, M.; Farzipoor Saen, R. Ranking sustainable suppliers by context-dependent data envelopment analysis. Ann. Oper. Res. 2019. [Google Scholar] [CrossRef]
- Puertas, R.; Marti, L. Sustainability in Universities: DEA-GreenMetric. Sustainability 2019, 11, 3766. [Google Scholar] [CrossRef] [Green Version]
Figure 1.
Scheme of variables used in the efficiency analysis. Being decision making units (DMU), gross domestic product (GDP), particulate matter 2.5 (PM2.5), carbon dioxide (CO2).
Figure 1.
Scheme of variables used in the efficiency analysis. Being decision making units (DMU), gross domestic product (GDP), particulate matter 2.5 (PM2.5), carbon dioxide (CO2).


Table 1.
Summary statistics.
| Variables | Description | Max | Min | Mean | Median | S.d. |
|---|---|---|---|---|---|---|
| Population | Number of inhabitants | 3,377,602 | 281,586 | 1,329,494.77 | 1,221,513 | 651,664.53 |
| Water consumption | 103 m3 | 3228.9 | 85,826.9 | 841,671.1 | 60,260.9 | 687,605.6 |
| Energy consumption | MWh | 23,811.61 | 145.81 | 5180.03 | 3010.77 | 5008.36 |
| GDP | US dollars | 159,682 | 5,321 | 54,573.49 | 47,158 | 34,770.68 |
| PM2.5 | Average level in µg/m3 | 30.50 | 5.50 | 12.08 | 10.90 | 4.66 |
| CO2 | Thousands of equivalent CO2 Tons | 81,287.54 | 3499.10 | 21,743.08 | 14,567.56 | 18,612.75 |
| Wastewater | (%) | 99.90 | 54.80 | 87.54 | 83.00 | 12.06 |
Table 2.
Estimates from the Slack Based Inefficiency (SBI) efficiency model. Being: SBI Inputs (X), SBI Desirable Outputs (Y), SBI Undesirable Outputs (YB).
Table 2.
Estimates from the Slack Based Inefficiency (SBI) efficiency model. Being: SBI Inputs (X), SBI Desirable Outputs (Y), SBI Undesirable Outputs (YB).
| CITIES | SBI | SBI X | SBI Y | SBI YB | EFFICIENCY (θ) |
|---|---|---|---|---|---|
| Liverpool (ENG) | 0.08 | 0.13 | - | 0.08 | 92% |
| Sheffield (ENG) | 0.12 | 0.18 | - | 0.13 | 88% |
| Gothenburg (SWE) | 0.14 | 0.16 | - | 0.19 | 86% |
| Thessaloniki (GRE) | 0.14 | 0.18 | - | 0.19 | 86% |
| Valencia (ESP) | 0.15 | 0.27 | - | 0.12 | 85% |
| Concepcion (CHI) | 0.15 | 0.19 | - | 0.19 | 85% |
| Vancouver (CAN) | 0.18 | 0.21 | - | 0.25 | 82% |
| San Antonio (USA) | 0.19 | 0.24 | - | 0.25 | 81% |
| Malaga (ESP) | 0.19 | 0.16 | - | 0.32 | 81% |
| Seville (ESP) | 0.20 | 0.27 | - | 0.24 | 80% |
| Helsinki (FIN) | 0.20 | 0.41 | - | 0.15 | 80% |
| Rotterdam (HOL) | 0.22 | 0.38 | - | 0.22 | 78% |
| Pittsburgh (USA) | 0.24 | 0.44 | - | 0.21 | 76% |
| Toulouse (FRA) | 0.25 | 0.42 | - | 0.25 | 75% |
| Hanover (GER) | 0.26 | 0.25 | - | 0.39 | 74% |
| Utrecht (HOL) | 0.26 | 0.26 | - | 0.40 | 74% |
| Bordeaux (FRA) | 0.27 | 0.21 | 0.26 | 0.24 | 73% |
| Linz (AUS) | 0.28 | 0.23 | - | 0.45 | 72% |
| Hiroshima (JPN) | 0.29 | 0.28 | 0.16 | 0.31 | 71% |
| Tampa-Pinellas (USA) | 0.29 | 0.52 | - | 0.26 | 71% |
| The Hague (HOL) | 0.29 | 0.27 | 0.19 | 0.30 | 71% |
| Antwerp (BEL) | 0.29 | 0.30 | 0.19 | 0.29 | 71% |
| Nice (FRA) | 0.32 | 0.33 | - | 0.48 | 68% |
| Tallinn (EST) | 0.33 | 0.25 | 0.20 | 0.40 | 67% |
| Lille (FRA) | 0.35 | 0.38 | 0.26 | 0.30 | 65% |
Note: Benchmarks were identified in Aarhus (DEN), Belfast (NI), Bilbao (ESP), Bologna (IT), Cartagena (ESP), Copenhagen (DEN), Cork (IRE), Cracow (POL), Debrecen (HUN), Florence (IT), Glasgow (SCO), Lyon (FRA), Manchester (ENG), Marbella (ESP), Portland (USA), Porto (POR), Trondheim (NOR), Turin (ITA), Turku (FIN), Zurich (SWI).
Table 3.
Summary statistics of the normalized slacks of the variables for inefficient DMUs.
| Variable | Max | Min | Mean | Median | Sd | |
|---|---|---|---|---|---|---|
| INPUTS | Population | 29.50% | 0.00% | 11.76% | 8.96% | 11.24% |
| Water consumption | 88.15% | 1.69% | 54.92% | 55.64% | 22.14% | |
| Energy consumption | 55.23% | 0.00% | 16.56% | 11.16% | 19.27% | |
| DESIRABLE OUTPUTS | GDP | 26.48% | 0.00% | 5.07% | 0.00% | 9.39% |
| UNDESIRABLE OUTPUTS | PM2.5 | 65.66% | 0.20% | 35.35% | 36.00% | 18.78% |
| CO2 | 79.61% | 22.95% | 43.04% | 41.76% | 15.74% | |
| Waterwaste | 63.97% | 0.00% | 27.69% | 25.52% | 18.02% |
Table 4.
Normalized slacks by inefficient city.
| City | Inputs | Desirable Output | Undesirable Outputs | ||||
|---|---|---|---|---|---|---|---|
| Population | Water Consumption | Energy Consumption | GDP | PM2.5 | CO2 | Wastewater | |
| Antwerp | - | 0.56 | 0.33 | 0.19 | 0.43 | 0.52 | 0.23 |
| Bordeaux | 0.16 | 0.48 | - | 0.26 | 0.40 | 0.38 | 0.19 |
| Concepcion | 0.09 | 0.48 | - | - | 0.27 | 0.24 | 0.26 |
| Gothenburg | 0.14 | 0.02 | 0.34 | - | 0.17 | 0.23 | 0.38 |
| Hanover | 0.07 | 0.47 | 0.22 | - | 0.54 | 0.50 | 0.51 |
| Helsinki | 0.02 | 0.68 | 0.53 | - | 0.00 | 0.30 | 0.28 |
| Hiroshima | 0.08 | 0.76 | - | 0.16 | 0.44 | 0.47 | 0.34 |
| Lille | 0.28 | 0.86 | - | 0.26 | 0.54 | 0.48 | 0.19 |
| Linz | - | 0.52 | 0.17 | - | 0.65 | 0.55 | 0.60 |
| Liverpool | 0.24 | 0.16 | - | - | 0.08 | 0.23 | 0.00 |
| Malaga | - | 0.48 | - | - | 0.60 | 0.24 | 0.43 |
| Nice | 0.08 | 0.68 | - | 0.20 | 0.66 | 0.43 | 0.50 |
| Pittsburgh | - | 0.78 | 0.55 | - | 0.18 | 0.67 | - |
| Rotterdam | - | 0.78 | 0.35 | - | 0.27 | 0.42 | 0.19 |
| San Antonio | 0.29 | 0.42 | - | - | 0.48 | 0.33 | 0.21 |
| Seville | 0.26 | 0.56 | - | - | 0.40 | 0.39 | 0.19 |
| Sheffield | 0.30 | 0.25 | - | - | 0.20 | 0.29 | 0.04 |
| Tallinn | - | 0.74 | 0.25 | - | 0.50 | 0.80 | 0.64 |
| Tampa-Pinellas | 0.12 | 0.88 | 0.55 | - | 0.03 | 0.71 | 0.30 |
| The Hague | - | 0.61 | 0.21 | 0.19 | 0.36 | 0.57 | 0.28 |
| Thessaloniki | 0.09 | 0.45 | - | - | 0.34 | 0.37 | 0.05 |
| Toulouse | 0.24 | 0.82 | 0.21 | - | 0.34 | 0.44 | 0.21 |
| Utrecht | - | 0.45 | 0.32 | - | 0.53 | 0.62 | 0.45 |
| Valencia | 0.22 | 0.60 | - | - | 0.14 | 0.32 | 0.04 |
| Vancouver | 0.28 | 0.25 | 0.11 | - | 0.32 | 0.28 | 0.40 |
| Mean | 0.12 | 0.55 | 0.17 | 0.05 | 0.35 | 0.43 | 0.28 |
| Median | 0.09 | 0.56 | 0.11 | 0.00 | 0.36 | 0.42 | 0.26 |
Table 5.
Influence of each efficient city (benchmark) over the inefficient cities.
| Aarhus | Belfast | Cartagena | Copenhagen | Cork | Debrecen | Marbella | Portland | Porto | Zurich | |
|---|---|---|---|---|---|---|---|---|---|---|
| Antwerp | ./. | ./. | ./. | ./. | ./. | ./0.25 | ./. | ./. | ./. | 0.75/0.75 |
| Bordeaux | ./. | ./. | ./. | ./. | ./. | ./0.33 | ./. | ./. | ./. | 0.67/0.67 |
| Concepcion | ./. | ./. | 0.34/0.34 | ./. | ./. | 0.36/0.36 | ./. | ./. | 0.30/0.30 | ./. |
| Gothenburg | ./0.25 | ./0.21 | ./. | ./. | ./. | ./. | ./. | ./. | ./. | 0.54/0.54 |
| Hanover | ./. | ./0.24 | ./. | 0.51/0.51 | ./. | ./. | ./. | ./. | ./. | ./. |
| Helsinki | ./0.19 | ./. | ./. | 0.65/0.65 | ./. | ./0.16 | ./. | ./. | ./. | ./. |
| Hiroshima | ./. | ./. | ./. | 0.56/0.56 | ./. | ./0.44 | ./. | ./. | ./. | ./. |
| Lille | ./. | ./. | ./. | ./. | ./. | ./0.37 | ./. | ./. | ./. | 0.63/0.63 |
| Linz | ./. | ./. | ./. | ./. | 0.20/0.20 | ./0.53 | ./. | ./. | ./. | 0.27/0.27 |
| Liverpool | ./. | 0.88/0.88 | ./. | 0.10/0.10 | ./. | ./. | ./. | ./. | 0.02/0.02 | ./. |
| Malaga | ./. | ./. | ./. | ./. | 0.00/0.00 | ./0.43 | ./. | ./. | 0.53/0.53 | 0.04/0.04 |
| Nice | ./. | ./. | ./. | ./. | ./. | ./0.59 | ./. | ./. | ./. | 0.41/0.41 |
| Pittsburgh | ./. | ./. | ./. | 0.50/0.50 | ./. | ./0.30 | ./. | 0.01/0.01 | ./. | 0.19/0.19 |
| Rotterdam | ./. | ./. | ./. | 0.66/0.66 | ./. | ./0.15 | ./. | ./. | ./. | 0.19/0.19 |
| San Antonio | ./. | ./0.27 | ./. | 0.01/0.01 | ./. | ./. | ./. | 0.71/0.71 | ./. | ./. |
| Seville | ./. | ./. | ./. | ./. | ./. | ./0.15 | ./. | ./. | 0.63/0.63 | 0.22/0.22 |
| Sheffield | ./. | 0.95/0.95 | ./. | 0.04/0.04 | ./. | ./. | ./. | ./. | 0.01/0.01 | ./. |
| Tallinn | ./. | ./. | ./. | ./. | 0.12/0.12 | ./0.65 | ./. | ./. | ./. | 0.22/0.22 |
| Tampa-Pinellas | ./. | ./. | ./. | 0.57/0.57 | ./. | ./0.41 | ./. | ./. | ./. | ./. |
| The Hague | ./. | ./. | ./. | ./. | ./. | ./0.28 | ./. | ./. | ./. | 0.72/0.72 |
| Thessaloniki | ./. | ./. | 0.13/0.19 | ./. | ./. | ./. | 0.33/0.33 | ./. | 0.54/0.54 | ./. |
| Toulouse | ./. | ./. | ./. | ./. | ./. | ./0.32 | ./. | ./. | ./. | 0.68/0.68 |
| Utrecht | ./. | ./. | ./. | ./. | 0.00/0.00 | ./0.46 | ./. | ./. | ./. | 0.54/0.54 |
| Valencia | ./. | ./. | ./. | 0.07/0.07 | ./. | ./. | ./. | ./. | 0.69/0.69 | 0.23/0.23 |
| Vancouver | ./. | ./0.28 | ./. | ./. | ./. | ./. | ./. | 0.72/0.72 | ./. | ./. |
© 2020 by the authors. Licensee MDPI, Basel, Switzerland. This article is an open access article distributed under the terms and conditions of the Creative Commons Attribution (CC BY) license (http://creativecommons.org/licenses/by/4.0/).
Share and Cite
MDPI and ACS Style
Calzada-Infante, L.; López-Narbona, A.M.; Núñez-Elvira, A.; Orozco-Messana, J. Assessing the Efficiency of Sustainable Cities Using an Empirical Approach. Sustainability 2020, 12, 2618. https://0-doi-org.brum.beds.ac.uk/10.3390/su12072618
AMA Style
Calzada-Infante L, López-Narbona AM, Núñez-Elvira A, Orozco-Messana J. Assessing the Efficiency of Sustainable Cities Using an Empirical Approach. Sustainability. 2020; 12(7):2618. https://0-doi-org.brum.beds.ac.uk/10.3390/su12072618
Chicago/Turabian StyleCalzada-Infante, Laura, Ana María López-Narbona, Alberto Núñez-Elvira, and Javier Orozco-Messana. 2020. "Assessing the Efficiency of Sustainable Cities Using an Empirical Approach" Sustainability 12, no. 7: 2618. https://0-doi-org.brum.beds.ac.uk/10.3390/su12072618
Note that from the first issue of 2016, this journal uses article numbers instead of page numbers. See further details here.