Living under a Fluctuating Climate and a Drying Congo Basin


1
Center for International Forestry Research (CIFOR), Yaoundé P. O. Box 2008 Messa, Cameroon
2
Department of Earth Science, University of Yaoundé 1, Yaoundé P. O. Box 812, Cameroon
3
Higher Institute of Rural Development (ISDR of Mbaïki), University of Bangui, Bangui P. O. Box 1450, Central African Republic (CAR)
4
Faculty of Renewable Natural Resources Management, University of Kisangani, Kisangani P. O. Box 2012, Democratic Republic of Congo (DRC)
*
Author to whom correspondence should be addressed.
Sustainability 2020, 12(7), 2936; https://0-doi-org.brum.beds.ac.uk/10.3390/su12072936
Submission received: 22 December 2019
/
Revised: 17 March 2020
/
Accepted: 20 March 2020
/
Published: 7 April 2020
(This article belongs to the Special Issue Sustainable Global Water Management)
Abstract
:Humid conditions and equatorial forest in the Congo Basin have allowed for the maintenance of significant biodiversity and carbon stock. The ecological services and products of this forest are of high importance, particularly for smallholders living in forest landscapes and watersheds. Unfortunately, in addition to deforestation and forest degradation, climate change/variability are impacting this region, including both forests and populations. We developed three case studies based on field observations in Cameroon, the Central African Republic, and the Democratic Republic of Congo, as well as information from the literature. Our key findings are: (1) the forest-related water cycle of the Congo Basin is not stable, and is gradually changing; (2) climate change is impacting the water cycle of the basin; and, (3) the slow modification of the water cycle is affecting livelihoods in the Congo Basin. Developmental and environmental actions in the Congo Basin need to properly consider the slight modification of this water cycle in watersheds that affect products and services from the forest.
1. Introduction
Forests are part of the water cycle [1,2,3]. Among ecosystem services provided by forests, contribution to hydrology is one of the most important [4,5]. With climate change becoming a priority for the international community, interest is growing in the role of forests for both climate change mitigation and adaptation. Several publications have already noted the linkage between forests and water [1,3,6,7,8,9,10]. In a watershed where both water and forest are present and useful, modification of one can affect the other. As populations depend on forest and water for their livelihood, modification of one will affect these livelihoods, especially for those in rural areas that depend highly on natural resources [9,10]. Of the services provided by water on the continent, irrigation (affecting food security) and drinking water seem to attract the most interest and publications [11]. Other services such as conserving biodiversity [12] and hydropower supply do not attract the same type of attention. In Central Africa, for example, Lake Chad attracts more attention on water management than the Congo Basin, which provides more services such as maintaining biodiversity and storage of carbon stock in the region. The solution to Lake Chad has always been seen as taking water from the Congo River. Water management in this basin is still at a very early stage and has not yet sparked the interest of the international community. However, there are clear linkages between water and several sectors in the region, including forest management.
The Congo Basin, found on both sides of the equator in Central Africa, has a surface area of 3,822,000 km2 [13]. It is the largest basin in Africa [14], occupying six countries: Cameroon, the Central African Republic (CAR), Republic of the Congo (Congo Republic), Democratic Republic of Congo (DRC), Gabon, and Equatorial Guinea. The ecology of these zones is characterized by a vast humid forest covering more than 2 million km2, which gives the zones abundant rainfall (above 1600 mm/year). Mount Cameroon receives more than 10,000 mm of rain per year. With 20% of the total surface area, the Central African region receives 37% of the continent’s precipitation [11]. The Congo Basin, which falls within the region, receives a rainfall “refill” input of more than 1500 mm/year [15]. This basin is characterized by a dense hydrographic network made up of big rivers such as the Oubangui, the Sangha, and the Congo (the main river). The basin, with annual resources of about 1.3 billion m3, accounts for 30% of water sources in Africa [14]. In all, 85.3% of the Congo River Basin falls within the largely forested region of Cameroon, the CAR, the DRC and the Congo Republic [14]. The forest plays a regulatory role as it controls natural processes such as climate (temperature and rainfall, stream flow, and water quality, etc.). The forest also furnishes global services by sequestering and stocking carbon, thus participating in the fight against climate change. It also provides water, food, long-lasting construction material, renewable energy and other services.
Socioeconomically, the climate is central to many activities of rural people in this region, who depend on the forest and other natural resources such as rivers. About 100 million people live in the Congo Basin. One study [16] identifies various key services and products in the basin related to water. These include navigation (a 12,000 km network that allows rural people to travel within and between countries), fishing (around 120,000 metric tons/year) and hydropower (an installation capacity of 6490 MW). These services also include freshwater biodiversity and habitat (700 species of fish already described; 80% of fish endemic to the region; about 15 strictly aquatic mammals; about 280 aquatic frogs; about 20 aquatic snakes, turtles, and crocodiles; about 100 snails/grass tropods). Finally, the basin provides water balance, influencing both the regional and local climate; between 75% and 95% of rainfall comes from recycling moisture from the region’s forests. However, over the last several decades, the basin has experienced climatic disturbances linked to the starting of the rains, and even the quantity of rainfall.
Africa is experiencing less precipitation and tropical rainfall [17]. Halme et al. 2001, as cited by [11], mentioned a change in the rate of rainfall of −3.2 ± 2.2 per decade in the North of Congo. The flow of the main rivers in Central Africa decreased between 1960 and 1995 [18,19,20,21,22]. One key study noted a decrease in rainfall between 1960 and 1970 [23]. In the CAR, many studies [20,22,24,25,26] have reached almost the same conclusions with respect to problematic rainfall and hydrologic variability. Another study [27] reveals that the Congo Republic is already experiencing serious impacts of the effects of climate change (ECC). These ECC manifest through moderate climate variability with a continuing trend toward increasing precipitation and higher temperatures. In towns, heat is more intense and for quite long periods. The impacts are visible on rivers, where flow has been declining since 1970, leading to sand deposits and navigation disturbance. On the coast of the Congo Basin, El Niño-like warming events in the Eastern Atlantic are affecting fish availability from the Congo Republic to Angola [28]. Despite studies on the rainfall stream flow nexus, few researchers have assessed the linkage between water flow perturbation and livelihoods.
In response, some organizations have initiated research here during the last few years, such as the Center for International Forestry Research (CIFOR). In 2008, CIFOR launched Congo Basin Forests and Climate Change Adaptation (COFCCA). On the one hand, this project aimed to help study hydroclimatic variability on the study site. On the other, it sought to understand the implications of this variability on the rural economy and the livelihoods of rural people [29,30,31,32,33]. Building on this previous research, the present study documents changes in the moisture of the Congo Basin. It draws on findings from three sites that identified trends in temperature, precipitation, water flows, and water quality, and assesses their implication on peoples and livelihoods. After this introduction, the paper comprises materials and methods (with site characterization and approach used), results (with trends of biophysical climate and hydrologic parameters, followed by the impact of their variation on livelihoods), discussion (linking this paper to previous research in the region), and conclusions.
2. Methods and Materials
The study was carried out in three countries of the Congo Basin (Cameroon, the CAR, and the DRC). The studied watersheds were the Mpoko in CAR, the So’o in Cameroon, and the community of Masako on the outskirts of the town of Kisangani in the DRC. The rural population of these sites live on resources that depend highly on rainfall.
Several methodologies have been developed worldwide to analyze hydrological disturbances [34]. They generally concern hydrological, hydraulic rating, habitat simulation, and holistic approaches. This study focuses on the rainfall water flow nexus variation and its impact on rural livelihoods. We will thus use climatic and hydrological approaches, as well as a survey on water-related livelihood activities, to complement primary data.
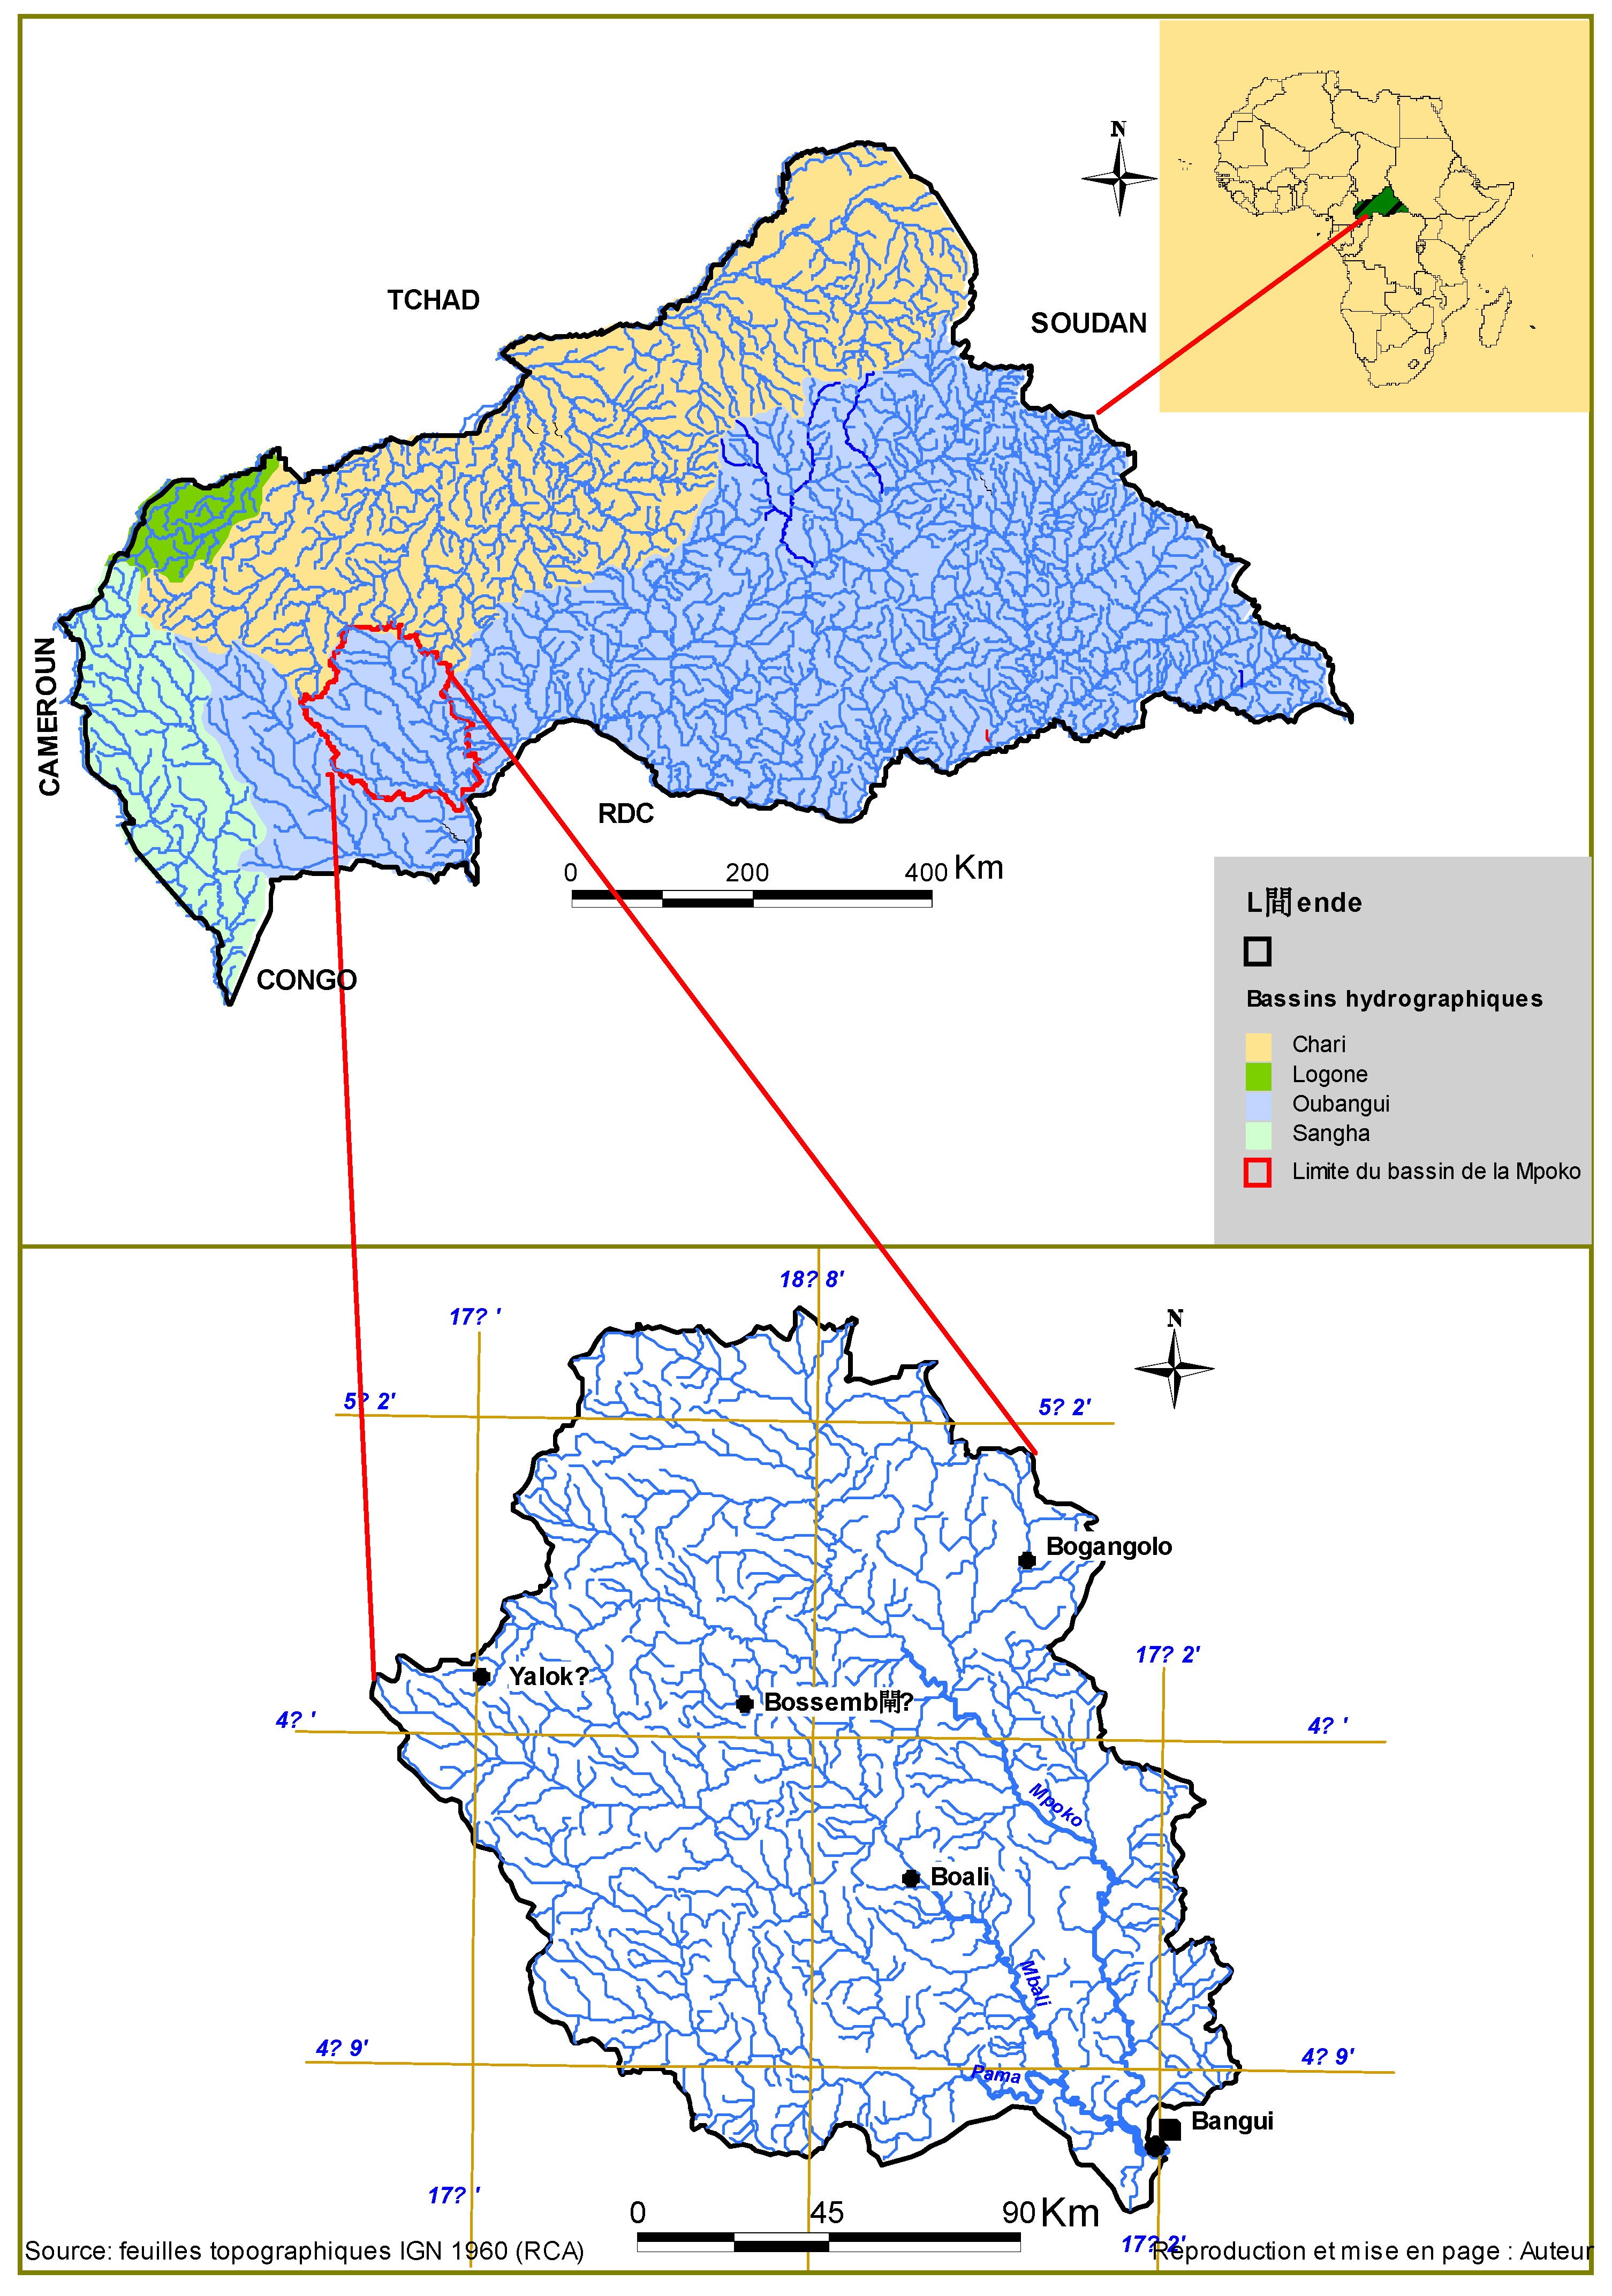
2.1. The Mpoko Watershed (Central African Republic)
In the Mpoko watershed (Figure 1), we analyzed daily, monthly, and annual rainfall variability. The Nicholson Rainfall Index was used to show variability in annual precipitation. The Hanning Pass-low filer of the second order was used to detect the different climatic phases (in deficit and in surplus) during the period of the studies. The daily data were cut in wet and dry pentads, which allowed us to determine the false start of the rainy season in the watershed. The Reduced Centred Index (Rainfall Index) is the ratio of the deviation from the interannual means to the standard deviation of annual rainfall [35]. It helps observe interannual variability and periods of deficits and excess in rainfall series [35]. Yearly, monthly, and daily rainfall behavior was evaluated. The database of the Agency for the Security of Air Navigation and the National Directorate of Central African Meteorology was used. Rainfall data were obtained from the synoptic stations of Bangui Mpoko (1931–2008), Bossembélé (1951–2007), and Bossangoa (1926–2007).
For the flow of the Mpoko River, we obtained data of the hydrometric station of Bossélé Mbali from the National Directorate of Central African Hydrology for 1955–1975—the only period during which the station was functioning.
Surveys and group discussions collected farmers’ views on climate change and its impacts. Around 309 people from 15 villages were interviewed through questionnaires. A focus group organized according to different social categories helped identify the impact of climate change on the watershed. Data were analyzed using descriptive statistics, statistical inference, and logic regression through SPSS software.
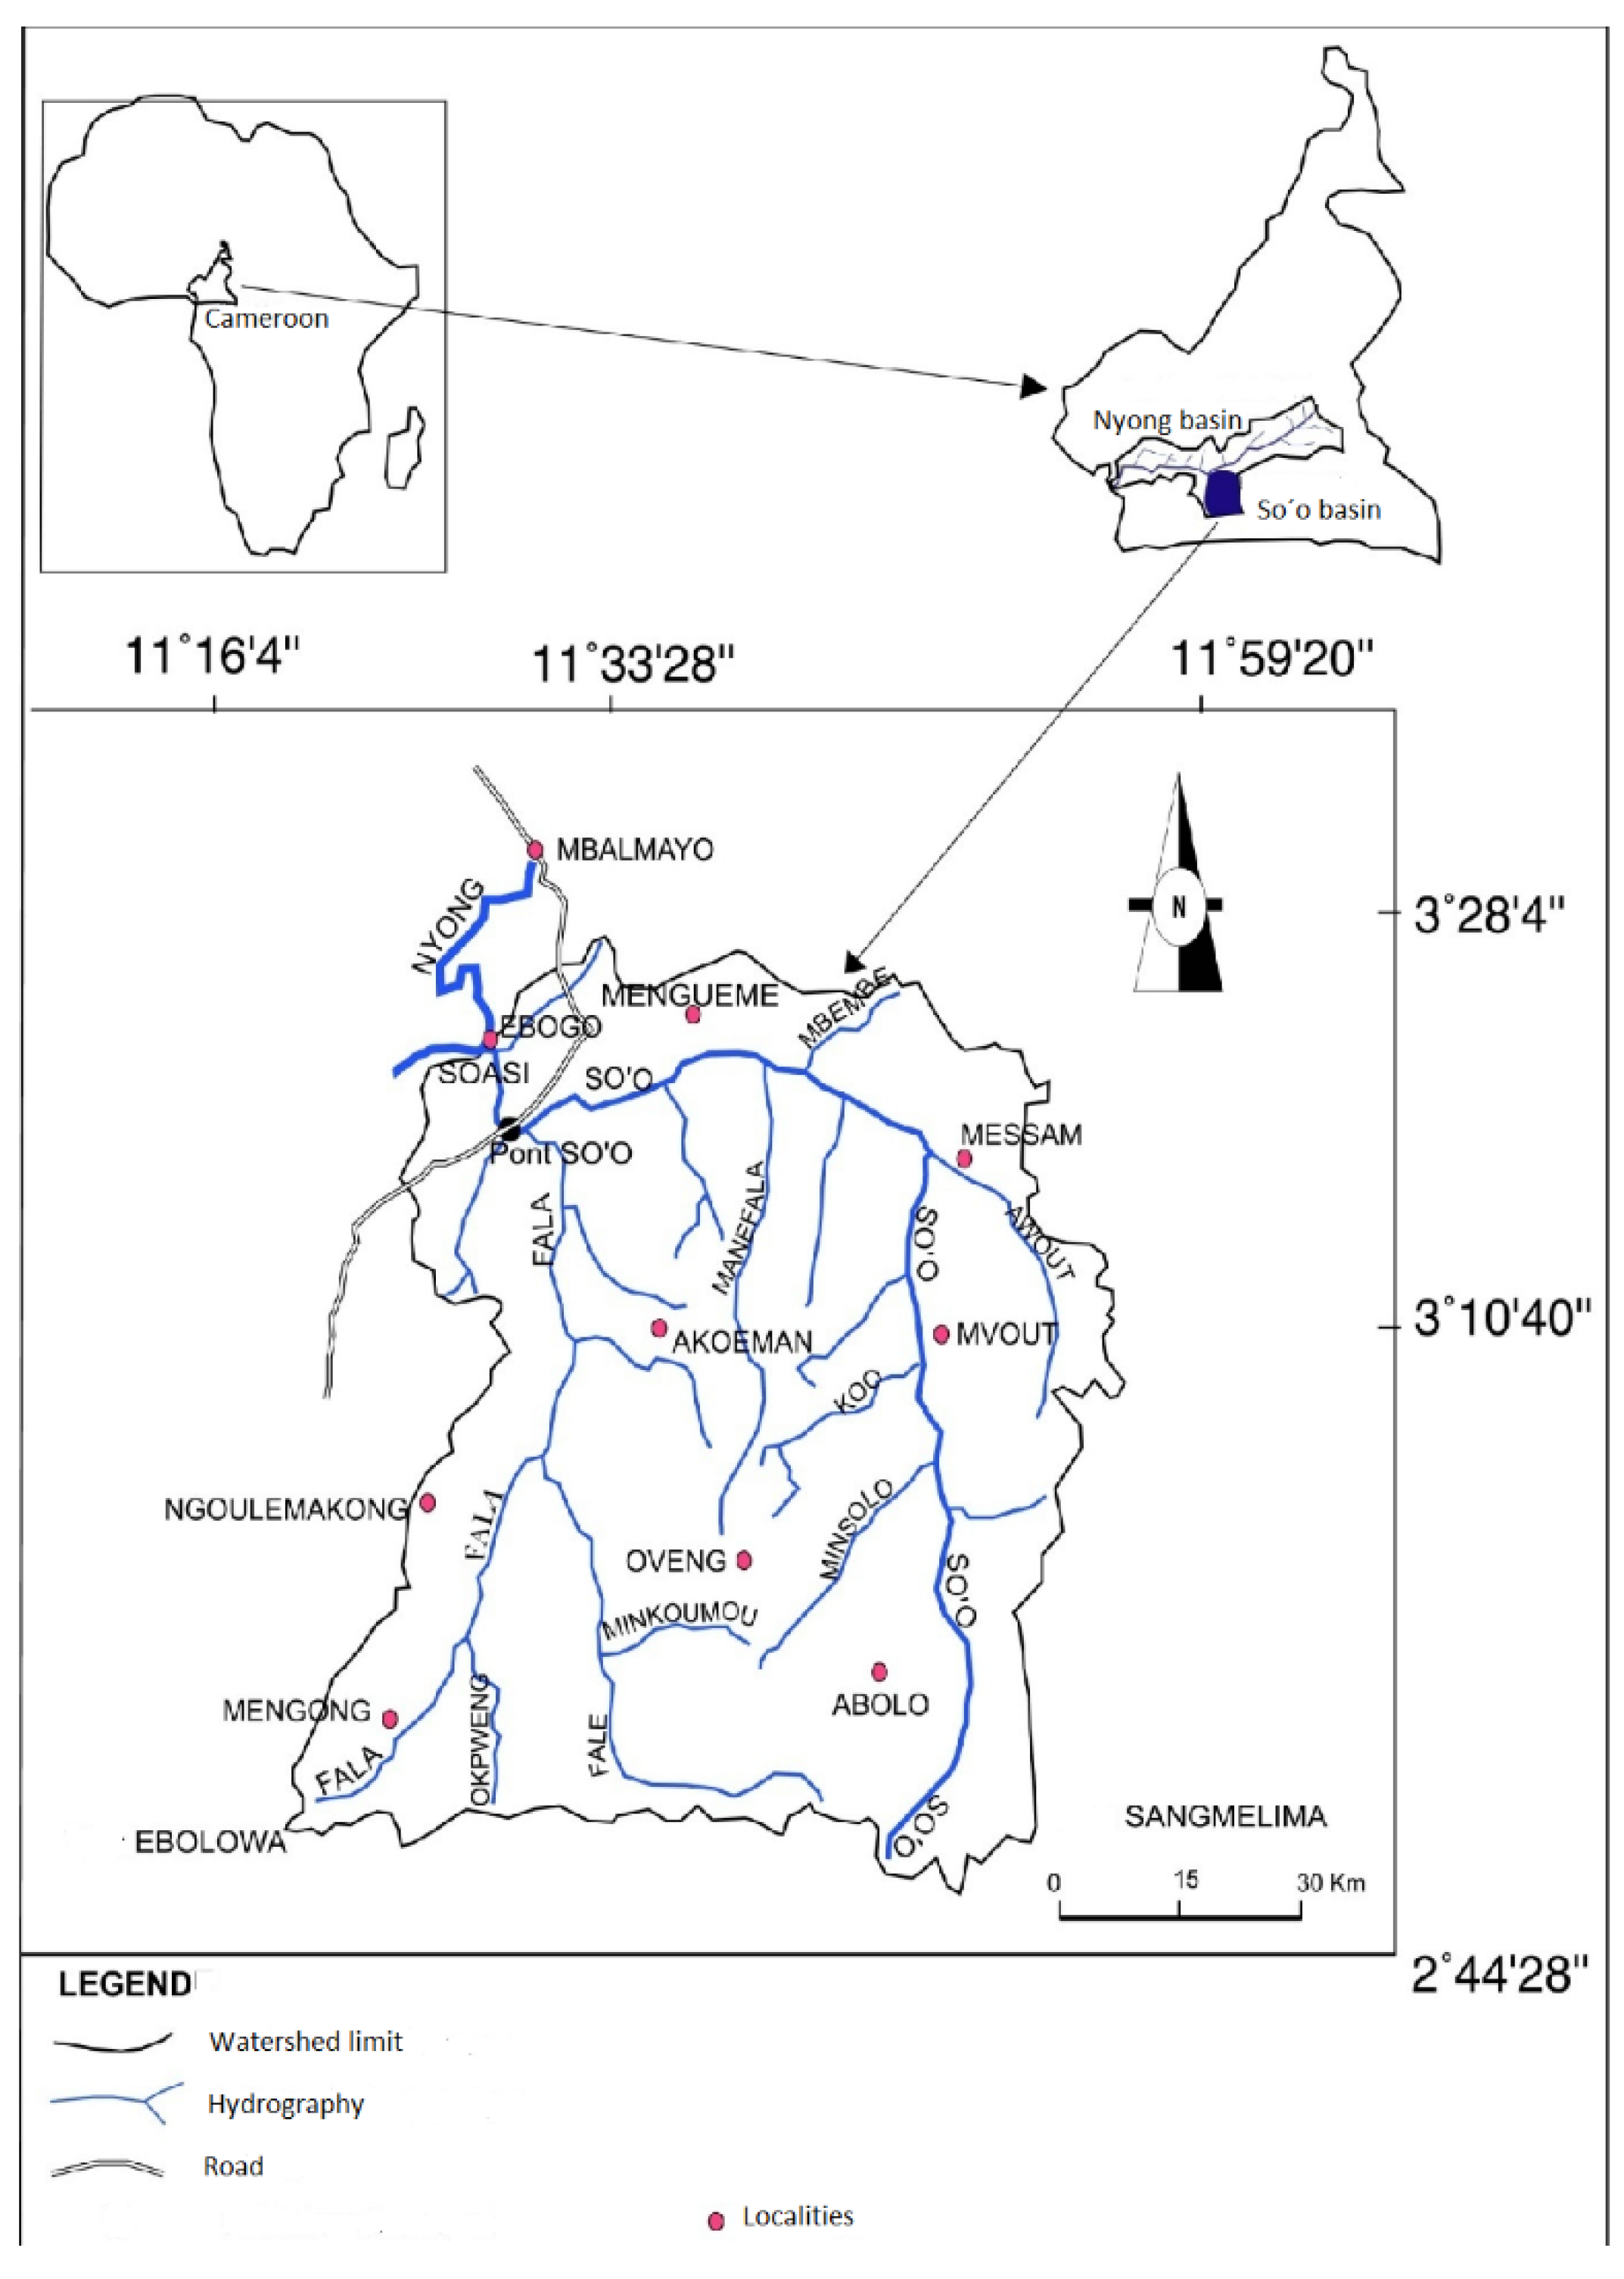
2.2. The So’o Watershed (Cameroon)
Data on precipitation (seasonal and annual) in the So’o watershed in Cameroon (Figure 2) were obtained from meteorological stations. It was complemented by data [36] for the stations of Ebolowa (1931–2010) and Sangmelima (1934–2010). The data on temperature came from the same meteorological stations and also covered the period from 1980 to 2010. Data were treated by statistical methods [37,38] using a Khronostat program to characterize fluctuations in the chronological series [39]. Because the So’o River lacked a meteorological station, we used Thiessen polygons to estimate rainfall and temperature values in the data collected from the surrounding rainfall stations. This helped generate a series of rainfall values (1934 to 2010) and temperatures (1980 to 2010) for location of the bridge.
Through questionnaires, we obtained socioeconomic data to help understand livelihood implications of hydrological modification. These data were recorded and analyzed using descriptive statistical analytical and a statistical inference program such as SPSS. The analysis allowed us to present information on livelihoods, including how they had been influenced by hydrological changes.
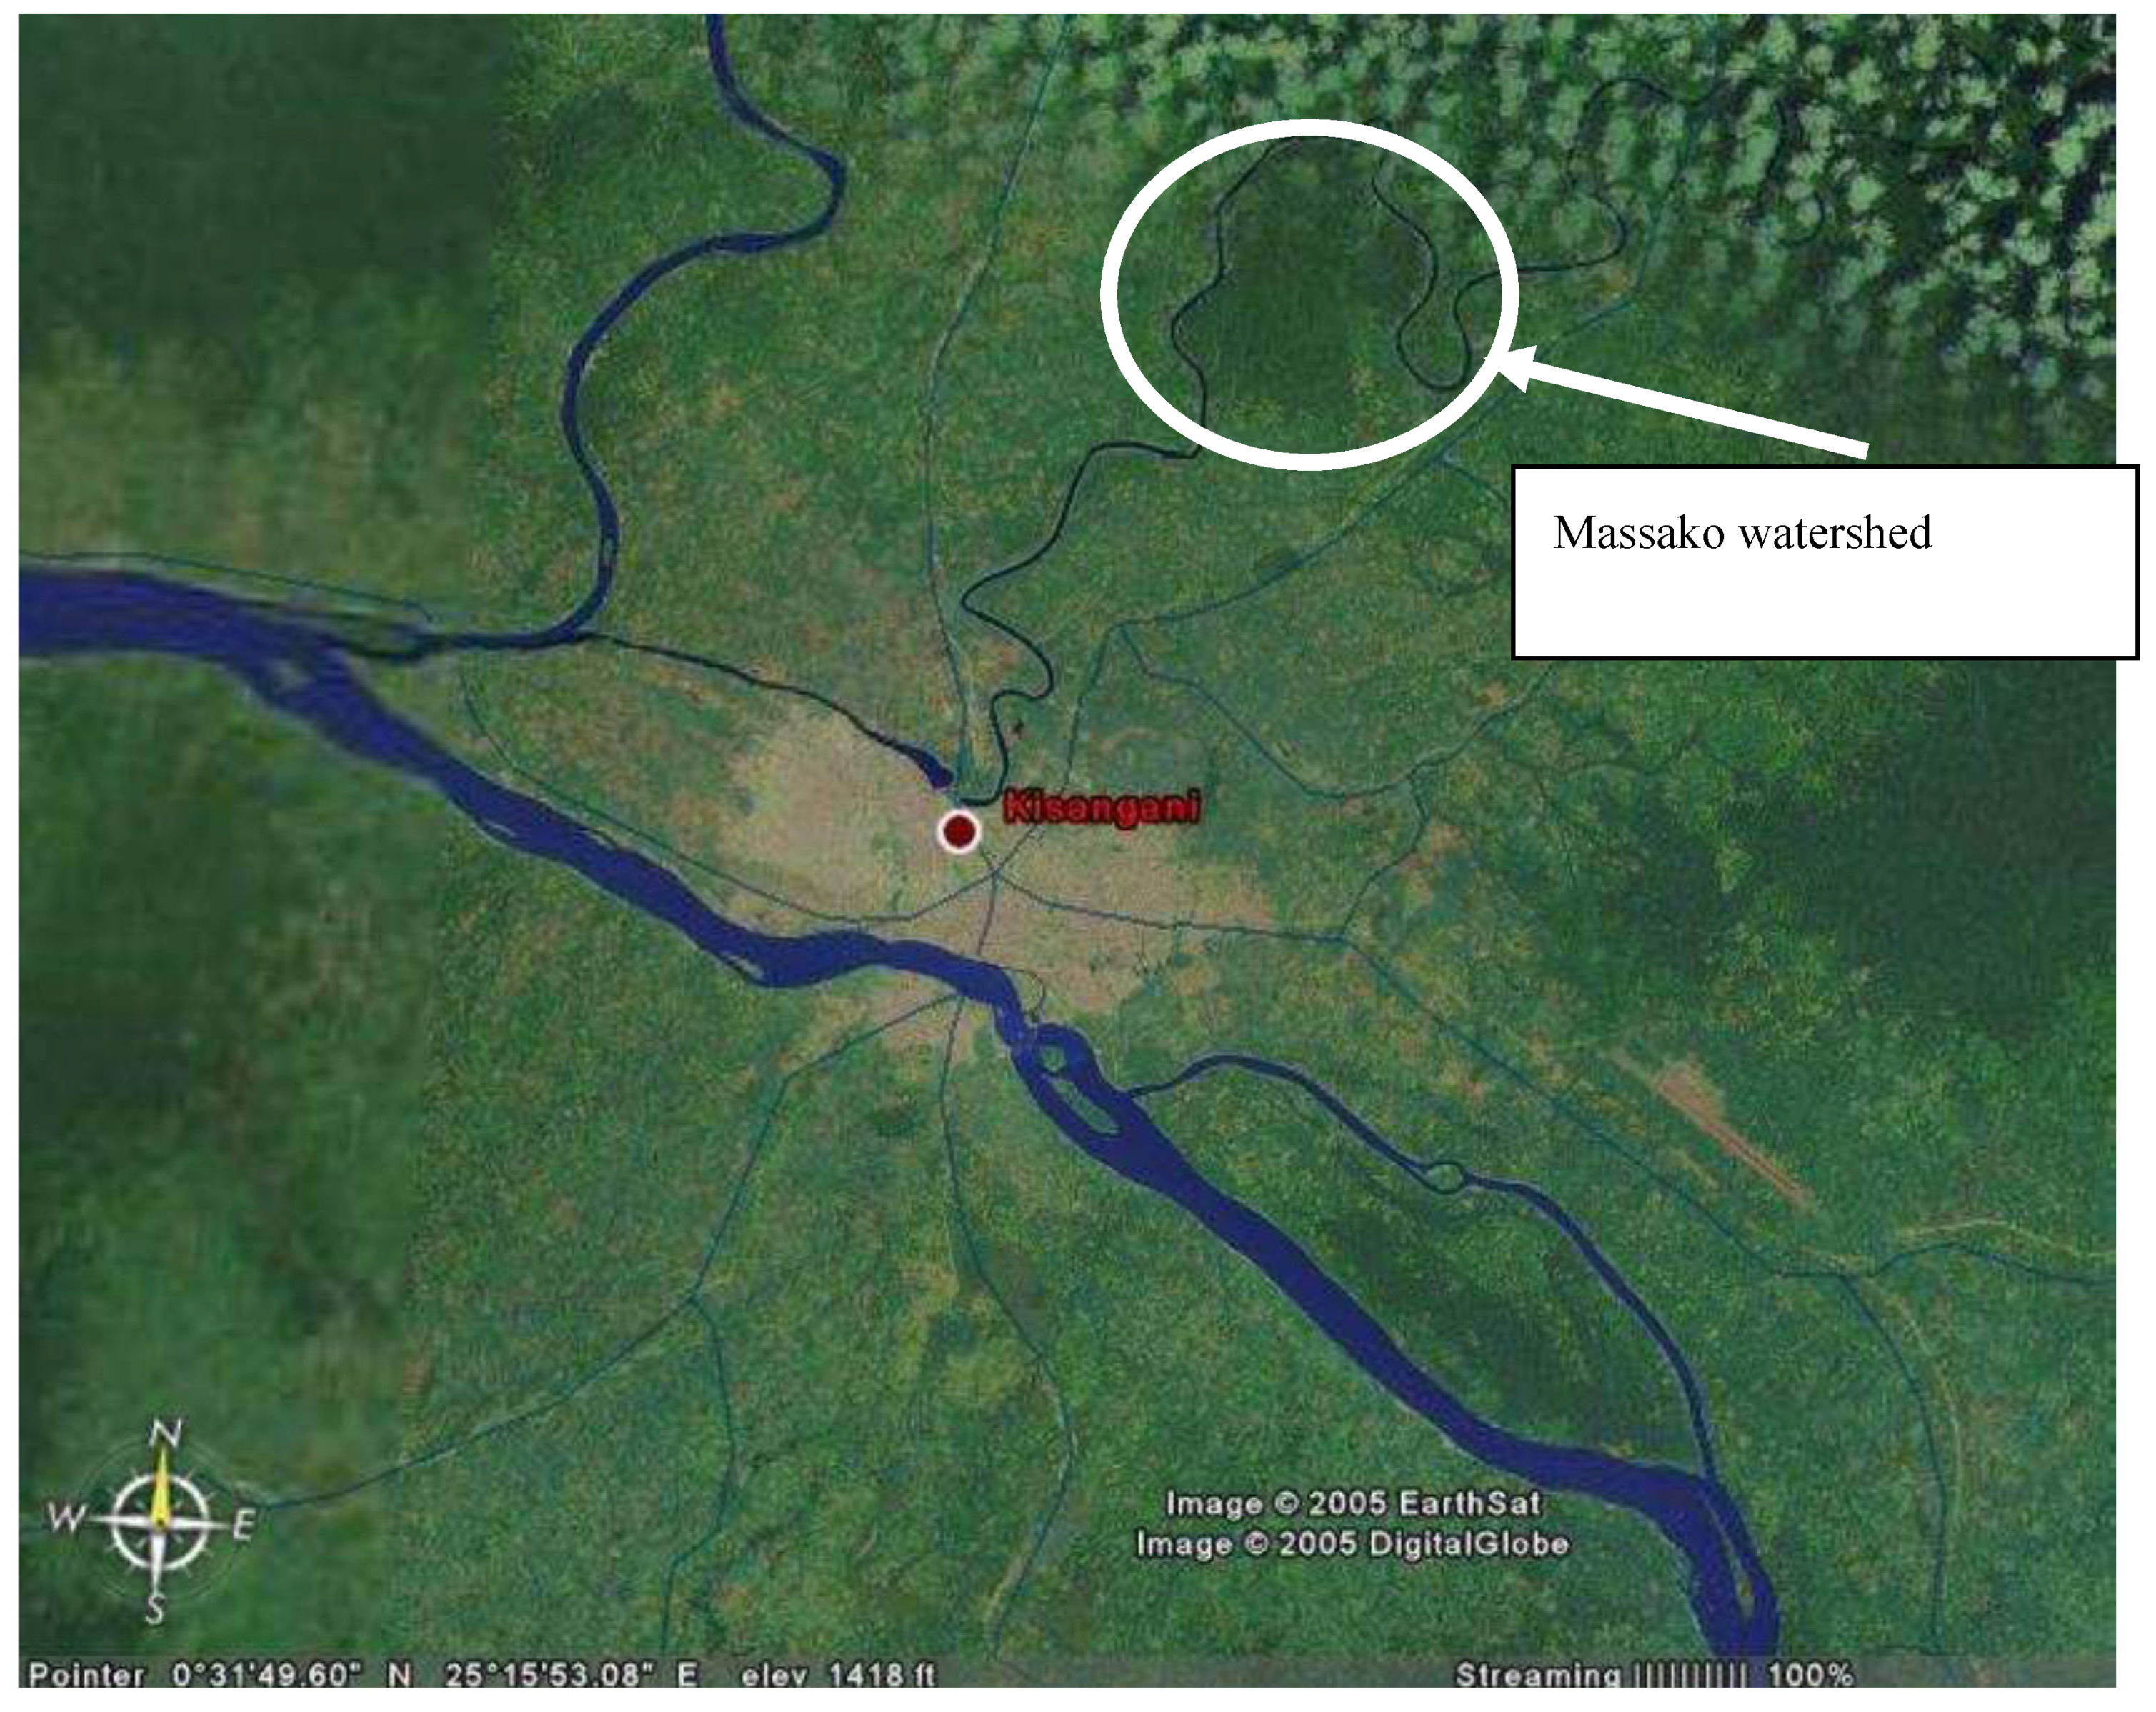
2.3. The Masako Watershed (Democratic Republic of Congo)
In the DRC, in addition to reviewing studies on rainfall, thermal variability, and socioeconomic investigations, we studied the quality of drinking water from springs in the community of Masako on the outskirts of the town of Kisangani (Figure 3). In all, 23 springs—including 14 in protected dense forest zones and 9 in degraded forest zones—were retained for analysis of bacteriological parameters.
We determined water temperature using a red-mercury thermometer graduated from −10 °C to 100 °C. It was coated with a metal dipped in water for 3–4 min and then removed for reading [40]. We obtained samples from six springs (split evenly between protected and unprotected forest) over six weeks. Sampling was done between 9:00 a.m. and 11:00 a.m.
Water samples were aseptically obtained in Erlen Meyer steriles, put in a container, and immediately taken to the laboratory in the Faculty of Science of the University of Kisangani for analysis. These samples were collected from six springs (split evenly between protected and unprotected forest) over six weeks. Sampling was carried out between 7:00 a.m. and 2:00 p.m.
Fecal coliforms were counted after dilution in boiled lactose according to the fermentation method of multiple tubes as follows: three series of test tubes each containing 10 mL medium; 10 mL of water is put in the first three tubes with a double concentration. In the other two (second and third series), with a simple concentration, 1 mL and 0.1 mL of samples, respectively, are used and analyzed. After 24 h of incubation at 44 °C, the test tubes in which there are acid and production of gas, and colour shift are considered positive. The most probable number of presumed fecal coliforms present in 100 mL of analyzed sample is obtained by referring to the tables of MacCrady [41].
Fecal streptococci were counted after dilution in Sherman milk according to the fermentation in multiple tubes as follows: three series of test tubes each containing 10 mL of milieu; 10 mL of water is put in the first three tubes with double concentration. In the other two (second and third series) with a simple concentration, 1 mL and 0.1 mL of sample, respectively, are used and analyzed. After 24 h of incubation at 37 °C, the tubes have a blue decolorization from methylene and milk coagulation.
The most probable number (“Le Nombre le plus Probable: NPP” in French) of presumed fecal streptococci present in 100 mL of the analyzed sample is obtained by referring to the tables of MacCrady [41]. Coliforms and fecal streptococci constitute pollution indicators of fecal origin. Their presence can indicate the eliminations (waste) of untreated wastewater. Coliforms and fecal streptococci are used to define the criteria for sanitary conditions or quality. The standard is 200/100 mL for a bath, and 1000/100 mL for recreational activities such as fishing and nautical, which create a secondary contact with water [42].
3. Results
3.1. Climatic and Rainfall Variability in the Congo Basin
3.1.1. Evolution of Thermal Extremes in the Congo Basin
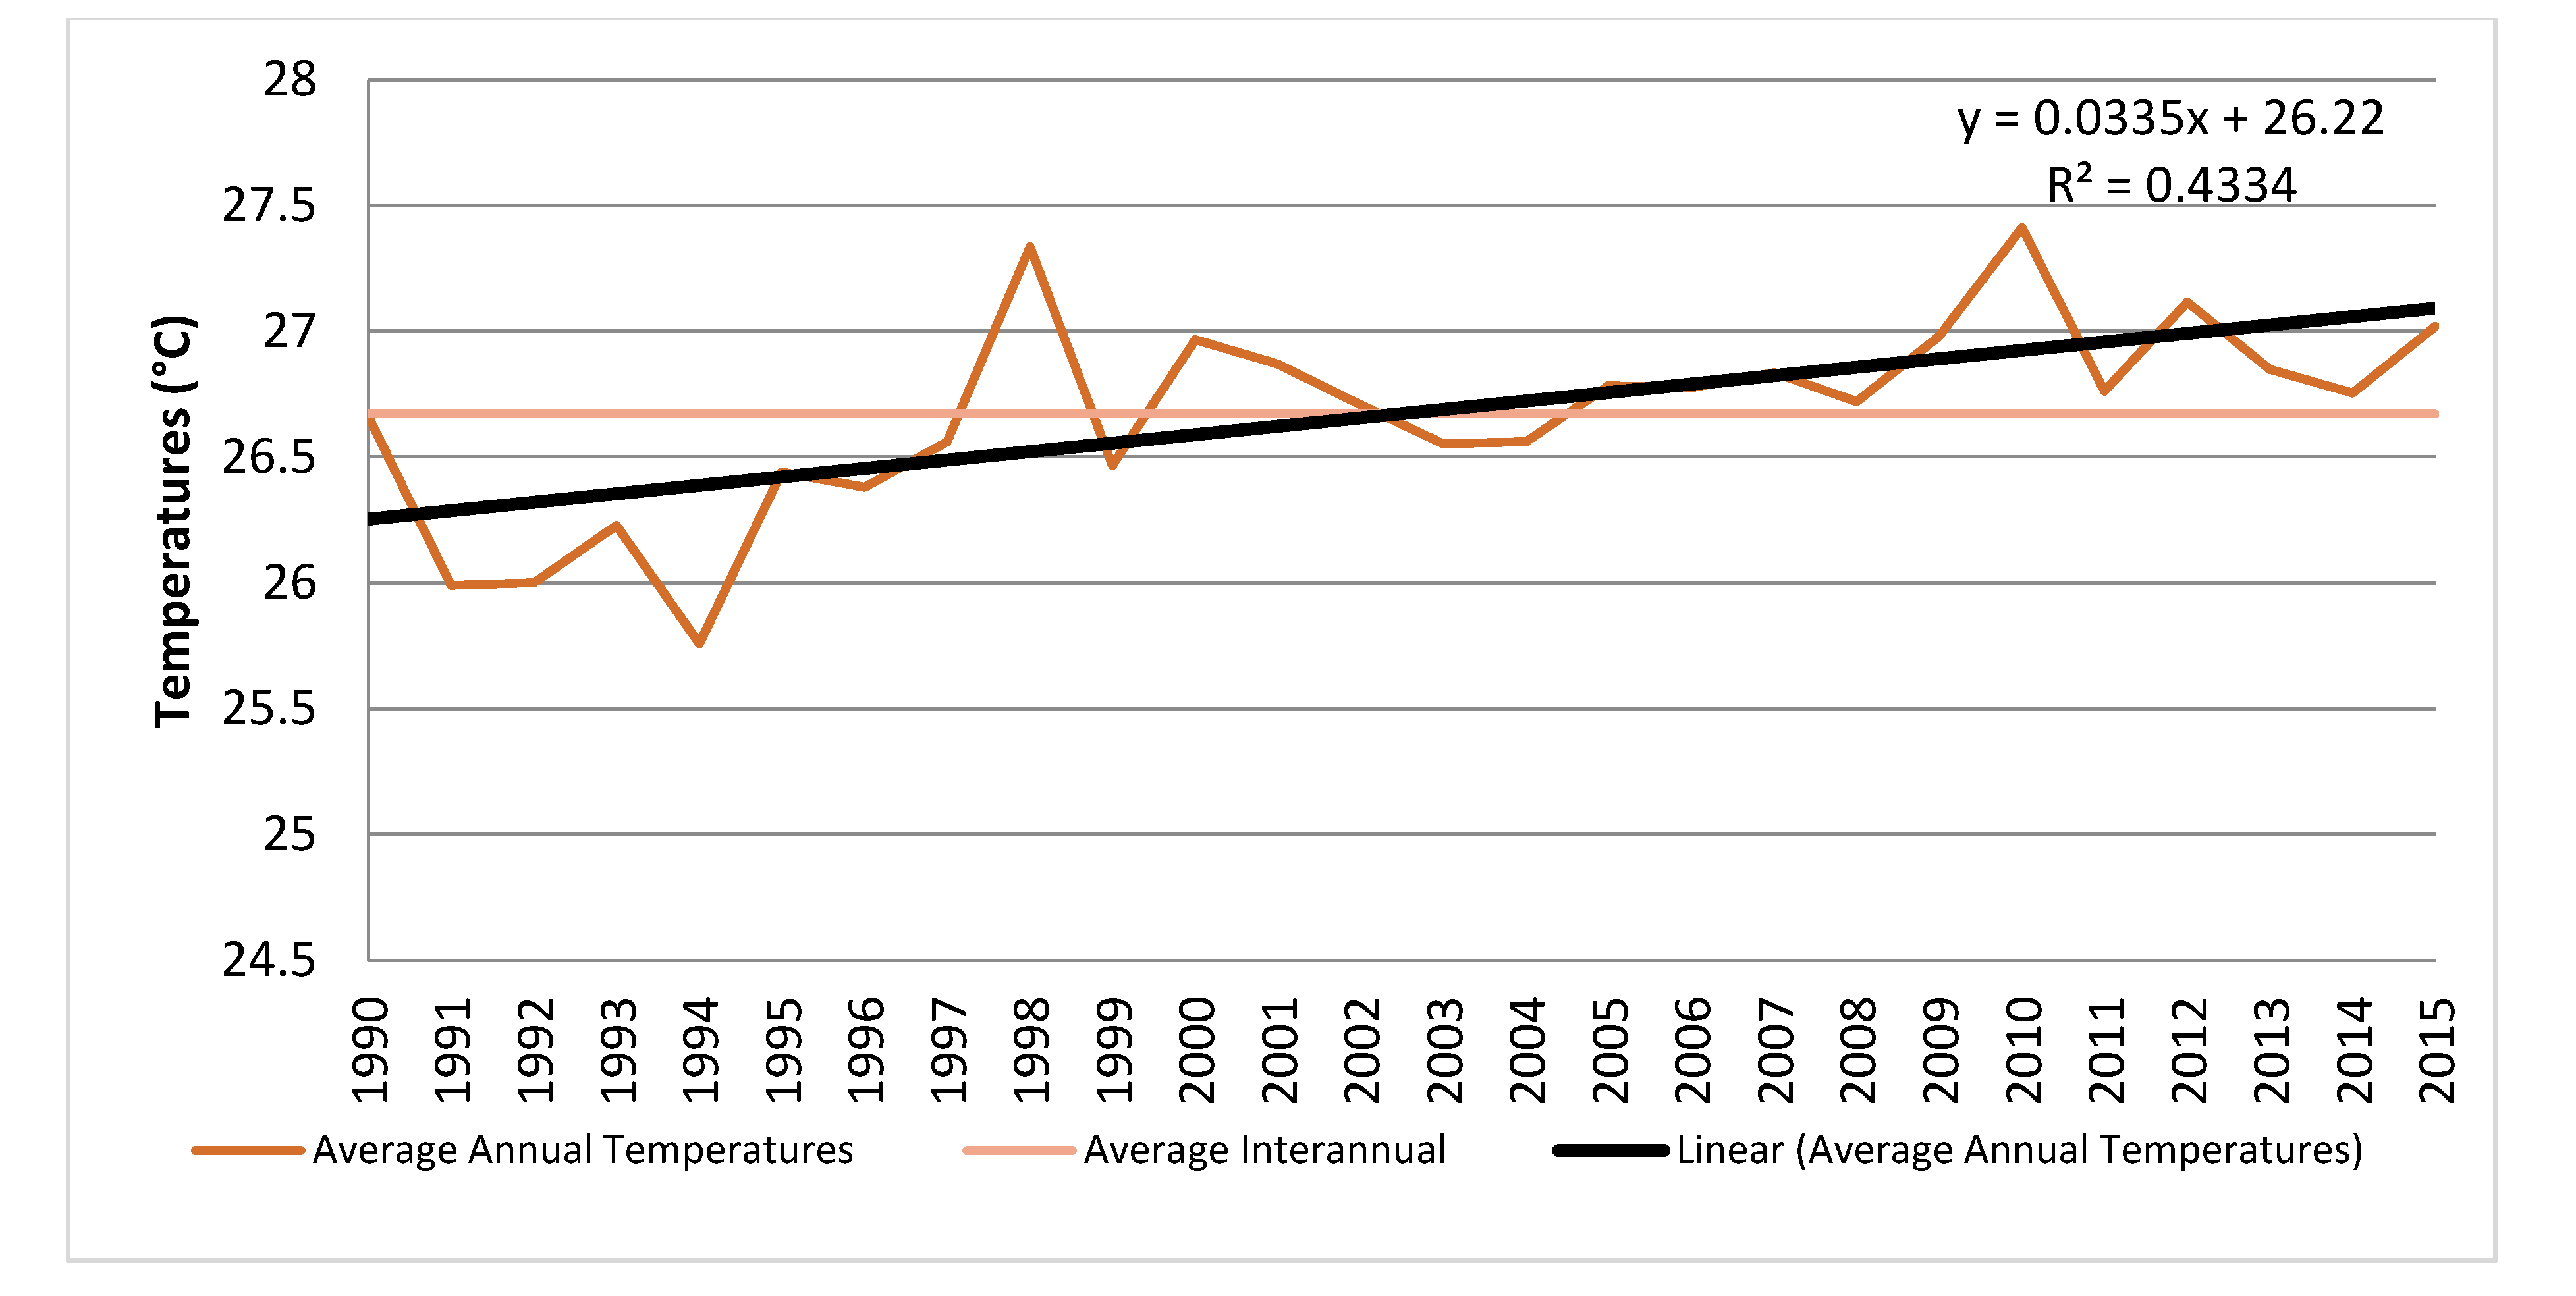
The interannual average temperature is 26.1 °C in the Bangui-Mpoko station with 0.48 standard deviation. The average interannual change shows low temperature variability from one year to another (Figure 4). In this station, only one warm period is observed from February to April. This monomodal regime is explained by the abundant rains in Bangui from August to October. The rains lower the temperature, although the global solar radiation increases from 1600 J.cm−2 in August to 1800 J.cm−2 in October [43]. The temperature remains relatively constant during the rainy season and even during the autumn equinox.
The maximum daily average temperature varies between 37 °C and 39 °C at Bangui Mpoko in the middle of the day (1:00 p.m. to 2:00 p.m.) and may reach 40 °C (as it did in April 1967). Average monthly maximum values can reach 36–37 °C but are often around 33 °C. The warm season (February, March, and April) is characterized by a single maximum. The maximum interannual mean temperature was probably 31.9 °C. An absolute minimum was recorded around Christmas 1971 [44], with 9.9 °C on 20 December and 9.2 °C on 24 December in Bangui-Mpoko. Since 1931, the absolute minimum in Bangui has been 11.4 °C. For 1980–1999, extreme temperatures were 11.7 °C in January 1989 and 37.4 °C in March 1990. Average monthly temperatures vary little from one month to the next: 0.4 °C during the rainy season to 1 °C in the dry season; annual amplitude was only 3 °C. As for the maximum and minimum averages, differences in seasonal scale decreased from 15 °C in January and February to 9 °C in June and July. The average increase in temperature is about 0.3 °C per decade.
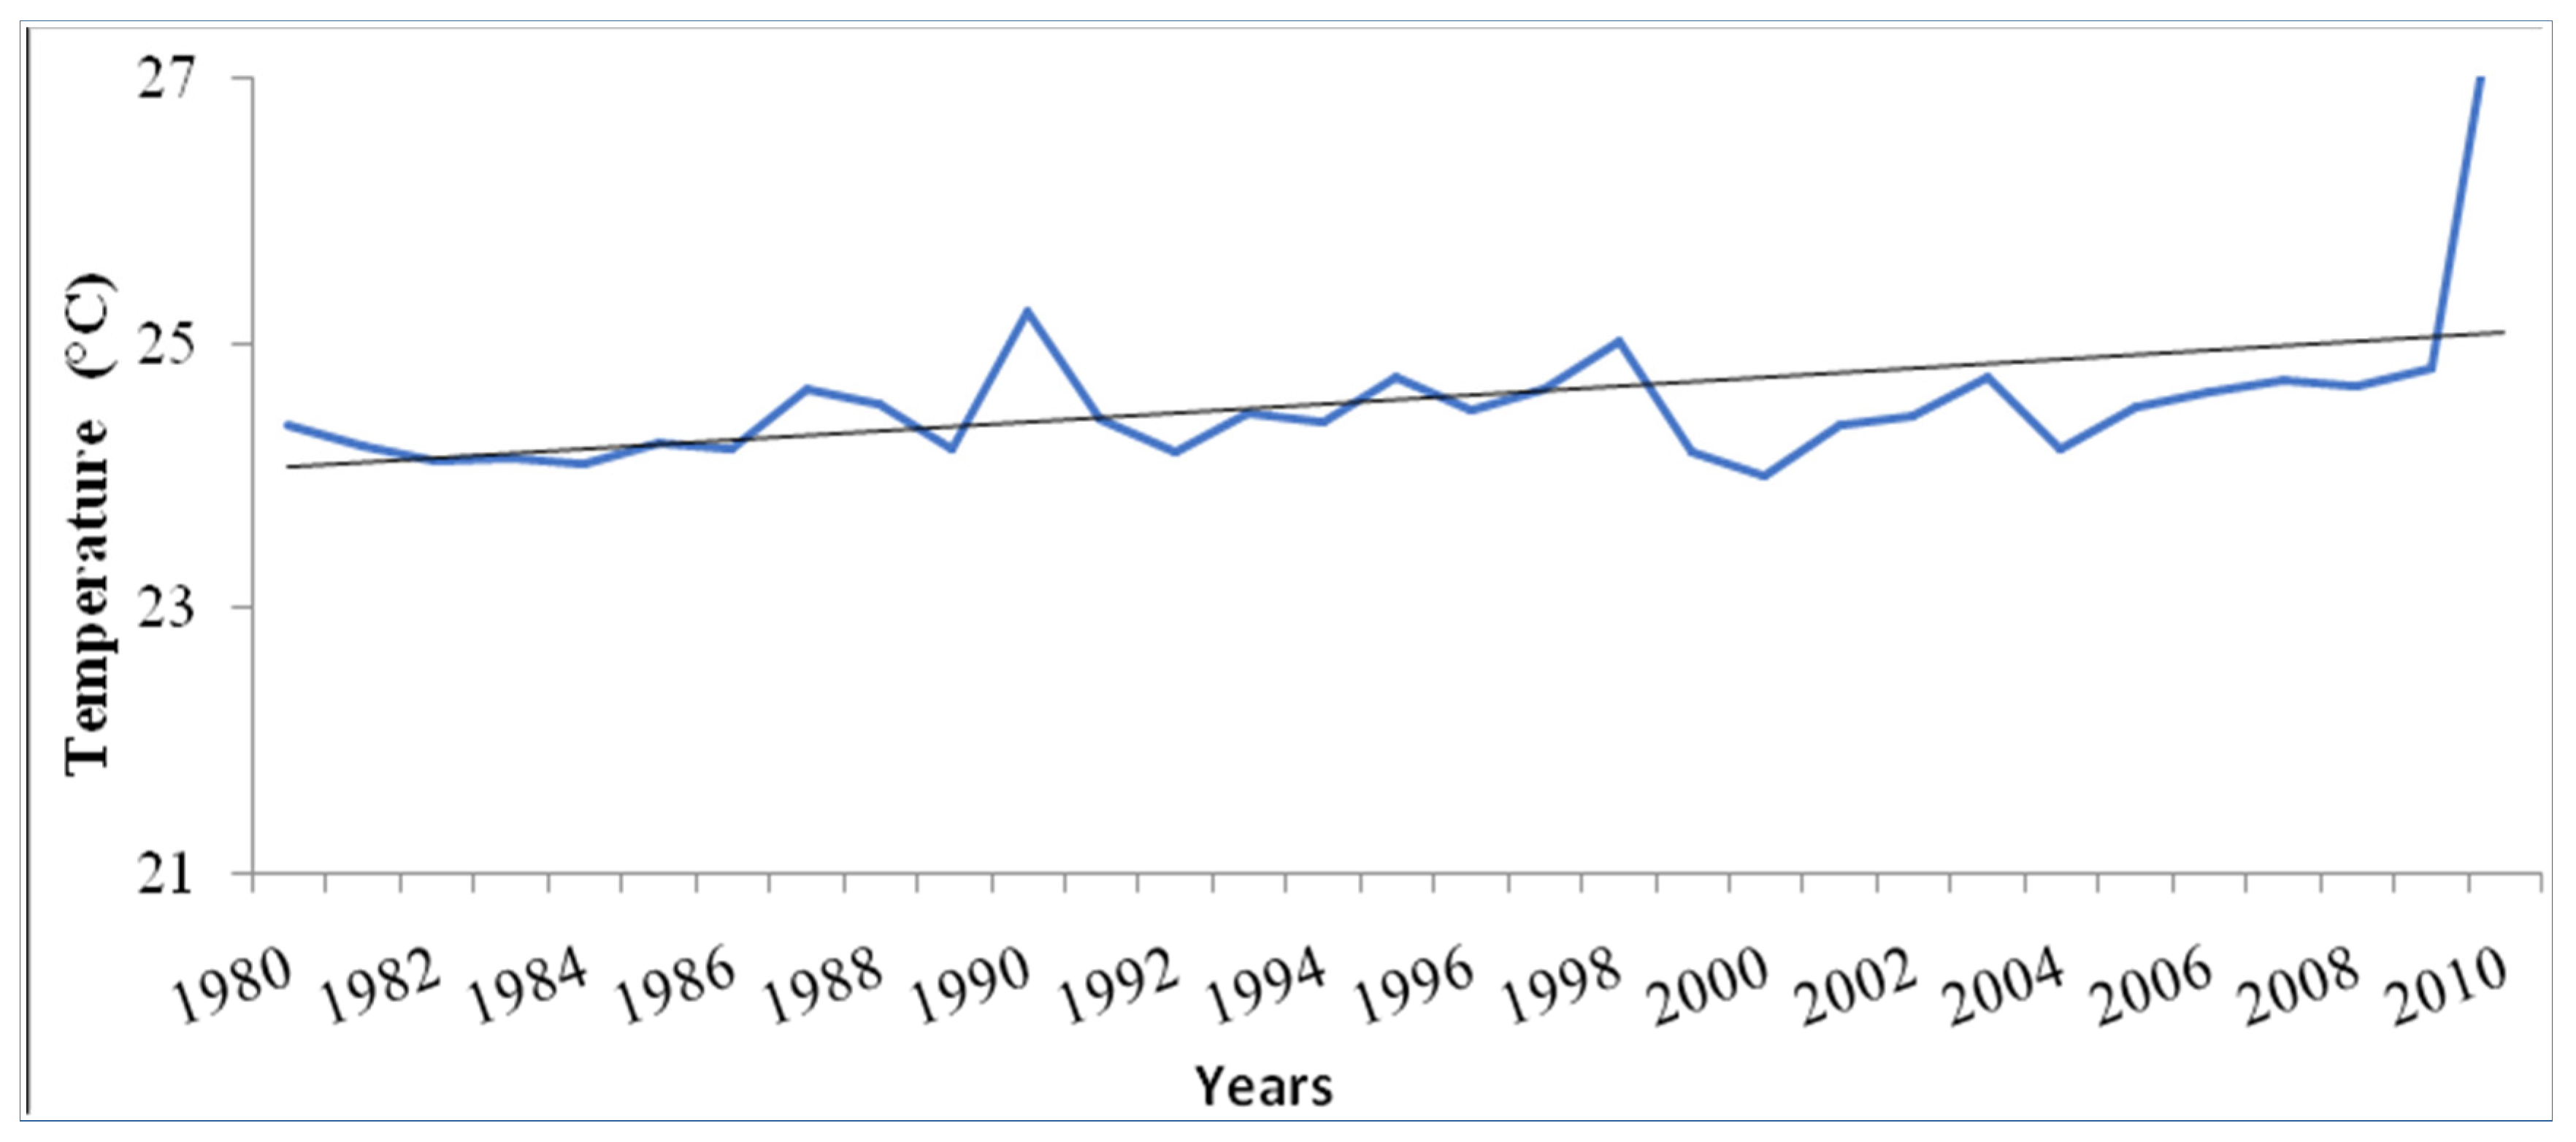
In the So’o watershed (Cameroon), the annual temperature values from 1980 to 2010 obtained are around 24 °C, with an increasing trend of about 1.7% (Figure 5). The typical year-to-year variation is about 0.62 °C in the whole watershed. The average minimum temperature recorded in July is 23 °C, and the maximum temperature recorded in February is 27 °C. The annual variable temperature does not show any significant difference from Petit’s test for all the studied stations.
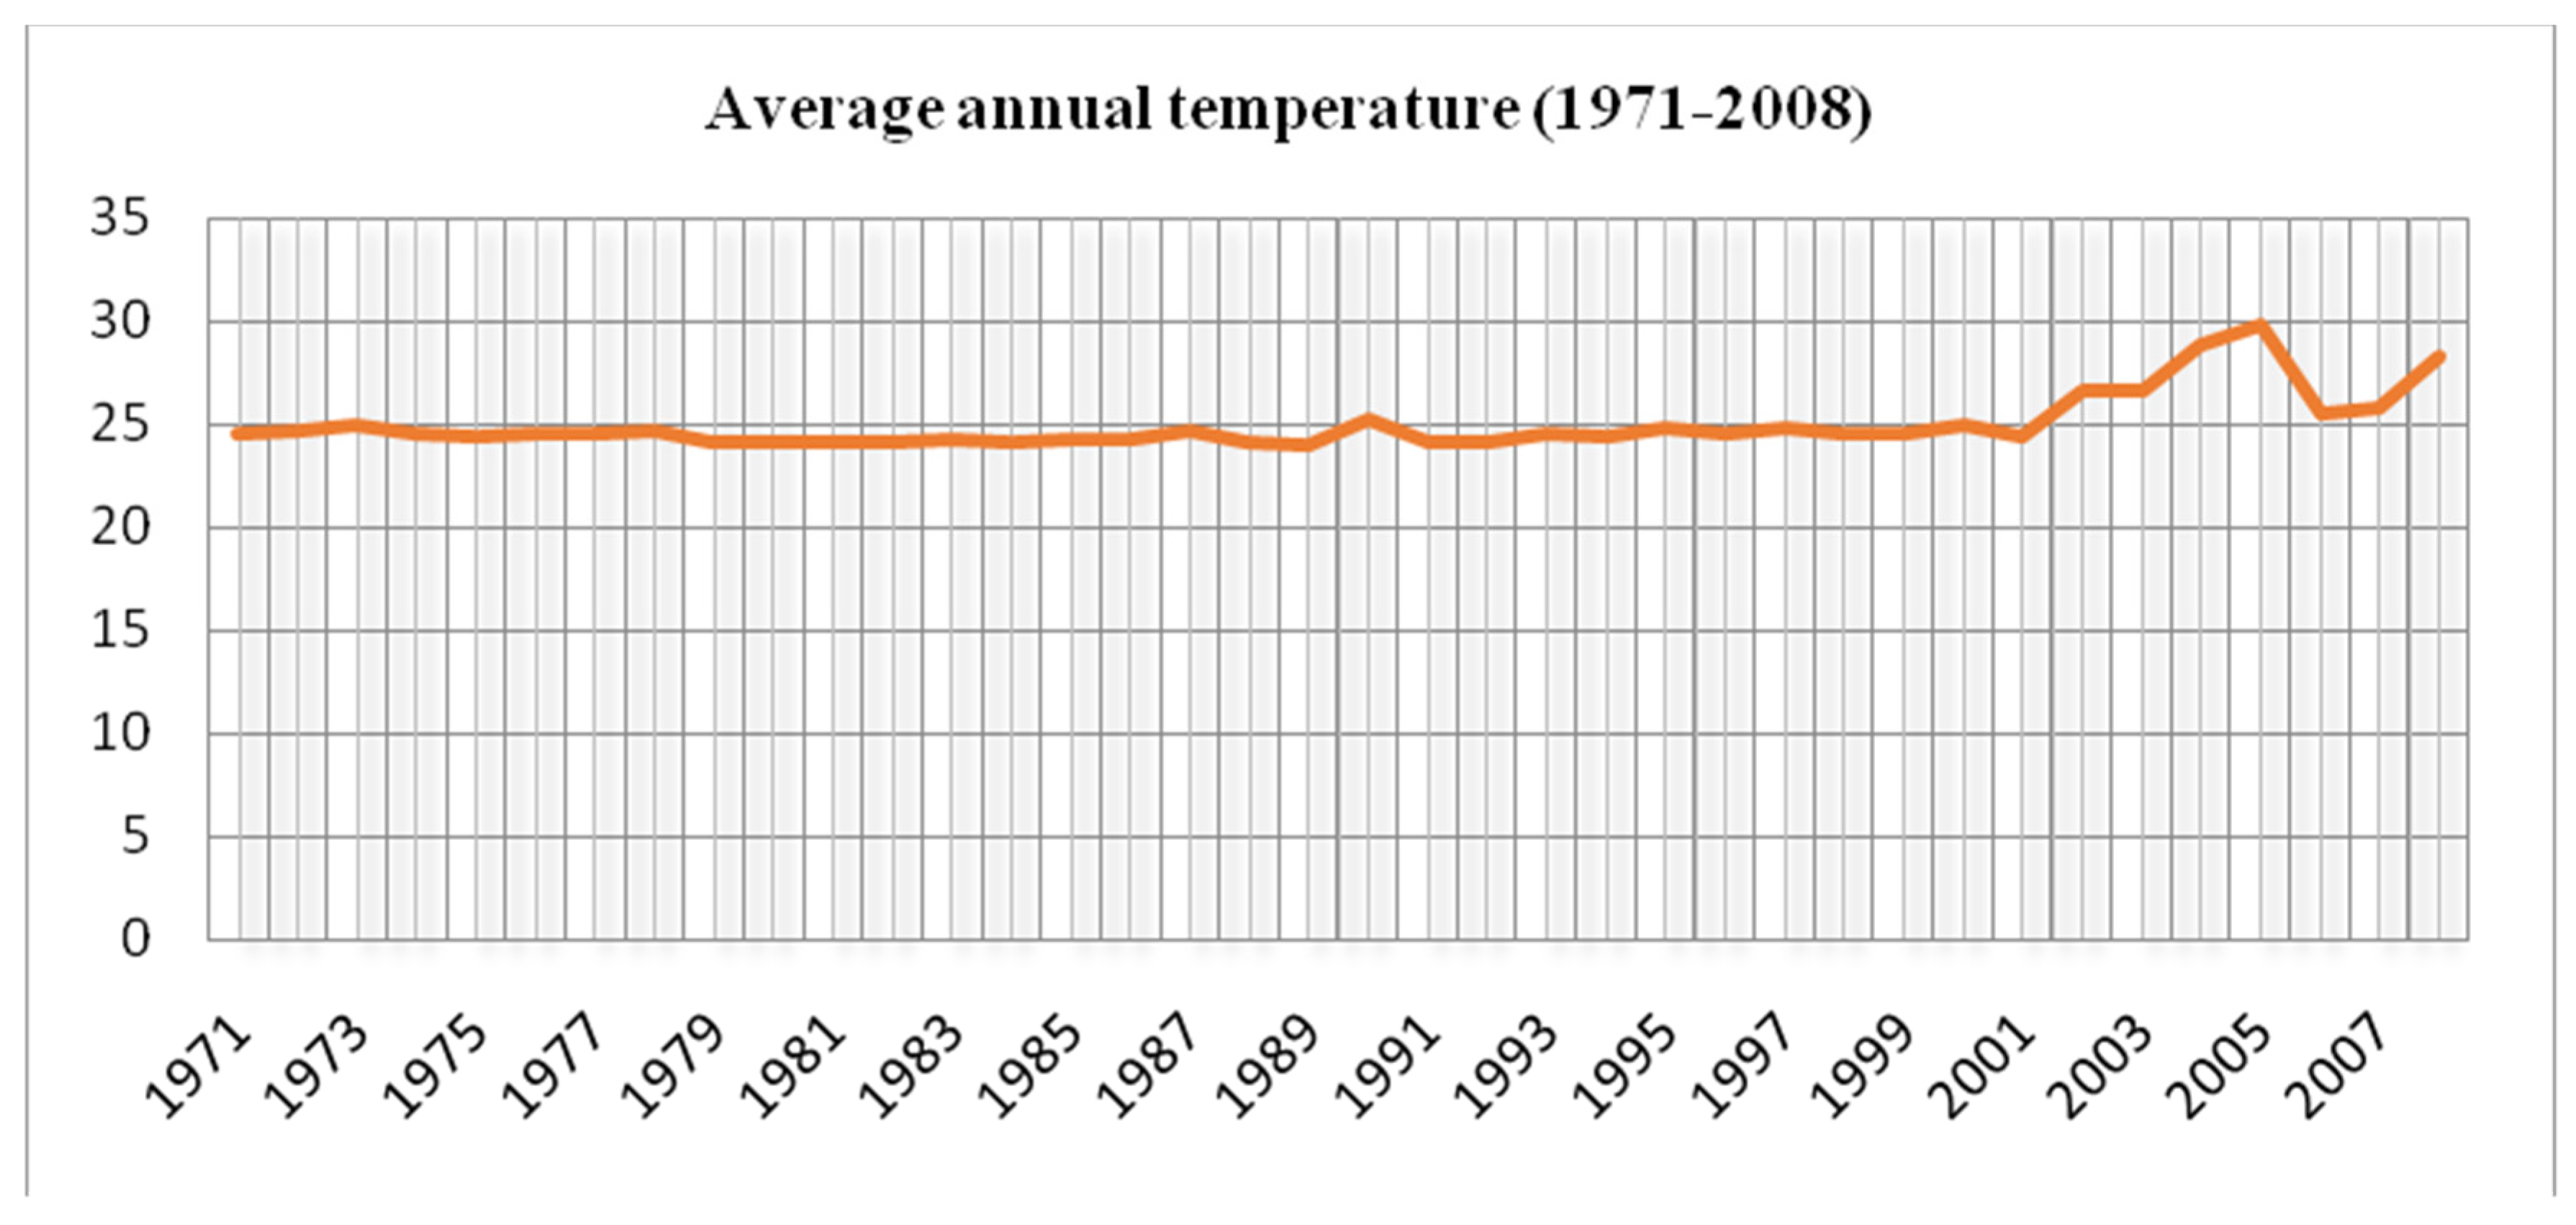
In the Masako watershed (DRC), the average annual temperature was 24.5 °C before 2001 and rose to 27.3 °C after 2001 (Figure 6). Thermal extremes are increasing in the community.
3.1.2. Rainfall Variation
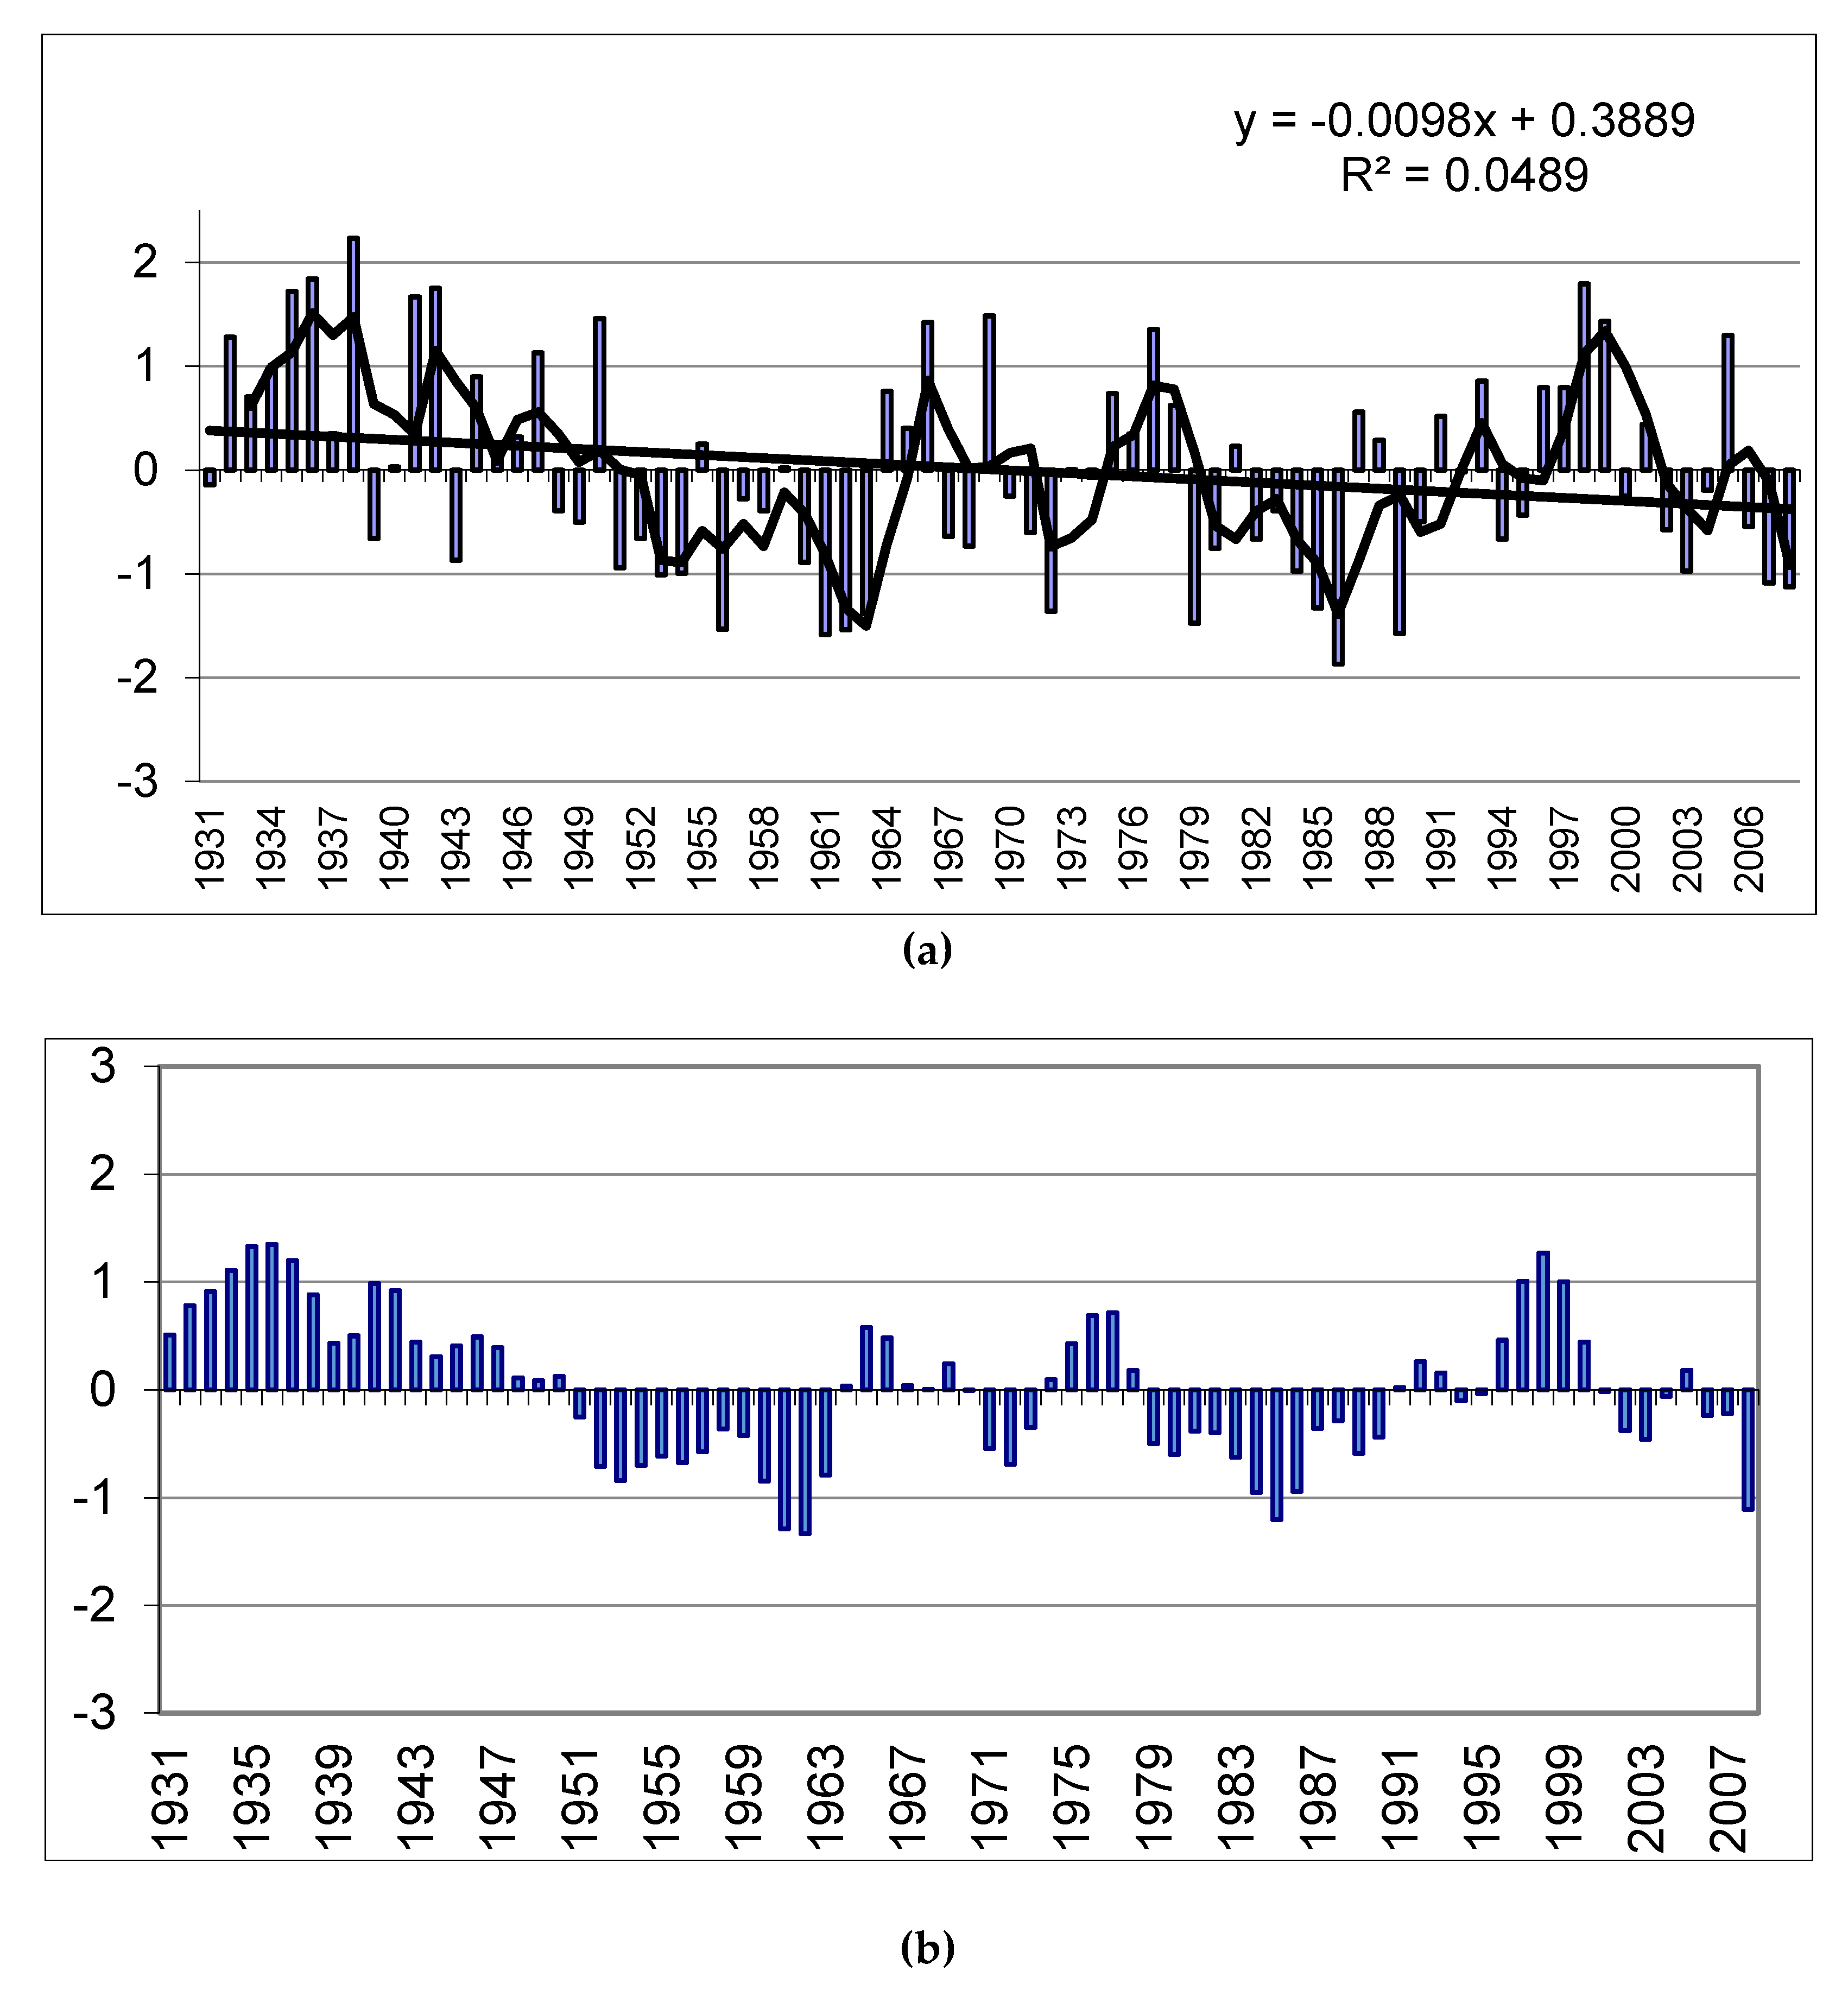
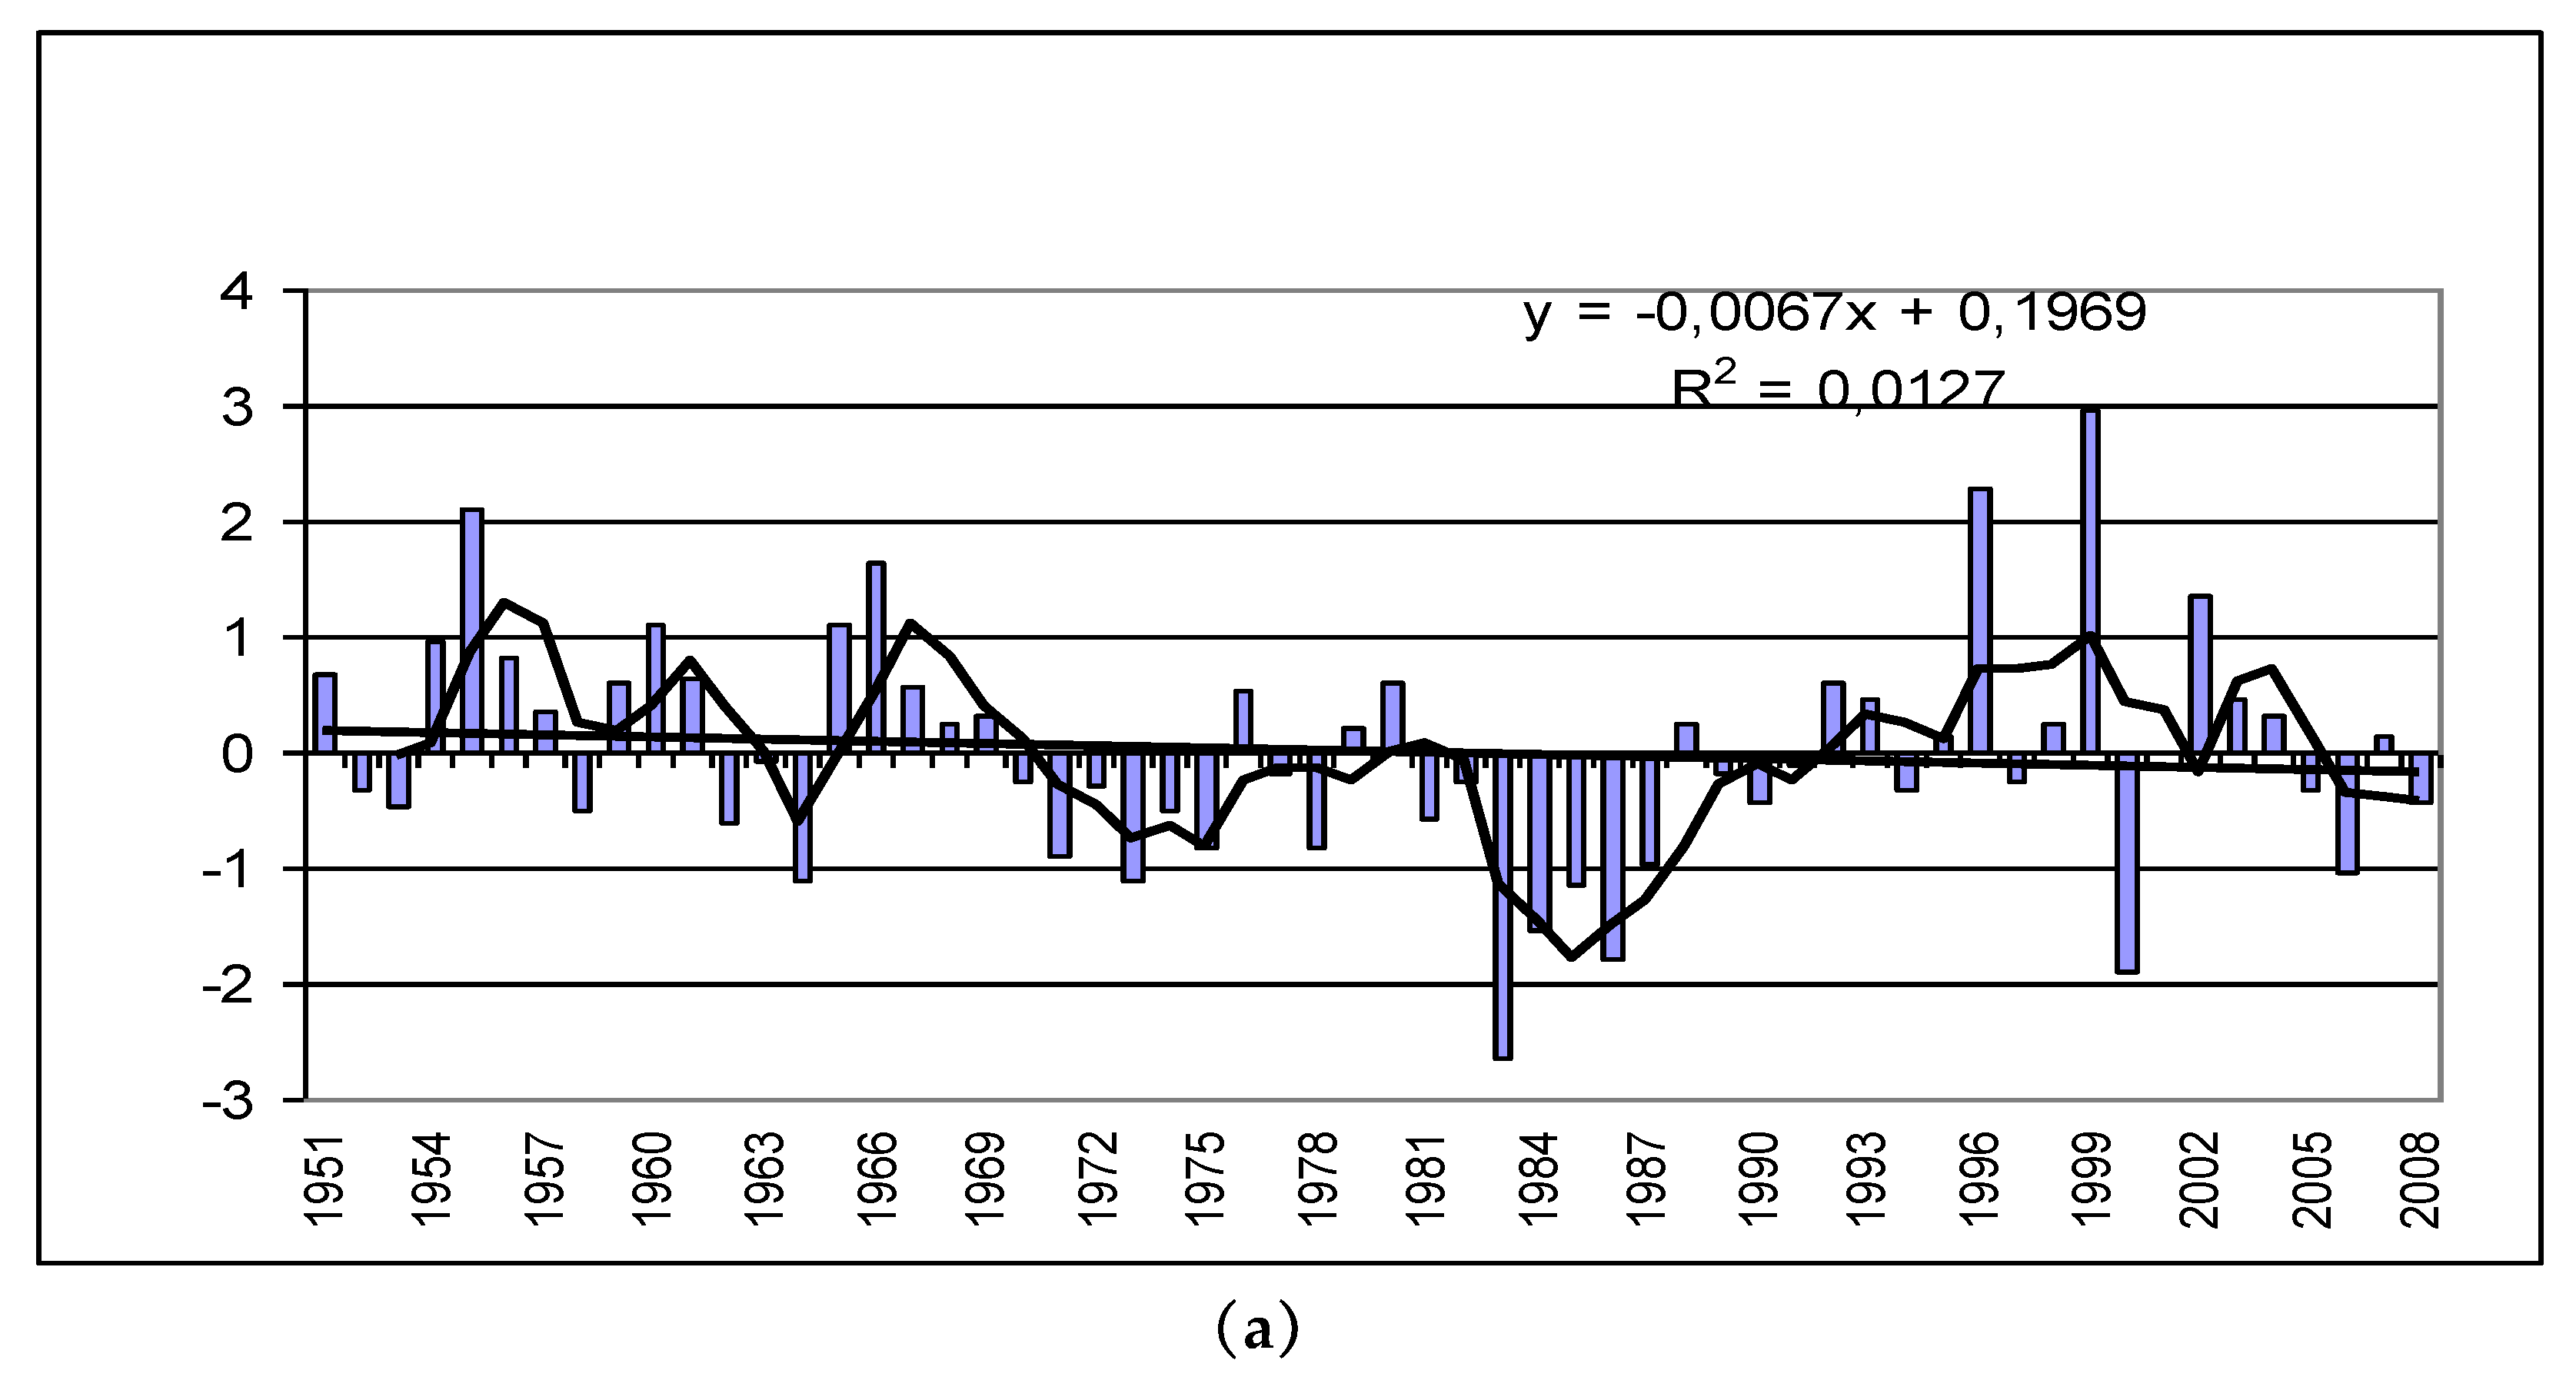
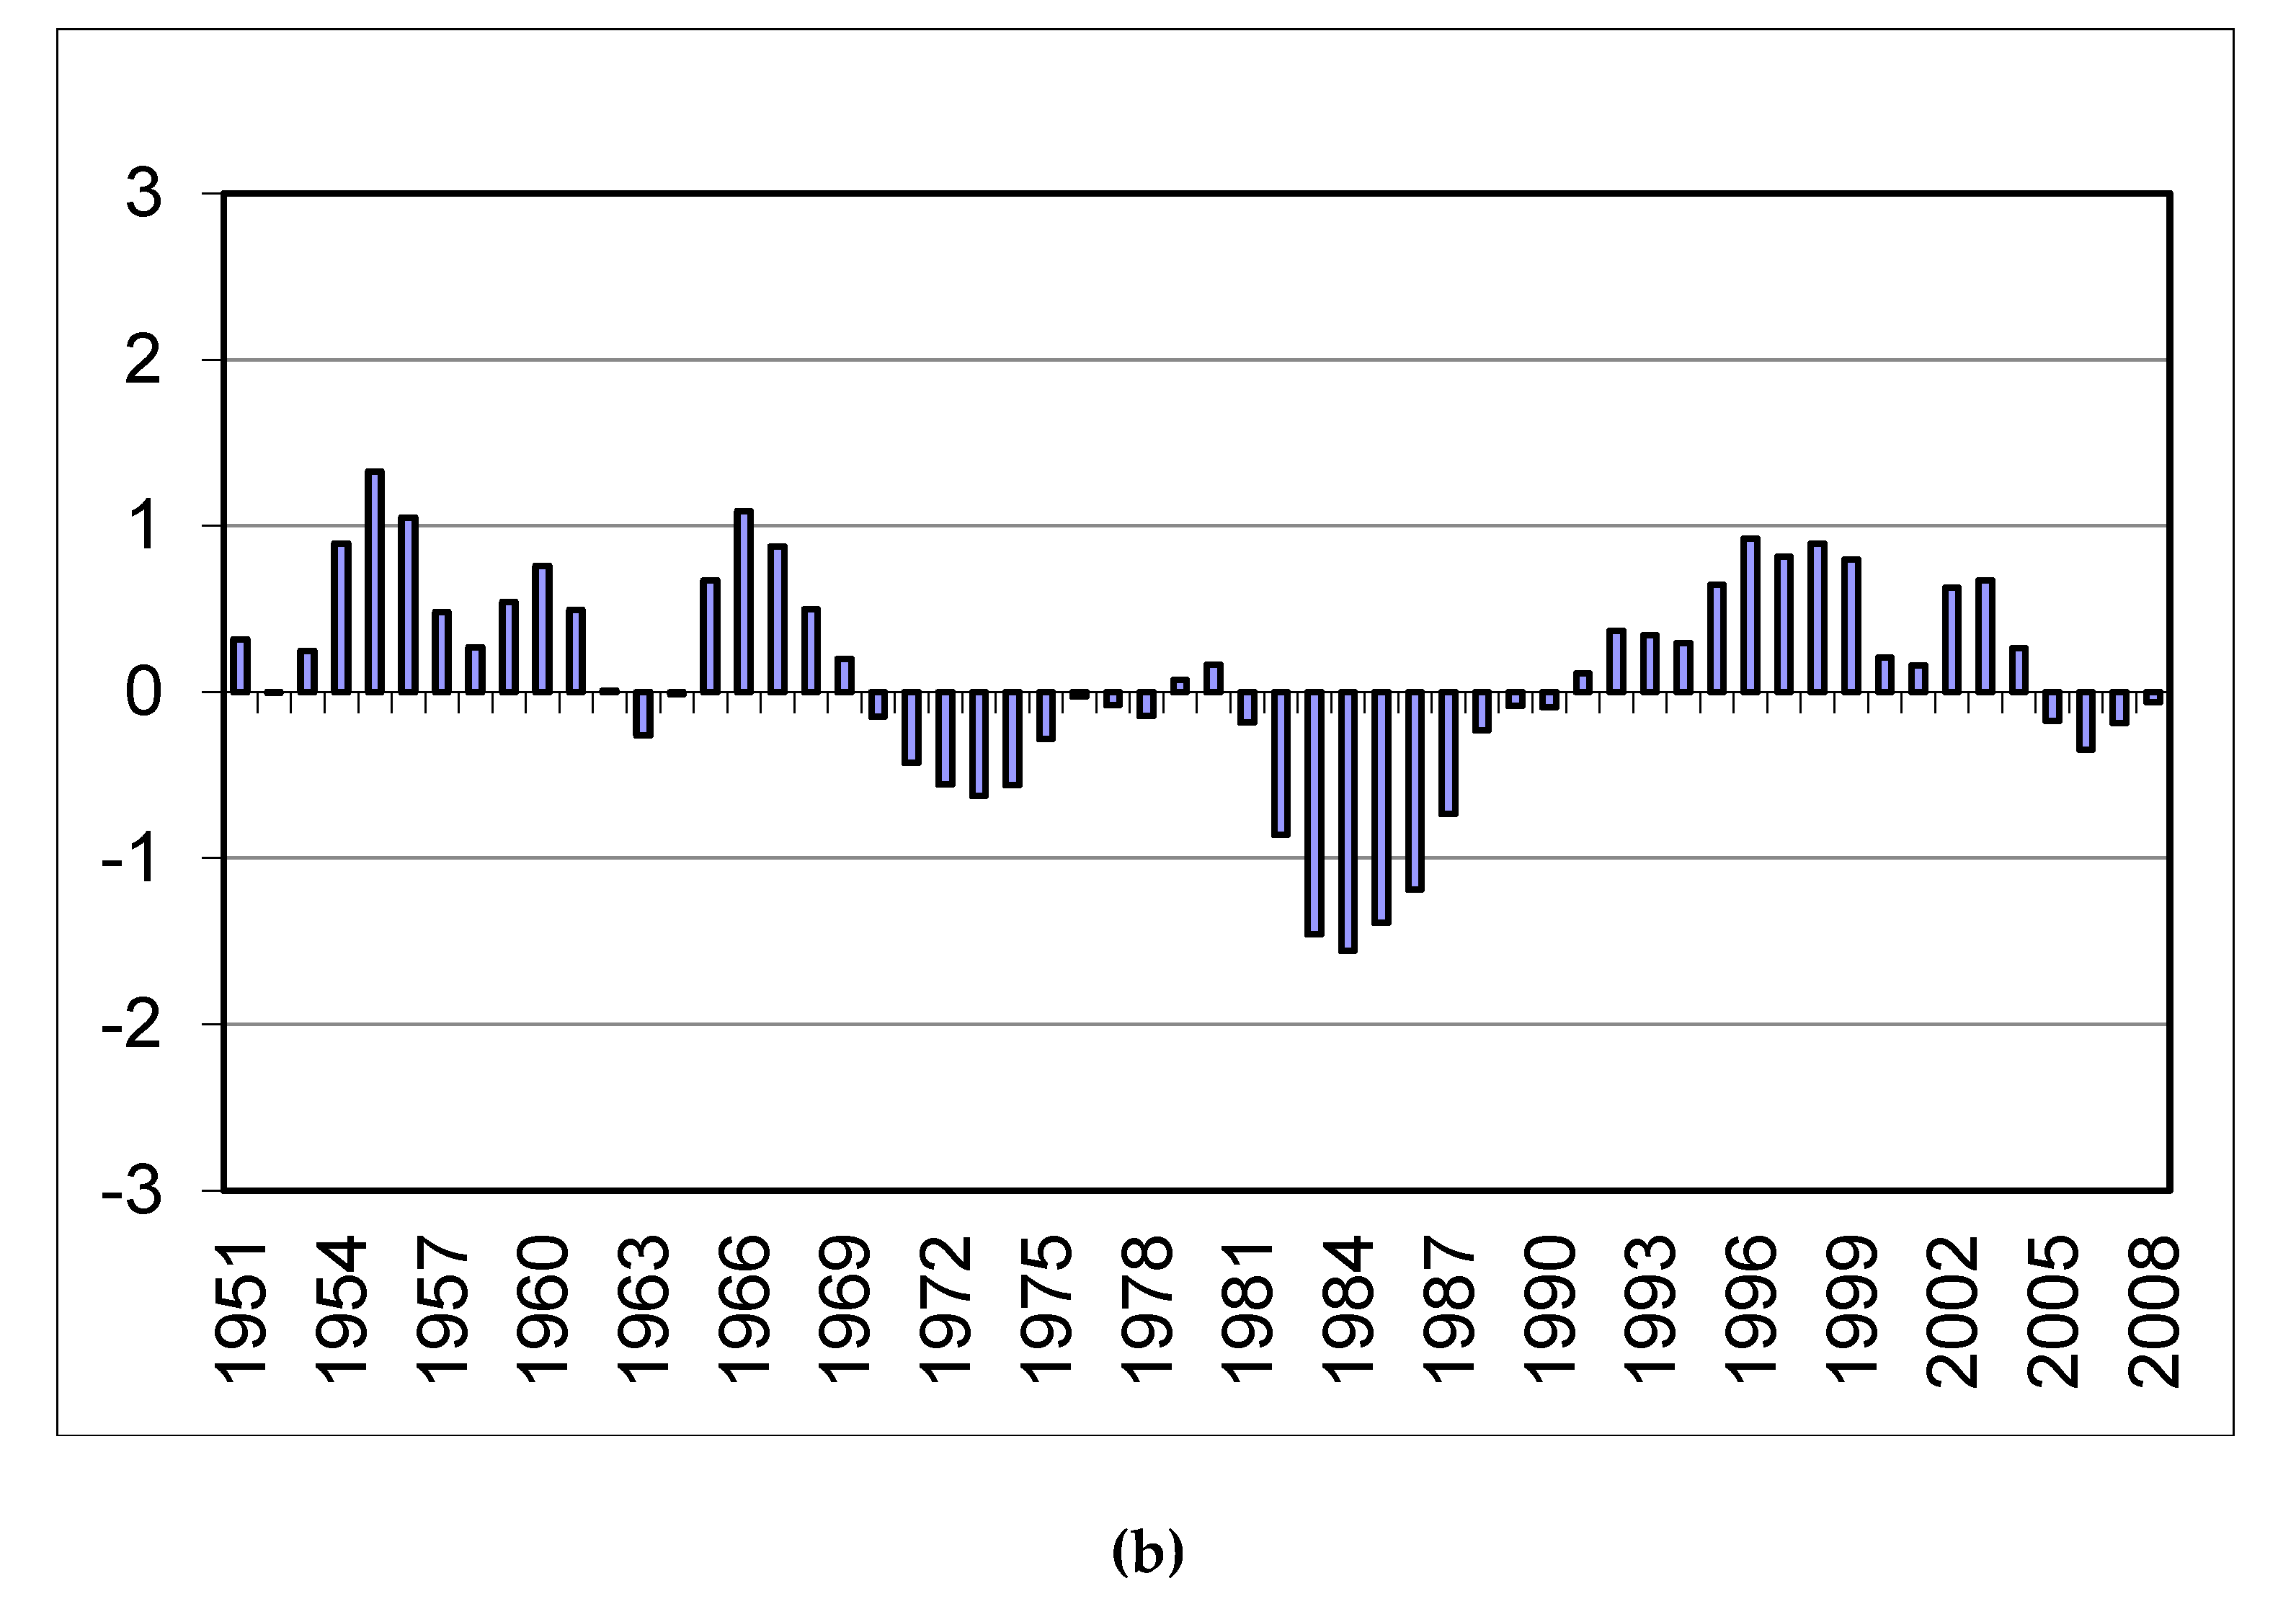
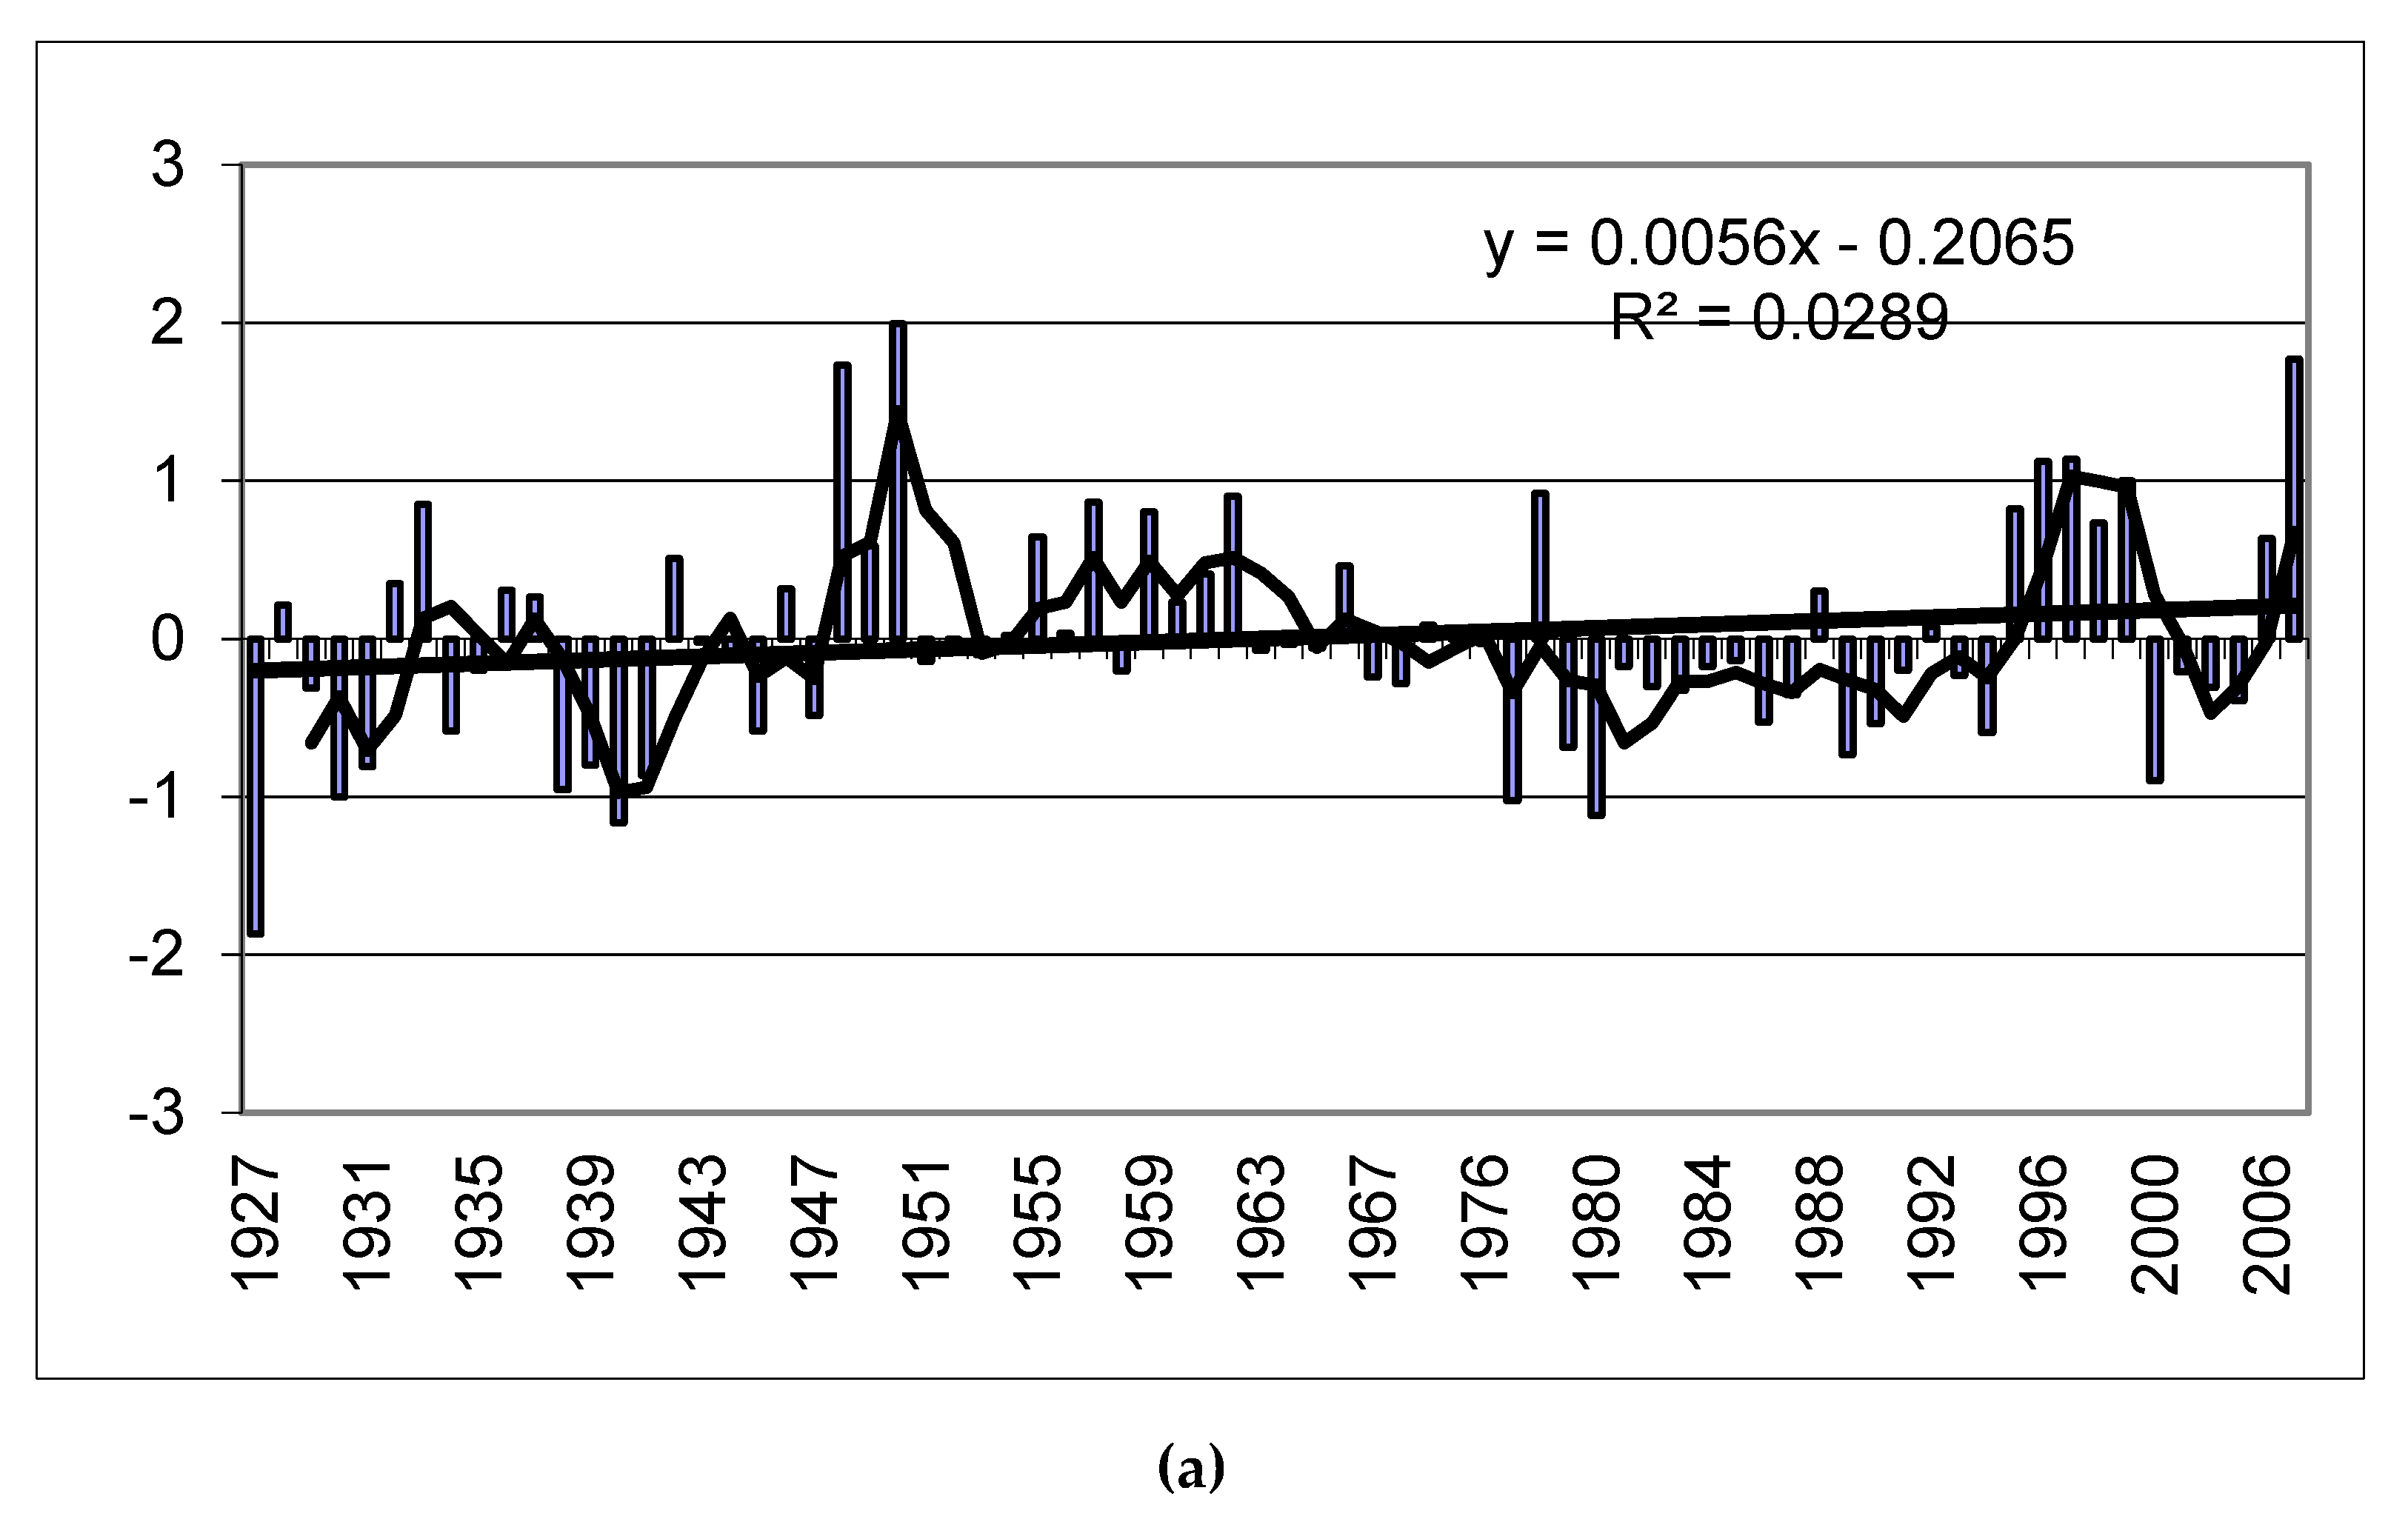
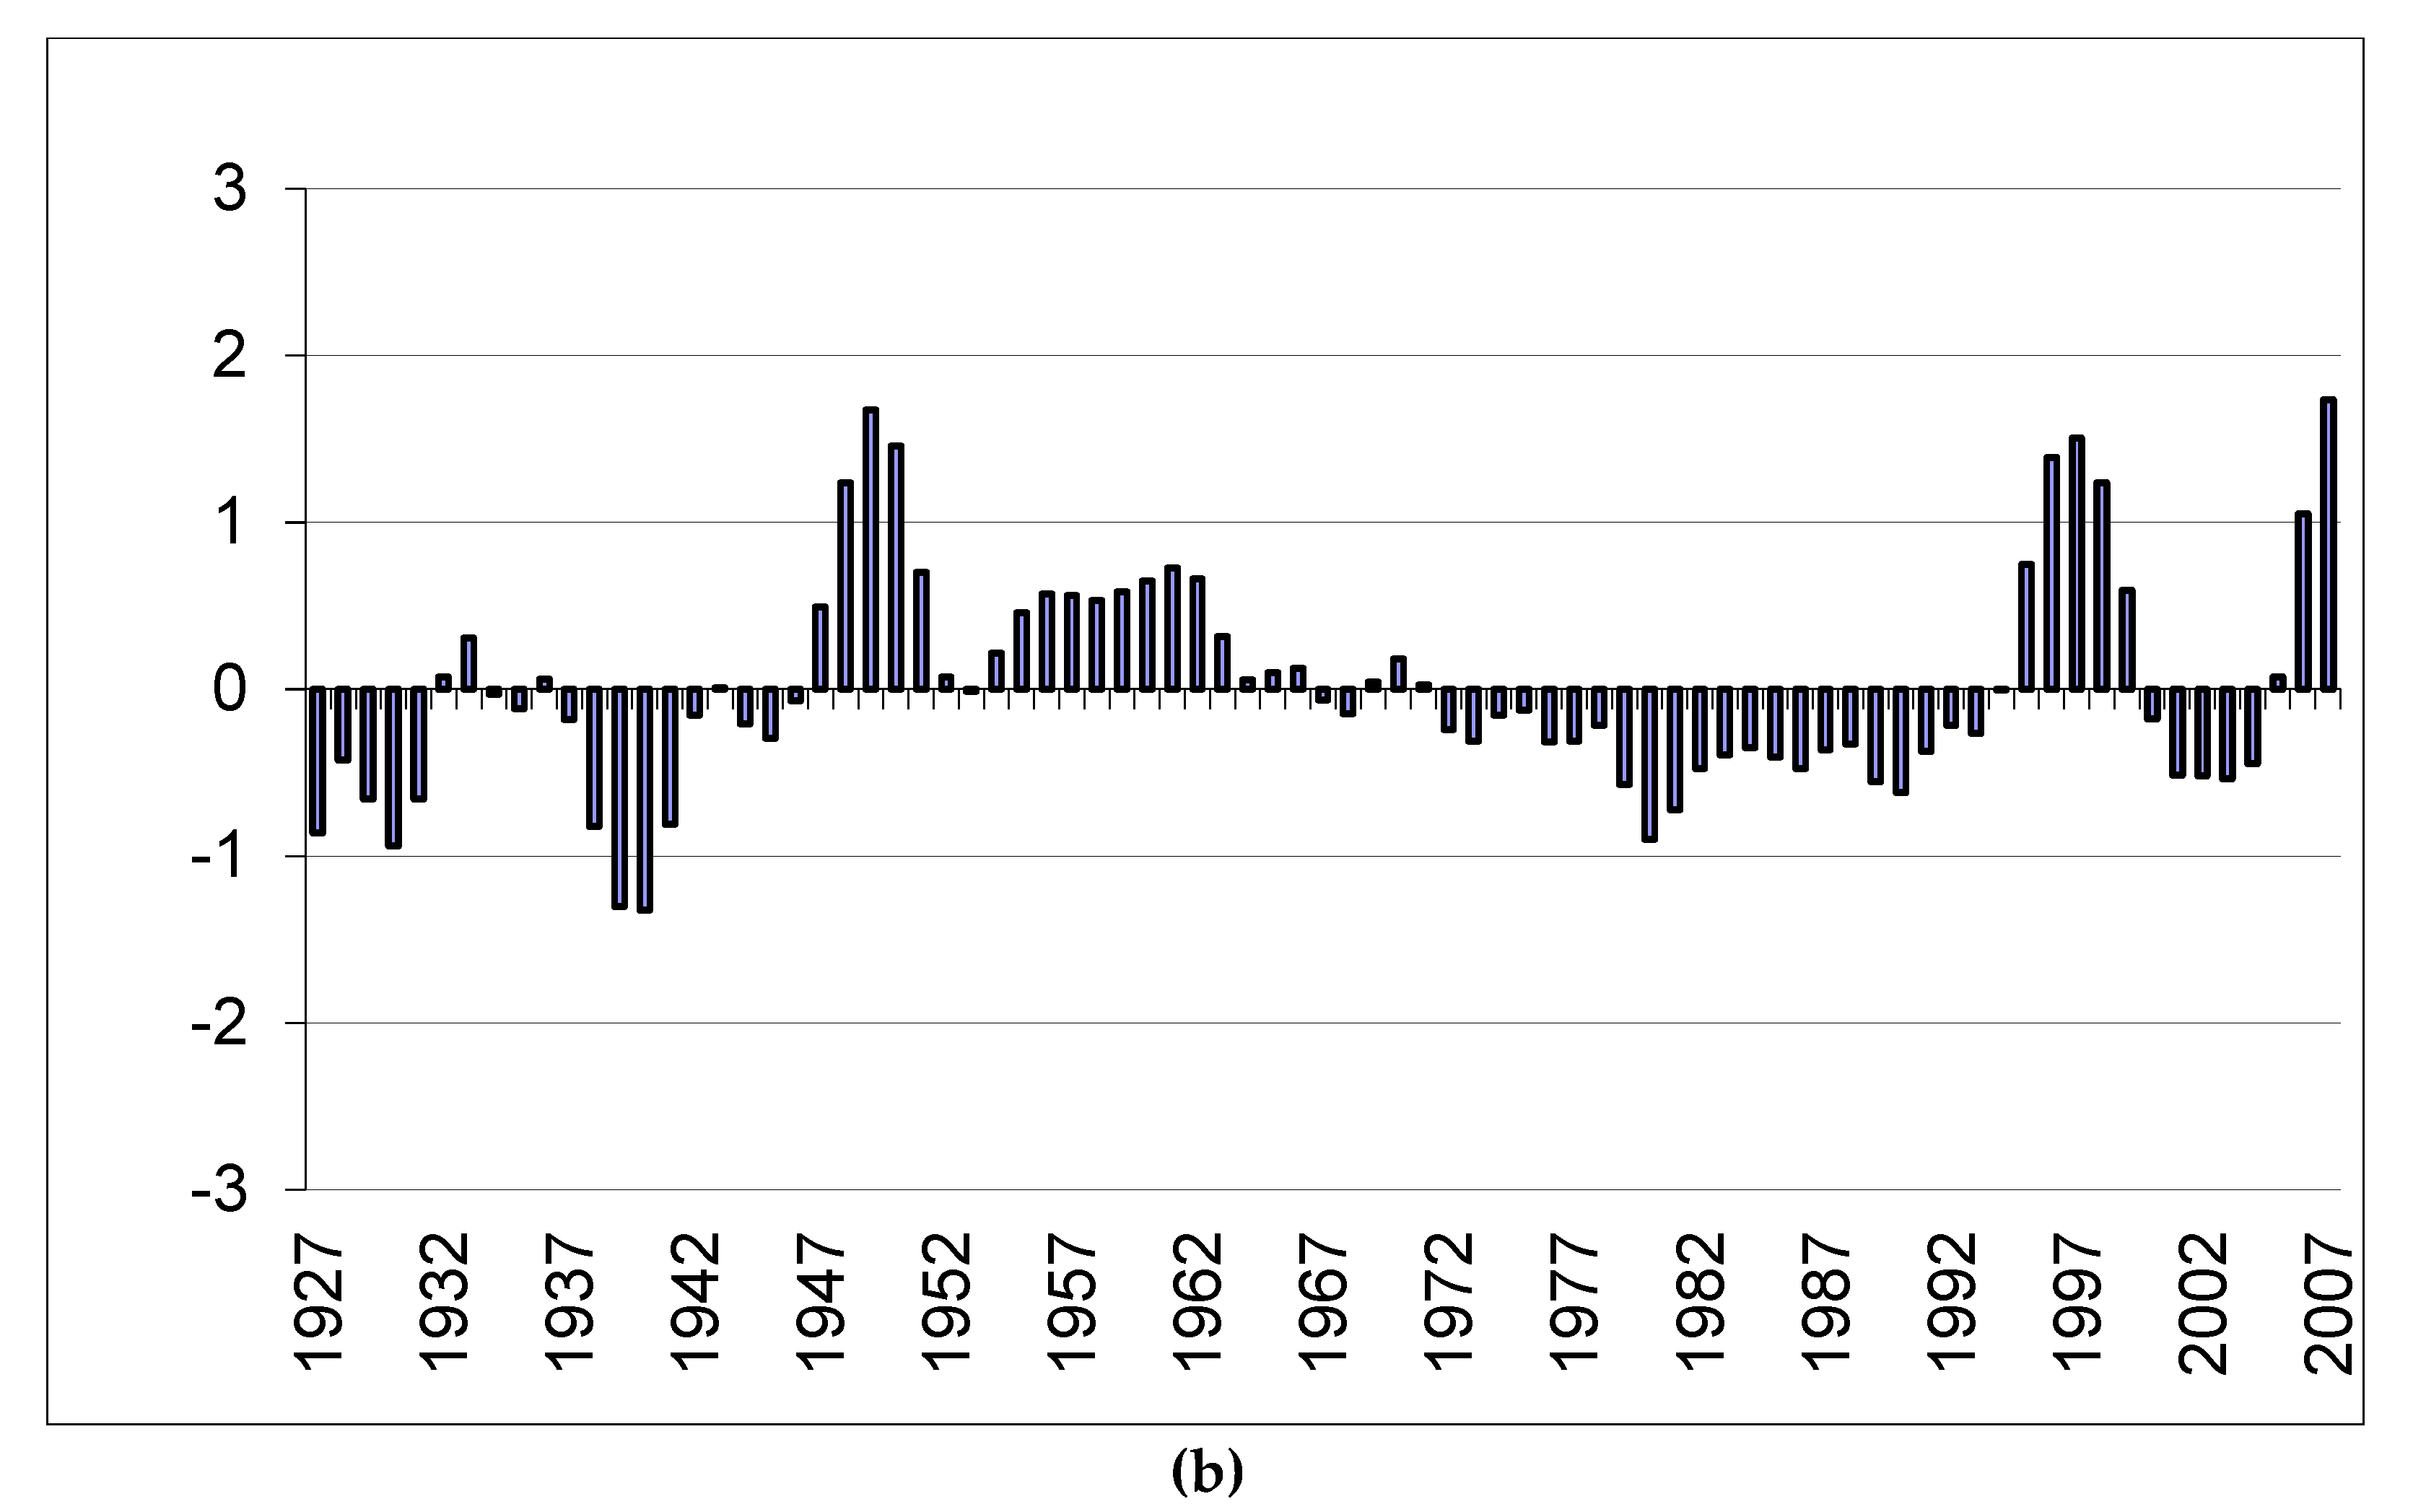
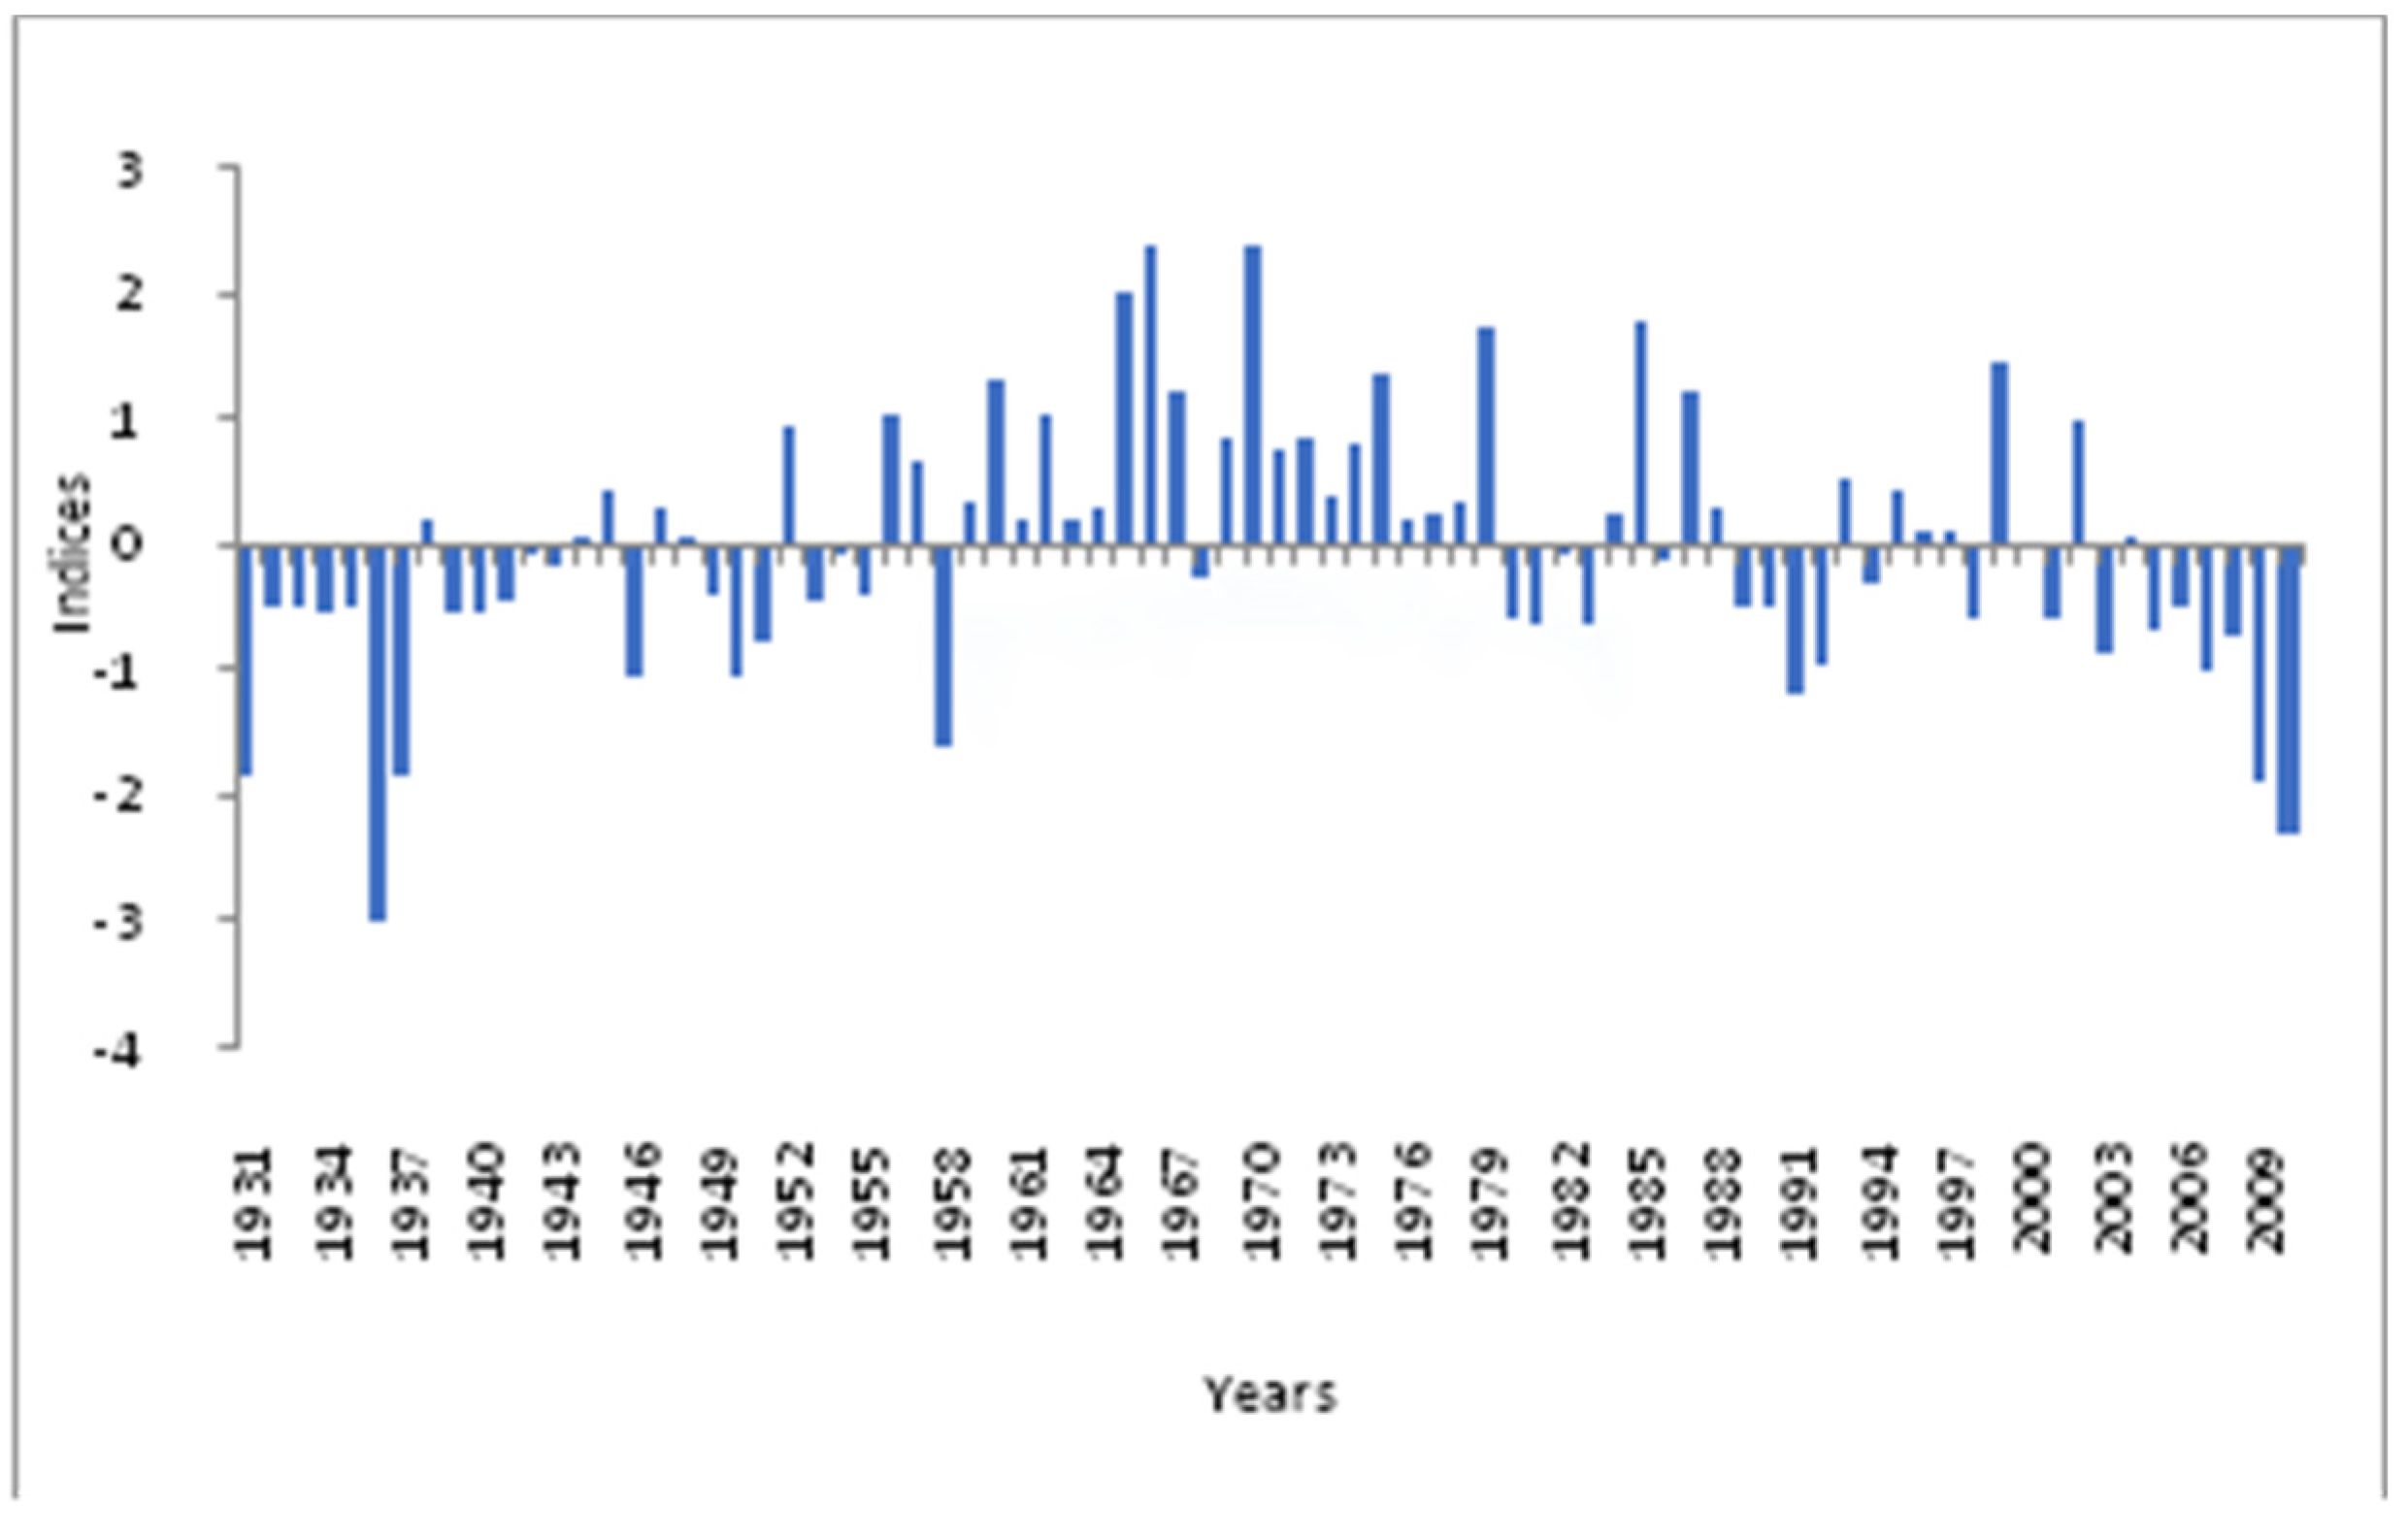
In the Mpoko watershed (CAR), the Reduced Centred Index (Rainfall Index) and the Hanning second order low-pass filter revealed a vast interannual rainfall variability. They also showed the modules of the Mpoko River, which were organized in the alternate humid (wet) phase of normal rains and the dry phase in each retained station. The humid (wet) episodes were observed in 1931–1950 in the Bangui-Mpoko station (Figure 7), in 1951–1969, in 1991–2004 at the Bossembélé station, and in 1947–1963 at the Bossangoa station. The Bossembélé station registered its dry phases in 1970–1990 (Figure 8). At Bossangoa, dry phases occurred in 1927 to 1964–1993 (Figure 9). From this analysis, there is a decrease in rainfall from −25% in Bangui to −16% at Bossembélé. However, there is a slight increase in Bossangoa. At a monthly scale, where the variability was analysed during a specific climatic period, the study showed many rainfall (precipitation) regimes in a series of observations. This passed through unimodal, bimodal, and trimodal regimes. This is at times observed during the same climatic episode. The rainy season starts earlier, that is, before the 13th pentade of the year. This is especially true at the Bangui-Mpoko station, where 53% of the pentades show the premature start to the rains. It rains more in December, and the month of February is generally dry.
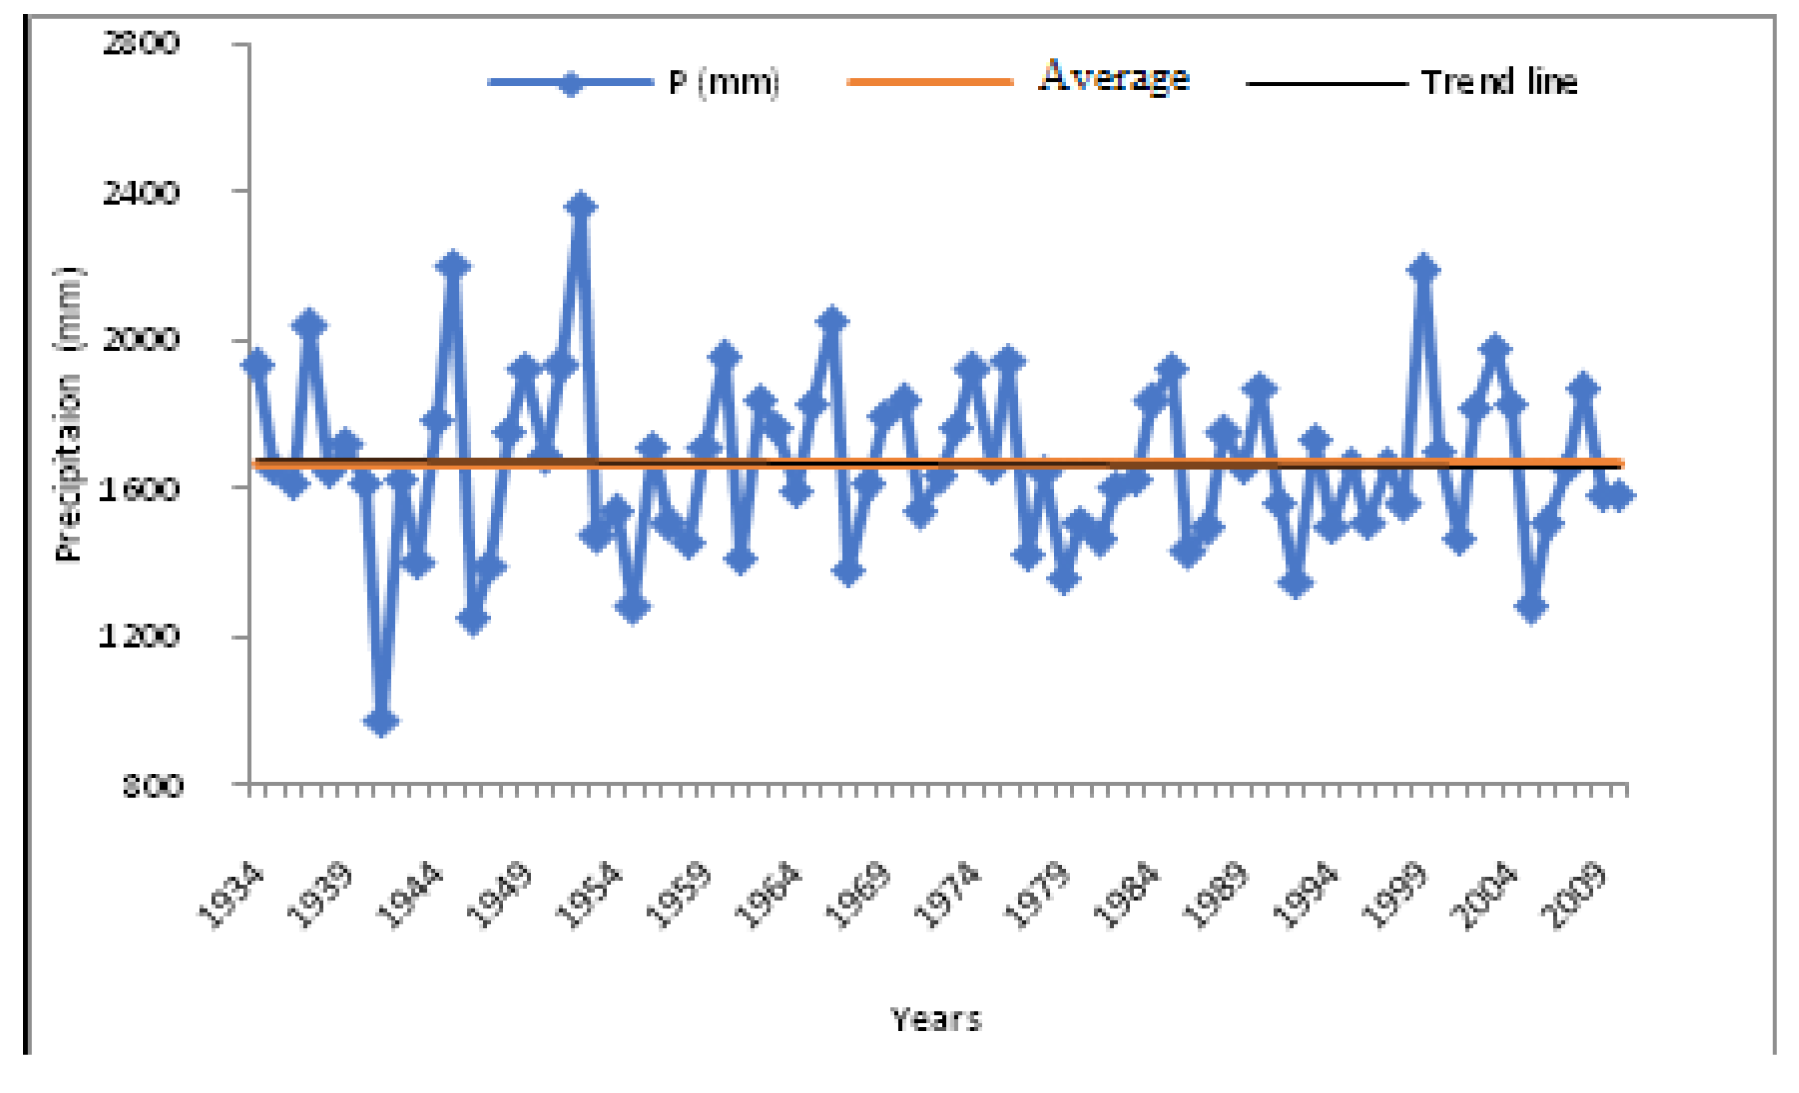
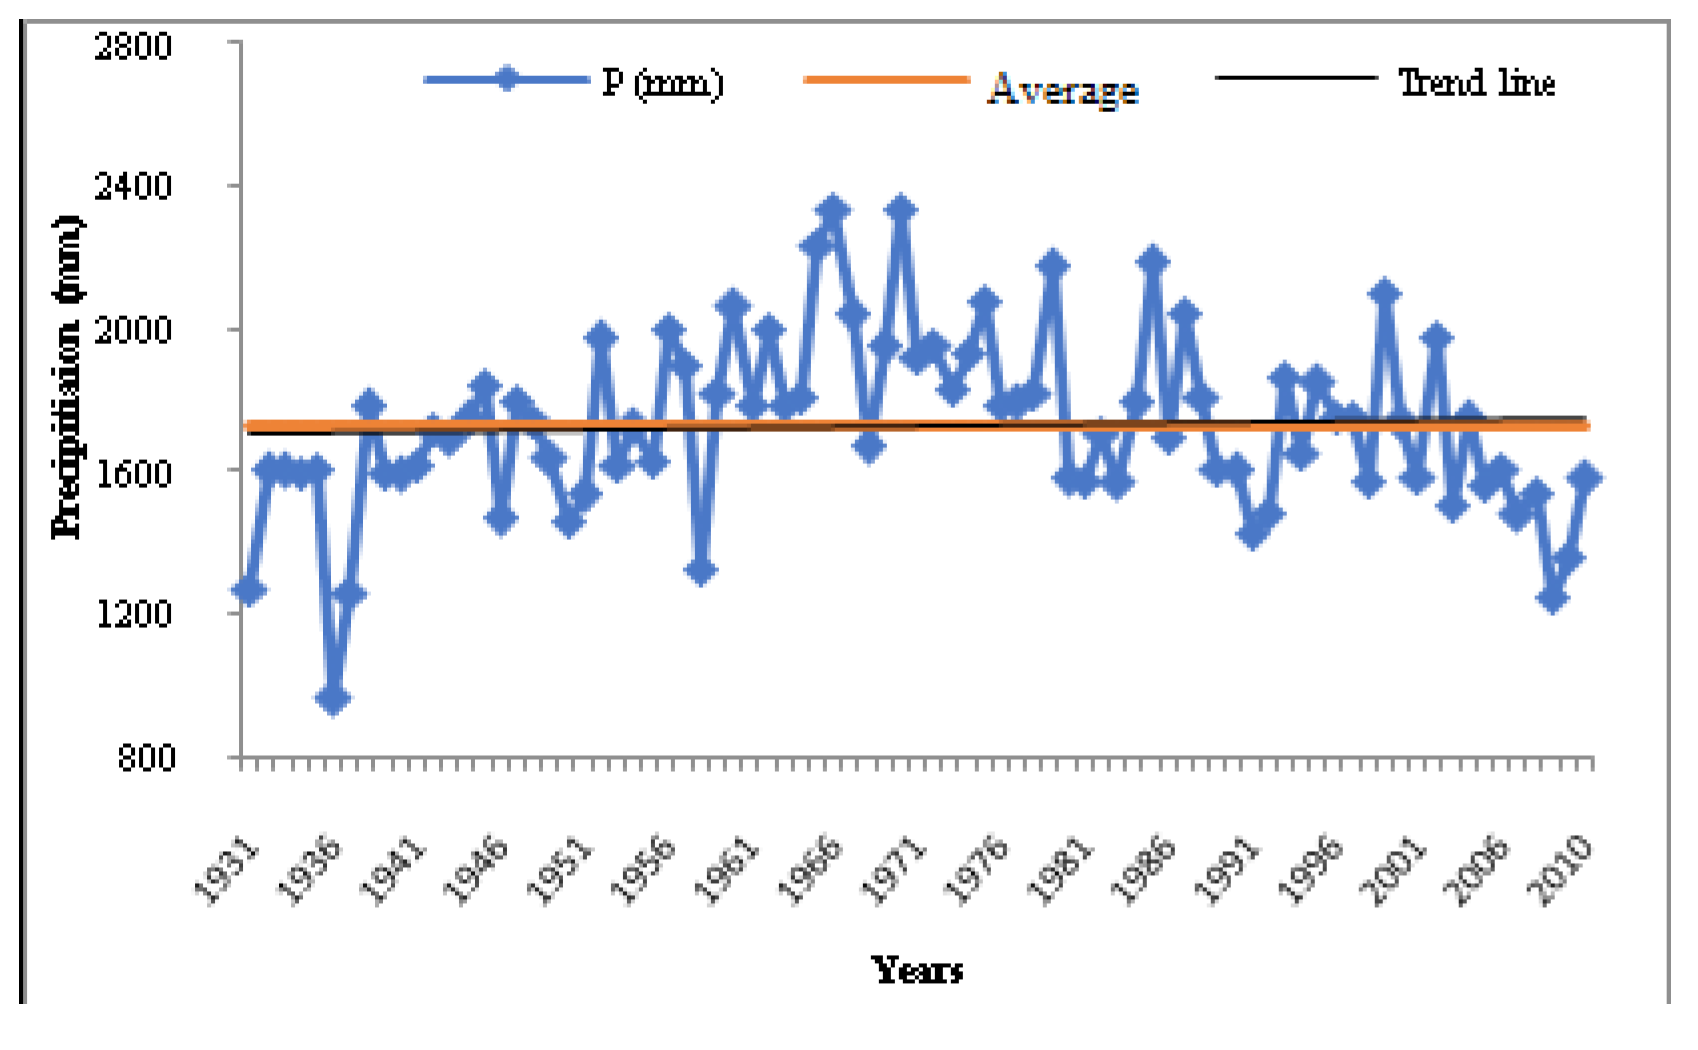
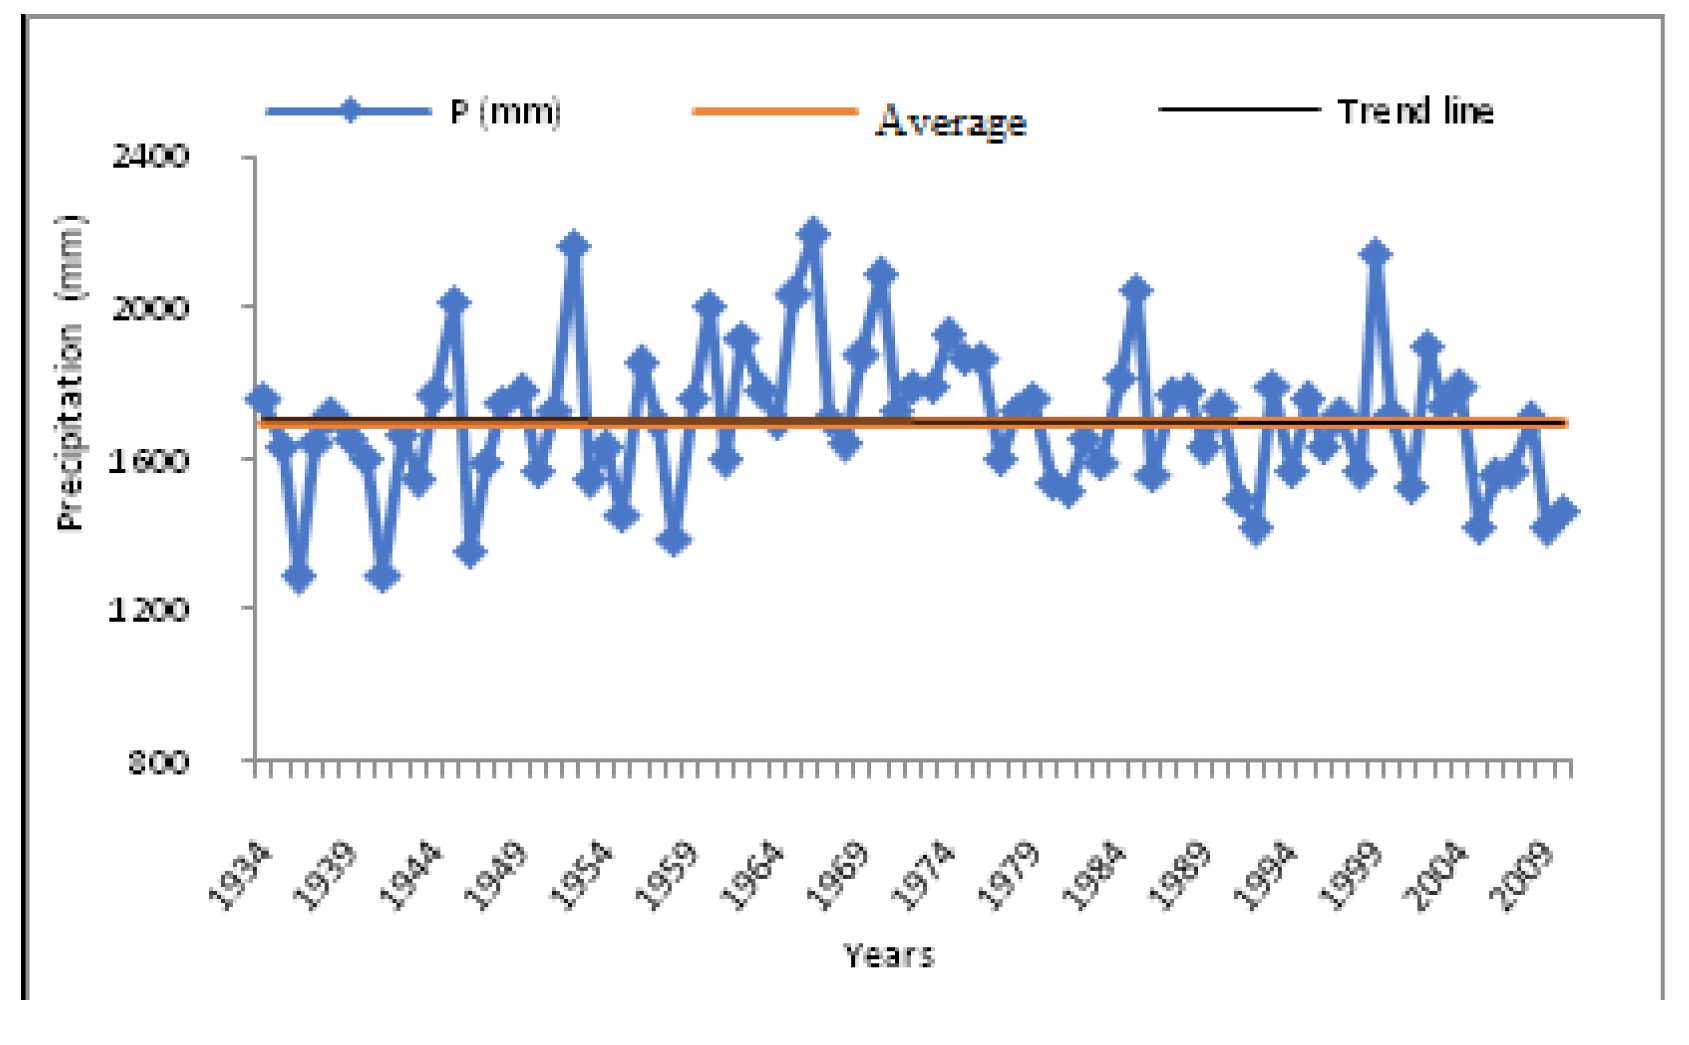
In the So’o watershed (Cameroon), the average interannual precipitations registered in the different stations are 1673 ± 250 mm for Ebolowa between 1931 and 2010 (Figure 10 and Figure 11) and 1702 ± 169 mm in the So’o watershed (1934–2010) at the So’o bridge (Figure 12 and Figure 13). These averages are slightly lower than those previously obtained [36,44], which show a slight decrease in rainfall over the last few years and a decrease in annual rainfall from the Atlantic coast toward the interior of the continent. The application of Petit’s test to the rainfall annual variable does not reveal the presence of a break in the Sangmelima station and in the So’o watershed. Conversely, it shows a break at the Ebolowa station in 1951 with an increasing trend of about 13%. The variation of seasonal rainfall in Sangmelima for the short rainy season shows an average of 175 ± 30 mm, and 92 ± 8 mm for the short dry season. The long dry season shows an average of 45 ± 12 mm, compared with 215 ± 68 mm during the long rainy season. Seasonal rainfall in Ebolowa is 187 ± 31 mm for the short rainy season and 67 ± 22 mm for the short dry season. It has an average of 53 ± 20 mm during the long dry season and 299 ± 60 mm during the short dry season. The long dry season has about 49 ± 43 mm, while the long rainy season has 222 ± 64 mm. When Petit’s test is applied to seasonal rainfall data, it presents breaks in 1968 during the short dry season in the Ebolowa station, with some increasing trends. The break in Sangmelima during the same season is observed in 1964 with an increasing trend. A break is also observed at the Ebolowa station in 1988 during the short rainy season with a decreasing trend; another one in 1953 during the long rainy season had an increasing trend. The application of this test to the rainfall data of the short dry season reveals an increasing trend. These results reveal a decrease in rainfall (precipitations) during the long dry season and an increase during the short dry season.
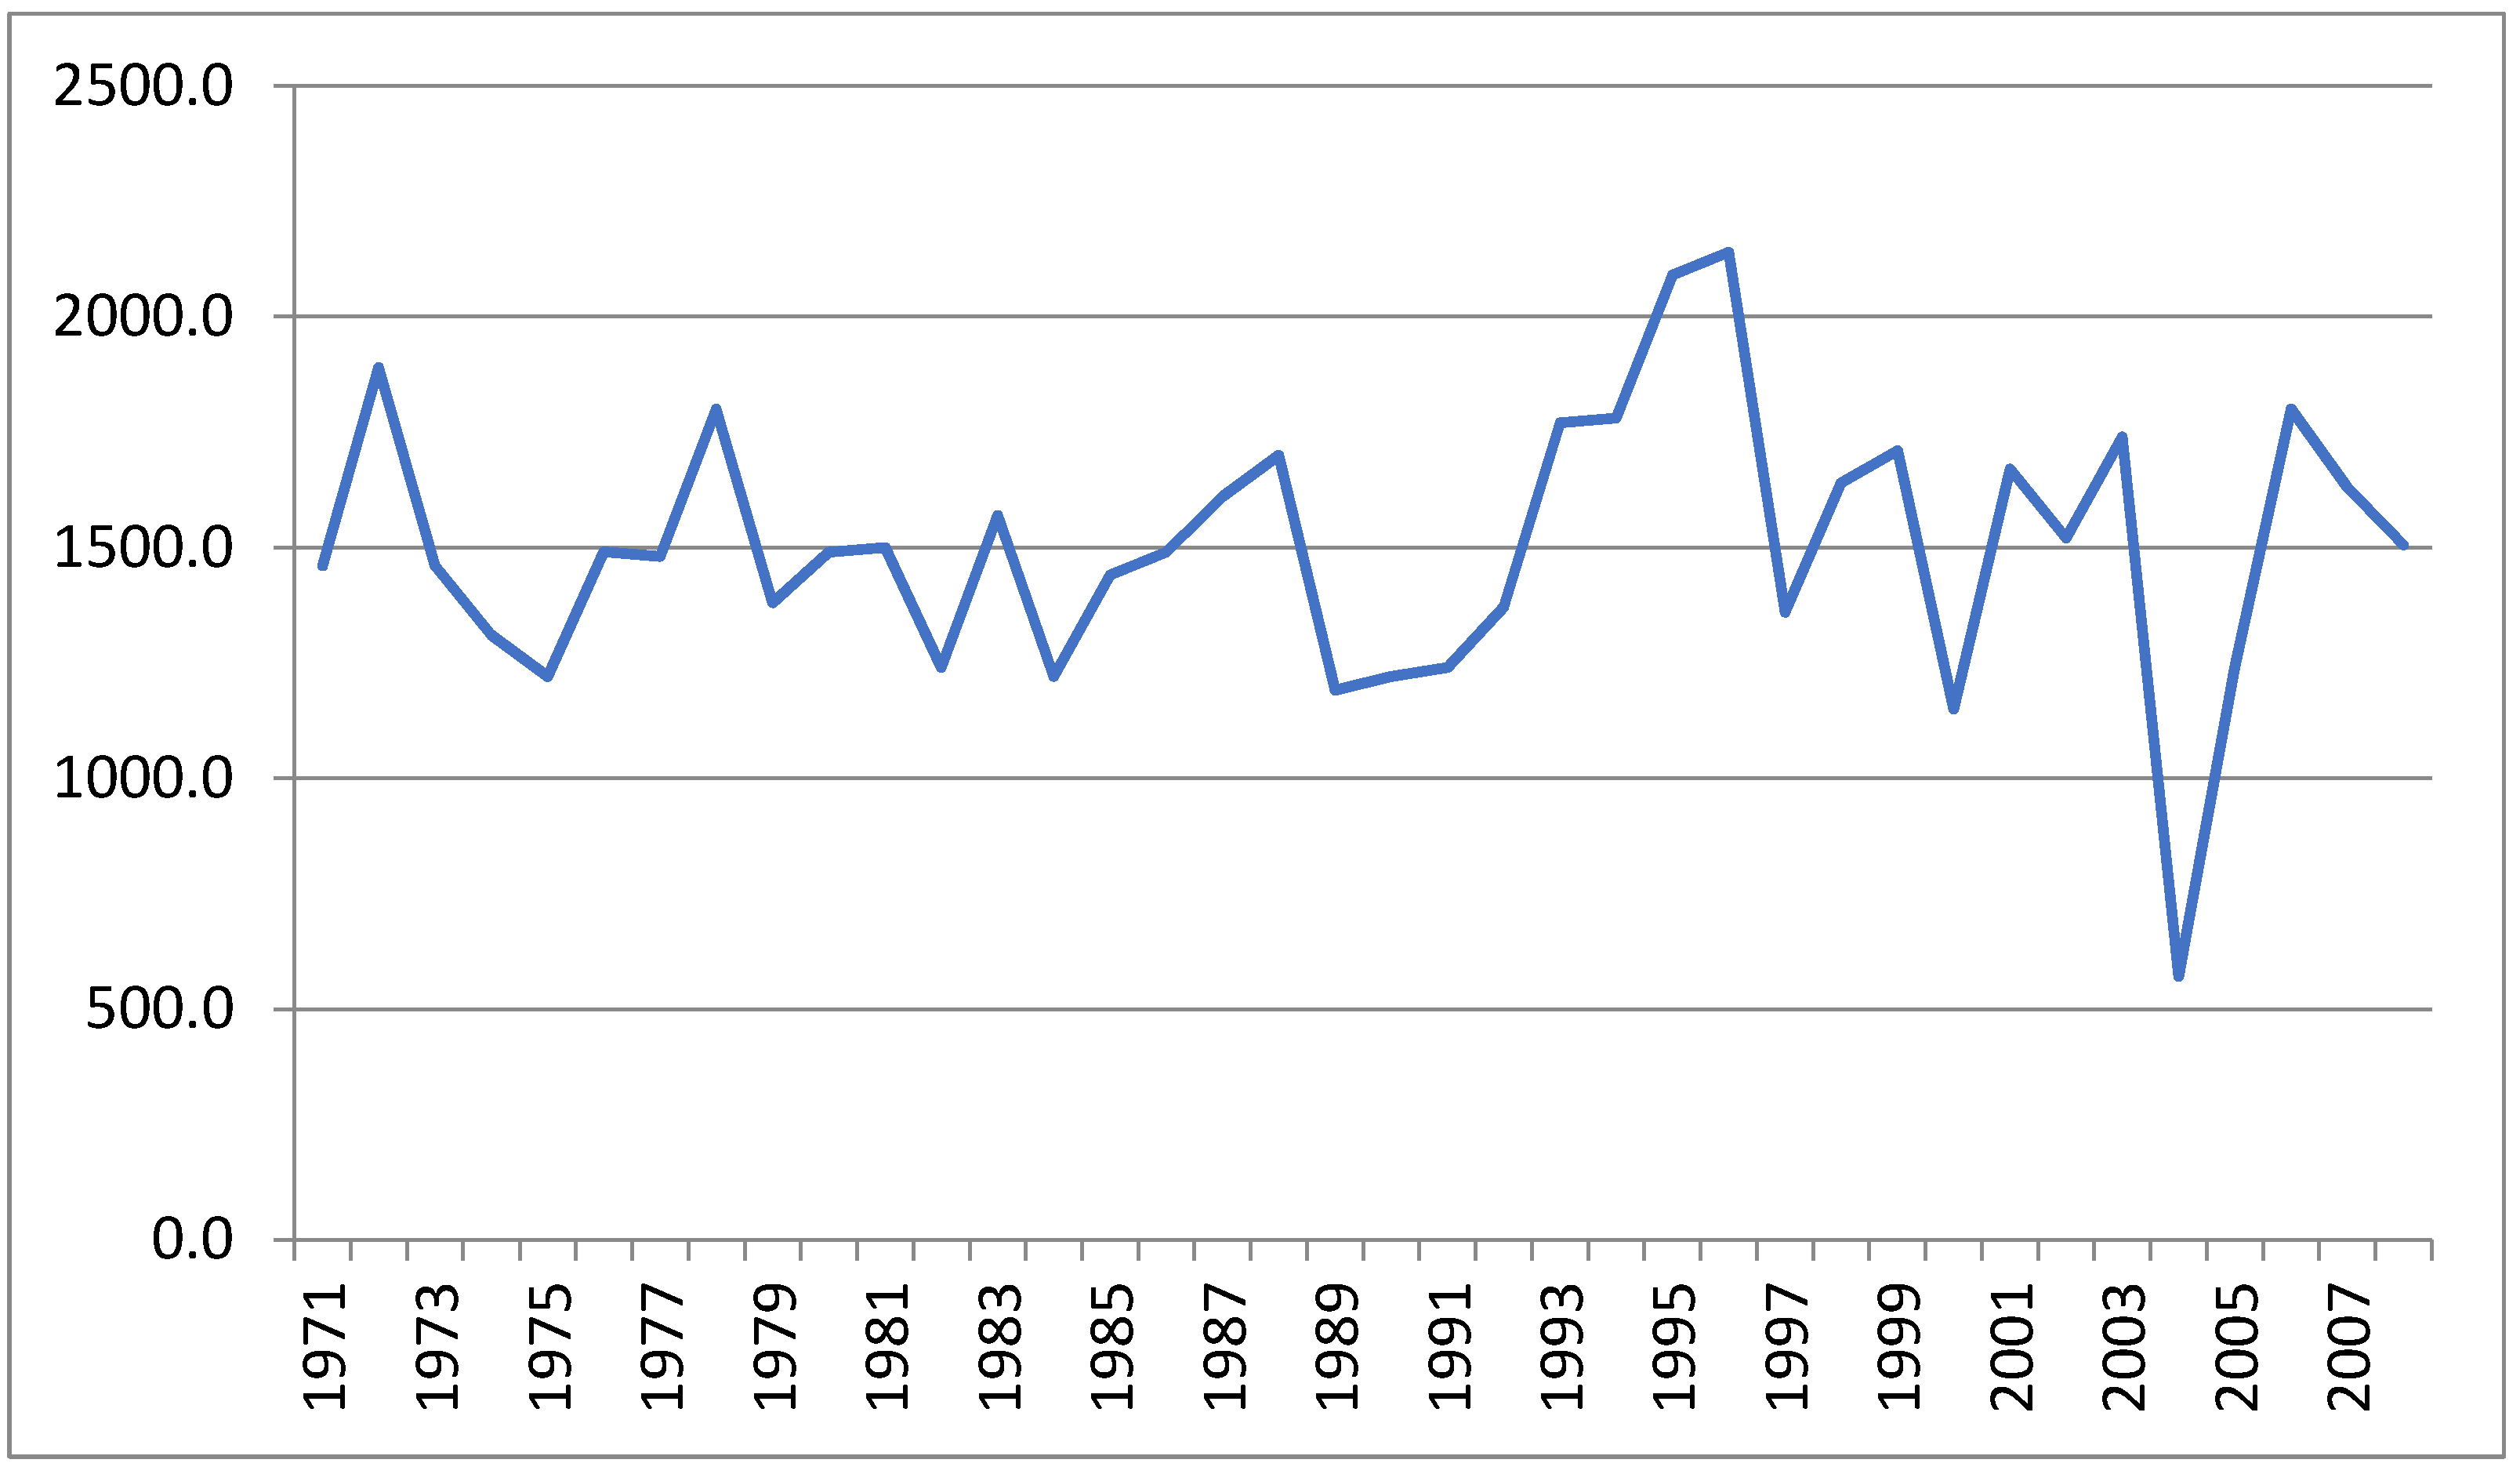
In the community of Masako (DRC), the quantity of water film precipitated annually shows a curve with a sawtooth shape. On average, the availability of water from precipitation was 1518 mm before 2001; it dropped to 1470 mm after 2001 (Figure 14). In all, precipitation has decreased by 48 mm, while the temperature has increased by 2.8 °C.
3.1.3. Impacts of Rainfall Variability on the Surface Flows (Runoffs) in the Congo Basin
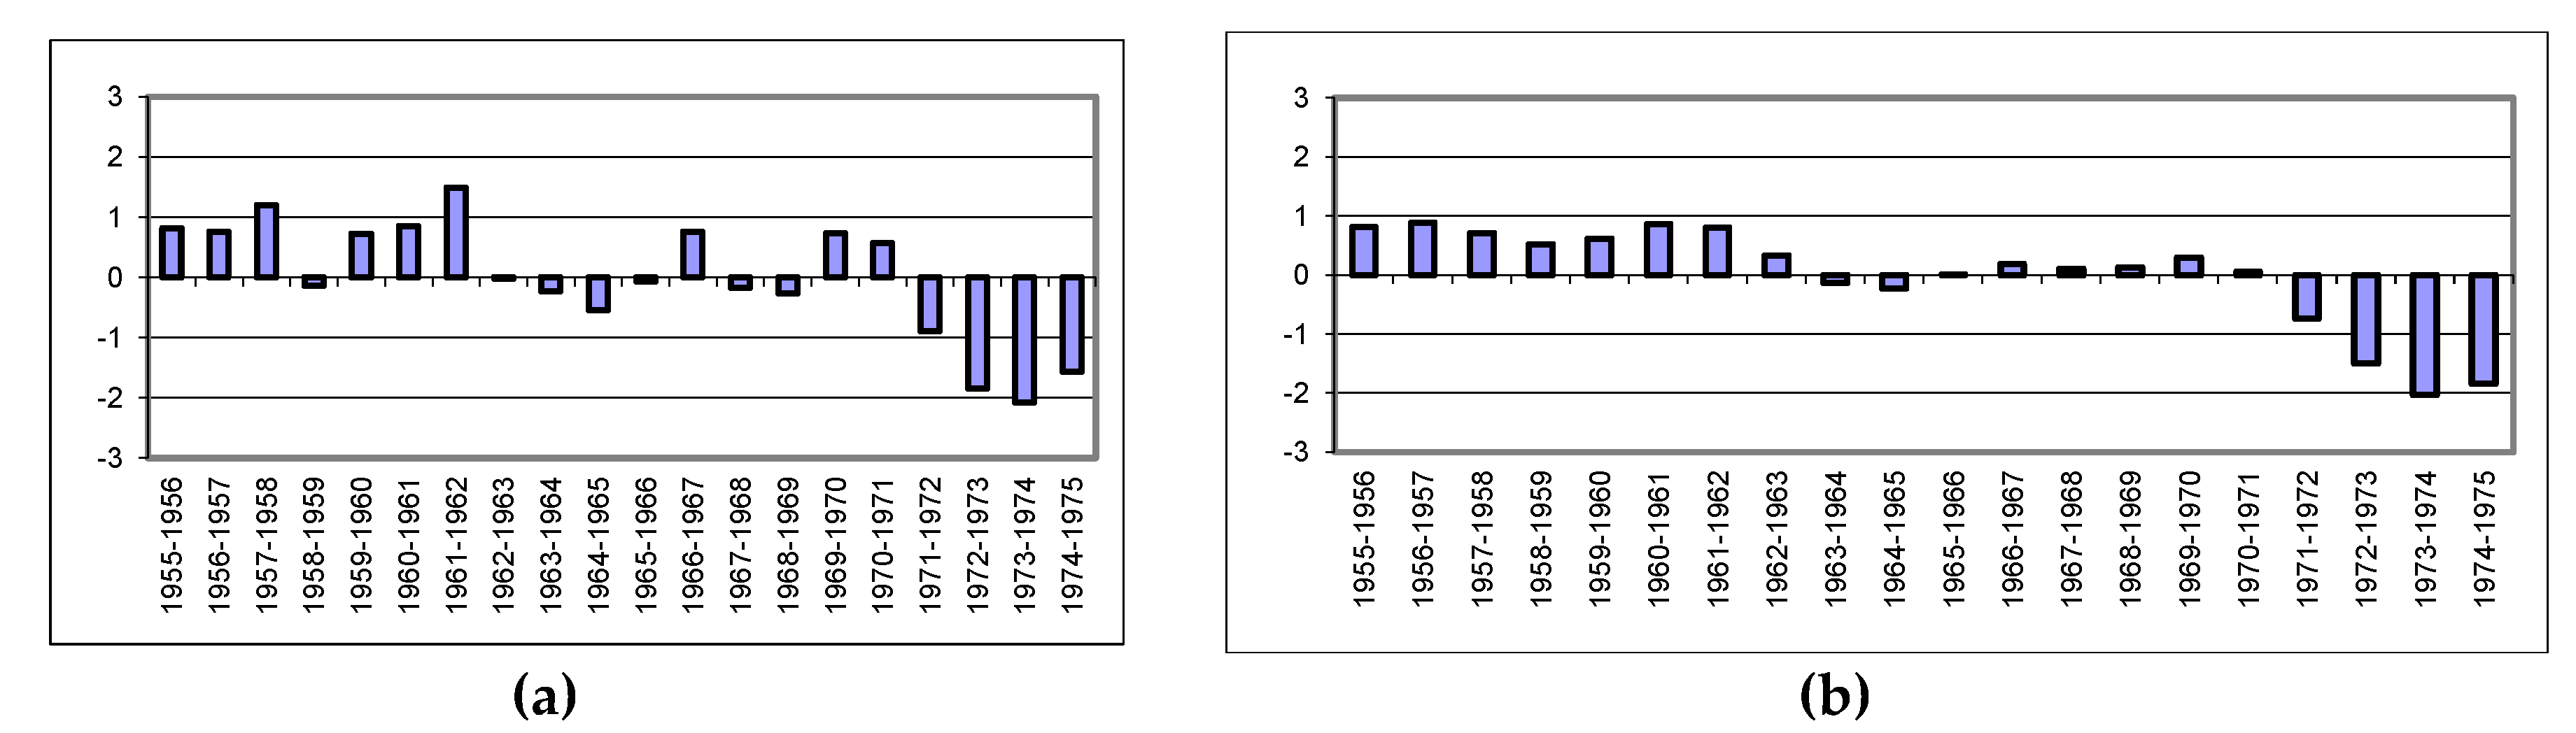
In the Mpoko River (CAR), during the series’ observation period from 1955 to 1975, Mpoko at Bossélé Mballi has an average annual flow of 100 m3/s with a minimum of 37.58 m3/s in 1973 and a maximum of 144.5 m3/s in 1961, with an irregularity coefficient of 3.84. The interannual variability coefficient is 34.08%, revealing a high variability of annual hydrologic modules. The interannual evolution of flows shows three variability cycles in which the surface flow decreases progressively. We therefore note a slightly humid (wet) cycle between 1955 and 1962, with an average interannual module of 121.1 m3/s (Figure 15). This is followed by another one that is normal, moving from 1963 to 1970 with an average of 102.3 m3/s. Finally, the series ends in a deficit/shortage episode (1971–1975), which is 51.93 m3/s as an interannual average of modules.
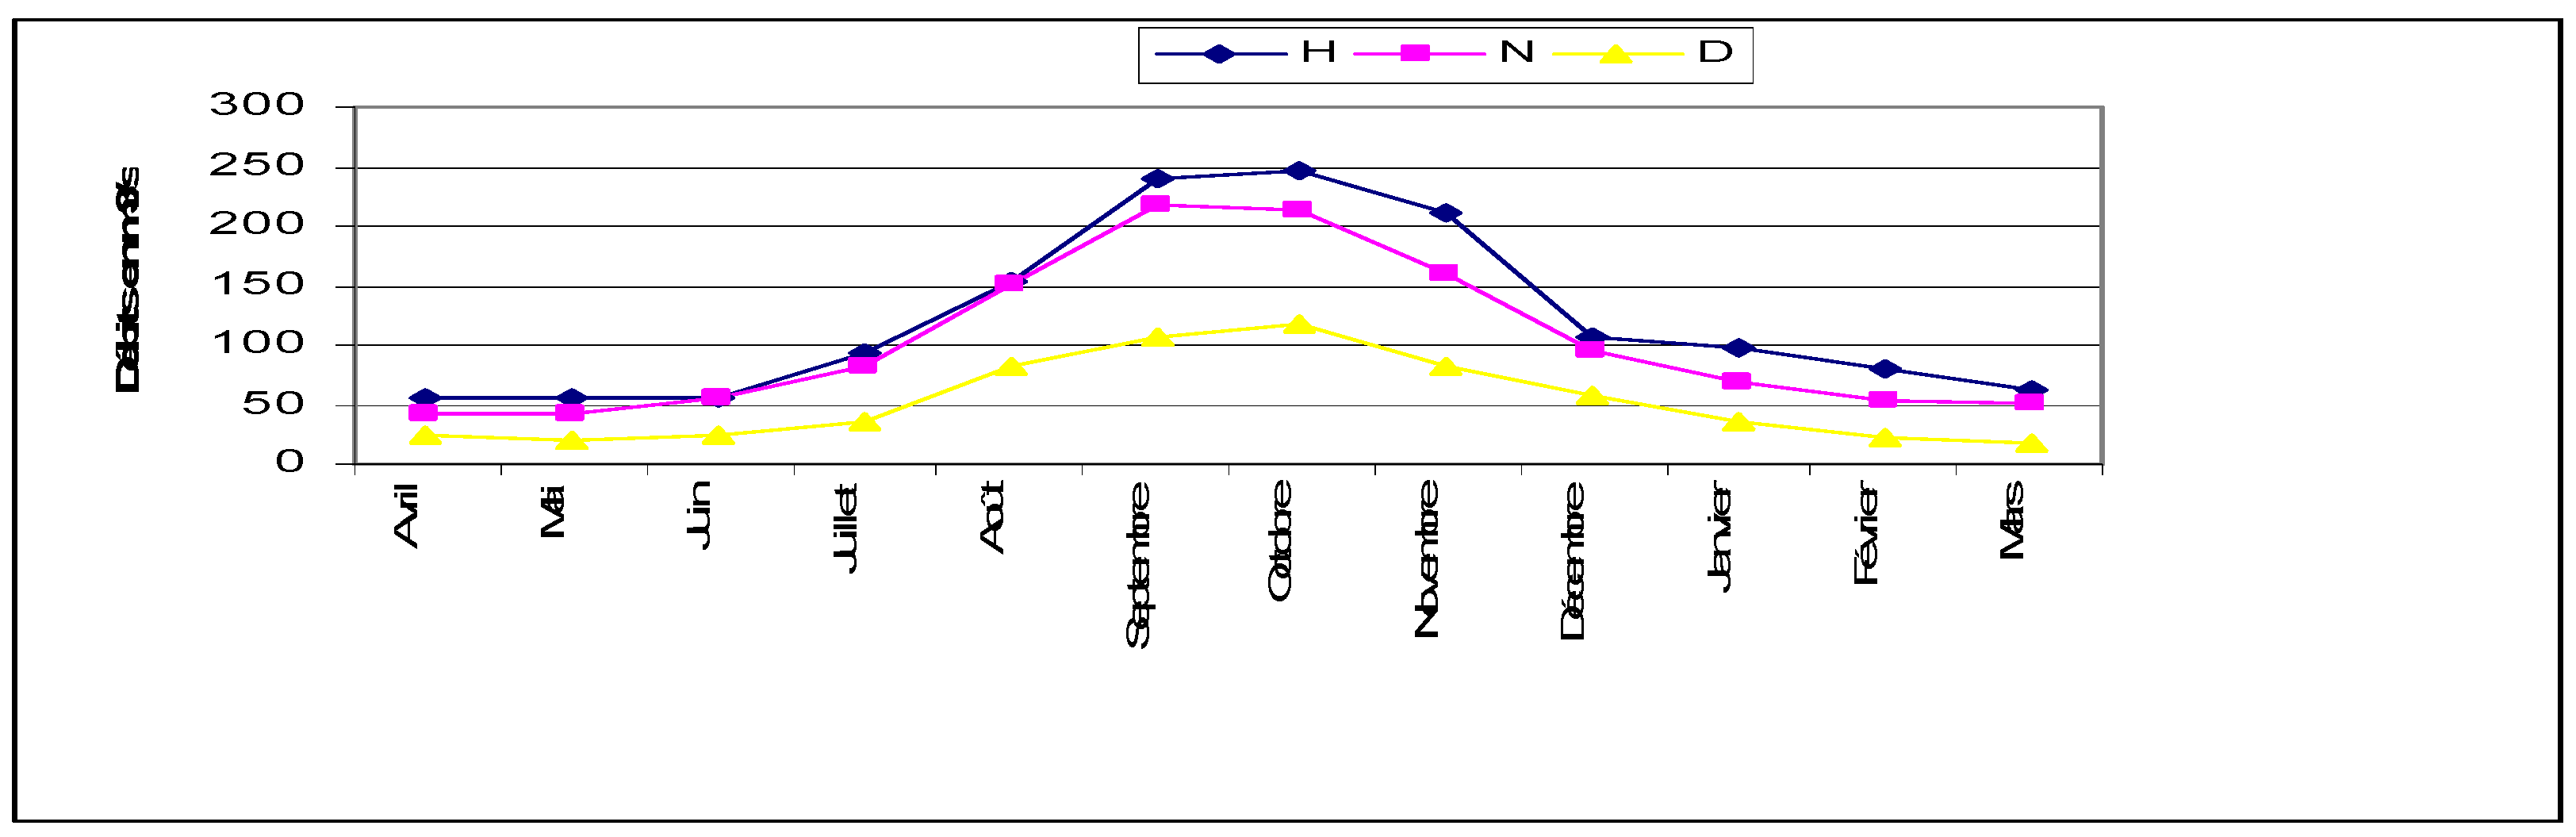
The Mpoko regime shows a maximum in September, October (Figure 16) during the six hydrologic periods. The increase in annual water levels occurs frequently, first in October and in November again, as the monthly frequencies of 41% in October, 29% in November, and 8% in September. The low levels of water are characteristic of the months of March (34%) and April (33%); the frequency of the minimum is weak in February (2%) and March (3%). Since 1970, the modules of the Mpoko River have not stopped declining. The decrease is 60% for low-flow water levels and 39% for annual modules.
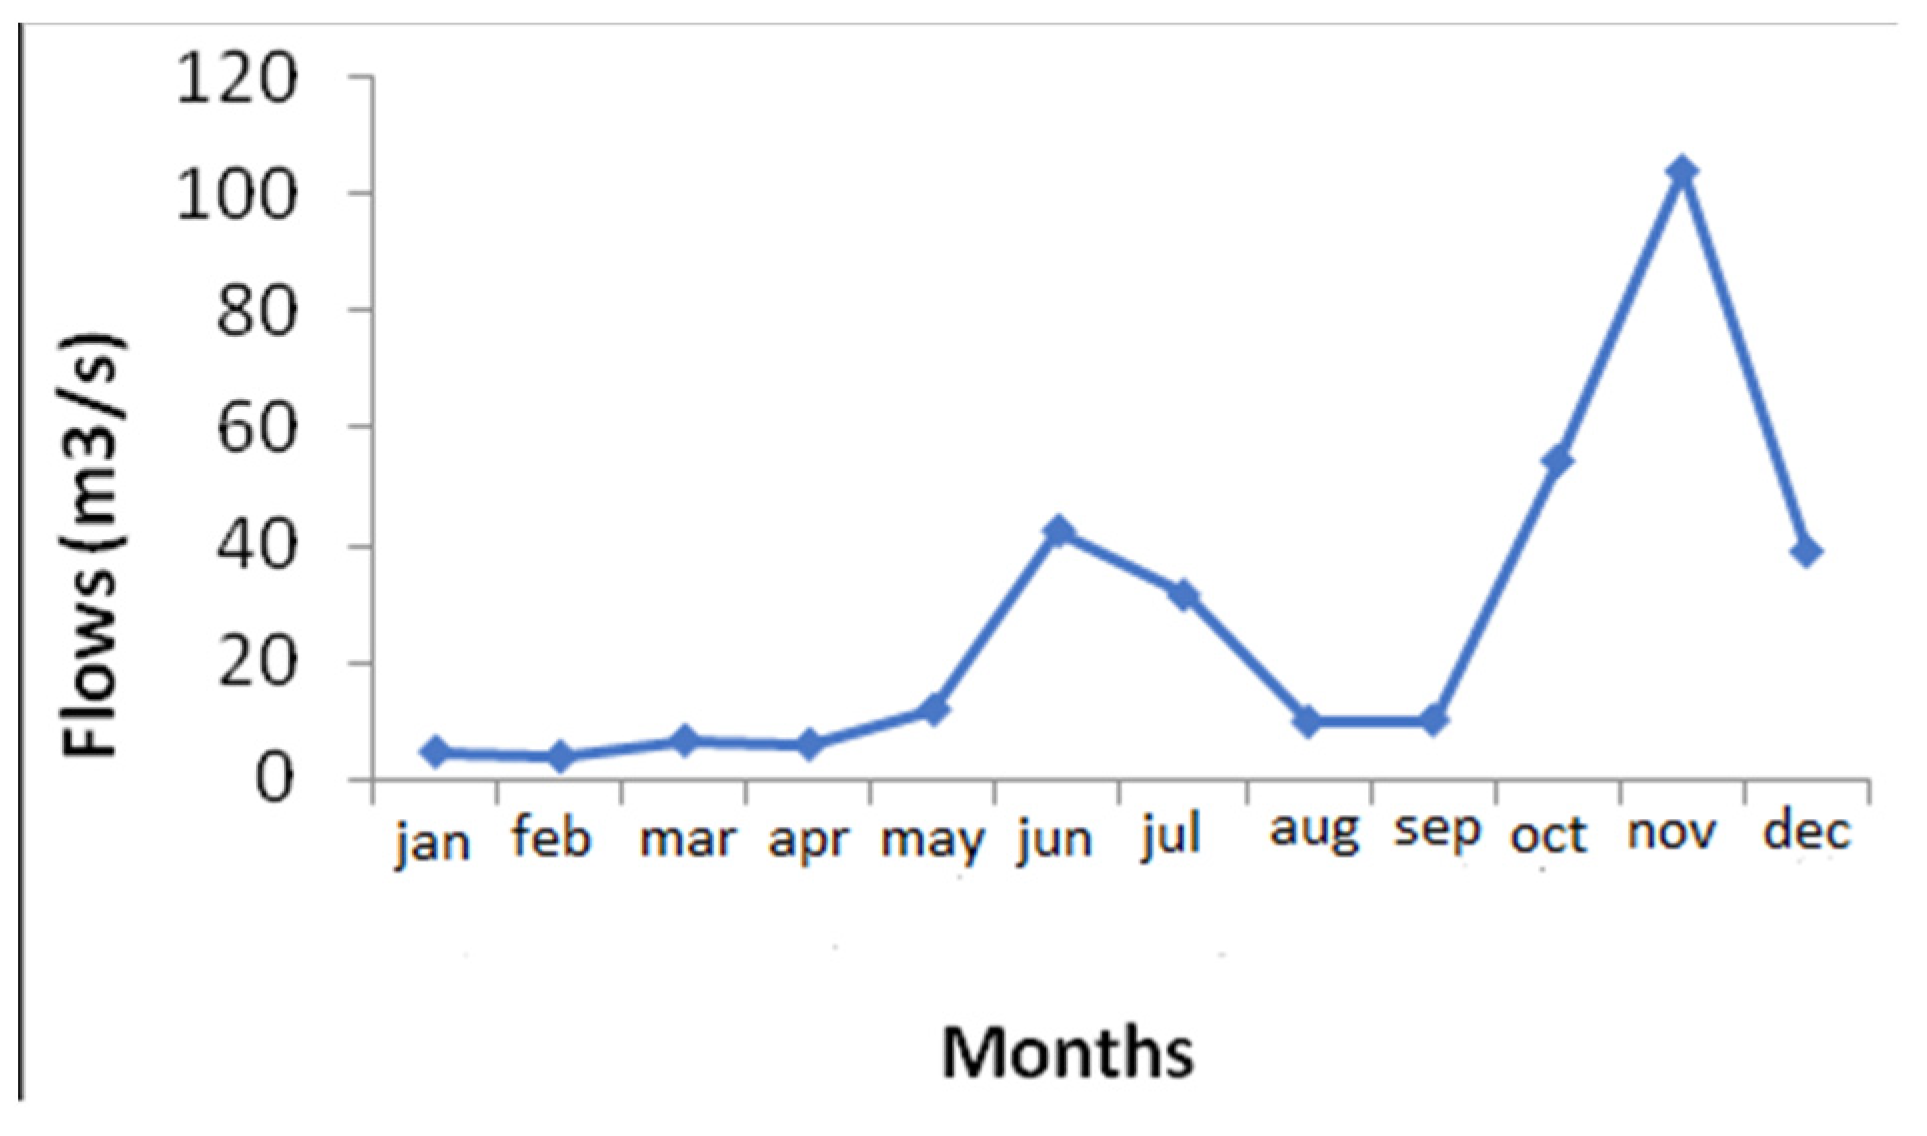
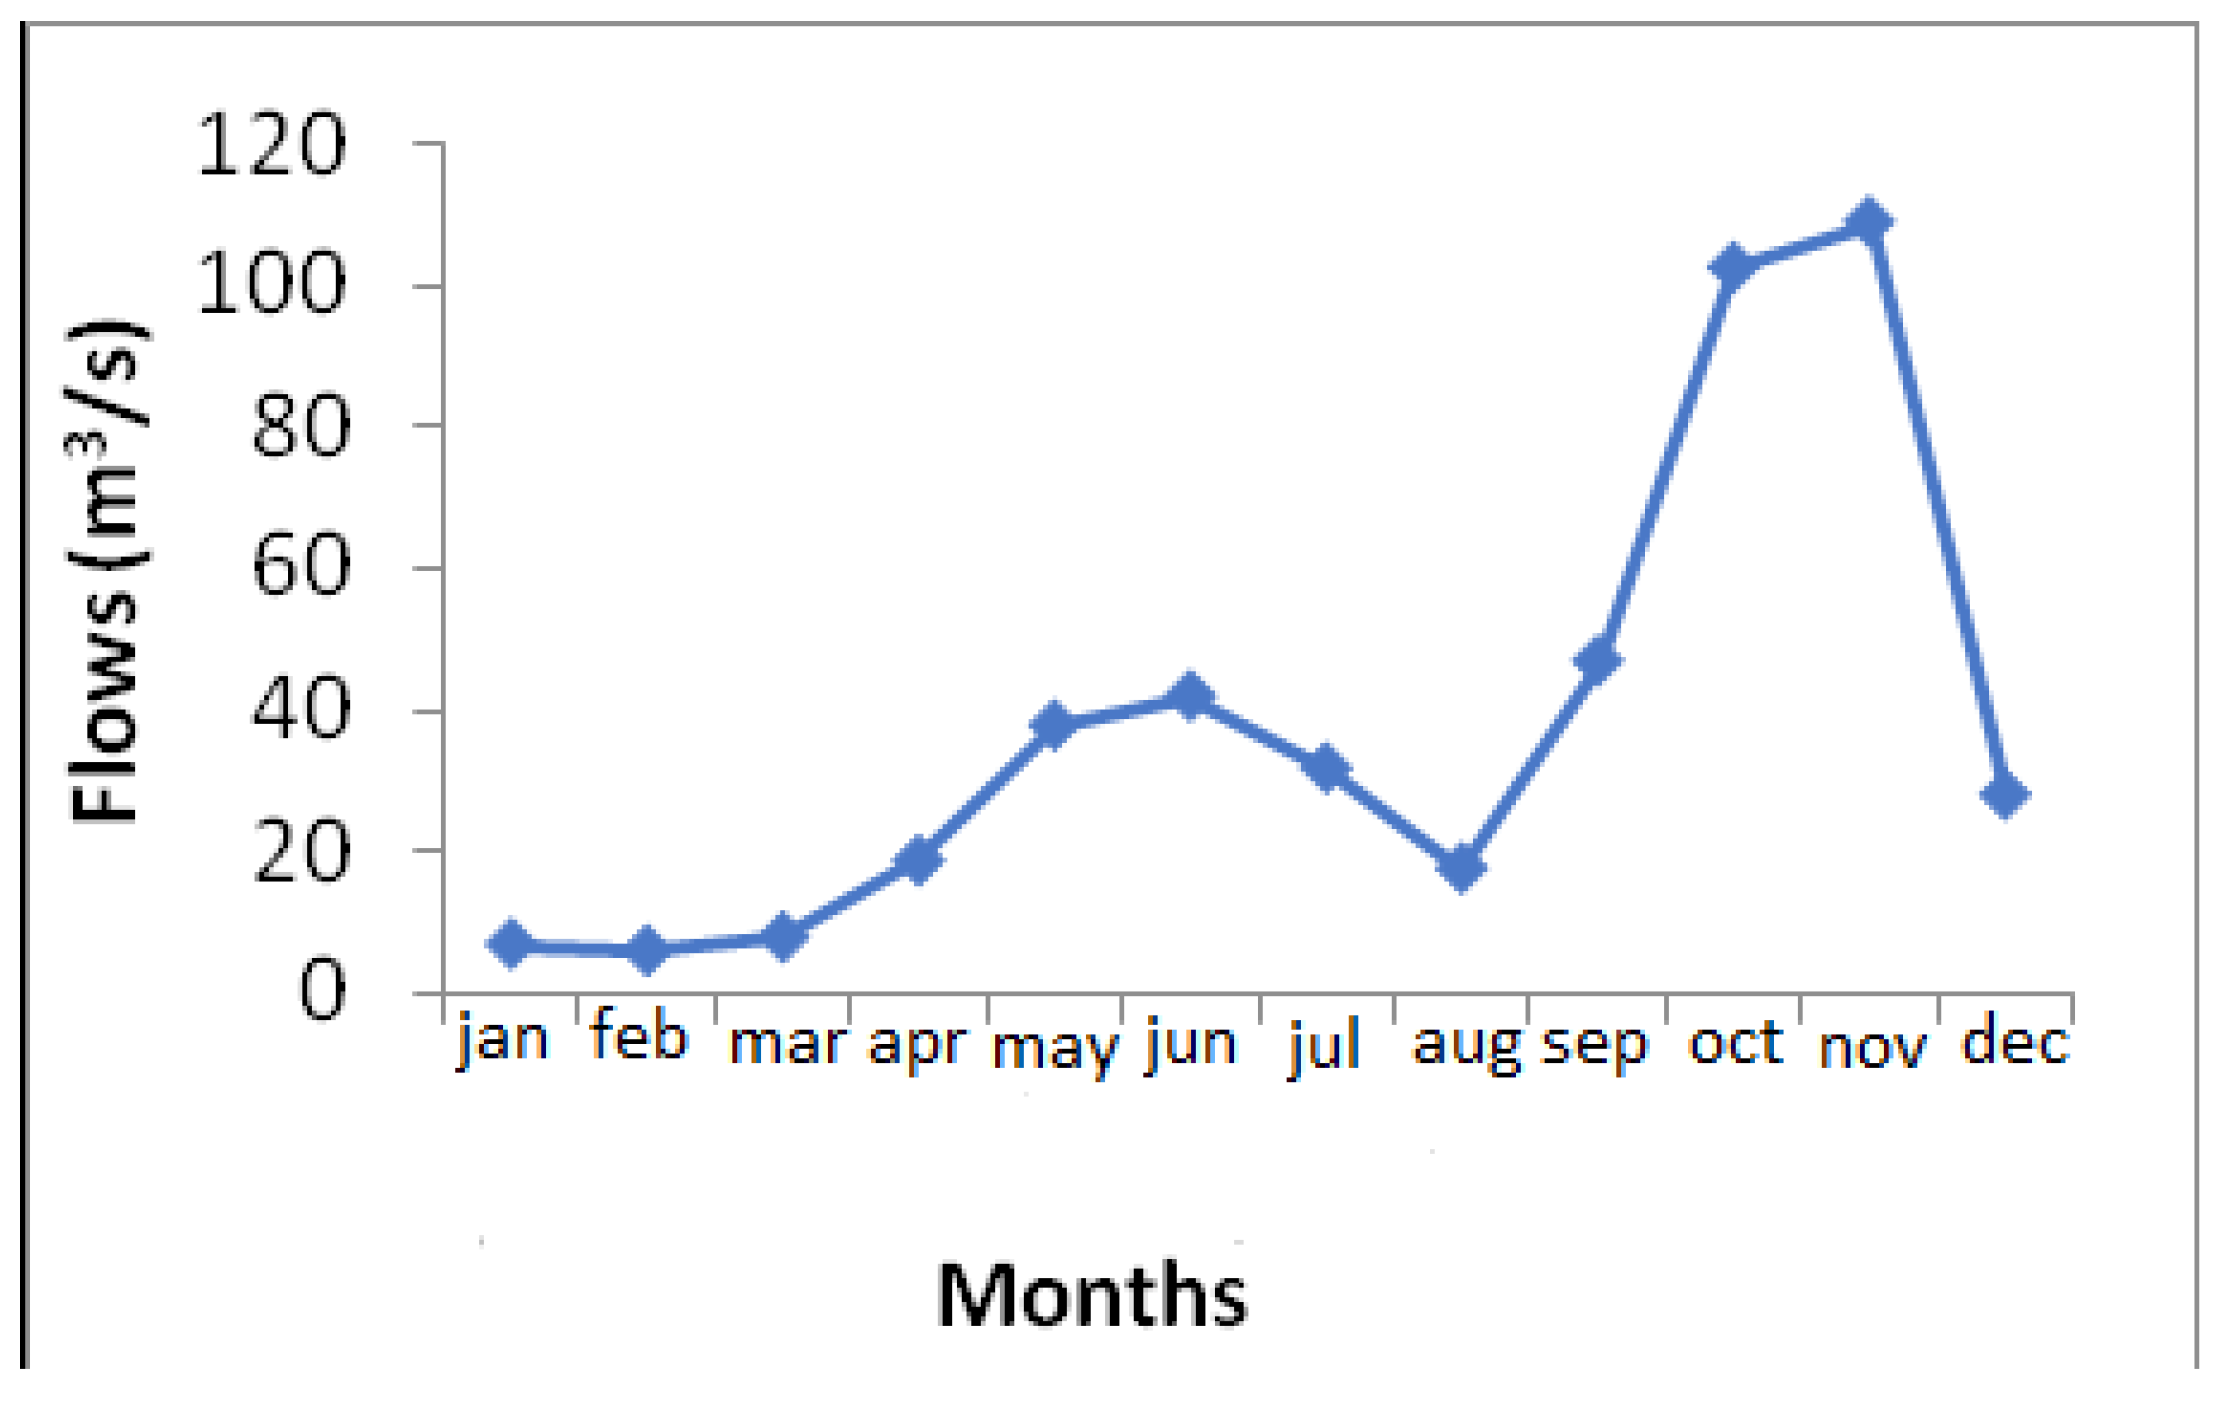
On the So’o River (Cameroon), the average annual flow registered in 2010 was 27 m3/s with a specific flow of 8.7l/km2 for a 247.7 mm water film. It corresponds to a dry year because it is lower than the average annual module, which is 37.86 ± 12 m/s (specific water flow of 121l/s/km2 and a water film of 428.2 mm) for the observation period between 1998 and 2010 (13 years). The monthly module for the year 2010 shows a minimum in January and February, while a maximum is observed in October and November. The curves obtained for monthly flows have a bimodal form “like a camel’s back,” representative of a transitional equatorial regime (Figure 17 and Figure 18). They exhibit two maxima, a lower one between May and June and a higher one between October and November. The climatic disturbances negatively impact the socioeconomic activities of the region. This is especially the case for agriculture, fishing, and harvesting, which depend on the rainfall regimes.
3.2. Impacts of Hydroclimatic Variability on Rural Livelihoods in the Congo Basin
3.2.1. Farmer Perceptions on Variation and Changes
In the Mpoko watershed (CAR), farmers have an anthropological interpretation of the variability of water. This sometimes has a negative impact on vulnerable groups such as women and elders. In the So’o watershed (Cameroon), farmers attribute water decline to the wrath of the gods and to curses.
3.2.2. Impact on Agricultural Sector
In the Mpoko watershed (CAR), the start of the rainy season was marked by disturbances. Generally, the rainy season south of the Mpoko watershed starts in the month of March, though at times the rains may start earlier (end of February). This was the case, for example, in 1993, 1999, 2006, and 2009. In 1990 and 2007, however, rains started late—at the end of March. Early rains create three problems for the local population. First, some agricultural land was not completely burned during December of January or even burned at all because of the early rains in February. Second, many farmers, especially those who start new farms in the forest, may have abandoned agricultural land that has not yet been burned. Those who only cleared parcels of land for shifting cultivation become obliged to plant crops that do not require total clearing of the farm (maize, cocoyam, and banana/plantain). On the other hand, the early rains force farmers who were ready to plant to do so prematurely. This leads to the killing or withering of young plants. In 2002, 2004, and 2009, some farmers were obliged to plant after the arrival of premature rains. Finally, farmers who typically plant around the normal start of the rains end up planting late. The unusual start of the rains often leads to poor harvests in the Mpoko River watershed.
In the So’o watershed (Cameroon), most rural activities are linked to the climate; people depend on the forest and other natural elements such as streams. However, in recent decades, the watershed has recorded climatic disturbances linked to the start of the rains and even the quantity that falls (See Table 1 for some majors problems in the watershed). Consequently, the forest has been considerably degraded. This, in turn, has led to a decrease in supply, a slowdown of agricultural activities, and reduced aquatic biodiversity, especially aquatic species (freshwater fish). About 75% of people in the study sites are affected by the decrease in precipitation, which dries up some streams and raises temperatures.
In the Masako watershed (DRC), 16% of farmers confirmed that the long dry season leads to less agricultural, aquatic, and forest production (snails, caterpillars, mushrooms, wild fruits, etc.). Changing weather patterns also make it difficult to follow the traditional agricultural calendar. Further, it encourages the proliferation of edible insects or migratory crickets, which thrive on high temperatures. The drop in production also results from the decrease in agricultural species, which does not adapt to higher temperatures and the long dry season. In all, 51.7% confirmed a decrease in crab production, and 16.7% mentioned the decrease in prawn production. This decrease is due to two factors. First, extreme low water/stream levels due to climate change lead to the complete drying up of some rivers. Second, many aquatic species cannot multiply or reproduce as easily with higher temperatures.
3.2.3. Impact on the Availability of Non-Timber Forest Products
In the Mpoko watershed (CAR), changing patterns of precipitation have serious consequences on the reproduction of insects. The early start of the rainy season creates several problems. All edible caterpillar species (including Imbrasiaoyemersis, pseudantherediscrepans, Imbrasiatrunctata, imbrasiaepinethea, Anaphevenata, cymothecaemis) now appear early (May). In the past, different species emerged one after the other (the Attacicae family first, followed by Nimphalioae and Nymphalidae). The early arrival of caterpillars means that they are smaller (with less fat) and fewer in number. Their life cycle also finishes more quickly. In 2009, for example, caterpillars appeared in May rather than June. In that year, each household picked an average of 20 kg compared to an average of 145 kg/year in a “good year.” This represents a deficit of 86.20%, indicating a loss of 83.44% in edible caterpillars (data not shown).
The average quantity of edible mushrooms also dropped in 2009—from 85 kg to 10 kg per household. This was a decrease of 88.23% in quantity collected, and represented a drop in household budgets of 88.23%. Fishers in Mpoko (CAR) have also complained that their production has dropped drastically. For good fishing in the dry season, the rainy season needs river/water overflow that will push fish and other aquatic species into the main river channels. The low water levels in the river tend to trap the fish, which makes them easy to catch. In recent years, they have not experienced “koungbingotigou” (which means the stream overflow that covers the main river channel). Consequently, production has dropped. Fishers also noted the disappearance of some streams in almost all the villages studied, which also helps explain the drop in aquatic species.
In the Massako watershed (DRC), 43.3% of our findings confirm a decrease in quality of caterpillars, 25% confirm a decrease in mushroom production, 25.3% reveal decreased snail production, and 6.7% confirm a reduction in the quantity of wild fruits, while 4.1% recorded no change. These reductions are explained by the loss of humidity as a result of deforestation. Felling of trees for slash-and-burn agriculture or for charcoal production reduces caterpillar production. This, in turn, leads to changing weather patterns whereby butterflies do not reproduce in the rainy season. The same is true for the production of mushrooms, whose growth is suitable under a humid/wet microclimate and under vegetation cover. The production of snails is also reduced due to lack of humidity, which fosters their reproduction. The production of non-timber forest products (NTFPs), which generate income, has become rare in the area of study, weakening food security.
3.2.4. Water Availability and Quality
In the Masako watershed (DRC), the results of bacteriologic analyses (data not shown) reveal that the average probable number of fecal coliforms is 131.2, at an average temperature of 22.7 °C for springs protected by the forest. Water or springs from unprotected forest, which receive direct sunlight, have an average temperature of 25.06 °C, and an average probable number of 607.2 fecal coliforms. This occurs because the fecal coliforms are bacteria that prefer higher temperature. In other words, fecal coliforms multiply faster as temperatures rise. On the other hand, analyses show that the average probable number of fecal streptococci is 75.5, with an average temperature of 22.7 °C. For springs protected by the forest with a temperature of 25.06 °C, the probable number is 109.7. This reveals that fecal streptococci, which incubate at 37 °C, also prefer higher temperatures but not as coliforms whose incubation is carried out at 44 °C.
According to World Health Organization standards for drinking/potable water, all springs protected by forest are of average quality. Of the three springs not protected by the forest, two are of poor quality and one is suspected to be of poor quality. These analyses attest to the negative impact of increased temperatures coupled with deforestation on the quality and availability of water in the forest of the Congo Basin.
The population is aware that water quality depends on forest cover, but good quality water has become unattainable in villages within the forest landscape. Investigations or findings around homes reveal that the quality of springs from areas not protected by the forest is similar to those in inhabited areas (about 80 m from households). These springs are often abandoned due to forest degradation, because some people prefer to develop farms behind households, right up to the point where springs occur. Springs protected by forest cover most often have an average distance from households of 238.4 m with a maximum distance of 690 m. Women and children cover long distances in bushes carrying water containers of more than 20 kg. They do so more than twice daily to gather drinking water.
4. Discussion
4.1. Interannual Evolution of Rainfall and Surface Flows (Runoff) in the Studied Sites
The analyses of rainfall data in the three study sites reveal a more interannual variability, and drying out. Annual rainfall indices are thus decreasing. One IPCC (Intergovernmental Panel on Climate Change) study [17] had already noted decreased tropical rainfall in Africa. Other studies [45] have noted a decrease in annual precipitation of 2.9 mm/month between 1960 and 2003. By the 2090s, precipitation is projected to be reduced −12 to +20 mm per month (−8 to + 17%). In this study, evidence from the three study sites shows changing rainfall patterns that manifest in unpredictable starts to the rains, a prolonged dry season and some periods of dryness during the rainy season. The interannual variability is thus coupled with a long-term trend in lower precipitation. This is also experienced in the lowering/dryness of surface water levels and the disappearance of springs, streams, and wetlands. Other studies have linked the flow of the Sanaga River to both rainfall and regulation of groundwater [46].
Thermal data in the study sites show increases in the Mpoko and So’o basins, as well as in the Masako community. The consequences of these climatic hazards, in this study, are almost the same in each region because of their socioeconomic, cultural, and physical homogeneity. The question of climate variability in tropical Africa has been at the center of many studies. This variability ranges from humid/wet conditions in the 1940s, 1950s, and 1960s to the drier conditions of the 1970s and 1990s. If few researchers have been interested in the relation between climatic variability and rural activities, others [18,19,20,22,47] have studied how climatic variability interacts with the rhythm of surface flows or runoffs. As a result, researchers observed the decline in rainfall as a consequence of less surface runoff during the 1970s [19,20,21,22,23,24,25,26,27,28,29,30,31,32,33,34,35,36,37] in Central and West African stations. On the other hand, the variation coefficient oscillates between 14% and 15%. This is in line with other results [44], in which Central African countries have less variability (10–20% for the Congo Republic and 14–30% for Gabon).
Based on parameters that control all the physiologic processes in insects, plants, fish, and other marine species, temperature trends in the study sites match those of another study [27] in the Congo Republic. The slopes found by this author (0.69–0.76 °C) while studying the evolution of the temperature are within the range observed at the global level, which is 0.7 °C [0.56–0.92 °C] [48]. As in Central Africa, rainfall has also declined in the Congo Basin region. These periods of less rain result in lower surface and groundwater flows. Thus, the study watersheds generate less water during periods of low rains.
4.2. Impact of Water Cycle Modification on Rural Population
One of the important aspects of this study is the impact of water cycle modification on livelihoods in the three sites. Livelihoods depend generally on several forest-related sectors such as food security, energy, and health [33,49]. Water is linked to these livelihoods via the biodiversity of the stream [50,51,52] or via activities that have water in their value chain. Water is linked in one way or another to these sectors (food security, energy, and health). This highlights the importance of a multisectoral approach in adaptation to climate change at the watershed level. It was evident that drinking water, agriculture, and NTFPs were affected by the modification of the hydrological cycle. As a general trend, the water cycle varies and there is less rainfall in the three sites.
Streams under forest were providing cleaner water than streams not covered by forests, highlighting the role of vegetation/forest in watersheds. In terms of infrastructure, countries in the region did not invest enough in drinking water, irrigation, and hydropower systems. According to AQUASTAT—FAO’s Global Information System on Water and Agriculture in 2011, Cameroon and the DRC have 10 and 15 dams, respectively [53]. In Cameroon, these dams were mainly constructed around the 70th and 80th, while those in the DRC were constructed around the 50th and 80th. Few studies had identified the impact of dams on rural livelihoods, despite the evidence of less discharge from the Congo River [54]. In 2008, 54% of populations of Central Africa had access to water against 52%, 87%, 70%, and 64% in the East, North, South, and West of Africa, respectively [55]. In Cameroon, the CAR, and the DRC, 74%, 67%, and 46% of the population have access to drinking water, respectively [55]. The populations of the region have water, but no access to good quality water. It is thus not surprising to see the prevalence of some waterborne diseases such as cholera and diarrhea. The occurrence of these diseases is also associated with climate variability.
Lack of development infrastructure renders the population vulnerable. This vulnerability will increase with less rain in the three sites resulting from climate change. Previous studies in a country such as the Philippines showed how climate change affects livelihoods. One [56] identified that lowlands, farms, grasslands, and natural forest were the most vulnerable forest ecosystems. Other studies, such as one in Ghana [57], show that responses to water scarcity need to anticipate rather than react. Such approaches in the water sector [58] must be closely linked with the livelihood activities of rural communities. The Congo Basin needs an intersectoral strategy that ensures that available water is rich in quality and sufficient in quantity.
The study highlights the general links between forest and water. In Central Africa, the livelihood of farmers is linked both to forest resources and water [14]. Water modification will affect forest and vice versa. Thus, the livelihood of rural communities cannot be dissociated from forest, water, and the linkage between the two. This has become important with climate change. The Central African Forest Commission (COMIFAC) already encourages sustainable management of forest in the region. COMIFAC works within the framework of REDD+ (Reduced Emissions from Deforestation and Forest Degradation and conservation, sustainable management of forests, and enhancement of forest carbon stocks in developing countries). REDD+, for its part, is defined within the United Nations Framework Convention on Climate Change. Many responses to climate change proposed by REDD+ relate to farmers’ livelihoods, including agriculture.
La Commission Internationale du Bassin Congo-Oubangui-Sangha (CICOS) is still at the beginning of strengthening navigation in the water network. With the livelihood of the population connected to both water and forest, COMIFAC and CICOS need to work together both institutionally and technically. Transboundary issues in the water sector need to be part of adaptation strategies [58]. This is particularly important when water is used not only for inland transportation, but also for producing hydro energy.
Responses to the threat faced by people include a broader set of initiatives—from local watersheds to the regional level. Trans-watershed management such as the transfer of the Congo Basin to Lake Chad needs to be part of the collaboration between COMIFAC and CICOS. Few multidisciplinary studies have been carried out on the effectiveness of this trans/watershed management. Such studies are needed to fuel the science policy dialogue in such important regional issues. The Congo Basin Forest [59] needs to consider water as part of its sustainable forest management plan. Similarly, managing the water cycle of the Congo Basin needs to consider forest management. Given the challenges associated with climate change, the linkage needs to be at the center of sustainable approaches in Central Africa. CICOS has already taken important steps in this process. Our study of three sites needs to be complemented by detailed studies on how climate factors link with water and forest. They should begin by obtaining the past and future trends of biophysical information using appropriate methods (for example, see [60]). With these data in hand, studies should then link findings with rural livelihoods, which depend heavily on natural resources in the Congo Basin.
Biomass carbon stock in forest landscapes and watersheds of the Congo Basin are being maintained and improved [61]. The recent discoveries of peatland in Cuvette Centrale (in the transboundary area between DRC and Congo) with his richness in carbon stock are added on the ecological importance of the Congo Basin [62,63]. The existence of this swamp forests increases the importance of Congo Basin forest in global climate change mitigation responses. Failure to improve the resilience of farmers, however, may pose more risk to deforestation and forest degradation. The main findings of this study and previous ones [64] highlight the vulnerability of smallholders who depend on natural resources. There is a clear need to search for synergy between mitigation and adaptation when working on forest landscapes and watersheds in the Congo Basin. Responses such as climate-smart agriculture (CSA) and the water, energy and food security (WEF) nexus can feed into the integrated approach needed in the basin.
5. Conclusions
This study investigated the evolution of rainfall and water flow in the Mpoko (CAR) and So’o (Cameroon) watersheds. It also analyzed water quality in relation to climatic variability in the community of Masako on the outskirts of Kisangani (DRC). The study aimed at understanding the implication of this hydroclimatic variability on water resources in the rural communities.
The variability and disturbance of the rainfall regime recorded in the Congo Basin is affecting water flow. This is a limiting factor for the survival of poor communities whose activities are based on rainfall. In the three sites/watershed studied, temperature is rising, rainfall is declining, water flow is disturbed, and the livelihoods of rural communities are affected.
Forest and water sectors in the region play important roles for rural livelihoods and need to be studied simultaneously at the local, national, and regional levels. Further studies are needed on rainfall, hydrological trends in the entire basin, and their linkage with livelihoods. Environmental and economic development of the region cannot be conceived and implemented sustainably without considering water and its linkages with other prioritized forest-related sectors.
Author Contributions
D.S. conceptualized and supervised the study for the entire basin; M.O.F., G.M., and F.L.F. collected data; All authors have read and agreed to the published version of the manuscript.
Funding
This research was funded by IDRC Grant No: GF/DR/07/304/mjd and NORAD Grant agreement code No: NOR114.
Acknowledgments
The study was financed by the International Development Research Centre (Canada) and the Department for International Development (UK) and piloted by the Center for International Forestry Research/Cameroon via the Congo Basin Forests and Climate Change Adaptation (Cofcca) project. Final editing and publication were supported by the GCS-REDD+ project funded by the Norwegian Agency for Development Cooperation (NORAD). Hydropluviometric and impact data were obtained from the local population through the assistance of various village heads and competent services. We also thank the meteorological services that provided data used in this study. This work is part of the CGIAR Research Program on Forests, Trees and Agroforestry (CRP-FTA).
Conflicts of Interest
The authors declare no conflict of interest.
References
- Andréassian, V. Waters and forests: From historical controversy to scientific debate. J. Hydrol. 2004, 29, 1–27. [Google Scholar] [CrossRef]
- Vörösmarty, C.J.; Lévêque, C.; Revenga, C. Chapter 7—Fresh Water. In Ecosystems and Human Well-Being. (1) Current State and Trends; Hassan, R., Scholes, R., Ash, N., Eds.; Millennium Ecosystem Assessment; Island Press: Washington, DC, USA, 2006; pp. 165–207. [Google Scholar]
- Hamilton, L.S. Forests and Water: A Thematic Study Prepared in the Framework of the Global Forest Resources Assessment 2005; Forestry Paper No. 155; Food and Agriculture Organization of the United Nations: Rome, Italy, 2008. [Google Scholar]
- MEA. Ecosystems and Human Well-Being: Synthesis; Island Press: Washington, DC, USA, 2005. [Google Scholar]
- Bonell, M.; Bruijnzeel, L.A. (Eds.) Forests, Water and People in the Humid Tropics; Cambridge University Press: Cambridge, UK, 2005. [Google Scholar]
- FAO. Sustainable Use and Management of Freshwater Resources: The Role of Forests. In State of the World’s Forests; Food and Agriculture Organization of the United Nations: Rome, Italy, 2003. [Google Scholar]
- FAO. The New Generation of Watershed Management PROGRAMMES and Projects. A Resource Book for Practitioners and Local Decision-Makers Based on the Findings and Recommendations of an FAO Review; FAO Forestry Paper No. 150; Food and Agriculture Organization of the United Nations: Rome, Italy, 2006. [Google Scholar]
- FAO; CIFOR. Forests and Floods: Drowning in Fiction or THRIVING on Facts? RAP Publication No. 2005/03, Forest Perspectives No. 2. Bangkok; Food and Agriculture Organization of the United Nations: Rome, Italy; Center for International Forestry Research: Bogor Barat, Indonesia, 2005. [Google Scholar]
- Imbach, P.; Molina, L.; Locatelli, B.; Roupsard, O.; Ciais, P.; Corrales, L.; Mahé, G. Climatology-based regional modeling of potential vegetation and average annual long-term runoff for Mesoamerica. Hydrol. Earth Syst. Sci. 2010, 14, 1801–1817. [Google Scholar] [CrossRef]
- Locatelli, B.; Imbach, P.; Vignola, R.; Metzger, M.J.; Leguíua Hidalgo, E.J. Ecosystem services and hydroelectricity in Central America: Modeling service flows with fuzzy logic and expert knowledge. Reg Environ. Change 2011, 11, 393–404. [Google Scholar] [CrossRef] [Green Version]
- ACPC. Climate Change and Water in Africa: Analysis of Knowledge Gaps and Needs; Working Paper No. 4.; United Nations Economic Commission for Africa: Addis Ababa, Ethiopia, 2011. [Google Scholar]
- Brooks, E.G.E.; Allen, D.J.; Darwall, W.R.T. (Eds.) The Status and Distribution of Freshwater Biodiversity in Central Africa; International Union for Conservation of Nature: Cambridge, UK; Gland, Switzerland, 2011. [Google Scholar]
- Wohl, E.E. Hydrology and Discharge. In Large Rivers: Geomorphology and Management; Gupta, A., Ed.; Wiley: Chichester, UK, 2007; pp. 29–44. [Google Scholar]
- Brummett, R.; Tanania, C.; Pandi, A.; Ladel, J.; Munzini, Y.; Russell, A.; Stiassny, M.; Thieme, M.; White, S.; Davies, D. Ressources en Eau et Biens et Services liés à l’écosystème Forestier. In Les forêts du Bassin du Congo. Etat des Forêts 2008; Wasseige, C., Devers, D., de Marcen, P., Eba’aAtyi, R., Nasi, R., Mayaux, P.H., Eds.; Office des Publications de l’Union Européenne: Brussels, Belgium, 2009; pp. 145–161. [Google Scholar]
- MacDonald, A.M.; Calow, R.C.; Macdonald, D.M.; Darling, W.G.; O Dochartaigh, B.E. What impact will climate change have on rural groundwater supplies in Africa? Hydrol. Sci. 2009, 544, 690–703. [Google Scholar] [CrossRef] [Green Version]
- De Wasseige, C.; Devers, D.; De Marcken, P.; Eba’aAtyi, R.; Nasi, R.; Mayaux, P. (Eds.) Les Forêts du Bassin du Congo—Etat des Forêts 2008; Office des Publications de l’Union Européenne: Luxembourg, 2009. [Google Scholar]
- Boko, M.; Niang, I.; Nyong, A.; Vogel, A.; Andrew, G.; Medany, M.; Osman-Elasha, B.; Tabo, R.; Yanda, P.Z. Africa Contribution of Working Group II to the fourth assessment report of the Intergovernmental Panel on Climate Change. In Climate Change 2007: Impacts, Adaptation and Vulnerability; Parry, M.L., Canziani, O.F., Palutikof, J.P., Eds.; Cambridge University Press: Cambridge, UK, 2007. [Google Scholar]
- Hubert, R.; Carbonnel, J.P. Approche statistique de l’aridification de l’Afrique de L’Ouest. J. Hydrol. 1987, 95, 165–183. [Google Scholar] [CrossRef]
- Mahé, G.; Olivry, J.C. Variations des précipitations et des écoulements en Afrique de l’Ouest et Centrale de 1951 à 1989. Sécheresse 1995, 1, 109–117. [Google Scholar]
- Orange, D.; Feizoure, C.; Wesselink, A.; Callede, J. Variabilité hydrologiques de l’Oubangui à Bangui au cours du XXe siècle. In Proc. Actes des Journées Scientifiques FRIEND-AOC; Laboratoire d’Hydrologie, UR 22, ORSTOM, Montpellier: Cotonou, Bénin, 1995. [Google Scholar]
- Laraque, A.; Mahé, G.; Orange, D.; Marieu, B. Spatiotemporal variations in hydrological regimes within Central Africa during the XXth century. J. Hydrol. 2001, 245, 104–117. [Google Scholar] [CrossRef]
- Nguimalet, C.-R. Le Cycle et la Gestion de l’eau à Bangui (République Centrafricaine). Approche Hydrogéomorphologique du Site d’une Capitale Africaine. Ph.D. Thesis, Géographie, Urbanisme et Aménagement, Université Lumière Lyon 2, Lyon, France, 2004. [Google Scholar]
- SighaNkamdjou, L. Fonctionnement Hydrochimique d’un écosystème Forestier de l’Afrique Centrale: La Ngoko à Mouloundou (Sud-Est du Cameroun). Ph.D. Thesis, Univ. Paris (Orsay), Paris, France, 1993. [Google Scholar]
- Censier, C. Les Pluies de Mangues à Bangui; OROSTOM: Paris, France, 1993. [Google Scholar]
- Feïzoure, C.T. Les Conséquences de la Variabilité Hydroclimatique sur l’érosion Dans le Bassin de l’Oubangui (République Centrafricaine); Mémoire de DEA; climat et contraintes climatiques; Université de Bourgogne: Dijon, France, 1994. [Google Scholar]
- Ndjendole, S. Contraintes Pluviométriques sur les Cultures Annuelles en Centrafrique: L’exemple de la Culture Cotonnière. Ph.D. Thesis, Univ. Géographie, Spécialité Climatologie, Université de Bourgogne, Dijon, France, 2001. [Google Scholar]
- Bouka Biona, C.; Marcel Mpounza, M. Impacts des Effets Actuels et Attendus du Changement Climatique en République du Congo; 1 Laboratoire de Physique de l’Atmosphère, Faculté des Sciences de l’Université Marien Ngouabi: Brazzaville, Republic of Congo, 2010. [Google Scholar]
- Binet, D.; Gobert, B.; Maloueki, L. El Nino-like warm events in the Eastern Atlantic (6°N, 20°S) and fish availability from Congo to Angola (1964–1999). Aquat. Living Resour. 2001, 14, 99–113. [Google Scholar] [CrossRef]
- Bele, M.Y.; Somorin, O.A.; Sonwa, D.J.; Nkem, J.N.; Locatelli, B. Forest and adaptation policies in Cameroon. Mitig. Adapt. Strat. Glob. Change 2010, 16, 369–385. [Google Scholar] [CrossRef] [Green Version]
- Brown, H.C.P.; Nkem, J.N.; Sonwa, D.J.; Bele, M.Y. Institutional adaptive capacity and climate change response in the Congo Basin forests of Cameroon. Mitig. Adapt. Strateg. Glob. Change 2010, 15, 263–282. [Google Scholar] [CrossRef] [Green Version]
- Sonwa, D.; Bele, Y.M.; Somorin, O.; Jum, C.; Nkem, J. Adaptation for forests and dependent communities in the Congo Basin: The CoFCCA experience. ETRFN News 2009, 50, 93–100. [Google Scholar]
- Sonwa, D.J.; Bele, Y.M.; Somorin, O.A.; Nkem, J.N. Central Africa is not only carbon stock: Preliminary efforts to promote adaptation to climate change for forest and communities in Congo Basin. Nat. Faune 2011, 25, 52–57. [Google Scholar]
- Sonwa, D.J.; Nkemn, J.; Idinoba, M.E.; Bele, Y.M.; Jum, C. Building regional priorities in forests for development and adaptation to climate change in the Congo Basin. Mitig. Adapt. Strat. Global Change 2012, 17, 441–450. [Google Scholar] [CrossRef]
- Acreman, M.C.; Dunbar, M.J. Defining environmental river flow requirements—A review. Hydrol. Earth Syst. Sci. 2004, 8, 861–876. [Google Scholar] [CrossRef]
- Kouakou, E.; Koné, B.; N’Go1, A.; Cissé, G.; Ifejikasperanza, C.; Savané, I. Ground water sensitivity to climate variability in the white Bandama basin, Ivory Coast. Springer Plus 2014, 3, 226. [Google Scholar] [CrossRef] [Green Version]
- Olivry, J.C. Fleuves et Rivières du Cameroun; Coll. Monographies Hydrologiques; MESRES-ORSTOM: Paris, France, 1986. [Google Scholar]
- Hubert, P.; Carbonnel, J.P.; Chaouche, A. Segmentation des séries hydrométéorologiques. Application à des séries de précipitations et de débits de l’Afrique de l’Ouest. J. Hydrol. 1989, 10, 349–367. [Google Scholar]
- Pettit, A.N. A non-parametric approach to the change point problem. Appl. Stat. 1979, 28, 126–230. [Google Scholar] [CrossRef]
- Lubes, H.; Massonm, J.M.; Servat, E.; Kouame, B.; Boyer, J.F. Caractérisation de Fluctuations Dans une Série Chronologique par Application de Tests Statistiques, Etude Bibliographique; Programme ICCARE Rapport No. 3.; ORSTOM: Montpellier, France, 1994. [Google Scholar]
- Hach Company. Hach Handbook of Water Analysis; Hach Company: Loveland, CO, USA, 2000. [Google Scholar]
- Rodier, J. Analyse de l’eau Naturelle, eau Résiduaire et eau de la Mer; Dunod: Paris, France, 1978. [Google Scholar]
- Tharme, R.E. A global perspective on environmental flow assessment: Emerging trends in the development and application of environmental flow methodologies for rivers. River Res. Applic. 2003, 19, 397–441. [Google Scholar] [CrossRef]
- Callède, J.; Arquisou, G. Données climatiques recueillies à la station bioclimatologique de Bangui pendant la période 1963–1971. Cahiers ORSTOM. Série Hydrologique 1972, 9, 3–26. [Google Scholar]
- Suchel, J.B. Les Climats du Cameroun. Ph.D. Thesis, Bordeaux Montaigne University, Pessac, France, 1988. [Google Scholar]
- Mcsweeney, C.; New, M.; Lizcano, G. UNDP Climate Change Country Profiles: Cameroon; School of Geography and Environment, University of Oxford: Oxford, UK, 2009; Available online: http://countryprofiles.geog.ox.ac.uk/UNDP_reports/Cameroon/Cameroon.lowres.report.pdf (accessed on 16 March 2020).
- Dzana, J.-G.; Ngoupayou, J.R.N.; Tchawa, P. The Sanaga discharge at the Edea Catchment outlet (Cameroon): An example of hydrologic responses of a tropical rain-fed river system to changes in precipitation and groundwater inputs and to flow regulation. River Res. Applic. 2011, 27, 754–771. [Google Scholar] [CrossRef]
- Assani, A.A.; Stichellout, E.; Roy, A.G.; Petit, F. Comparison of impacts of dams on the annual maximum flow characteristics in three regulated hydrologic regimes in Quebec (Canada). Hydrol. Process. 2006, 20, 3485–3501. [Google Scholar] [CrossRef]
- Molua, E.L. Turning up the heat on African agriculture: The impact of climate change on Cameroon’s agriculture. Afr. J. Agric. Resour. Econ. 2008, 2, 45–64. [Google Scholar]
- Lecerf, A.; Richardson, J.S. Biodiversity-ecosystem function research: Insights gained from streams. River Res. Applic 2009, 26, 45–54. [Google Scholar] [CrossRef]
- Welcomme, R.L. Relationships between fisheries and the integrity of river systems. Regul. Rivers: Res. Mgmt 1995, 11, 121–136. [Google Scholar] [CrossRef]
- Dudgeon, D.; Arthington, A.H.; Gessner, M.O.; Kawabata, Z.-I.; Knowler, D.J.; Lévêque, C.; Naiman, R.J.; Prieur-Richard, A.-H.; Soto, D.; Stiassny, M.L.J.; et al. Freshwater biodiversity: Importance, threats, status and conservation challenges. Biol. Rev. 2006, 81, 163–182. [Google Scholar] [CrossRef]
- Palmer, M.A.; Reidyliermann, C.A.; Nilsson, C.; Flörke, M.; Alcamo, J.; Sam Lake, P.; Bond, N. Climate change and the world’s river basins: Anticipating management options. Front. Ecol. Environ. 2008, 6, 81–89. [Google Scholar] [CrossRef] [Green Version]
- AQUASTAT—FAO’s Global Information System on Water and Agriculture. Available online: http://www.fao.org/aquastat/en/ (accessed on 16 March 2020).
- Lasco, R.D.; Cruz, R.V.O.; Pulhin, J.M.; Pulhin, F.B. Assessing Climate Change Impacts, Adaptation and Vulnerability: The Case of the Pantabangan-Carranglan Watershed; World Agroforestry Centre and College of Forestry and Natural Resources, University of the Philippines: Los Baños, Philippines, 2010. [Google Scholar]
- African Development Bank. AfDB Group Annual Report 2010; African Development Bank: Abidjan, Côte d’Ivoire, 2011; Available online: https://www.afdb.org/fileadmin/uploads/afdb/Documents/Publications/Annual%20Report%202010%20EN.pdf (accessed on 16 March 2020).
- Gyampoh, B.A.; Idinoba, M.; Amisah, S. Water scarcity under a changing climate in Ghana: Options for livelihoods adaptation. Development 2008, 51, 415–417. [Google Scholar] [CrossRef]
- Elliot, M.; Armstrong, A.; Lobuglio, J.; Bartram, J. Technologies for Climate Change Adaptation—The Water Sector; De Lopez, T., Ed.; UNEP Risoe Centre: Roskilde, Denmark, 2011. [Google Scholar]
- Lebel, L.; Xu, J.; Bastakoti, R.C.; Lamba, A. Pursuits of adaptiveness in the shared rivers of Monsoon Asia. Int. Environ. Agreem. 2010, 10, 355–375. [Google Scholar] [CrossRef]
- Kamdem-Toham, A.; d’Amico, J.; Olson, D.M.; Blom, A.; Trowbridge, L.; Burgess, N.; Thieme, M.; Abell, R.; Carroll, R.W.; Gartlan, S.; et al. A Vision for Biodiversity Conservation in Central Africa: Biological Priorities for Conservation in the Guinean-Congolian Forest and Freshwater Region; WWF: Washington, DC, USA, 2006. [Google Scholar]
- Reid, M.A.; Ogden, R.W. Trend, variability or extreme event? The importance of long-term perspectives in river ecology. River Res. Applic. 2006, 22, 167–177. [Google Scholar] [CrossRef]
- Sonwa, D.J.; Walker, S.; Nasi, R.; Kanninen, M. Potential synergies of the main current forestry efforts and climate change mitigation in Central Africa. Sustain. Sci. 2011, 6, 59–67. [Google Scholar] [CrossRef]
- Dargie, G.C.; Lewis, S.L.; Lawson, I.T.; Mitchard, E.T.A.; Page, S.E.; Bocko, Y.E.; Ifo, S.A. Age, extent and carbon storage of the central Congo Basin peatland complex. Nature 2017, 542, 86–90. [Google Scholar] [CrossRef] [PubMed]
- Miles, L.; Ravilious, C.; García-Rangel, S.; de Lamo, X.; Dargie, G.; Lewis, S. Carbon, Biodiversity and Land-Use in the Central Congo Basinpeatlands. 2017. Available online: https://wedocs.unep.org/bitstream/handle/20.500.11822/22918/Congo_Peatland_FR.pdf?sequence=2 (accessed on 16 March 2020).
- Sonwa, D.J. Forest and Climate Change Response in Africa. In Proceedings of the ASC—TUFS ‘Kick-off’ Symposium, Tokyo University of Foreign Studies, African Studies Center—Tokyo University of Foreign Studies (ASC—TUFS), Tokyo, Japan, 3 November 2017; Kirikoshi, H., Matsunami, Y., Takeuchi, S., Midorikawa, N., Eds.; Frontiers of African Studies: Tokyo, Japan, 2018; pp. 71–82. [Google Scholar]
Figure 1.
The Mpoko watershed in CAR.

Figure 2.
The So’o watershed in Cameroon.

Figure 3.
The Masako Watershed (Democratic republic of Congo: DRC).

Figure 4.
Evolution of the average annual temperature at the Bangui Mpoko station.

Figure 5.
Annual temperatures of the So’o station (1980–2010).

Figure 6.
Average annual average temperature curve of Kisangani and its hinterlands (1971–2008).

Figure 7.
Bangui-Mpoko: Interannual evolution of rainfall with reduced centred indices of heights of annual rainfall (a) and total weighted rainfall value (b).
Figure 7.
Bangui-Mpoko: Interannual evolution of rainfall with reduced centred indices of heights of annual rainfall (a) and total weighted rainfall value (b).

Figure 8.
Interannual evolution of rainfall of Bossembélé with reduced centred indices of heights of annual rainfall (a) and total weighted rainfall value (b).
Figure 8.
Interannual evolution of rainfall of Bossembélé with reduced centred indices of heights of annual rainfall (a) and total weighted rainfall value (b).


Figure 9.
Interannual evolution of rainfall of Bossangoa with reduced centred indices of heights of annual rainfall (a) and total weighted rainfall value (b).
Figure 9.
Interannual evolution of rainfall of Bossangoa with reduced centred indices of heights of annual rainfall (a) and total weighted rainfall value (b).


Figure 10.
Variation in the annual height of rainfall in Sangmelima (1931–2010).

Figure 11.
Variation in the annual height of rainfall in Ebolowa (1931–2010).

Figure 12.
Variation in the annual height of rainfall in So’o (1934–2010).

Figure 13.
Variation in the annual pluviometric index in the Sangmelima station (1934–2010).

Figure 14.
Average annual precipitation curve of Kisangani and its hinterlands (1971–2008).

Figure 15.
Variation of flows of the Mpoko at Bossélé Mbali with reduced indices (a) and weighted values (b).
Figure 15.
Variation of flows of the Mpoko at Bossélé Mbali with reduced indices (a) and weighted values (b).

Figure 16.
Monthly flows of hydrologic phases of Mpoko at Bossélé Mbali.

Figure 17.
Average monthly flow of the So’o River (1998–2010).

Figure 18.
Flows in the So’o River (2010).


Table 1.
Identification of major problems of the population and their adaptation strategies.
| Problems | Potential Solutions and Management |
|---|---|
| Deforestation | Afforestation |
| Drying up of drinking water points | Consumption of stream water Water economy Exodus for the search of water Construction of deep wells |
| Decrease in agricultural productivity | Rehabilitation of wetlands for agriculture Rural exodus in search of food Change of activities Cultivation in nurseries Use of organic fertilizers |
| Decrease in fishing | Practice of animal farming New methods of fishing |
| Loss in aquatic biodiversity (some species of fish) | Practice of aquaculture |
© 2020 by the authors. Licensee MDPI, Basel, Switzerland. This article is an open access article distributed under the terms and conditions of the Creative Commons Attribution (CC BY) license (http://creativecommons.org/licenses/by/4.0/).
Share and Cite
MDPI and ACS Style
Sonwa, D.J.; Oumarou Farikou, M.; Martial, G.; Félix, F.L. Living under a Fluctuating Climate and a Drying Congo Basin. Sustainability 2020, 12, 2936. https://0-doi-org.brum.beds.ac.uk/10.3390/su12072936
AMA Style
Sonwa DJ, Oumarou Farikou M, Martial G, Félix FL. Living under a Fluctuating Climate and a Drying Congo Basin. Sustainability. 2020; 12(7):2936. https://0-doi-org.brum.beds.ac.uk/10.3390/su12072936
Chicago/Turabian StyleSonwa, Denis Jean, Mfochivé Oumarou Farikou, Gapia Martial, and Fiyo Losembe Félix. 2020. "Living under a Fluctuating Climate and a Drying Congo Basin" Sustainability 12, no. 7: 2936. https://0-doi-org.brum.beds.ac.uk/10.3390/su12072936
Note that from the first issue of 2016, this journal uses article numbers instead of page numbers. See further details here.