Hybrid Genetic Algorithm-Based Approach for Estimating Flood Losses on Structures of Buildings


Faculty of Civil Engineering, Brno University of Technology, 602 00 Brno, Czech Republic
*
Author to whom correspondence should be addressed.
Sustainability 2020, 12(7), 3047; https://0-doi-org.brum.beds.ac.uk/10.3390/su12073047
Submission received: 17 March 2020
/
Revised: 8 April 2020
/
Accepted: 9 April 2020
/
Published: 10 April 2020
(This article belongs to the Special Issue Sustainability Issues in Civil Engineering and Management)
Abstract
:Occurrence of extreme natural events raises the need for a quick and accurate estimation of losses on the insured residential property in order to support timely recovery of the area. Although various models are now available to estimate the amount of loss on buildings, there is a lack of models providing a sufficient level of detail and accuracy that can be used for insurance purposes. In this study, a hybrid genetic algorithm-based model for flood loss estimation on the structures of buildings is presented. The proposed model combines the ordinary least squares method, a genetic algorithm, and the bill of costs method, which offers a good balance of maximum simplicity on the one hand and the accuracy of calculation on the other hand. The model considers the geometric characteristics (dimensions and shape) of rooms and is enabled to work with various types of materials and structures, as well as a variable depth of flooding. The results achieved show that in quick loss estimation, the model provides highly accurate results which meet the requirements for its use for the purposes of settlement of real insurance claims by insurance companies. The article outlines the potential automated connection of the model to insurance companies’ information system in order to create a simple building information model (BIM) of the insured property (building’s structures).
1. Introduction
The increasing frequency of extreme natural disasters has significantly affected social attitudes to natural hazards. In the case of floods, flood management and related areas have been improved considerably. This involves a reconsideration of the efficiency of flood protection systems [1], which can be viewed from social, environmental, and economic perspectives [2], observing trends in flood losses over time [3], estimation of flood losses [4], as well as financing thereof [5]. Despite the fact that the level of flood protection of buildings, infrastructure, and human lives has increased, the risk of major flooding events cannot be eliminated completely. In this regard, Jonkman notes that floods were the most frequently occurring natural disaster in the period from 1975 to 2001 [6].
In the case of major flooding events, property and the environment are affected to a large extent. This includes the flooding of residential buildings, damage to transport infrastructure, pollution of the environment, including sources of drinking water, shutdown of industrial facilities, etc. In the Czech Republic, one of the most extreme such events were the floods of 1997, which caused damage to approx. 29,000 buildings and 50 fatalities, necessitating the evacuation of 80,000 people; the flood destroyed 66 bridges and caused direct economic losses estimated at approx. EUR 2455 million [7,8]. As not all losses can be financed solely from the state budget or the owners’ own money, a considerable portion of property is insured. The extremely high number of insurance claims [9] appearing within a very short time period is closely related with the demand for a quick and accurate loss estimation enabling payment of insurance indemnity, facilitating timely building recovery. Timely recovery is crucial as a delayed start of work may lead to further physical and environmental damage.
The issue of quick early cost estimation in construction has been the subject of extensive research, including also flood loss estimation. Modern techniques which could speed up the process, such as remote sensing, are applicable only in certain situations (e.g., for estimation of flood losses to agricultural crops [10]), however, in the case of buildings, loss estimation requires detailed local investigation conducted separately for each particular structure. Due to this fact, the process is very time consuming as it requires measurements of the extent of damage and loss estimation conducted with the use of the bill of costs.
Accelerating the loss estimation process is often at the expense of its accuracy, as the amount of loss is dependent on many variables, mostly on flood parameters and parameters of the structure. For example, flash floods, spatial (type of area: rural, urban), temporal (e.g., duration), and hydrological parameters (basic catchment area) have been analyzed in [11]. In particular, researchers mostly focus on the depth of flooding (as applied e.g., in [12]); however, there are also other parameters affecting the amount of economic loss such as flow velocity, duration of inundation, sediment concentration, contamination of flood water [13,14], wind [15], type of soil, and land use [16,17].
The depth of flooding is a crucial parameter for flood loss estimation as shown by the assembly-based model component line item losses [18]. The higher the water column in the building, the more building structures are affected and require repairs (which results especially in higher material and labor costs). As ascertained by Merz et al., many influencing parameters are only rarely taken into account [13]. For example, authors in [19] neglected the velocity as they argue that construction typology and materials of buildings under consideration are less affected by this variable. In this context, the need for a proper selection of input parameters customized to the study area under consideration has to be highlighted [20].
From the perspective of loss on property, mutually dependent technical and economic parameters have to be considered as well. Such interactions exist in many areas, e.g., in relation to efficient use of energy systems [21], as well as in relation to flood loss estimation. For example, in [22], the presented vulnerability functions enable a differentiation of examined buildings with respect to the main structural (wall) material.
Estimation of loss is often made by using loss (or damage) curves, as applied in [12,20,23] or [24]. Flood damage–depth curves are the most common method applied as in almost all models, flood depth is considered as the determining factor for expected damage/loss on the property [25]. More specifically, loss to buildings is thus calculated by multiplying the average value of the building by the damage rate as a function of water depth [26]. For instance, Shan et al. [27] used the so-called stage–damage function for flood loss analysis, indicating the relationship of building loss rate and depth of flooding at an interval of 0.5 m. Authors in [28] claim that flood depth–economic loss curves of residential indoor property display S-shaped curves. However, the approach presented in [28] involves, apart from losses to structural parts, also losses to the equipment of the building such as a TV, refrigerator, and induction cooker. A more comprehensive approach to quantification of flood economic risk can be performed if also other parameters are processed (e.g., maximum velocity, extent of flooding, and housing type as proposed in [29]). In order to deal with the uncertainties related with flood damage modeling, sensitivity analysis was applied in [30].
It is obvious that the value of flood loss will be influenced by the affected building’s geometry. Previous studies have confirmed that the building’s geometry is related to numerous economic aspects, such as energy efficiency [31,32] and construction costs. The optimum shape of the building (walls, foundations) and the internal layout of the building were discussed in [33], with the objective of reducing construction costs. The authors then present the VOLM index (Volume Block Compactness Index). This index evaluates the shape of the building (taking into account the volume of the building and its surface area) and the authors report the effect of the VOLM index value on construction costs. This includes not only the volume of the building and its surface area, but generally the size, shape, and complexity of the whole structure [34]. As an example, they report that a 0.1% change in the VOLM index leads to a 6% increase in construction costs. It can therefore be expected that this aspect will also have a significant impact on the estimation of the amount of flood damage and should be appropriately reflected in the relevant methodologies/models.
Losses on the interior construction parts of individual residential buildings are distinctive in that they are dependent on the internal layout of the building, as well on its technical solution, i.e., also the materials used. Regarding the layout, previous investigations have demonstrated that the room area and shape have a significant impact on the amount of unit loss (i.e., financial amount of loss per 1 m2) [35]. This results from the varying magnitude of damage on horizontal and vertical surfaces in relation to the variable of flooding depth. In this respect, a model has been developed that takes building internal layout (i.e., shape and size) into account when estimating flood damage. The model proposed by Tuscher, Hanák, and Přibyl [36] predicts potential future flood damage using genetic algorithm tools; however, its 2018 version focuses solely on horizontal structures in the form of floor structures and vertical structures in the form of wall finishes without the choice of material variants. This basic model also ignores the economic impact of the flood on the openings in the building (doors, windows, etc.).
The estimation of flood losses to the building is still a highly topical issue. Despite the fact that a large number of papers have been published on this topic, the proposed methodologies are usually limited to some extent by neglecting certain influencing factors which might be significant for an accurate estimation of losses. This paper aims to propose a methodology that could serve as a quick and accurate tool for estimation of flood losses to the interior structures of individual residential buildings estimated for insurance purposes.
2. Data and Methods
This paper deals with extending the basic Tuscher–Hanák–Přibyl flood loss estimation model (THP model) [36] by including a monetary estimation of flood damage on the vertical structures in different material variants and on the openings, i.e., doors and windows. The basic THP model processes several technical and economic variables, determining the value of flood loss to non-bearing structures of the interior of a building. In particular, the basic model is based on the considerations of room size [m2] and size ratio (i.e., width-to-length ratio). These two variables, together with the depth of flooding [m], are modeled in order to infer a mathematical solution for a user-friendly, quick, and accurate unit loss estimation per 1 m2.
2.1. Data
Data used in this study can be distributed into four sets. Firstly, there are model rooms on which financial amounts of flood loss is estimated. In particular, the set of model rooms consists of 14 room size groups (RSG). For each RSG, specific side ratios (SR), i.e., width-to-length ratios, were simulated, whereby the SR value is calculated according to the following formula:
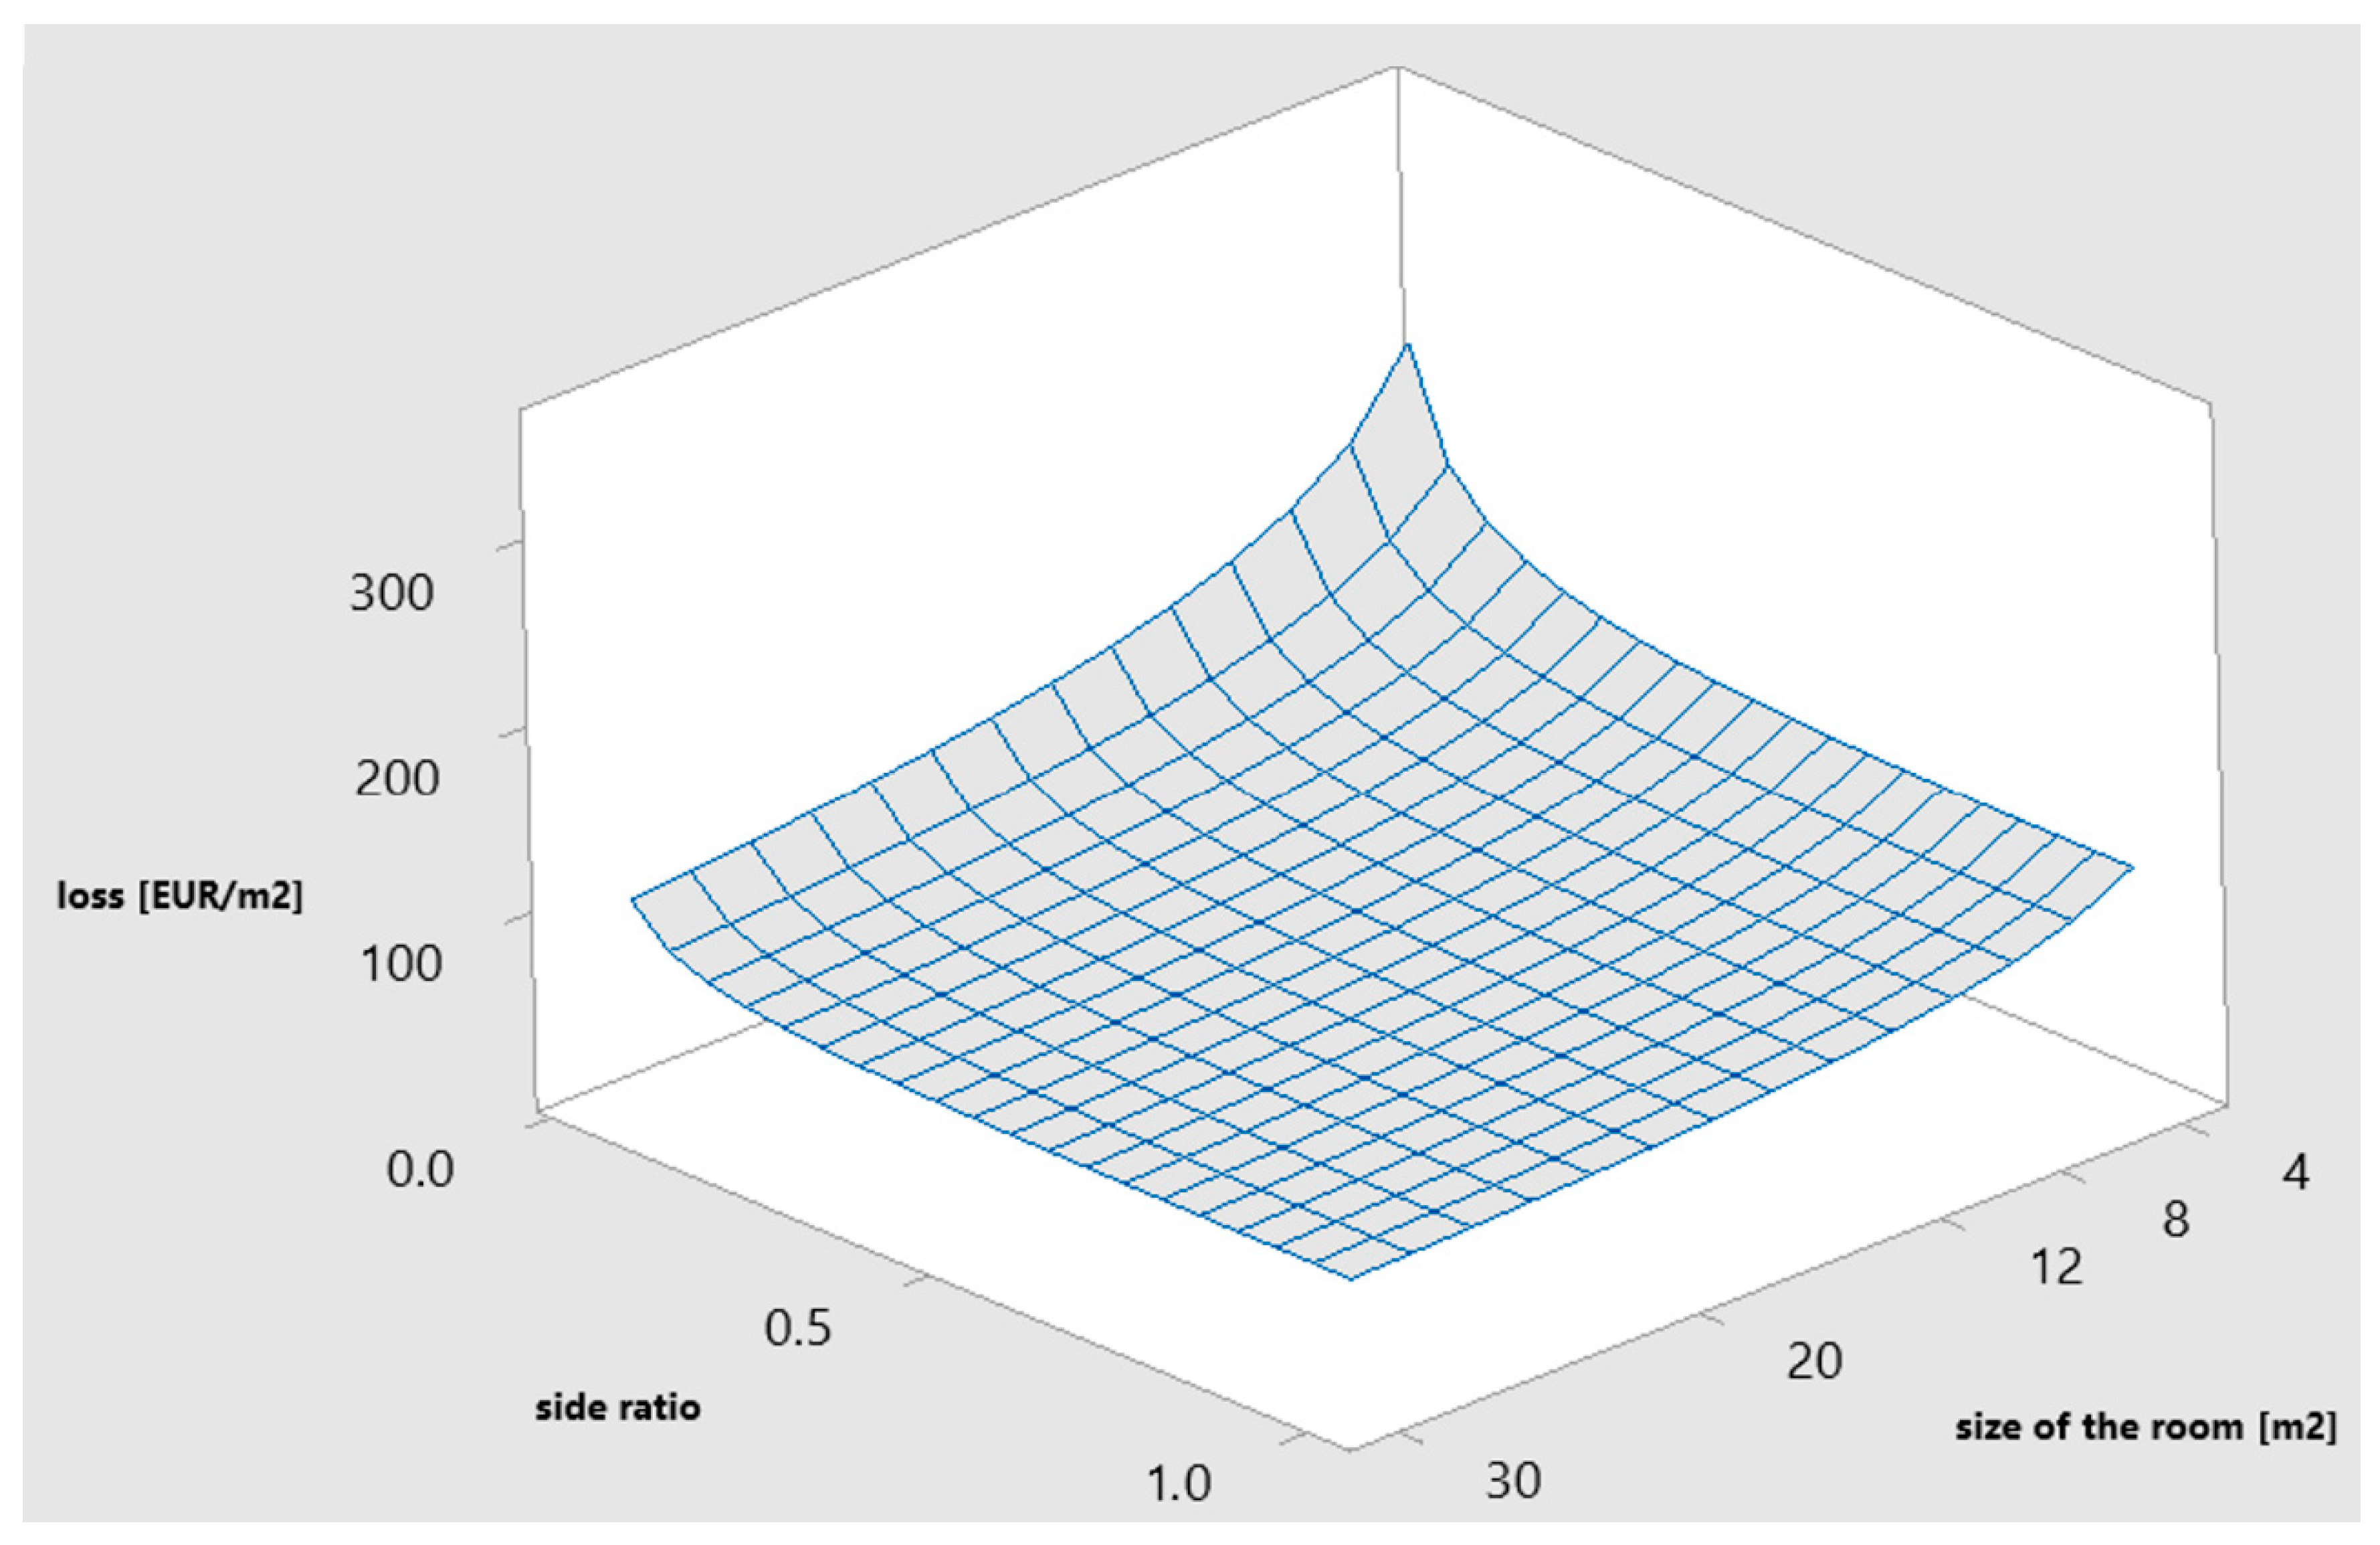
where variables l and w represent the room size (l = length, w = width). For example, in a RSG4 room, room sizes at SR = 1 were equal to l = 3.162 m and w = 3.162 m; at SR = 0.1, l = 10.000 m, and w = 1.000 m. Initially, the number of model room variants with different SR values in each RSG increased with the room area (see Table 1) due to the higher shape variability in larger rooms (e.g., square room vs. long corridor). This distribution was important to assess the impact of the above variables on the magnitude of the damage. Room size and shape become important variables as both have an impact on the amount of unit loss [EUR/m2]. Furthermore, the combination of these two factors may even have a fundamental impact, especially if small-sized rooms (e.g., RSG1) and a low SR ratio are comparable to large rooms (e.g., RSG14) with a shape approaching a square [35] (see Figure 1 and Figure 2). The influence of the side ratio and size of the room on the unit amount of loss with depth of flooding is shown in Figure 1. In addition, Figure 2 clearly shows that the RSG and shape of the room have an impact on the amount of unit loss.
The initial design of the model operated with an uneven number of model rooms in each RSG (see Table 1), with 11 possible SR variants for the smallest model area of 4 m2, while 43 SR variants were available for the largest model area of 30 m2. This irregular distribution caused great inaccuracies in the resulting algorithm, therefore, a regular distribution between RSGs was carried out for a total of 280 variants, while for each model RSG area, the size ratios of SR were defined in 20 variants with a 0.05 to 1.00 value range. With regular distribution, the resulting algorithm was already sufficiently accurate to be accepted. Basic characteristics of model rooms are given in Table 1.
Secondly, the data analyzed in this study correspond to a particular flood scenario. More specifically, our model evaluates the amount of unit loss, taking into account variable depth of flooding measured from the upper level of the floor structure’s tread layer. It is important to mention that other parameters of the floor, such as duration of flooding, flow velocity, and the presence of chemical pollutants in the water, were not considered. This extended THP model merely evaluates losses to non-bearing structures of buildings, i.e., damage to the floor’s tread layer (e.g., vinyl, laminate, or carpet). Wall damage includes damage to the plaster (stucco or gypsum), plaster painting, doors, doorframes, and window panels.
Thirdly, based on the structures affected, the technical extent of repair works is defined. Damage to horizontal structures, vertical structures, and the fillings of openings (i.e., mainly doors and windows) should be differentiated. In horizontal constructions, the floor structure is modeled in three variants. Flooring variant 1 (FV1) comprises laminated composite floor. The damaged cause to this structure includes works associated with the mounting and removing of laminate floating flooring, baseboards, and the bottom counterbalance layer. In FV2, vinyl floor construction is considered. In case of flooding, the surface finish and perimeter socles are removed. This is followed by reassembly of both structures; PVC flooring is glued to the underlay. The carpet is modeled in FV3. In the case of flooding of the type of floor, it is necessary to remove the surface finish and the perimeter socles. This is followed by reassembly of both structures; the carpet is laid down freely, the carpet is glued only at the seams.
Vertical structures (wall plasters) are modeled in two variants. PV1 (plastering variant 1) represents a lime plaster containing a core plaster 10 mm thick and the final stucco layer with thickness of 3 mm. PV2 represents a gypsum plaster 10 mm thick. In the case of flooding of vertical constructions (masonry wall), it is necessary to carry out work connected with plaster removal, cleaning of masonry with pressurized water with disinfection, manual re-plastering of the wall with lime stucco (or alternatively gypsum plaster), and final surface treatment with two layers of antimicrobial paint.
As for windows, plastic, wooden, and aluminium windows are considered. Flooding of plastic and aluminium windows usually does not damage the window panels and frames. Therefore, the dismantling of the sash, its cleaning, drying, reassembly, and adjustment are considered as part of the damage assessment. On the other hand, a flooding of wooden frame windows causes major damage, necessitating full dismantling and replacement of the windows panel and the frame.
The model also works with four types of doors, namely: solid doors in adjustable doorframe, glazed doors in adjustable doorframe, solid doors in steel doorframe, and glazed doors in steel doorframe. Even with minor flooding, the door panels are always damaged, necessitating dismantling and replacement of the door leaf. In the case of adjustable doorframes, these must also be removed and replaced. In the case of steel doorframes, only the removal of their original coating and rust is necessary, followed by repainting.
Fourthly, economic data enabling the evaluation of flood losses by means of bill of costs were collected. The model uses so-called indicative prices, i.e., the average price of individual works and materials excl. VAT. The prices of work and materials were calculated using the Kros budgeting program with the current price database (i.e., price level valid for the year 2019) [37]. The materials used were priced at the standard level.
2.2. Methods
Using graphical data analysis (see Figure 1 and Figure 2), we estimated the relationship between L (damage per m2) and room area X, room side ratio Y, and the depth of room flooding Z.
From the reviewed data, it is possible to construct an approximate graph of damage as a function of the area and side ratio variables at a fixed flooding depth. The graph is a surface whose analytical equation we try to describe (Figure 1). This surface is then sectioned by planes perpendicular to the horizontal coordinate plane. For different fixed area values, we get individual sections, which we describe as graphs of the function of a single real variable.
The practical application of the theory of approximation of functions of a real variable using the least squares method is informed by the author’s experience with similar tasks, the mathematical practice to date, and intuitive estimation of the relations of real functions.
The functions whose graphs are shown in Figure 2 are non-increasing (i.e., with non-positive first derivative); they are convex functions, i.e., with a positive second derivative, and most importantly, if the independent variable grows above all limits, the loss values are asymptotically approaching the constant value and the graph stabilizes near the constant function graph. For example, simple linear transformations of an exponential function have a similar course.
Conversely, if the value of the independent variable approaches zero (see figure), the value of the dependent variable rises above all limits. Exponential functions do not behave in this way; however, a similar type of singularity occurs in rational functions or functions that arise from composite functions, where the rational function is the external component of such a composite function. When trying different types of analytical relations and numerical simulations, the shape of the function of the given formula (2) seemed most suitable.
After adjustments, we finally arrived at a function formula as the product:
where for
where C, for i = 1, 2, 3 are real constants.
In total, there are 13 optional parameters that must be determined so that our theoretical model best corresponds to empirical data.
We had available a set of instances of loss L for the given values of room area X, size ratio Y, and depth of flooding Z, i.e., individual 4-tuples . The model parameters were set so as to ensure a minimum Euclidean distance of the loss values in the model from actual empirical values:
where the function is determined by formula (2) and the norm is understood in the usual Euclidean sense, i.e., the following applies to an N-member arithmetic vector :
Due to the unknown exponents and , the task is highly nonlinear. This is why the usual methods that are normally used in these kinds of situations, such as the method of ordinary least squares, failed to solve the problem. For this reason, genetic optimization tools were applied.
A genetic algorithm is a computational method that tries to imitate the principles of genetics and biology to find solutions to complex problems, e.g., in optimization. Genetic algorithms mimic the evolutionary processes known from biology—natural selection, mutation, and crossbreeding—to “improve” the solution to a given task.
Genetic algorithms are used in the literature for various purposes, e.g., for estimation of transmission loss in power systems [38], loss-of-life caused by dam breach evaluation [39], optimization of large flood-diversion systems [40], or structural damage identification [41]. Accordingly, its usage in interdisciplinary research (economic estimation of the technical scope of loss) is justified.
The operating principle of a genetic algorithm lies in the gradual creation of generations of various solutions to the problem. As the population progresses through evolution, solutions are improving. In the task at hand, perspective specimens are defined as those producing the least deviation of modeled and empirical values from (4).
It was challenging to solve the problem due to the high number of unknown values (a total of 13 unknown parameters of the model). This is why the authors created their own software, which uses a combination of a genetic algorithm and the ordinary least squares. The authors only used the genetic approach to find some of the parameters; the rest of the values were calculated using the ordinary least squares in each cycle of the generic algorithm. Thus, the proposed model represents a hybrid algorithm combining multiple algorithms solving the same problem. In this way, it is possible to use the advantages of individual algorithms and to improve the performance of genetic search [42]. Accordingly, a hybrid genetic algorithm represents a genetic algorithm hybridized with a local search procedure [43].
While the application of this hybrid algorithm is not universal, it was created to suit the needs of the present primary model and thus allowed the authors to obtain very good results that helped improve the primary model significantly. Therefore, this is not a classical task of genetic programming because the preliminary shape of the model function was not compiled by the evolutionary algorithm itself, but was created on the basis of a graphical analysis of the processed data.
The next stage in the model development consisted in the incorporation of estimation of damage to windows and doors into the model. In this context, two factors have an adverse effect. Firstly, there is a very high variability of these constructions, both in terms of dimensions (width, height) and technical specifications (e.g., double glazing vs. triple glazing), both of which directly affect the price of windows and doors. Secondly, windows are distinctive in that they are not always flooded (as opposed to vertical and horizontal structures, i.e., floors and walls). Windows are flooded only if the flooding depth exceeds the height of the lower edge of the window. So far, there has not been a way to mathematically describe such variability using a finite number of parameters in order to extend the number of variables in the L-function included in formula (2). Therefore, a separate sub-model has been created to calculate damage to windows and doors using the bill of costs. This is the next stage of the computational model hybridization, combining the ordinary least squares, the genetic algorithm, and the bill of costs method. Using the advantages of these three methods, the resulting entire hybrid algorithm creates the best possible model under the given conditions, balancing the maximum possible simplicity of calculation on the one hand and accuracy on the other hand.
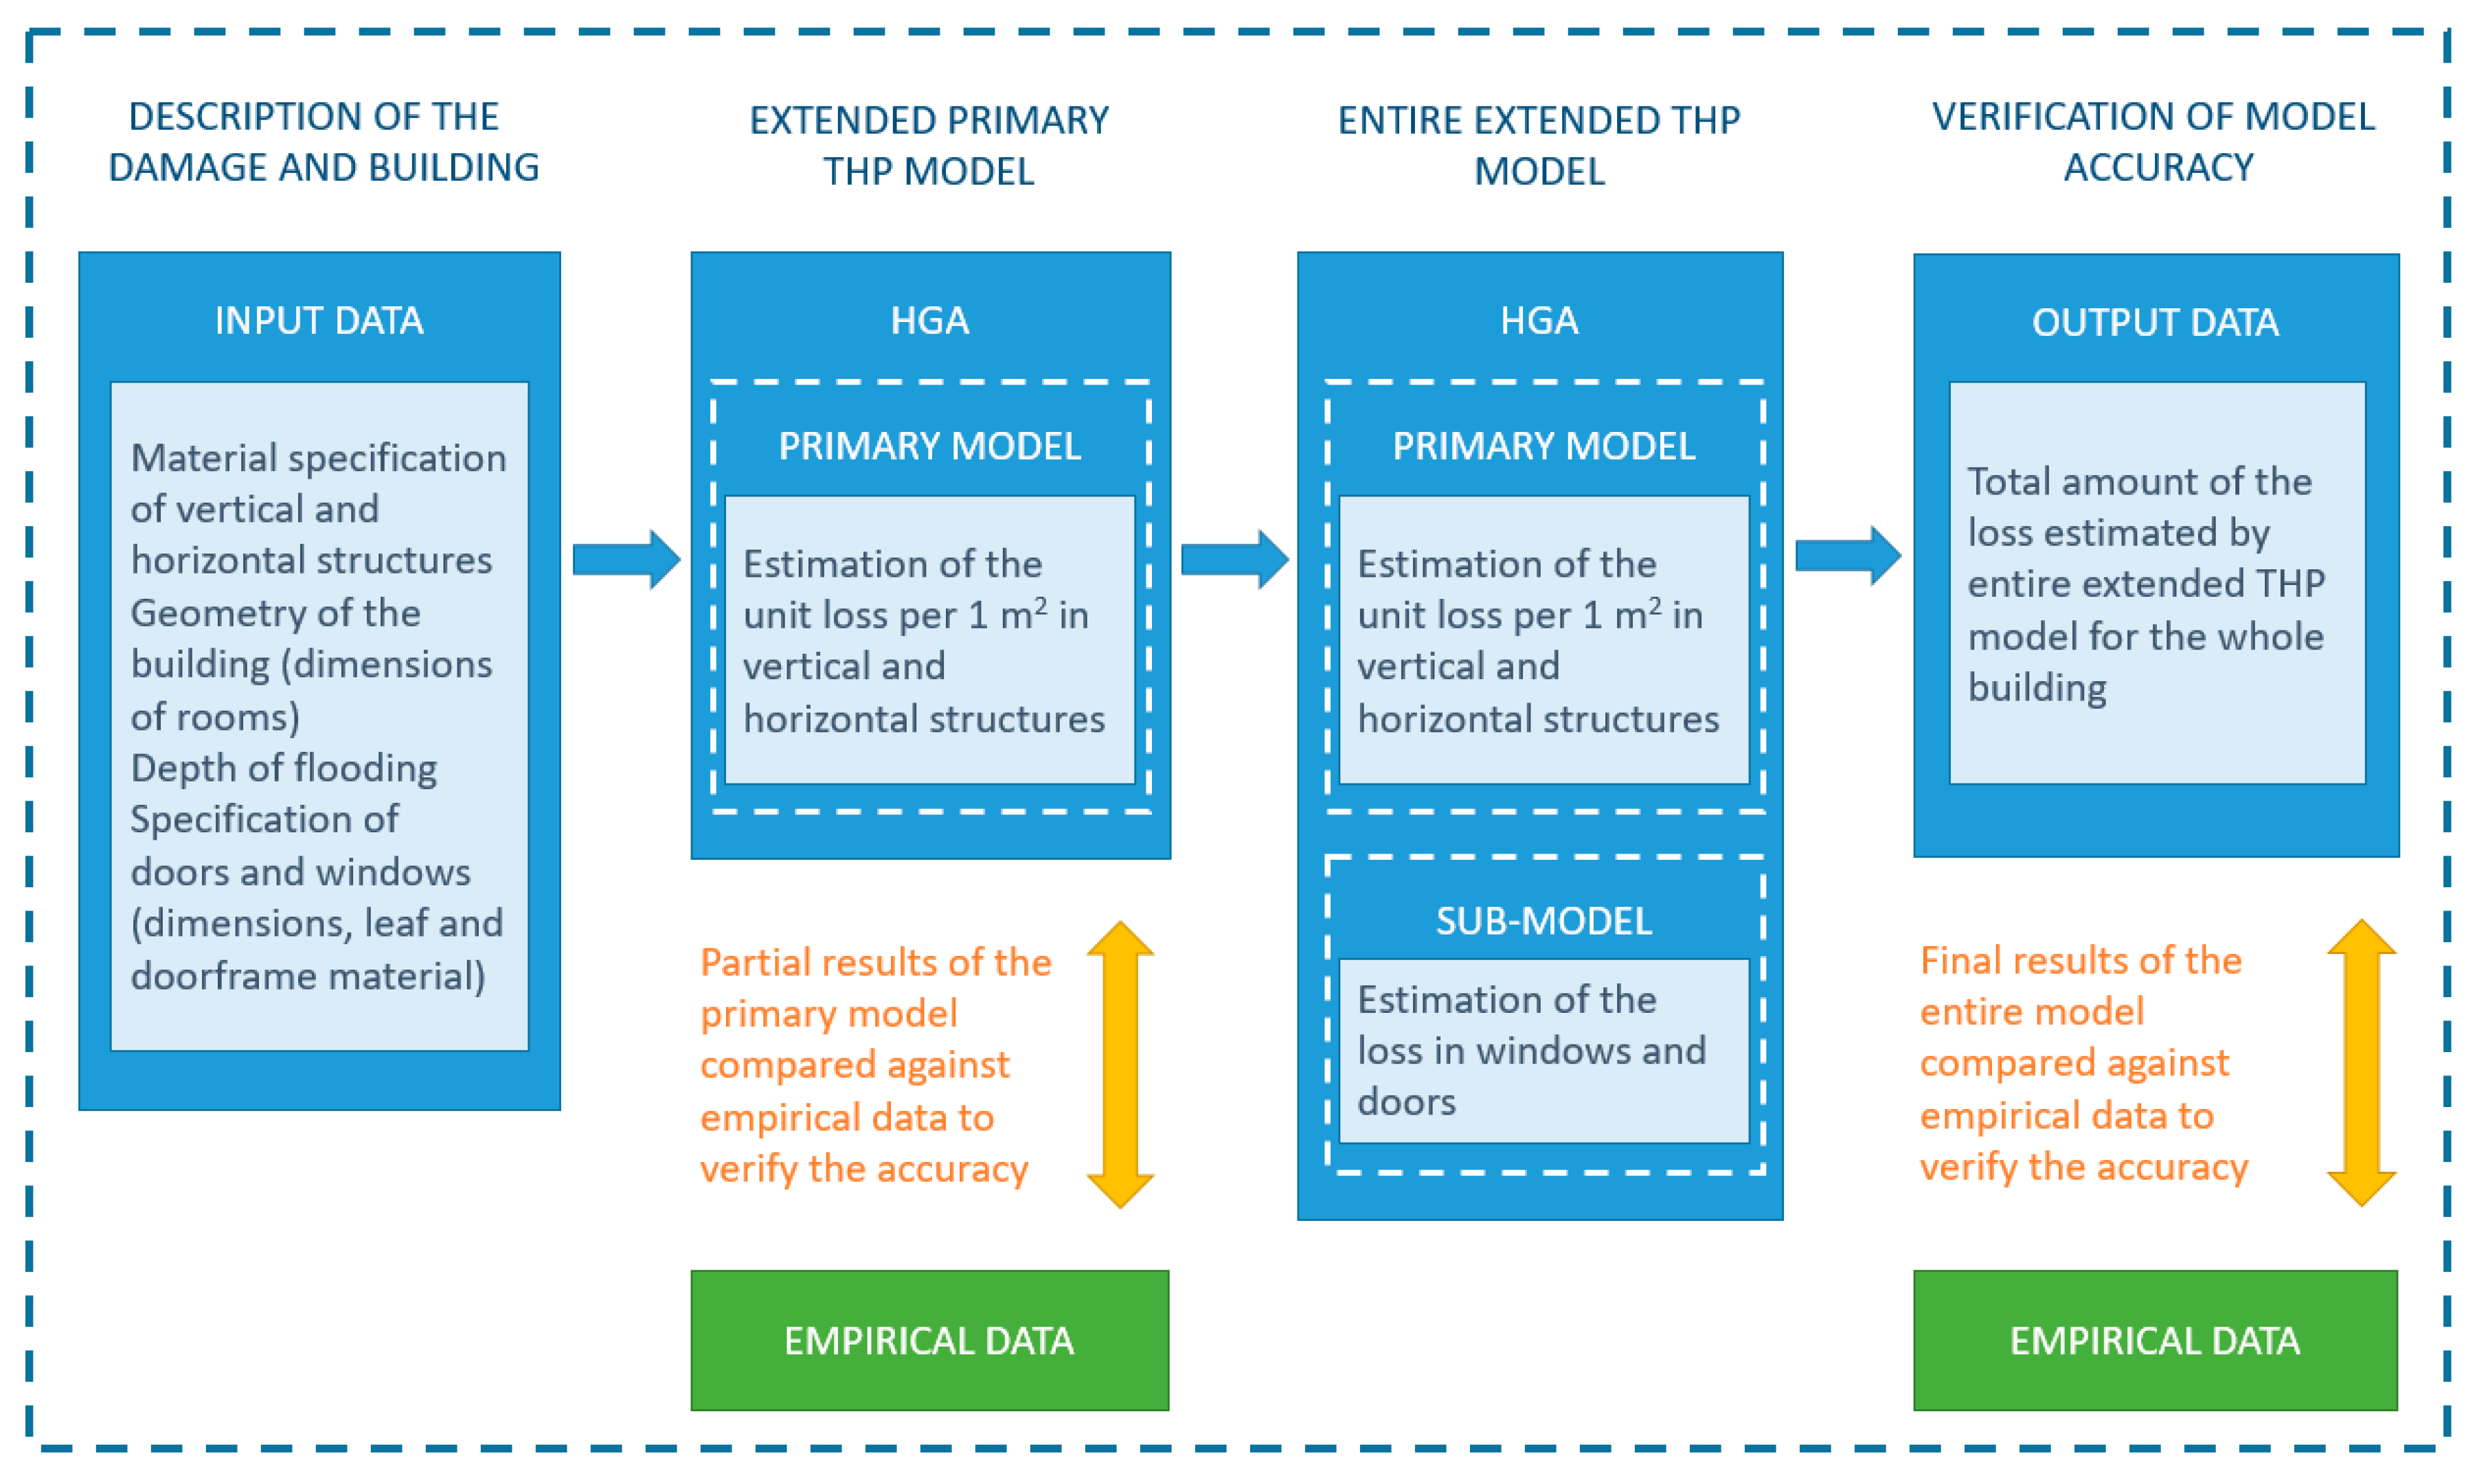
Subsequent verification of model accuracy was performed at two levels by comparing model outputs with empirical data obtained by assessing damage in a standard way, i.e., using the bill of cost method. The model diagram is shown in Figure 3. At the first stage, the accuracy of the primary model estimating room damage without windows and doors by combining the ordinary least squares with the genetic algorithm was verified at the individual room level. The percent error was determined using the following formula:
where PEPM represents the percent error of the primary model, ELPM represents the loss estimated by the primary model, and ELBoC represents loss estimated by traditional calculation by means of bill of costs (see Section 3.1).
Subsequently, the accuracy of the entire extended model (including the sub-model for openings) was verified on case studies in which flood damage was simulated on 3 buildings in multiple variants of material solutions of vertical structures, horizontal structures, windows, and doors. The relative error for the entire extended model was determined using the following formula:
where PEEM represents the percent error of the entire extended model, ELEM represents the loss estimated by the entire extended model, and ELBoC represents loss estimated by traditional calculation by means of bill of costs (see Section 3.2).
3. Results and Discussion
3.1. Verification of the Accuracy of the Primary Model Combining the Least Squares Method and the Genetic Algorithm
Verifying the accuracy of the primary model, taking into account damage to vertical and horizontal structures excluding windows and doors, is based on evaluating its accuracy as the advantage of the model should consist not only in the speed of processing, but also the accuracy of the valuation process. In the verification process, a total of 20,160 PEPM items were processed for 6 combinations of variant solutions of used materials on the level of room with different RSG and SR. Statistical data on the frequency of PEPM are shown in Table 2.
The data in Table 2 shows that the overwhelming majority of percent errors have a deviation of less than 1%, which represents a very accurate estimate of the amount of economic damage by the primary model compared to a calculation by means of the bill of costs. Specifically, there are 18,203 PEPM items, i.e., 92.7% of the total number of combinations performed.
When examining the accuracy of the primary model from the RSG perspective, it was found that the median PEPM values reach acceptable values for all material variants and RSGs. For example, for the FV1-PV1 variant, the median PEPM for the whole set (i.e., 3360 items) is 0.3836%, where the maximum value was found in RSG4 (PEPM = 0.5355%) and the minimum value in RSG30 (PEPM = 0.3069%). When evaluating the median PEPM for other material variants according to RSG, the tendency to achieve lower primary model accuracy was found in RSGs with a smaller floor area compared to RSGs with a larger floor area.
Genetic algorithms have the disadvantage that they may not always find the “best” solution. Since the calculation was performed separately for each of the six variants, it was not always possible to tune the algorithm so that the error rate was absolutely identical. Different initial populations were generated within the genetic algorithm and the termination criterion was determined so that the relative deviation of model and empirical data did not exceed the tolerance margin of 2%. Only the FV3-PV1 variant failed to achieve this, but the deviation of 2.1% is still satisfactory for practical calculations.
Regarding the maximum and minimum deviations, the highest PEPM value was achieved for the FV3-PV1 combination at 2.03% (see Table 3). This maximum value still represents a very accurate result for flood damage estimation for insurance purposes. Regarding descriptive statistics of the percent error, the mean value is 0.004855% and median is 0.004390%. It can be concluded based on the results that the change of the materials used in the calculation of the algorithm does not have a significant effect on the results. The error rate is similar to the composition for various combinations of material variants used in vertical and horizontal structures. This means that the primary model and methodology of the genetic algorithm is sound and can be used for various materials and compositions, given correct inclusion of an itemized budget in the data set.
3.2. Verification of Accuracy of the Entire Hybrid Computational Model on a Case Study
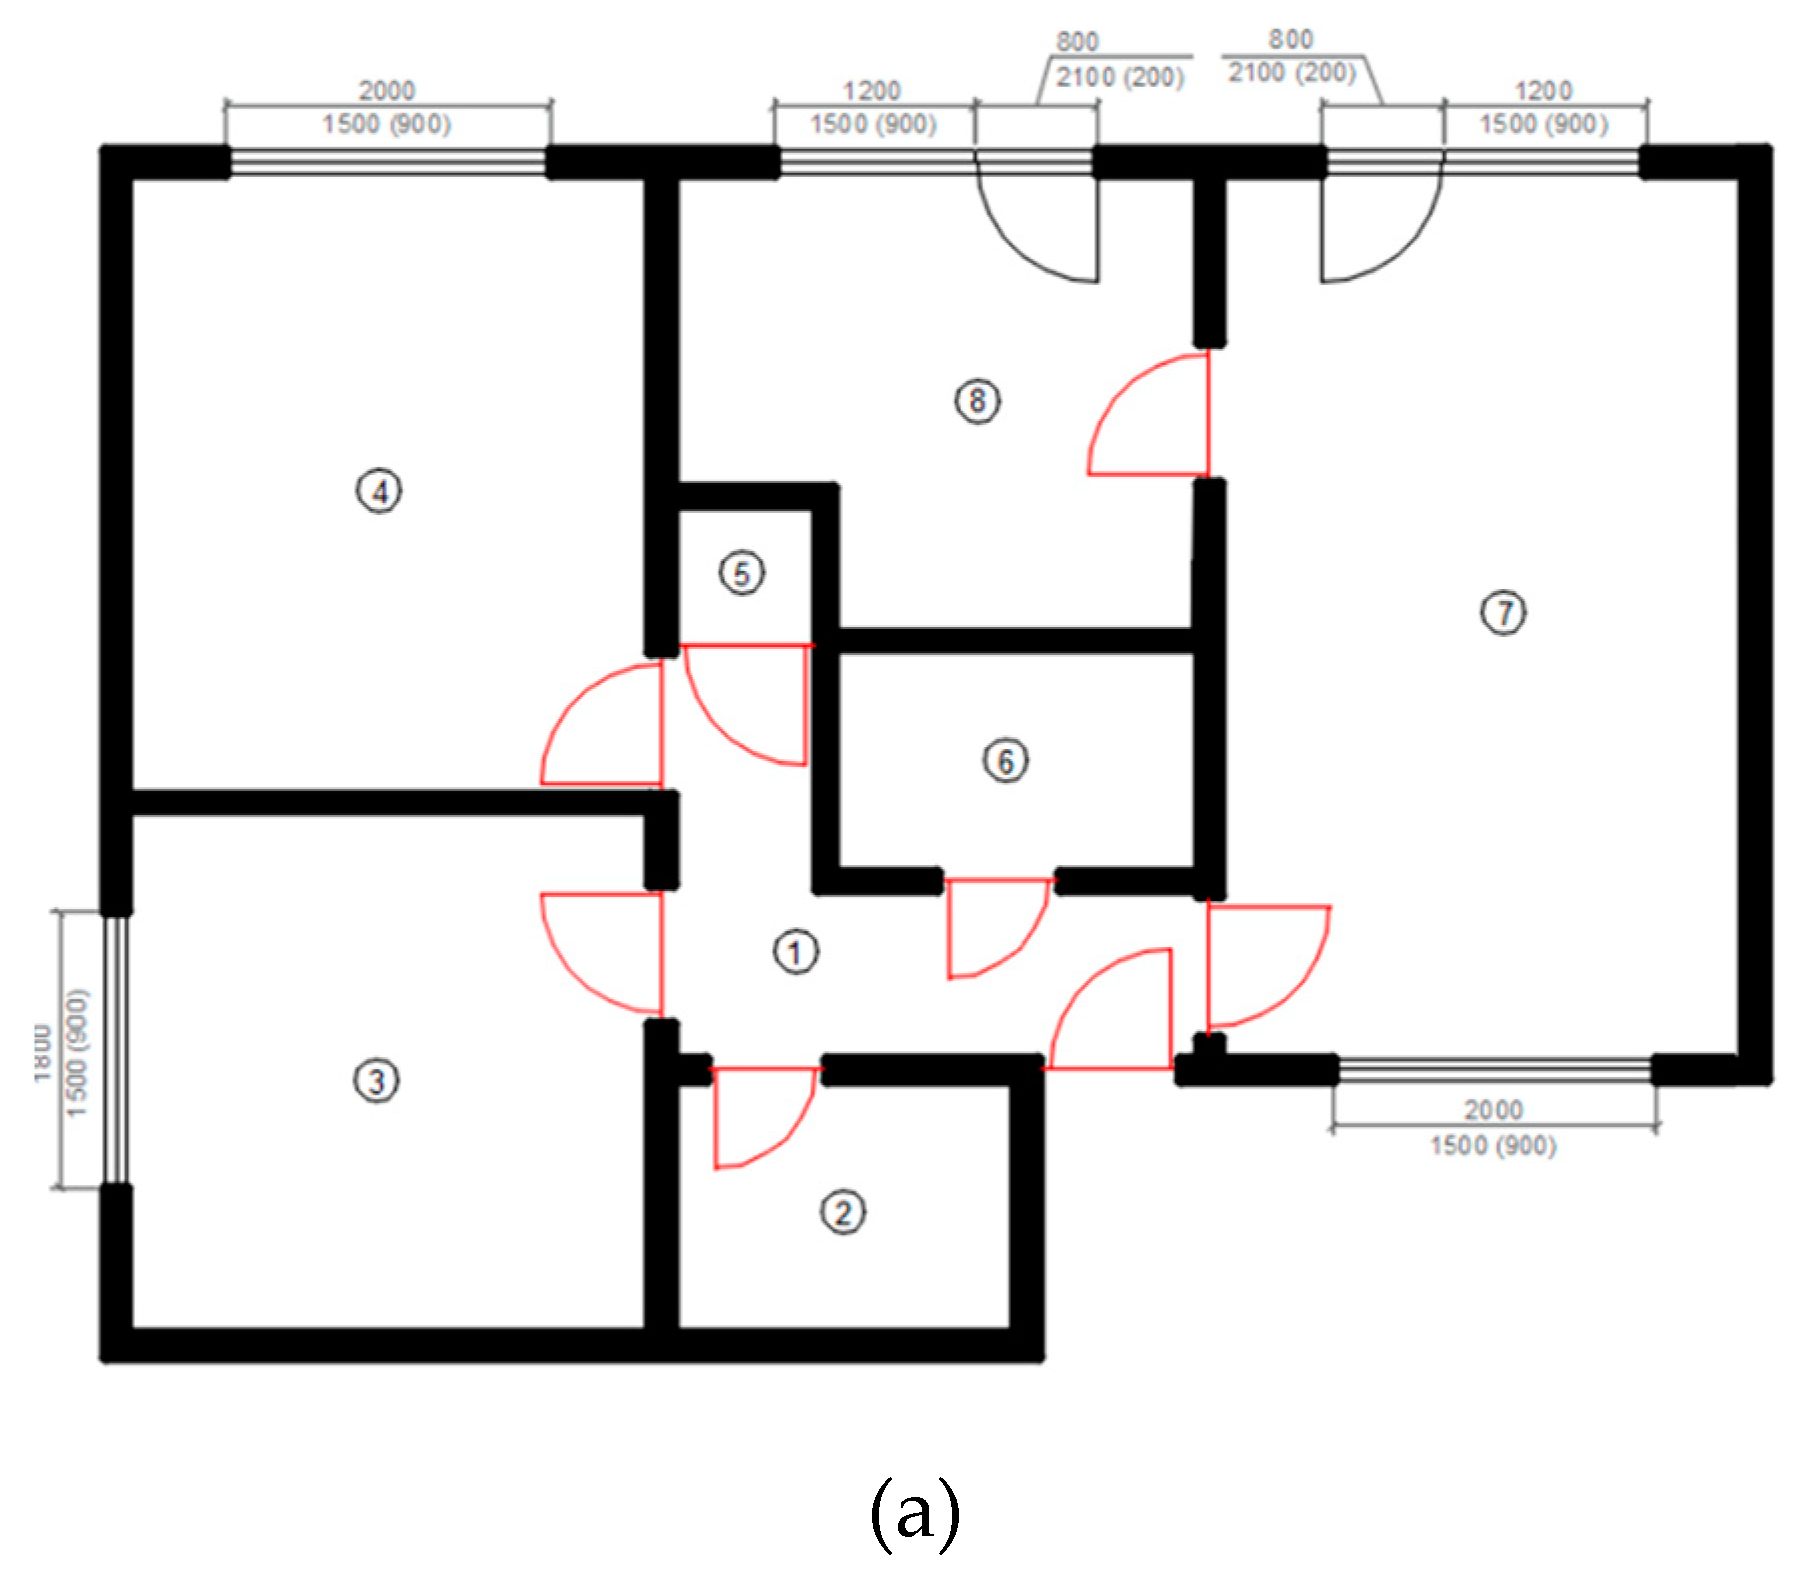
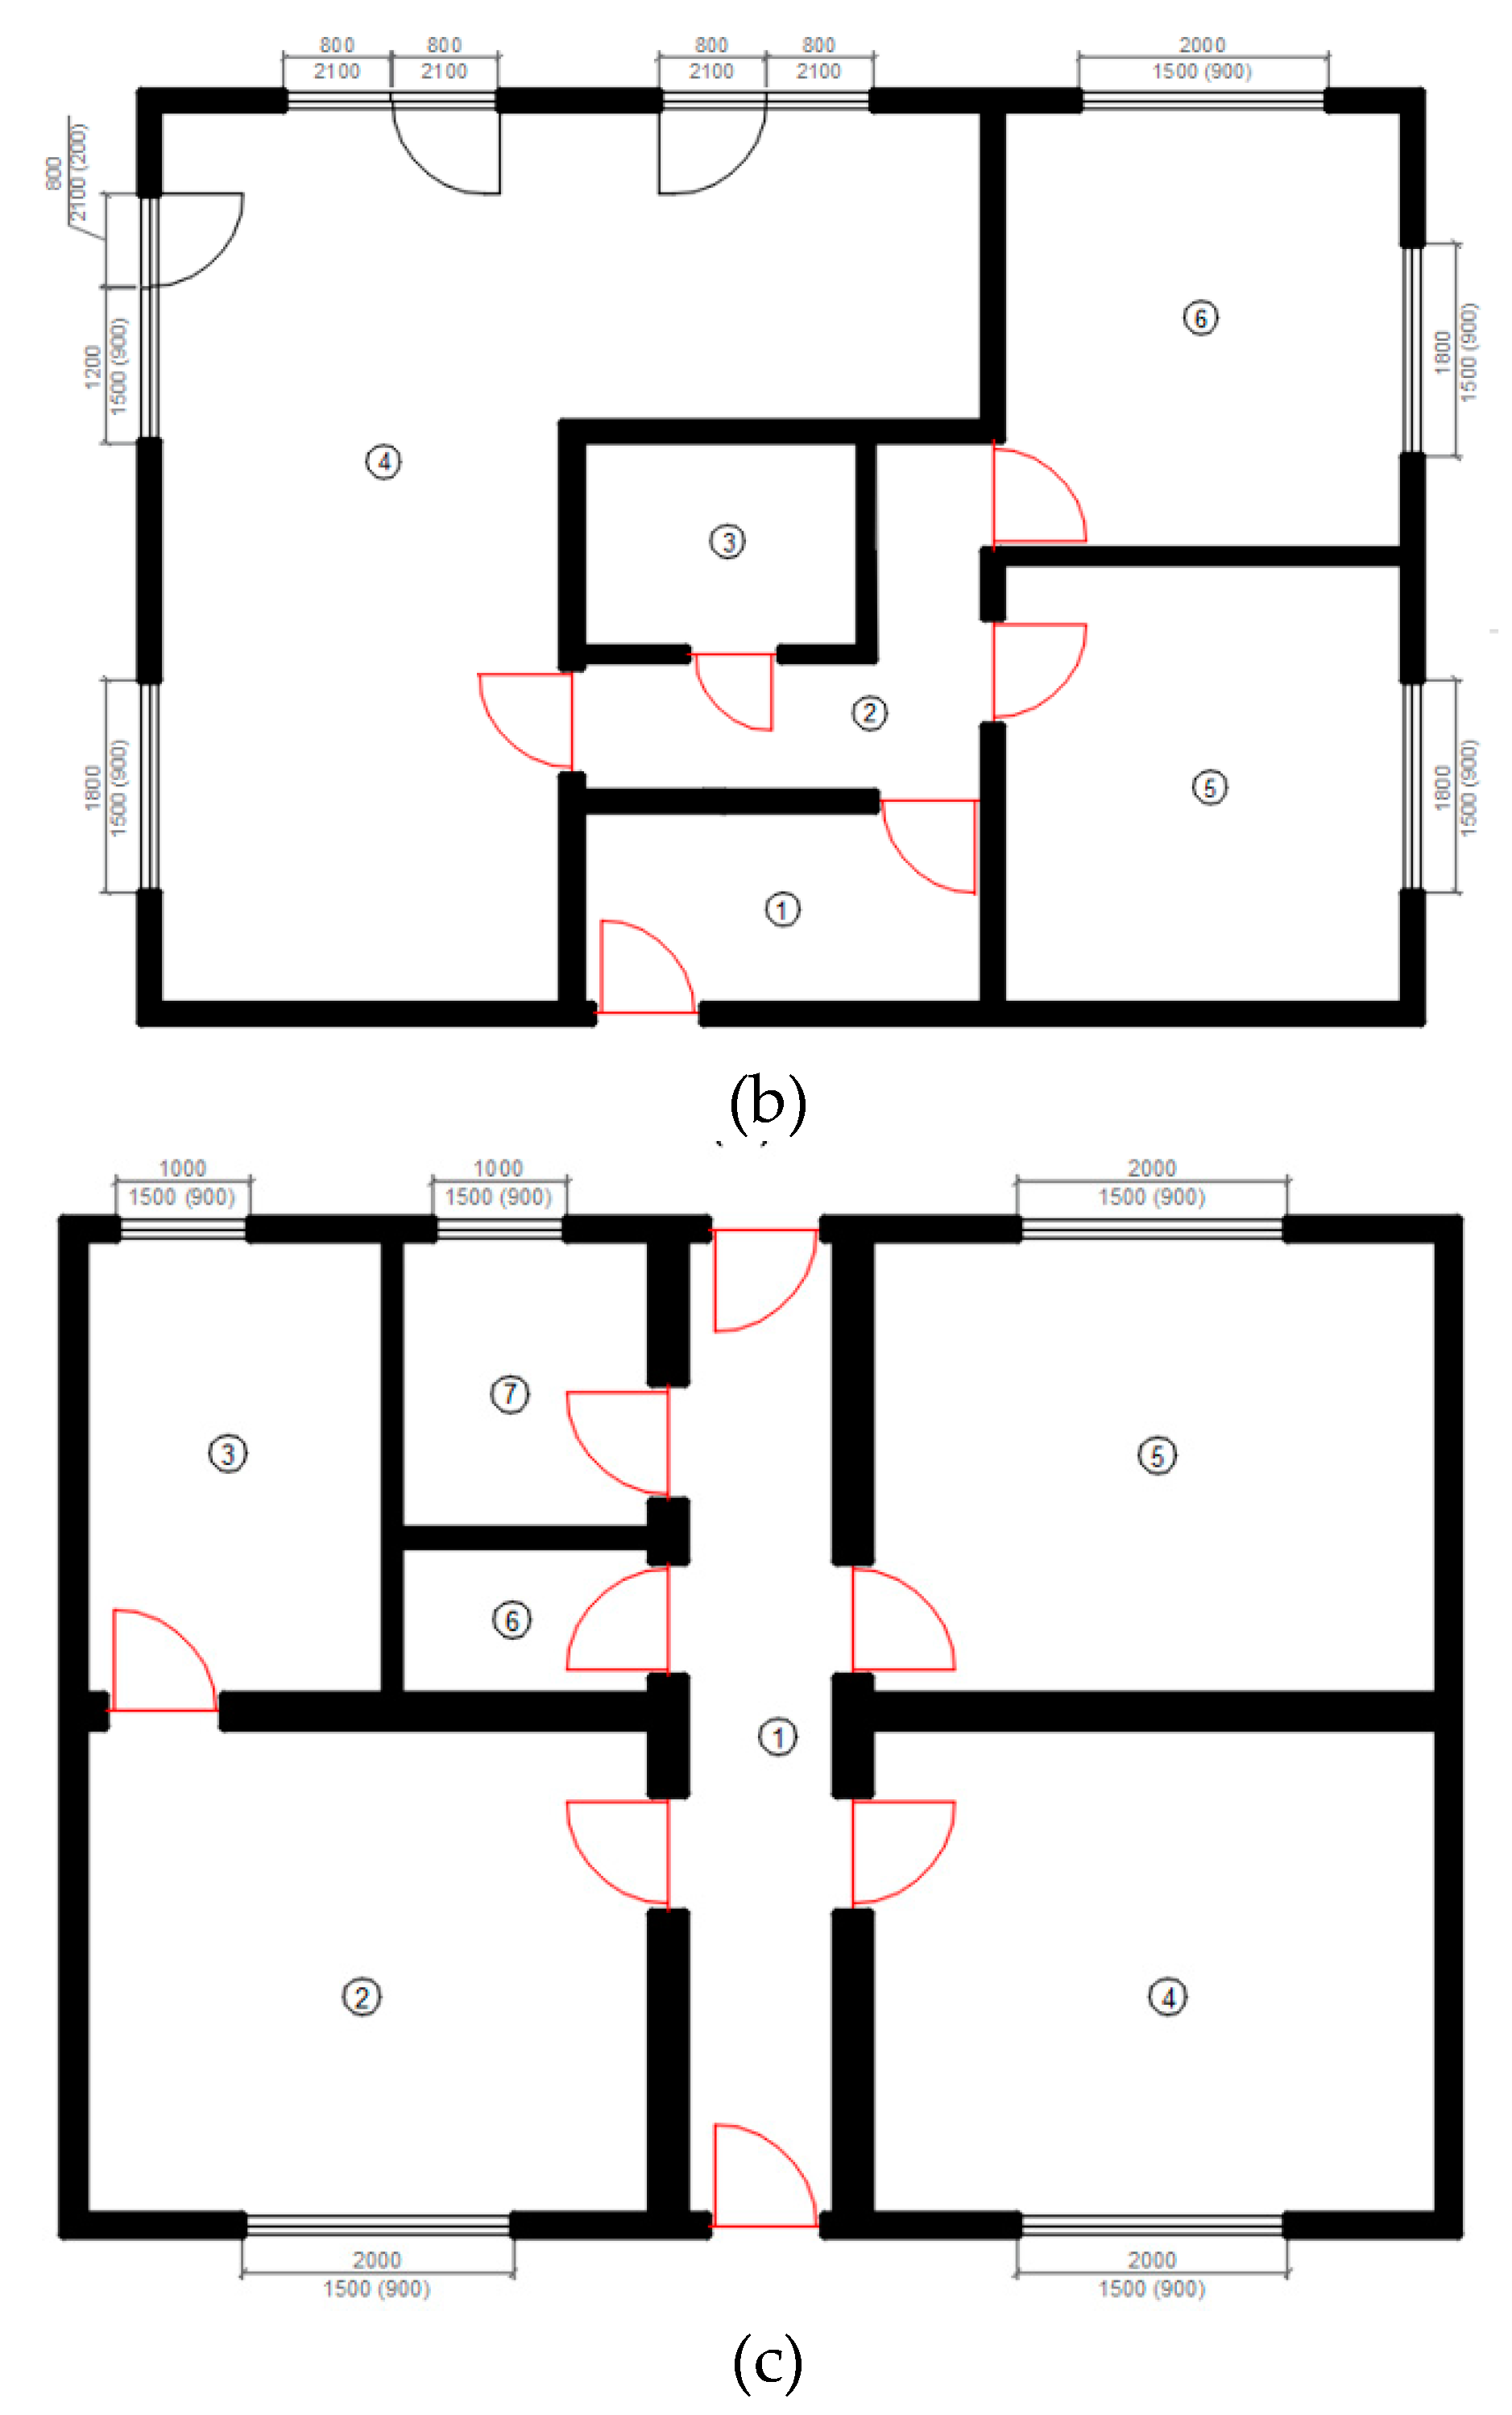
Functionality and accuracy of the entire extended THP model is evaluated on three buildings (family homes). These buildings differ from one another in multiple aspects: (1) size; (2) number of rooms; (3) shape of rooms; (4) material of horizontal structures; (5) material of vertical structures; (6) number of windows and doors; (7) material of windows and doors; (8) height of windows; and (9) depth of flooding. The buildings were intentionally chosen to be different in order to demonstrate the accuracy of the model’s calculation even with high variability of the input data. The floor plans of the buildings are shown in Figure 4 and detailed descriptions of the rooms in terms of their dimensions, materials, and the presence of windows and doors are available in Table 4.
For all three buildings, a flood simulation and interior damage assessment were performed using the extended THP model. The flood depth was 1.25 m for building A; 0.75 m for building B; and 1.5 m for building C. At the same time, to verify the accuracy, standard itemized budgets have been prepared for all buildings to estimate the damage incurred. The values thus obtained are shown in Table 5.
From the results obtained, it is evident that the use of the extended THP model for the estimation of flood damage to the interior structures of buildings achieves an acceptable degree of accuracy for the needs of insurance claims settlements. The PEEM values for modeled flood depths for buildings A, B, and C are 1.10%, 0.33%, and 1.03% respectively. It should be emphasized that the buildings differ significantly from each other. In the case of building A at flooding depth of 1.25 m, the windows were flooded; additionally, there are two L-shaped rooms and one very small room (room 5 with an area of 0.89 m2) with an area smaller than RSG1 (4 m2). Building B is distinct in that there are rooms with very different areas. These include, for example, room 3 with an area of 4.3 m2 (area approaching RSG1) and room 4 with an area of 36.46 m2, which exceeds the area of RSG14. The room 4 is also unique in that it is L-shaped. Additionally, only a few French windows are flooded at the depth of 0.75 m. Finally, building C contains distinct room 1, which forms a long corridor with a small SR value of 0.16, while featuring a large number of doors (7 doors).
The model is set to take into account the fact that one specific interior door is always located in two adjacent rooms, but is only counted once. The big advantage of the model is its ability to estimate the amount of damage for all rectangular rooms. This means the room does not necessarily have to be square-shaped or rectangular; it can be, for example, L-shaped (as was the case in building A, rooms 1 and 8, and building B, rooms 2 and 4). At the same time, the model makes it possible to determine damage even for rooms with an area smaller than RS1 or larger than RSG14, which is a prerequisite for its universal use. Thus, it has been demonstrated that the extended THP model makes it possible to estimate the amount of flood damage to the interior structures of buildings with a wide range of input variables and sufficient accuracy. As to the time requirements of the model, if the necessary input data (room size, material characteristics, and window and door data) are available, entering this information into the model and estimating the damage will take less than two minutes per room. Such input data can be obtained during the loss investigation or when arranging an insurance policy (see Section 3.3 for more details).
3.3. Potential Interconnection of the Model with Information Systems of Insurance Companies
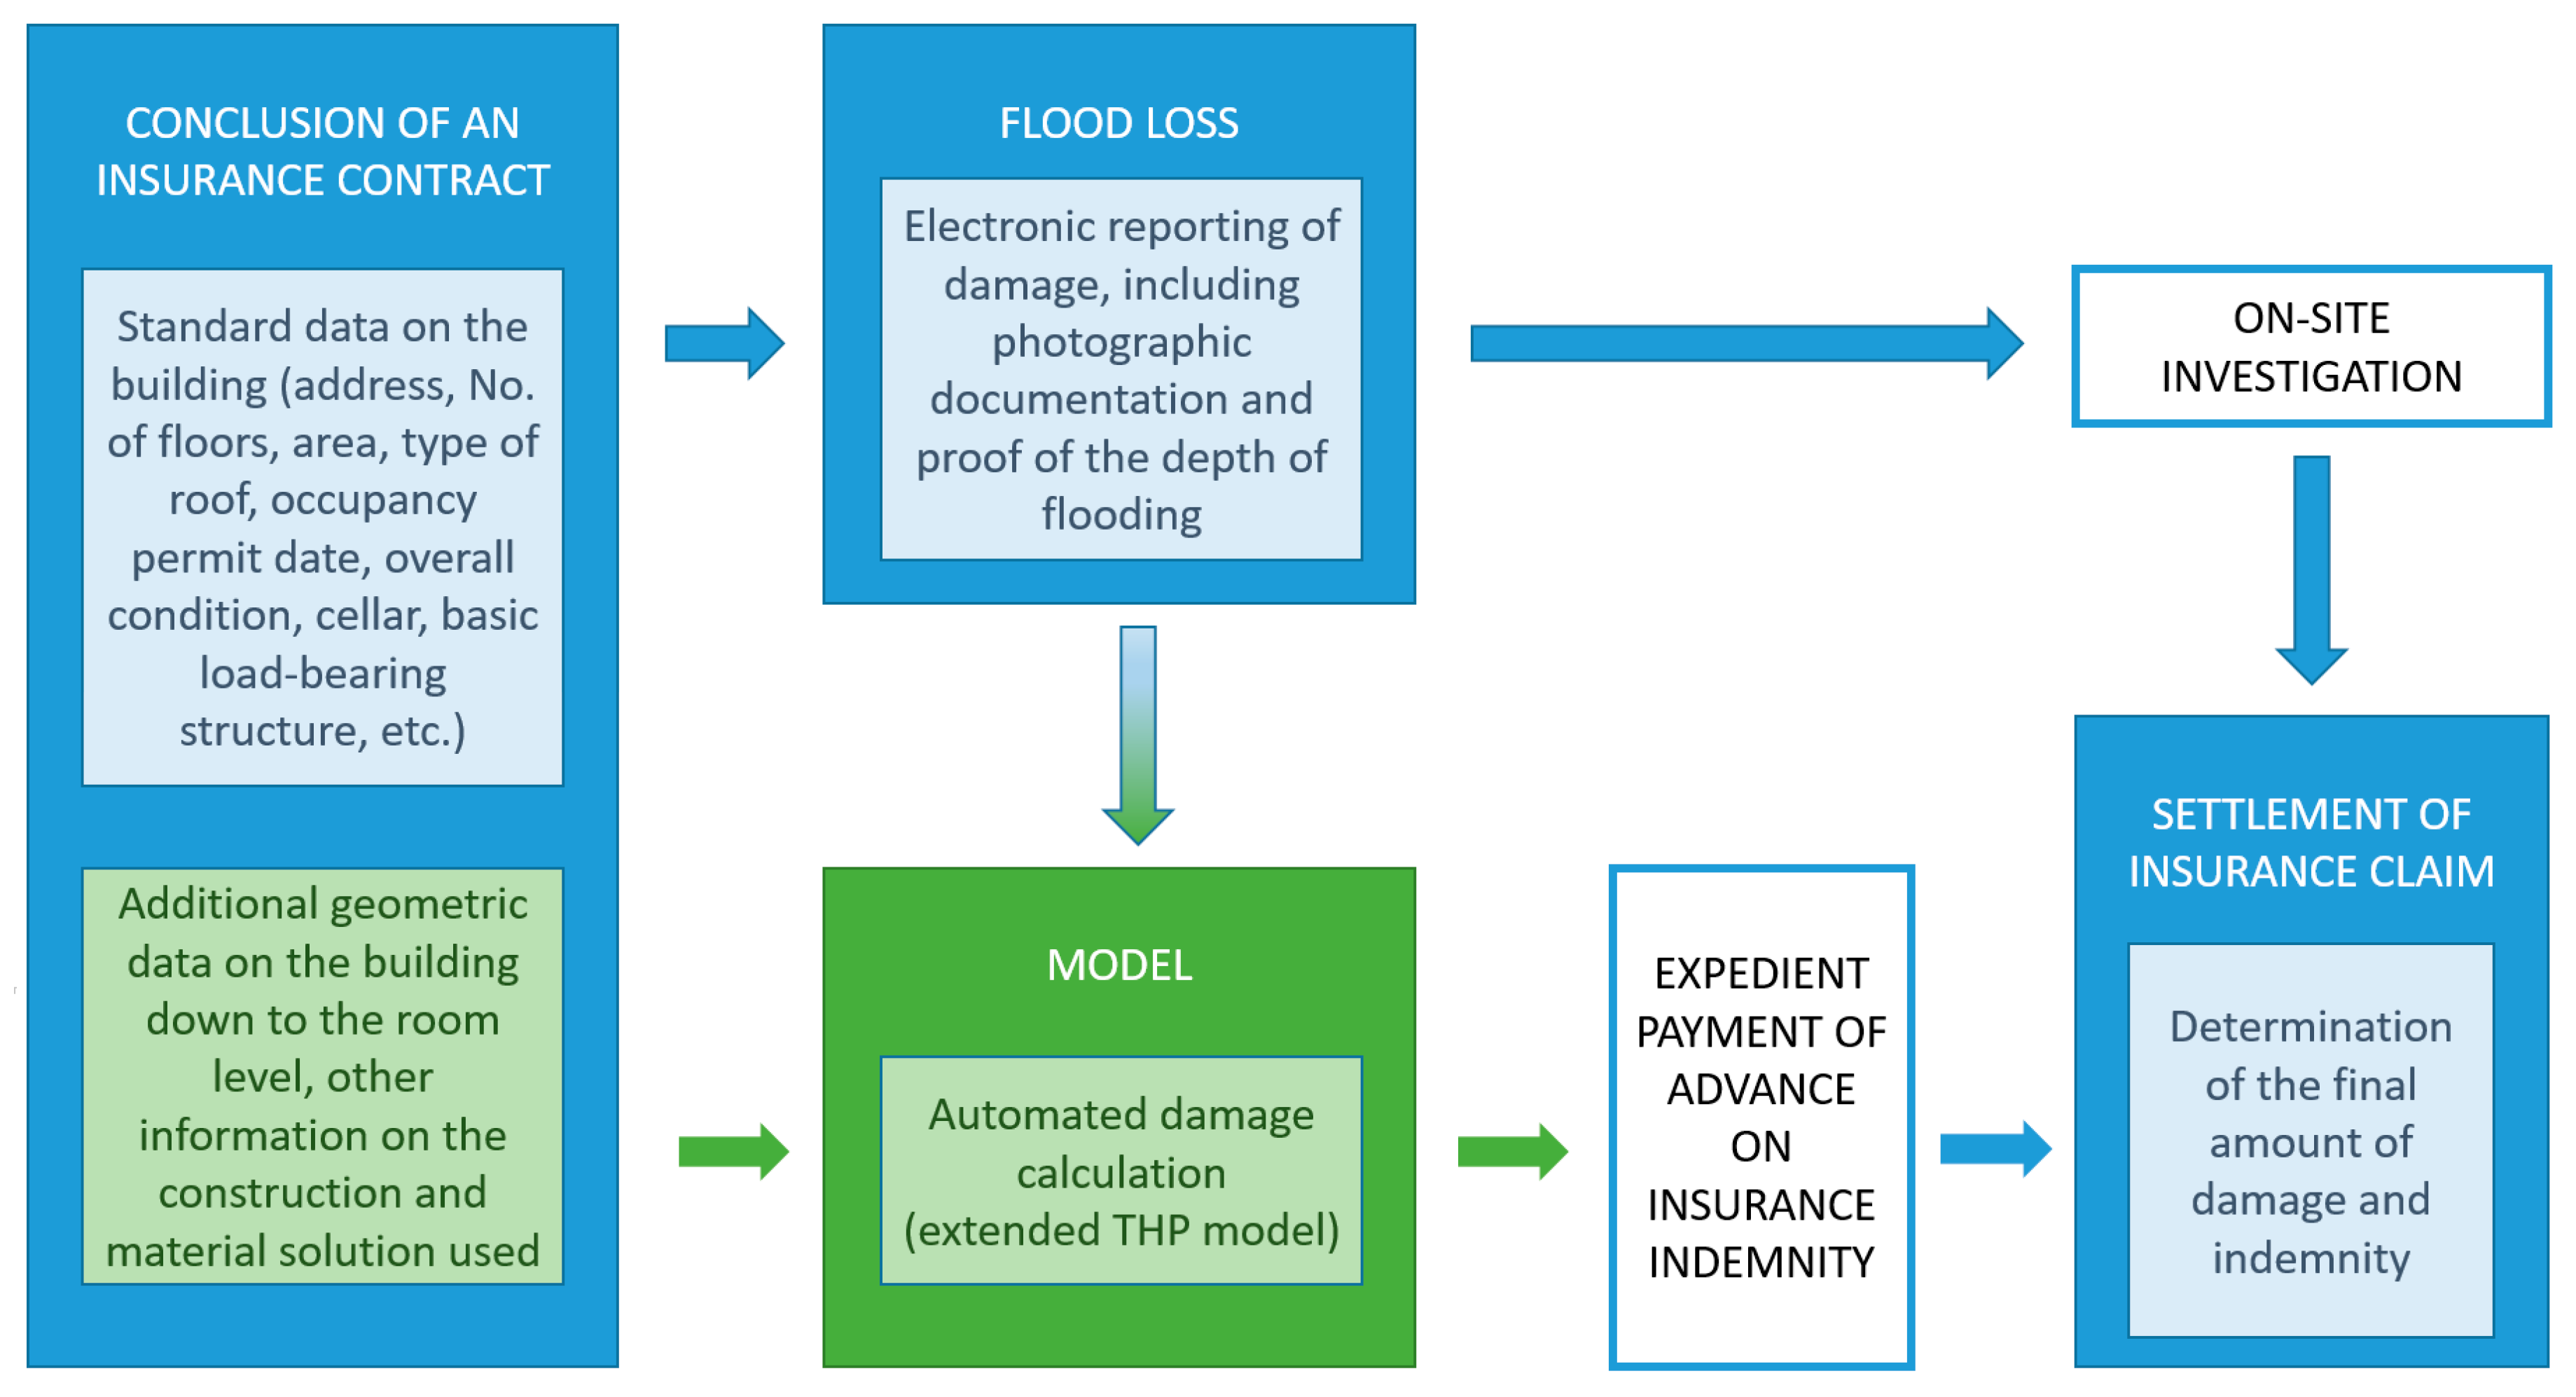
This research deals exclusively with building insurance covering damage to the structures. Therefore, so called content insurance covering household personal possessions and furnishings is not addresses by our model. Currently, it is standard practice to arrange property insurance contracts, including building insurance against natural disasters, online or through an insurance broker, who enters the basic parameters of the insured property into an insurance company’s information system in order to determine the amount of insurance premium to by paid by the client (the insured person). In this context, the option of interconnecting the model with insurance companies’ systems can be considered.
A prerequisite for the integration of the proposed model into the information systems of insurance companies consists in an extension of the database of data collected by insurance companies for the purposes of arranging insurance policies and the subsequent settlement of insurance claims. Specifically, when arranging an insurance policy, the scope of the data collected would need to be extended to include geometric information about the insured building at the level of individual rooms. Simultaneously, the rooms would be assigned descriptive information about the material solution used and photographic documentation of the condition of the building at the time when it was insured. This would de facto create a simple building information model (BIM) of the insured building, which, when interconnected with the proposed model, would enable to automate the calculation of insurance indemnities, i.e., the estimation of flood damage. The interconnection could also take into account other aspects of the insurance policy affecting the amount of indemnity, such as the amount of the agreed deductible.
Under these circumstances, it can be considered that insurance companies could operate under the “remote claims settlement” regime. In such a situation, the claimant would electronically provide adequate photographic documentation of the damage, enabling clear identification of the extent of the damage. The photographic documentation would also provide evidence for they key variable used in the model, i.e., the depth of flooding. Thanks to the model, it is possible to determine the amount of damage to the building’s interior structures in a timely manner and with a high degree of accuracy and thus to process a large number of insured events in a relatively short time, including the payment of sufficient advances on insurance indemnities.
The time saved by the model-enabled rapid automated estimation of the amount of damage could be used by liquidators for a timely on-site investigation, which is a prerequisite for the final settlement of claims based on insured events and determination (and payment) of the final amount of the indemnity within a much shorter period. Figure 5 shows a schematic representation of the potential for interconnection between the model and insurance companies’ information systems. The model can be built into an insurance company’s information system or used as a connected external software solution.
4. Conclusions
The increasing frequency of large-scale catastrophic natural events such as floods creates an incentive to develop improved methods of estimating the economic loss caused to real property. In this study, a hybrid genetic algorithm-based model has been developed to address this particular issue. More specifically, our extended THP model enables to conduct quick and accurate estimation of flood losses on non-bearing structures (floorings, walls, doors, and windows) in the interior of residential buildings, down to the individual rooms. The model takes into consideration the geometrical aspect of the rooms, provides flexibility regarding the material composition of structures, and reflects the depth of flooding, which has been incorporated into the model as one of the basic variables. The obtained flood loss estimates proved very accurate.
From a theoretical perspective, this study contributes to the current body of knowledge by providing a new original approach to the flood loss estimation in buildings. From a managerial perspective, the model can be adapted for practical use by insurance companies in the future. The authors believe that the high level of accuracy of the results achieved, together with quick processing of data, will help to considerably accelerate the resolution of insurance claims and significantly contribute to timely repairs of damaged property. On this basis, the proposed model has an ambition to support sustainability of the built environment.
The results presented herein also have important implications in terms of actuarial mathematics. More specifically, the model allows to estimate possible future losses under various scenarios. In this context, the effects of damage can be better understood to, e.g., set appropriate insurance rates.
This research is limited in several ways. Firstly, it should be noted that the model only takes into consideration the depth of flooding. Other flooding parameters such as flow velocity are not considered in this study. Secondly, the current version of the model estimates the economic value of the loss using standard materials and average prices. Accordingly, future research should incorporate the unit price of the basic material (such as the price of flooring materials per 1 m2) as an additional variable in the model. Authors would also like to explore the possible use of BIM technologies for flood loss estimation purposes and their connection with the model presented herein.
Author Contributions
Conceptualization, T.H. and M.T.; methodology, T.H., M.T. and O.P.; software, M.T. and O.P.; validation, T.H., M.T. and O.P.; formal analysis, T.H., M.T. and O.P.; investigation, T.H., M.T. and O.P.; resources, T.H., M.T. and O.P.; data curation, T.H., M.T. and O.P.; writing—original draft preparation, T.H., M.T. and O.P.; writing—review and editing, T.H., M.T. and O.P.; visualization, T.H. and M.T.; supervision, T.H.; project administration, T.H.; All authors have read and agreed to the published version of the manuscript.
Funding
This research was funded by the Brno University of Technology (grant project No. FAST-S-20-6383).
Acknowledgments
The authors are thankful to three anonymous reviewers for their suggestions to improve the quality of this paper.
Conflicts of Interest
The authors declare no conflict of interest.
References
- Kron, W.; Muller, O. Efficiency of flood protection measures: Selected examples. Water Policy 2019, 21, 449–467. [Google Scholar] [CrossRef]
- Zeleňáková, M.; Fijko, R.; Labant, S.; Weiss, E.; Markovič, G.; Weiss, R. Flood risk modelling of the Slatvinec stream in Kružlov village, Slovakia. J. Clean. Prod. 2019, 212, 109–118. [Google Scholar] [CrossRef]
- Paprotny, D.; Sebastian, A.; Morales-Nápoles, O.; Jonkman, S.N. Trends in flood losses in Europe over the past 150 years. Nat. Commun. 2018, 9. [Google Scholar] [CrossRef]
- Dutta, D.; Herath, S.; Musiake, K. A mathematical model for flood loss estimation. J. Hydrol. 2003, 277, 24–49. [Google Scholar] [CrossRef]
- Kousky, C. Financing flood losses: A discussion of the national flood insurance program. Risk Manag. Insur. Rev. 2018, 21, 11–32. [Google Scholar] [CrossRef]
- Jonkman, S.N. Global perspectives on loss of human life caused by floods. Nat. Hazards 2005, 34, 151–175. [Google Scholar] [CrossRef]
- Brázdil, R.; Rezníčková, L.; Valášek, H.; Havlíček, M.; Dobrovolný, P.; Soukalová, E.; Řehánek, T.; Skokanová, H. Fluctuations of floods of the river Morava (Czech Republic) in the 1691-2009 period: Interactions of natural and anthropogenic factors. Hydrolog. Sci. J. 2011, 56, 468–484. [Google Scholar] [CrossRef]
- Floods 1997. Official Website of Povodí Moravy. Available online: http://www.pmo.cz/cz/uzitecne/povoden-1997/ (accessed on 15 January 2020).
- Chlebek, A.; Jařabáč, M. Catastrophic flooding in the Czech Republic since 5 July 1997. IAHS-AISH Publ. 2002, 271, 19–24. [Google Scholar]
- Tapia-Silva, F.O.; Itzerott, S.; Foerster, S.; Kuhlmann, B.; Kreibich, H. Estimation of flood losses to agricultural crops using remote sensing. Phys. Chem. Earth 2011, 36, 253–265. [Google Scholar] [CrossRef]
- Špitalar, M.; Gourley, J.J.; Lutoff, C.; Kirstetter, P.; Brilly, M.; Carr, N. Analysis of flash flood parameters and human impacts in the US from 2006 to 2012. J. Hydrol. 2014, 519, 863–870. [Google Scholar] [CrossRef]
- Prettenthaler, F.; Amrusch, P.; Habsburg-Lothringen, C. Estimation of an absolute flood damage curve based on an Austrian case study under a dam breach scenario. Nat. Hazard Earth Syst. 2010, 10, 881–894. [Google Scholar] [CrossRef]
- Merz, B.; Kreibich, H.; Schwarze, R.; Thieken, A. Review article “Assessment of economic flood damage”. Nat. Hazard Earth Syst. 2010, 10, 1697–1724. [Google Scholar] [CrossRef]
- Mendoza, M.T.; Schwarze, R. Sequential Disaster Forensics: A case study on direct and socio-economic impacts. Sustainability 2019, 11, 5898. [Google Scholar] [CrossRef] [Green Version]
- Grahn, T.; Nzberg, R. Damage assessment of lake floods: Insured damage to private property during two lake floods in Sweden 2000/2001. Int. J. Disast. Risk Reduct. 2014, 10, 305–314. [Google Scholar] [CrossRef]
- Korytárová, J.; Hromádka, V. Assessment of the flood damages on the real estate property in the Czech Republic area. Agric. Econ. 2010, 56, 317–324. [Google Scholar] [CrossRef] [Green Version]
- Zeleňáková, M.; Gaňová, L. A multicriteria flood hazard assessment in the selected countries. In Proceedings of the International Scientific Conference People, Buildings and Environment 2012, Lednice, Czech Republic, 7–9 November 2012; Brno University of Technology, Faculty of Civil Engineering: Brno, Czech Republic, 2012; pp. 645–651. [Google Scholar]
- Deniz, D.; Arneson, E.E.; Liel, A.B.; Dashti, S.; Javernick-Will, A.N. Flood loss models for residential buildings, based on the 2013 Colorado floods. Nat. Hazards 2017, 85, 977–1003. [Google Scholar] [CrossRef]
- Velasco, M.; Cabello, A.; Russo, B. Flood damage assessment in urban areas. Application to the Raval district of Barcelona using synthetic depth damage curves. Urban Water J. 2016, 13, 426–440. [Google Scholar] [CrossRef]
- Notaro, V.; De Marchis, M.; Fontanazza, C.M.; La Loggia, G.; Puleo, V.; Freni, G. The effect of damage functions on urban flood damage appraisal. Procedia Eng. 2014, 70, 1251–1260. [Google Scholar] [CrossRef] [Green Version]
- Glavan, I.; Prelec, Z. The analysis of trigeneration energy systems and selection of the best option based on criteria of GHG emission, cost and efficiency. Eng. Rev. 2012, 32, 131–139. [Google Scholar]
- Thieken, A.H.; Ackermann, V.; Elmer, F.; Kreibich, H.; Kuhlmann, B.; Kunert, U.; Maiwald, H.; Merz, B.; Müller, M.; Piroth, K.; et al. Methods for the evaluation of direct and indirect flood losses. In Proceedings of the 4th International Symposium on Flood Defence: Managing Flood Risk, Reliability and Vulnerability, Toronto, ON, Canada, 6–8 May 2008; Institute for Catastrophic Loss Reduction: Toronto, ON, Canada, 2008. [Google Scholar]
- Su, M.D.; Kang, J.L.; Chang, L.F. Industrial and commercial depth-damage curve assessment. WSEAS Trans. Environ. Dev. 2009, 5, 199–208. [Google Scholar]
- Freni, G.; La Loggia, G.; Notaro, V. Uncertainty in urban flood damage assessment due to urban drainage modelling and depth-damage curve estimation. Water Sci. Technol 2010, 61, 2979–2993. [Google Scholar] [CrossRef] [PubMed]
- Jongman, B.; Kreibich, H.; Apel, H.; Barredo, J.I.; Bates, P.D.; Feyen, L.; Gericke, A.; Neal, J.; Aerts, J.C.J.H.; Ward, P.J. Comparative flood damage model assessment: Towards a European approach. Nat. Hazards Earth Syst. Sci. 2012, 12, 3733–3752. [Google Scholar] [CrossRef] [Green Version]
- Tezuka, S.; Takiguchi, H.; Kazama, S.; Sato, A.; Kawagoe, S.; Sarukkalige, R. Estimation of the effects of climate change on flood-triggered economic losses in Japan. Int. J. Disast. Risk Reduct. 2014, 9, 58–67. [Google Scholar] [CrossRef]
- Shan, X.; Wen, J.; Zhang, M.; Wang, L.; Ke, Q.; Li, W.; Du, S.; Shi, Y.; Chen, K.; Liao, B.; et al. Scenario-based extreme flood risk of residential buildings and household properties in Shanghai. Sustainability 2019, 11, 3202. [Google Scholar] [CrossRef] [Green Version]
- Wu, X.; Zhou, L.; Gao, G.; Guo, J.; Ji, Z. Urban flood depth-economic loss curves and their amendment based on resilience: Evidence from Lizhong town in Lixia river and Houbai town in Jurong river of China. Nat. Hazards 2016, 82, 1981–2000. [Google Scholar] [CrossRef]
- Garrote, J.; Alvarenga, F.M.; Díez-Herrero, A. Quantification of flash flood economic risk using ultra-detailed stage–damage functions and 2-D hydraulic models. J. Hydrol. 2016, 541, 611–625. [Google Scholar] [CrossRef]
- McGrath, H.; Abo El Ezz, A.; Nastev, M. Probabilistic depth–damage curves for assessment of flood-induced building losses. Nat. Hazards 2019, 97, 1–14. [Google Scholar] [CrossRef]
- Kheiri, F. A review on optimization methods applied in energy-efficient building geometry and envelope design. Renew. Sustain. Energy Rev. 2018, 92, 897–920. [Google Scholar] [CrossRef]
- Mora, T.D.; Righi, A.; Peron, F.; Romagnoni, P. Cost-optimal measures for renovation of existing school buildings towards nZEB. Energy Procedia 2017, 140, 288–302. [Google Scholar] [CrossRef]
- Belniak, S.; Leśniak, A.; Plebankiewicz, E.; Zima, K. The influence of the building shape on the costs of its construction. J. Financ. Manag. Prop. Constr. 2013, 18, 90–102. [Google Scholar] [CrossRef]
- Cunningham, T. Factors Affecting the Cost of Building Work—An Overview. 2013. Available online: http://arrow.dit.ie/cgi/viewcontent.cgi?article=1028&context=beschreoth (accessed on 5 December 2019).
- Tuscher, M.; Hanák, T. Evaluation of flood losses to buildings: Effect of room dimensions. Period. Polytech. Soc. Manag. Sci. 2016, 24, 60–64. [Google Scholar] [CrossRef] [Green Version]
- Tuscher, M.; Přibyl, O.; Hanák, T. Influence of material composition of structures on the accuracy of flood loss evaluation. IOP Conf. Ser. Earth Environ. Sci. 2019, 222, 012017. [Google Scholar] [CrossRef]
- Kalkulační a Rozpočtovací Program KROS, Cenová Úroveň 2019 (Calculation and Budgeting Software KROS, Price Database 2019) [computer software]. ÚRS Praha: Prague, Czech Republic. Available online: https://www.pro-rozpocty.cz/software-a-data/kros-4-ocenovani-a-rizeni-stavebni-vyroby/ (accessed on 5 February 2020).
- Ram Jethmalani, C.H.; Simon, S.P.; Sundareswaran, K.; Srinivasa Rao Nayak, P.; Padhy, N.P. Real coded genetic algorithm based transmission system loss estimation in dynamic economic dispatch problem. Alex. Eng. J. 2018, 57, 3535–3547. [Google Scholar] [CrossRef]
- Wang, Z.; Gu, C.; Zhang, Z. Evaluation method of loss-of-life caused by dam breach based on GIS and neural networks optimized by genetic algorithms. Wuhan Daxue Xuebao (Xinxi Kexue Ban)/Geomat. Inf. Sci. Wuhan Univ. 2010, 35, 64–68. [Google Scholar]
- Afshar, A.; Rasekh, A.; Afshar, M.H. Risk-based optimization of large flood-diversion systems using genetic algorithms. Eng. Optim. 2009, 41, 259–273. [Google Scholar] [CrossRef]
- Li, J.; Liao, B.; Huang, M. Structural damage identification via modal data based on genetic algorithm. Presented at the 2010 International Conference on Computational Intelligence and Software Engineering, Wuhan, China, 10–12 December 2010. [Google Scholar] [CrossRef]
- El-Mihoub, T.A.; Hopgood, A.A.; Nolle, L.; Battersby, A. Hybrid genetic algorithms: A review. Eng. Lett. 2006, 13, 2–11. [Google Scholar]
- Wan, W.; Birch, J.J. An Improved Hybrid Genetic Algorithm with a New Local Search Procedure. J. Appl. Math. 2013, 2013, 103591. [Google Scholar] [CrossRef] [Green Version]
Figure 1.
Surface plot showing the dependence of the amount of loss on the side ratio and size of the room (depth of flooding 2.5 m).
Figure 1.
Surface plot showing the dependence of the amount of loss on the side ratio and size of the room (depth of flooding 2.5 m).

Figure 2.
The amount of unit loss in relation to the room side ratio (depth of flooding 0.5 m).

Figure 3.
Extended THP model (Tuscher–Hanák–Přibyl flood loss estimation model) diagram.

Figure 4.
Floor plans of buildings: (a) building used in variant A, (b) building used in variant B, (c) building used in variant C.
Figure 4.
Floor plans of buildings: (a) building used in variant A, (b) building used in variant B, (c) building used in variant C.


Figure 5.
Diagram of potential interconnection of the model and information system of an insurance company.
Figure 5.
Diagram of potential interconnection of the model and information system of an insurance company.


Table 1.
Characteristics of model rooms.
| RSG (Room Size Group) | Size of the Room [m2] | Initial Number of Model Rooms with Various SR | Adapted Number of Model Rooms with Various SR |
|---|---|---|---|
| RSG1 | 4 | 11 | 20 |
| RSG2 | 6 | 15 | 20 |
| RSG3 | 8 | 19 | 20 |
| RSG4 | 10 | 22 | 20 |
| RSG5 | 12 | 25 | 20 |
| RSG6 | 14 | 28 | 20 |
| RSG7 | 16 | 31 | 20 |
| RSG8 | 18 | 33 | 20 |
| RSG9 | 20 | 35 | 20 |
| RSG10 | 22 | 37 | 20 |
| RSG11 | 24 | 39 | 20 |
| RSG12 | 26 | 41 | 20 |
| RSG13 | 28 | 43 | 20 |
| RSG14 | 30 | 45 | 20 |
| TOTAL | - | 424 | 280 |
Table 2.
Statistical data on the frequency of percent errors for individual material variants of the primary model.
Table 2.
Statistical data on the frequency of percent errors for individual material variants of the primary model.
| PEPM [%] | Frequency of Occurrence for Individual Material Variants | |||||
|---|---|---|---|---|---|---|
| FV1-PV1 | FV1-PV2 | FV2-PV1 | FV2-PV2 | FV3-PV1 | FV3-PV2 | |
| 0.00–0.10 | 519 | 456 | 383 | 353 | 337 | 303 |
| 0.10–0.20 | 471 | 472 | 385 | 330 | 369 | 344 |
| 0.20–0.30 | 380 | 422 | 373 | 359 | 283 | 337 |
| 0.30–0.40 | 358 | 413 | 418 | 524 | 325 | 359 |
| 0.40–0.50 | 313 | 356 | 398 | 294 | 272 | 340 |
| 0.50–0.60 | 310 | 330 | 384 | 378 | 286 | 294 |
| 0.60–0.70 | 231 | 263 | 375 | 360 | 294 | 299 |
| 0.70–0.80 | 230 | 226 | 287 | 330 | 279 | 311 |
| 0.80–0.90 | 177 | 214 | 107 | 185 | 242 | 292 |
| 0.90–1.00 | 158 | 123 | 63 | 100 | 184 | 164 |
| 1.00–1.10 | 102 | 42 | 74 | 47 | 151 | 93 |
| 1.10–1.20 | 62 | 25 | 30 | 38 | 96 | 52 |
| 1.20–1.30 | 26 | 13 | 26 | 36 | 71 | 47 |
| 1.30–1.40 | 12 | 5 | 19 | 13 | 47 | 50 |
| 1.40–1.50 | 8 | 0 | 15 | 8 | 34 | 29 |
| 1.50–1.60 | 3 | 0 | 9 | 4 | 27 | 20 |
| 1.60–1.70 | 0 | 0 | 6 | 1 | 27 | 14 |
| 1.70–1.80 | 0 | 0 | 4 | 0 | 16 | 11 |
| 1.80–1.90 | 0 | 0 | 3 | 0 | 10 | 1 |
| 1.90–2.00 | 0 | 0 | 1 | 0 | 8 | 0 |
| 2.00–2.10 | 0 | 0 | 0 | 0 | 2 | 0 |
Table 3.
Minimum and maximum percent error values for individual material variants.
| Material Variant | PEPM Min [%] | PEPM Max [%] |
|---|---|---|
| FV1-PV1 | 0.0001 | 1.5393 |
| FV1-PV2 | 0.0000 | 1.3310 |
| FV2-PV1 | 0.0001 | 1.9500 |
| FV2-PV2 | 0.0003 | 1.6018 |
| FV3-PV1 | 0.0001 | 2.0316 |
| FV3-PV2 | 0.0003 | 1.8198 |
Table 4.
Detailed description of buildings.
| Building Variant | Room No. | Length | Width | Horizontal Construction | Vertical Construction | Window | Door—Doorframe |
|---|---|---|---|---|---|---|---|
| A | 1 | 3.46 | 2.74 | FV2 | PV1 | - | adjustable |
| 2 | 2.25 | 1.67 | FV2 | PV1 | - | adjustable | |
| 3 | 3.48 | 3.45 | FV1 | PV1 | plastic | adjustable | |
| 4 | 4.12 | 3.45 | FV1 | PV1 | plastic | adjustable | |
| 5 | 0.95 | 0.94 | FV2 | PV1 | - | adjustable | |
| 6 | 2.40 | 1.49 | FV2 | PV1 | - | adjustable | |
| 7 | 5.87 | 3.47 | FV3 | PV1 | plastic | adjustable | |
| 8 | 3.46 | 3.04 | FV1 | PV1 | plastic | adjustable | |
| B | 1 | 3.45 | 1.67 | FV2 | PV2 | - | adjustable |
| 2 | 3.45 | 3.03 | FV1 | PV2 | - | adjustable | |
| 3 | 2.39 | 1.80 | FV2 | PV2 | - | adjustable | |
| 4 | 7.70 | 7.09 | FV1 | PV2 | wooden | adjustable | |
| 5 | 3.82 | 3.45 | FV3 | PV2 | wooden | adjustable | |
| 6 | 3.77 | 3.45 | FV3 | PV2 | wooden | adjustable | |
| C | 1 | 7.70 | 1.20 | FV1 | PV1 | - | steel |
| 2 | 4.49 | 3.85 | FV1 | PV1 | plastic | steel | |
| 3 | 3.60 | 2.39 | FV2 | PV1 | plastic | steel | |
| 4 | 4.49 | 3.85 | FV3 | PV1 | plastic | steel | |
| 5 | 4.49 | 3.60 | FV2 | PV1 | plastic | steel | |
| 6 | 2.00 | 1.20 | FV2 | PV1 | - | steel | |
| 7 | 2.30 | 2.00 | FV2 | PV1 | plastic | steel |
Table 5.
Comparison of the amount of damage [EUR] determined by the extended THP model and the itemized budget.
Table 5.
Comparison of the amount of damage [EUR] determined by the extended THP model and the itemized budget.
| Building A | Building B | Building C | |
|---|---|---|---|
| Extended THP model | 8341.43 | 8585.03 | 7486.34 |
| Bill of costs | 8249.71 | 8556.42 | 7408.99 |
| PEEM | 1.11% | 0.33% | 1.04% |
© 2020 by the authors. Licensee MDPI, Basel, Switzerland. This article is an open access article distributed under the terms and conditions of the Creative Commons Attribution (CC BY) license (http://creativecommons.org/licenses/by/4.0/).
Share and Cite
MDPI and ACS Style
Hanák, T.; Tuscher, M.; Přibyl, O. Hybrid Genetic Algorithm-Based Approach for Estimating Flood Losses on Structures of Buildings. Sustainability 2020, 12, 3047. https://0-doi-org.brum.beds.ac.uk/10.3390/su12073047
AMA Style
Hanák T, Tuscher M, Přibyl O. Hybrid Genetic Algorithm-Based Approach for Estimating Flood Losses on Structures of Buildings. Sustainability. 2020; 12(7):3047. https://0-doi-org.brum.beds.ac.uk/10.3390/su12073047
Chicago/Turabian StyleHanák, Tomáš, Martin Tuscher, and Oto Přibyl. 2020. "Hybrid Genetic Algorithm-Based Approach for Estimating Flood Losses on Structures of Buildings" Sustainability 12, no. 7: 3047. https://0-doi-org.brum.beds.ac.uk/10.3390/su12073047
Note that from the first issue of 2016, this journal uses article numbers instead of page numbers. See further details here.