Article

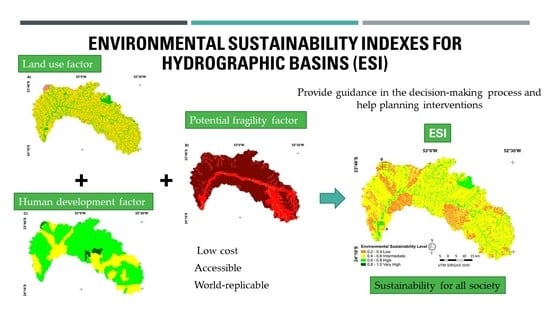
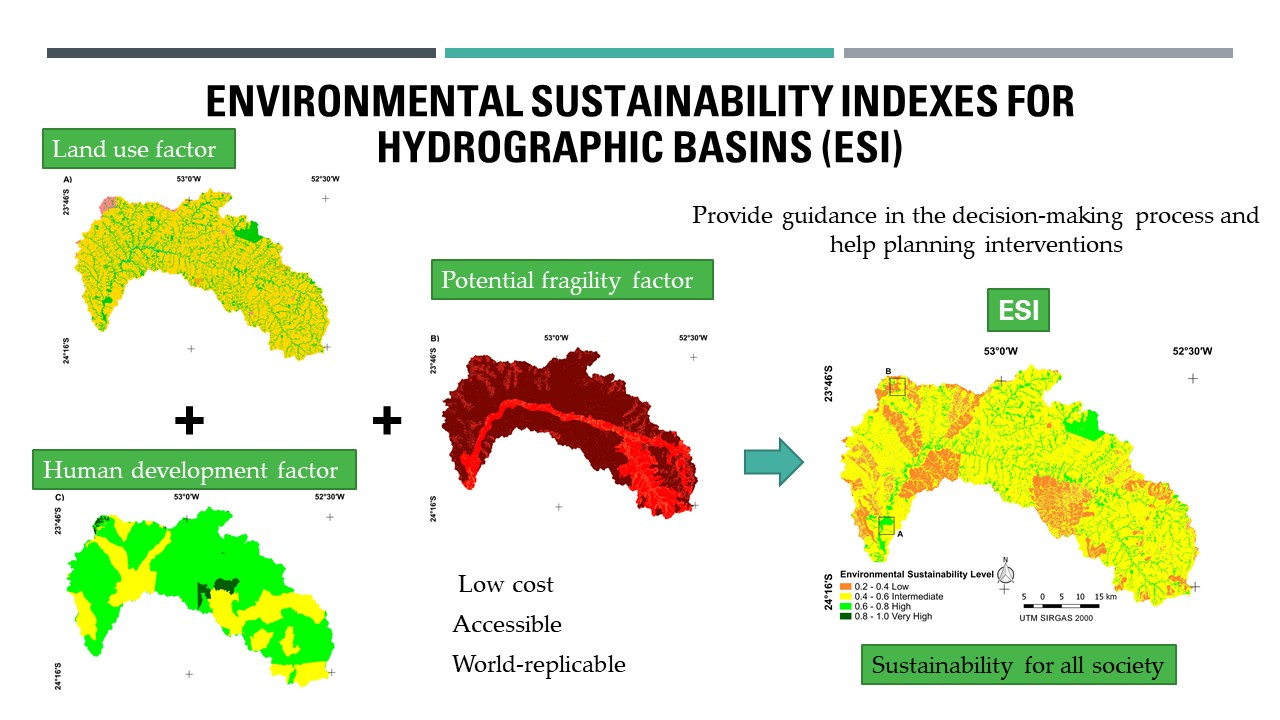
Integrating Environmental, Geographical and Social Data to Assess Sustainability in Hydrographic Basins: The ESI Approach

by
Edivando Vitor do Couto
1,2,*,
Pablo B. Oliveira
1,
Luciane Maria Vieira
1,
Marcelo H. Schmitz
2 and
José Hilário D. Ferreira
1
1
Academic Department of Biodiversity and Conservation of Nature (DABIC) Federal Technological University of Paraná, Campo Mourão, Paraná 87301-899, Brazil
2
Department of Biology, Postgraduate Programme in Continental Aquatic Environments Ecology, State University of Maringa, Maringa, Paraná 87020-900, Brazil
*
Author to whom correspondence should be addressed.
Sustainability 2020, 12(7), 3057; https://0-doi-org.brum.beds.ac.uk/10.3390/su12073057
Submission received: 17 March 2020 / Revised: 6 April 2020 / Accepted: 8 April 2020 / Published: 10 April 2020
(This article belongs to the Section Sustainability in Geographic Science)

Abstract

:
The elaboration of environmental sustainability indexes (ESI) aims to describe the complexity between social, environmental and ecological health. These indexes play a crucial role by helping stakeholders during the decision-making process and by identifying possible sites that require practical sustainable actions. In this study, we aim to elaborate an ESI for hydrographic basins. We use three factors to build the index: land use; vulnerability to soil degradation and topographic land attributes; and human development. The human development factor includes the dimensions of education, sanitation, longevity and income. These three factors are recommended by the Organization for Economic Cooperation and Development and reflect the pressure–state–impact assessment model. To verify the effectiveness of the proposed ESI, we applied it in a hydrographic basin located in southern Brazil. The sustainability level variation in the basin was classified into five groups: very low (0%), low (17%), intermediate (72%), high (11%) and very high (0%). The predominance of the intermediate sustainability level was found to mainly owe to the extent of agricultural land and the high degree of susceptibility to soil erosion in areas with low environmental conservation. In areas with native vegetation, environmental sustainability was found to be higher than in areas with other land use types. The resulting ESI will help facilitate future studies in environmental, economic or social dimensions in any hydrographic basin.

Graphical Abstract

1. Introduction

The concept of sustainable development emerged in the context of growing awareness of an impending ecological crisis, which was widely debated in the 1972 Club of Rome Report, the 1972 United Nations (UN) Stockholm Conference, the 1987 Brundtland Report titled “Our Common Future”, the 1992 UN Conference on Environment and Development (Rio-92) and the 2012 UN Conference on Natural Development (Rio +20) [1,2,3].
The UN Sustainable Development Goals for 2030 strive towards inclusive growth, eradicating poverty and preserving environments [4], goals that may not always align with each other. The relationship between development and the environment has been studied extensively since the 1990s, documenting inverted U-shaped relations between per capita income and indicators of environmental degradation [5]. To evaluate the environmental sustainability of a region, a set of information containing economic, social and environmental aspects is needed [6]; however, these data are interdisciplinary and difficult for a non-specialist to interpret. Under the circumstances, indicators and indexes represent tools that may be capable of simplifying complex data, in order to provide guidance in decision-making processes and help planning interventions, to make sustainable development a reality [7,8].
The development and use of sustainability indicators can be considered an active and practical area of research, with several interactive applications. Indicators aim to assign a value that describes the complexity between social, environmental and ecological health [9]. This approach plays a crucial role by generating data about questions related to the environment and its implications for planning, strategies and political decisions [10,11].
Sustainability indexes are composed of indicators. These provide compact and objective information to manage and develop policies. Index results can be widely understood and applied by public and private organizations, to achieve an adequate level of environmental sustainability [12,13]. Therefore, weighting and aggregating relevant sustainability indicators are necessary steps in any evaluation of sustainability indexes [14]. However, with growing public desire for sustainability [15], the need to assess and quantify our societies’ sustainability has become a challenge of our time [16,17]. The application and construction of sustainability indexes are considered so effective that researchers have proposed this approach in a range of contexts, including urban sustainability [18], industrial sustainability [19] and energy sustainability [20].
Numerous efforts have also been made to develop sustainability indexes that support decision makers, managers, government agencies and international institutions in the land management of hydrographic basins [21,22]. However, substantial information is produced at different spatial and temporal scales and it is often not georeferenced. This makes it difficult to develop indexes that can measure sustainability, especially in the case of hydrographic basins. In practice, governments are often resistant to managing at the hydrographic basin scale, because in many cases they exceed political-administrative territorial boundaries [23].
Although efforts in this direction have yielded good results [12,21], the final resolution resulting from the indexes is not spatial. A map with different levels of sustainability represented continuously across a hydrographic basin would help simplify planning decisions and order the territory within the basin, but this is still a gap. Current outputs can facilitate comparisons between hydrographic basins and evaluate their sustainability [21]. A major advance in ensuring a more detailed spatial index for hydrographic basins has been developed—on the Strahler scale classification—in which the final resolution contains discrete values for second- and third-order sub-basins, thereby enabling comparisons between sub-basins [24].
Other sustainability indexes have been developed to support decision making in water use management [25]. Values for these indexes have been estimated by the simulation of the anthropized water cycle, adopting data employed by basins’ management boards in the water planning process. Unlike most indictors that only focus on water resources (blue water), this analysis incorporates the degree of rainwater use (green water) and the level of water pollution in surface and groundwater. Such a wider focus provides an overall picture of the basin’s environmental sustainability. However, aspects related to society and human development have yet to be incorporated. For groundwater, the concept of an analytical hierarchy process has been used to create the main sustainability components—the three criteria and associated aspects and indicators—of a hierarchy, which appropriately cover environmental sustainability issues of groundwater resources in the target area [22]. One study has sought to develop an institutional sustainability indicator with an emphasis on social conflicts and the conservation of protected areas on river banks [26], while another has proposed an assessment of the pollution of water resources [27]. Although neither example is dedicated to measuring sustainability through an index, both present indicators of environmental quality.
Although progress has been made in developing a sustainability index for hydrographic basins, a gap remains in the implementation of data integration. Basin indicator gaps include factors of land use, vulnerability to soil degradation and human development. A successful human development factor has been recommended by the Organization for Economic Cooperation and Development (OECD), comprising education, sanitation, longevity and income dimensions [28]. In combination, this constitutes a spatial index that can be represented on a map, with different levels of sustainability presented continuously.
Our aim here is to develop an environmental sustainability index (ESI) for hydrographic basins. We develop our ESI using a geographic information system (GIS) and execute geoprocessing and remote sensing. We compose the ESI of three factors: a land use factor (LUF), a potential fragility factor (PFF) and a human development factor (HDF). We use this ESI to identify the sustainability levels of a hydrographic basin in southern Brazil.
The ESI approach presents low operational costs, as the data composing the index are publicly and financially accessible. This fact contributes to its broader application in the environmental, economic or social dimensions of any hydrographic basin in any region of the world. This will surely facilitate and enhance technical-scientific knowledge, planning and management processes, to strengthen public policies and achieve environmental sustainability, to the benefit of all society.

2. Materials and Methods
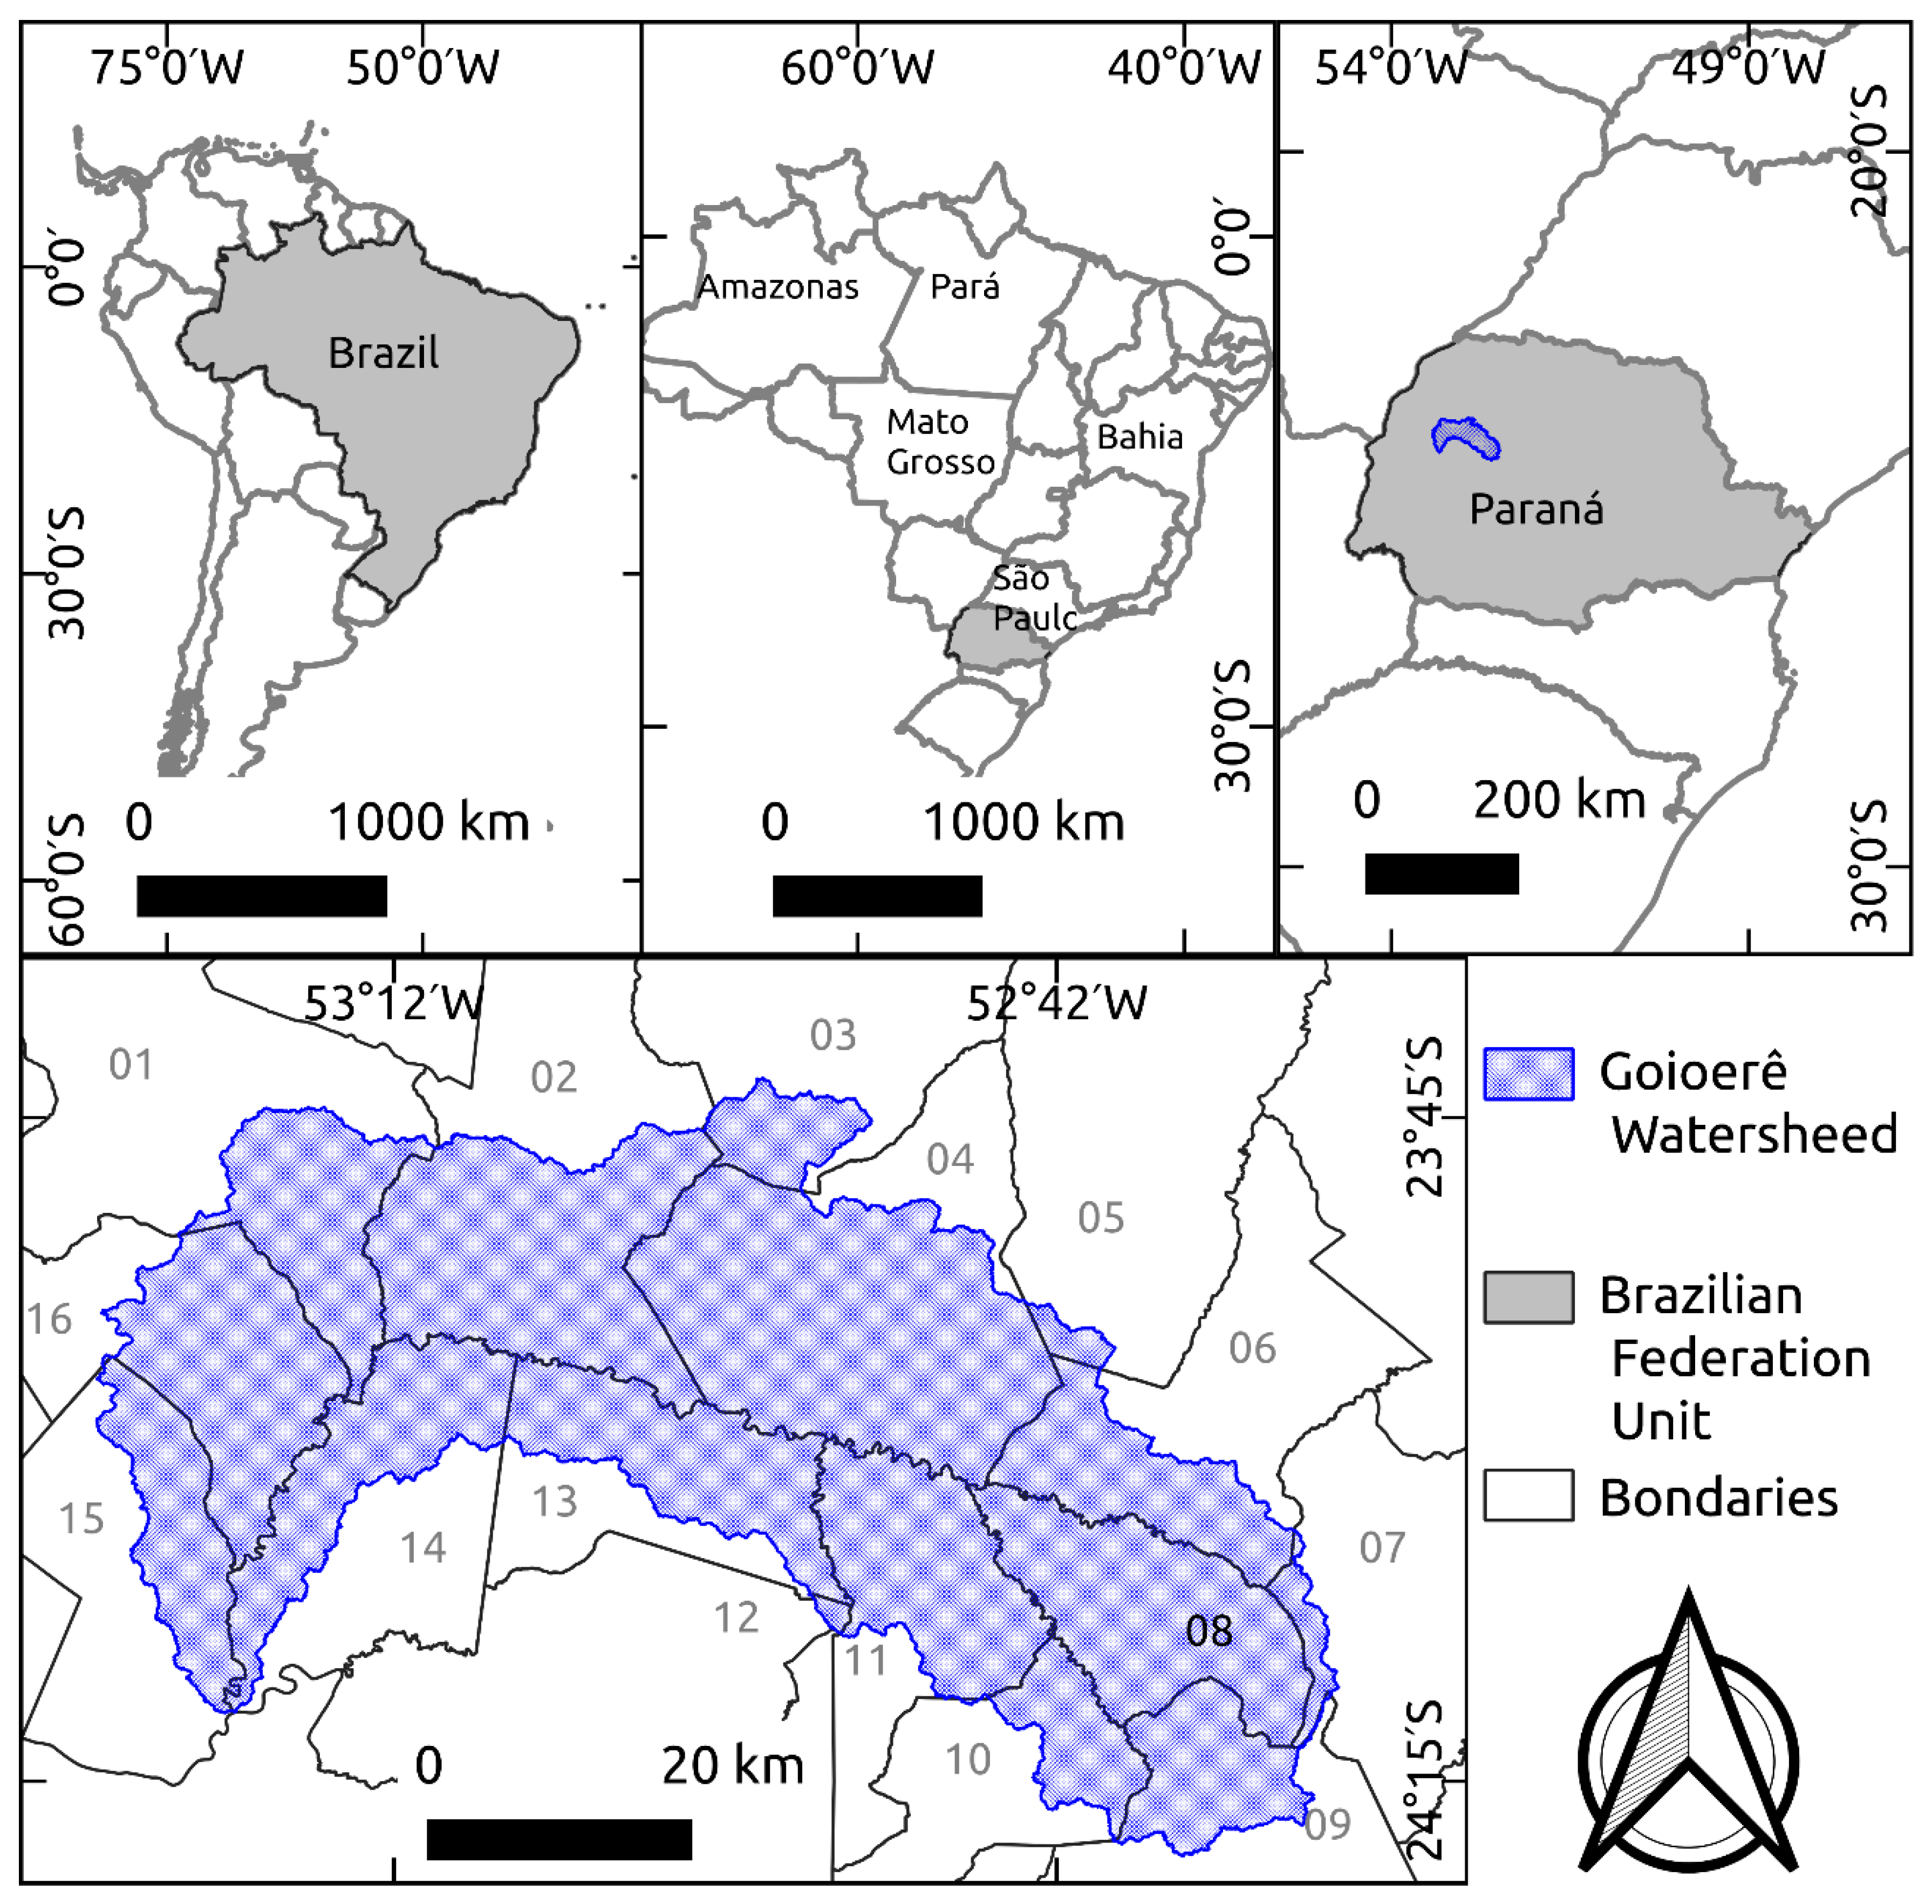
2.1. Study Area

The study area is the hydrographic basin of the Goioerê River (HBGR), a tributary of the right bank of the Piquiri River, Brazil. The HBGR is located in the south of Brazil, specifically in the northwest of the Paraná state, which also contains the basin of the Paraná River, the second largest hydrographic basin in Brazil, with a drainage area of 3036 km2 (Figure 1) [29].
The HBGR is located in a climatic unit of transition between tropical and subtropical climates. It has an average annual rainfall of 1700 mm. The predominant climate is humid temperate, with an average temperature of 18 °C in the coldest month and 22 °C in the warmest [30].
The forest cover of the region comprises one phytophysiognomy of the Atlantic Forest biome. The semi-deciduous seasonal forest is characterized by the dual climatic seasonality of the upper tree strata, with the typical tree species Aspidosperma polyneuron Müll. Arg. (Apocynaceae) [31].
The HBGR is located in the region responsible for the second largest producer of commodities in Brazil; this region is home to one of the largest agribusiness hubs in Latin America, accounting for about 12% of the gross nominal value of agricultural production in the Paraná state in 2016. The main crops in the region are based on agricultural extension systems, and the main productions are soybeans, corn, wheat, beans, animal agriculture, and sugar alcohol production, that has expanded rapidly over the past twenty years [29].
In demographic terms, the municipalities that compose HBGR are considered small cities. The largest urban centers are Umuarama (90,105 inhabitants), Cianorte (82,620 inhabitants), and Campo Mourão (94,859 inhabitants). The other municipalities have less than 18,000 inhabitants. With respect to demographic distribution in these municipalities, the proportion of inhabitants living in urban centers varies from 39% to 45% [32]. According to this author, although with restricted economic and urban roles, these small cities still constitute living spaces for a significant part of the local population.
The region in which HBGR is located is classified as an economic stagnation area. It also has one of the lowest human development indexes (HDI) in the Paraná state [29,32].
Historically, the occupation process in the central-western region was intensified during the 1940s, due to the encounter of two population flows: one related to the expansion of coffee production, coming from the north of Paraná; and the other composed of individuals from west Rio Grande do Sul and Santa Catarina states, linked to family-owned mixed farms. The mode of production organized and managed by families prevailed until the early 1970s, when the region joined a broader movement for the modernization and mechanization of agriculture in Paraná. This process had an intense impact on demographic dynamics. The population growth rate from 1991 to 2000 was negative (−1.24% per year), which reflects the intense process of rural exodus. The difficulty in retaining the population was diagnosed in urban and rural areas [32].
Fundamental factors for the region to be characterized as undergoing a population emptying process are: (a) the concentration of land and the resulting unemployment of family rural labor; and (b) lack of employment and income opportunities for young people. The economy of the region is based on agro-industry. It is estimated that 77% of the HBGR soils are suitable for mechanized agricultural practice. As a result, the original vegetation cover has been largely reduced in favor of agricultural use of the land. The effects are evident when observing the highly fragmented landscape [29,31,32].
This region has historically been going through several economic crises. The main reason is the fact that the soil and rocky substrate are very sandy, which leads to the occurrence of strong soil erosion processes. Without proper management and technology, these processes hinder the development of family farming in the region. As a consequence, the region is currently occupied by large agribusiness monopolies for the production of commodities and sugarcane for the production of ethanol [29].

2.2. Geographical Database

For the elaboration of the LUF of the HBGR, we used images from the Sentinel-2 satellite, MSI sensor. These images have a 10-metre spatial resolution. All images were taken on 20 July 2017 and made available by the European Space Agency in band 2 (490 nm), band 3 (560 nm), band 4 (665 nm) and band 8 (842 nm). For the digital image processing, we used the Spring GIS [33]. Image segmentation was performed using the region growth method by applying a value of 400 for the similarity threshold and a value of 10 for the area threshold. The classification of the images was performed via photointerpretation, using the semi-automatic supervised classification algorithm through the Bhattacharya method.
The elevation range data of the HBGR area were obtained from the ALOS-PALSAR satellite made available by the Japan Aerospace Exploration Agency [34]. These data were used to produce the digital elevation model (DEM), in order to generate topographic attributes such as the slope and the necessary contours for the calculation of the PFF.
For the construction of the HDF map, we obtained socioeconomic development data for the municipalities that incorporate the HBGR through the Brazilian Institute of Geography and Statistics [35]. We used data from the 2010 census conducted in Brazil, as well as the 2014 cartographic database [36].
A database was developed in QGIS 2.18 [37] to assist in the ESI composition for the HBGR and the generation of thematic maps.

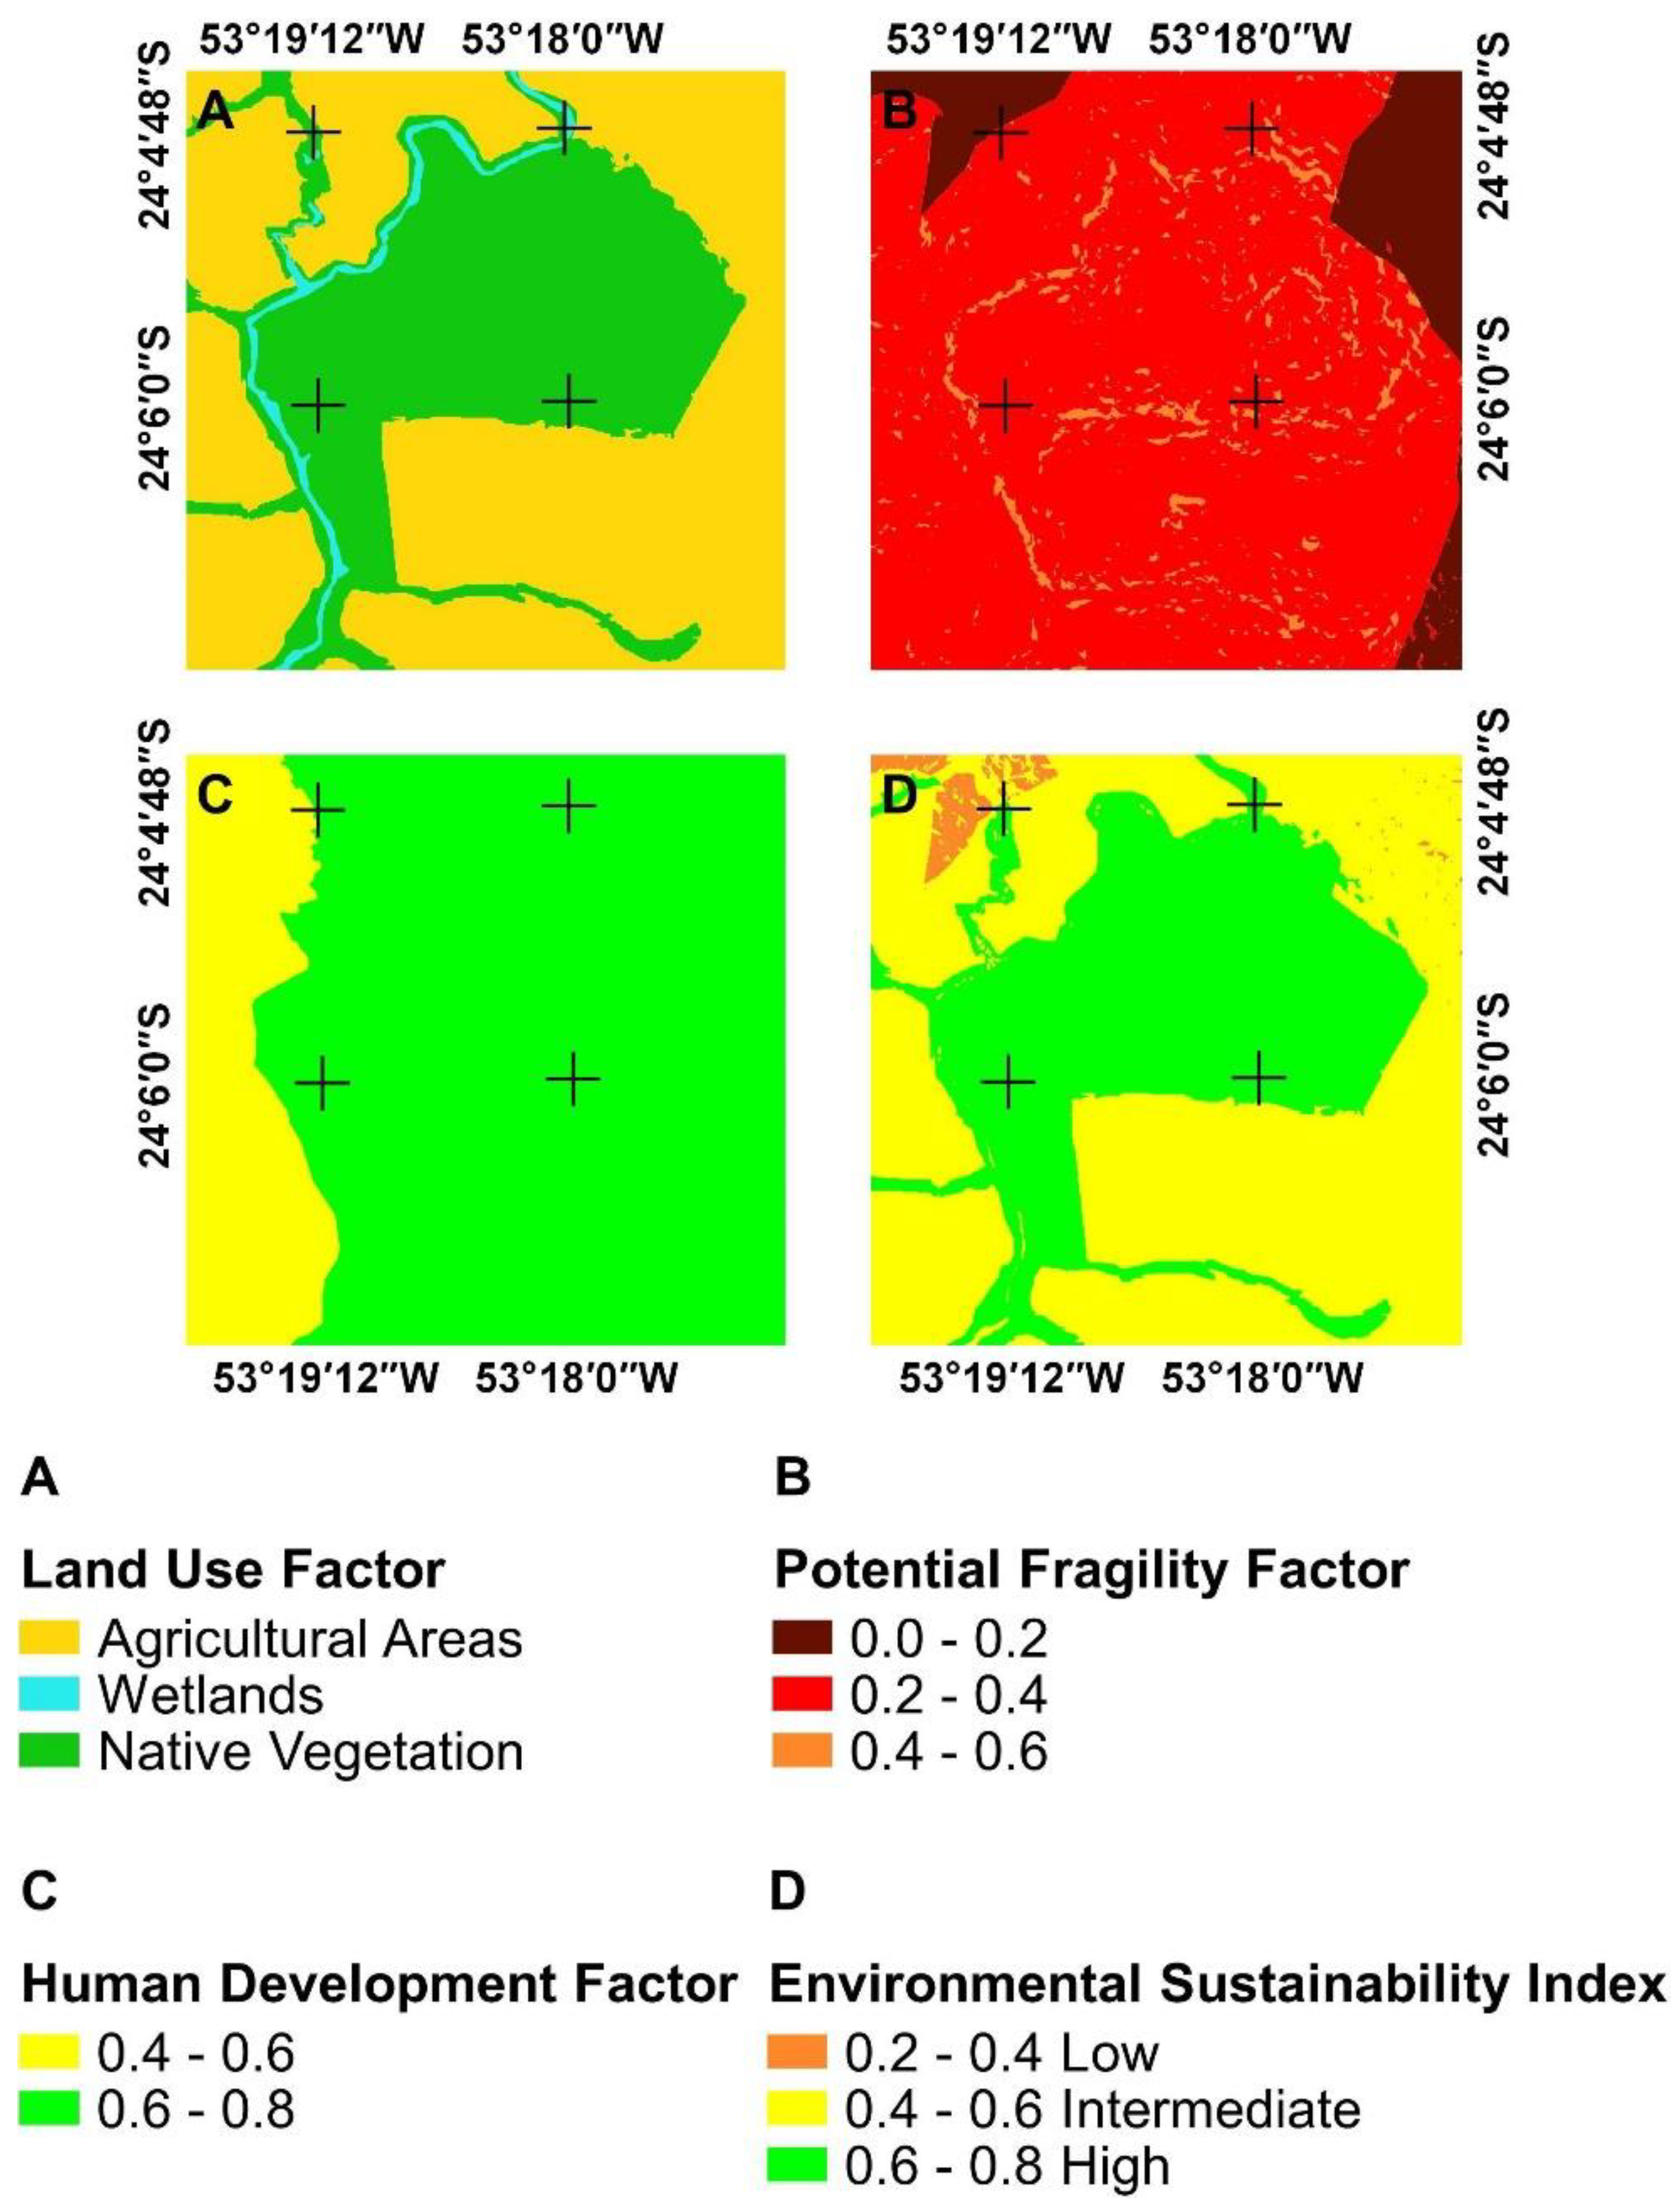
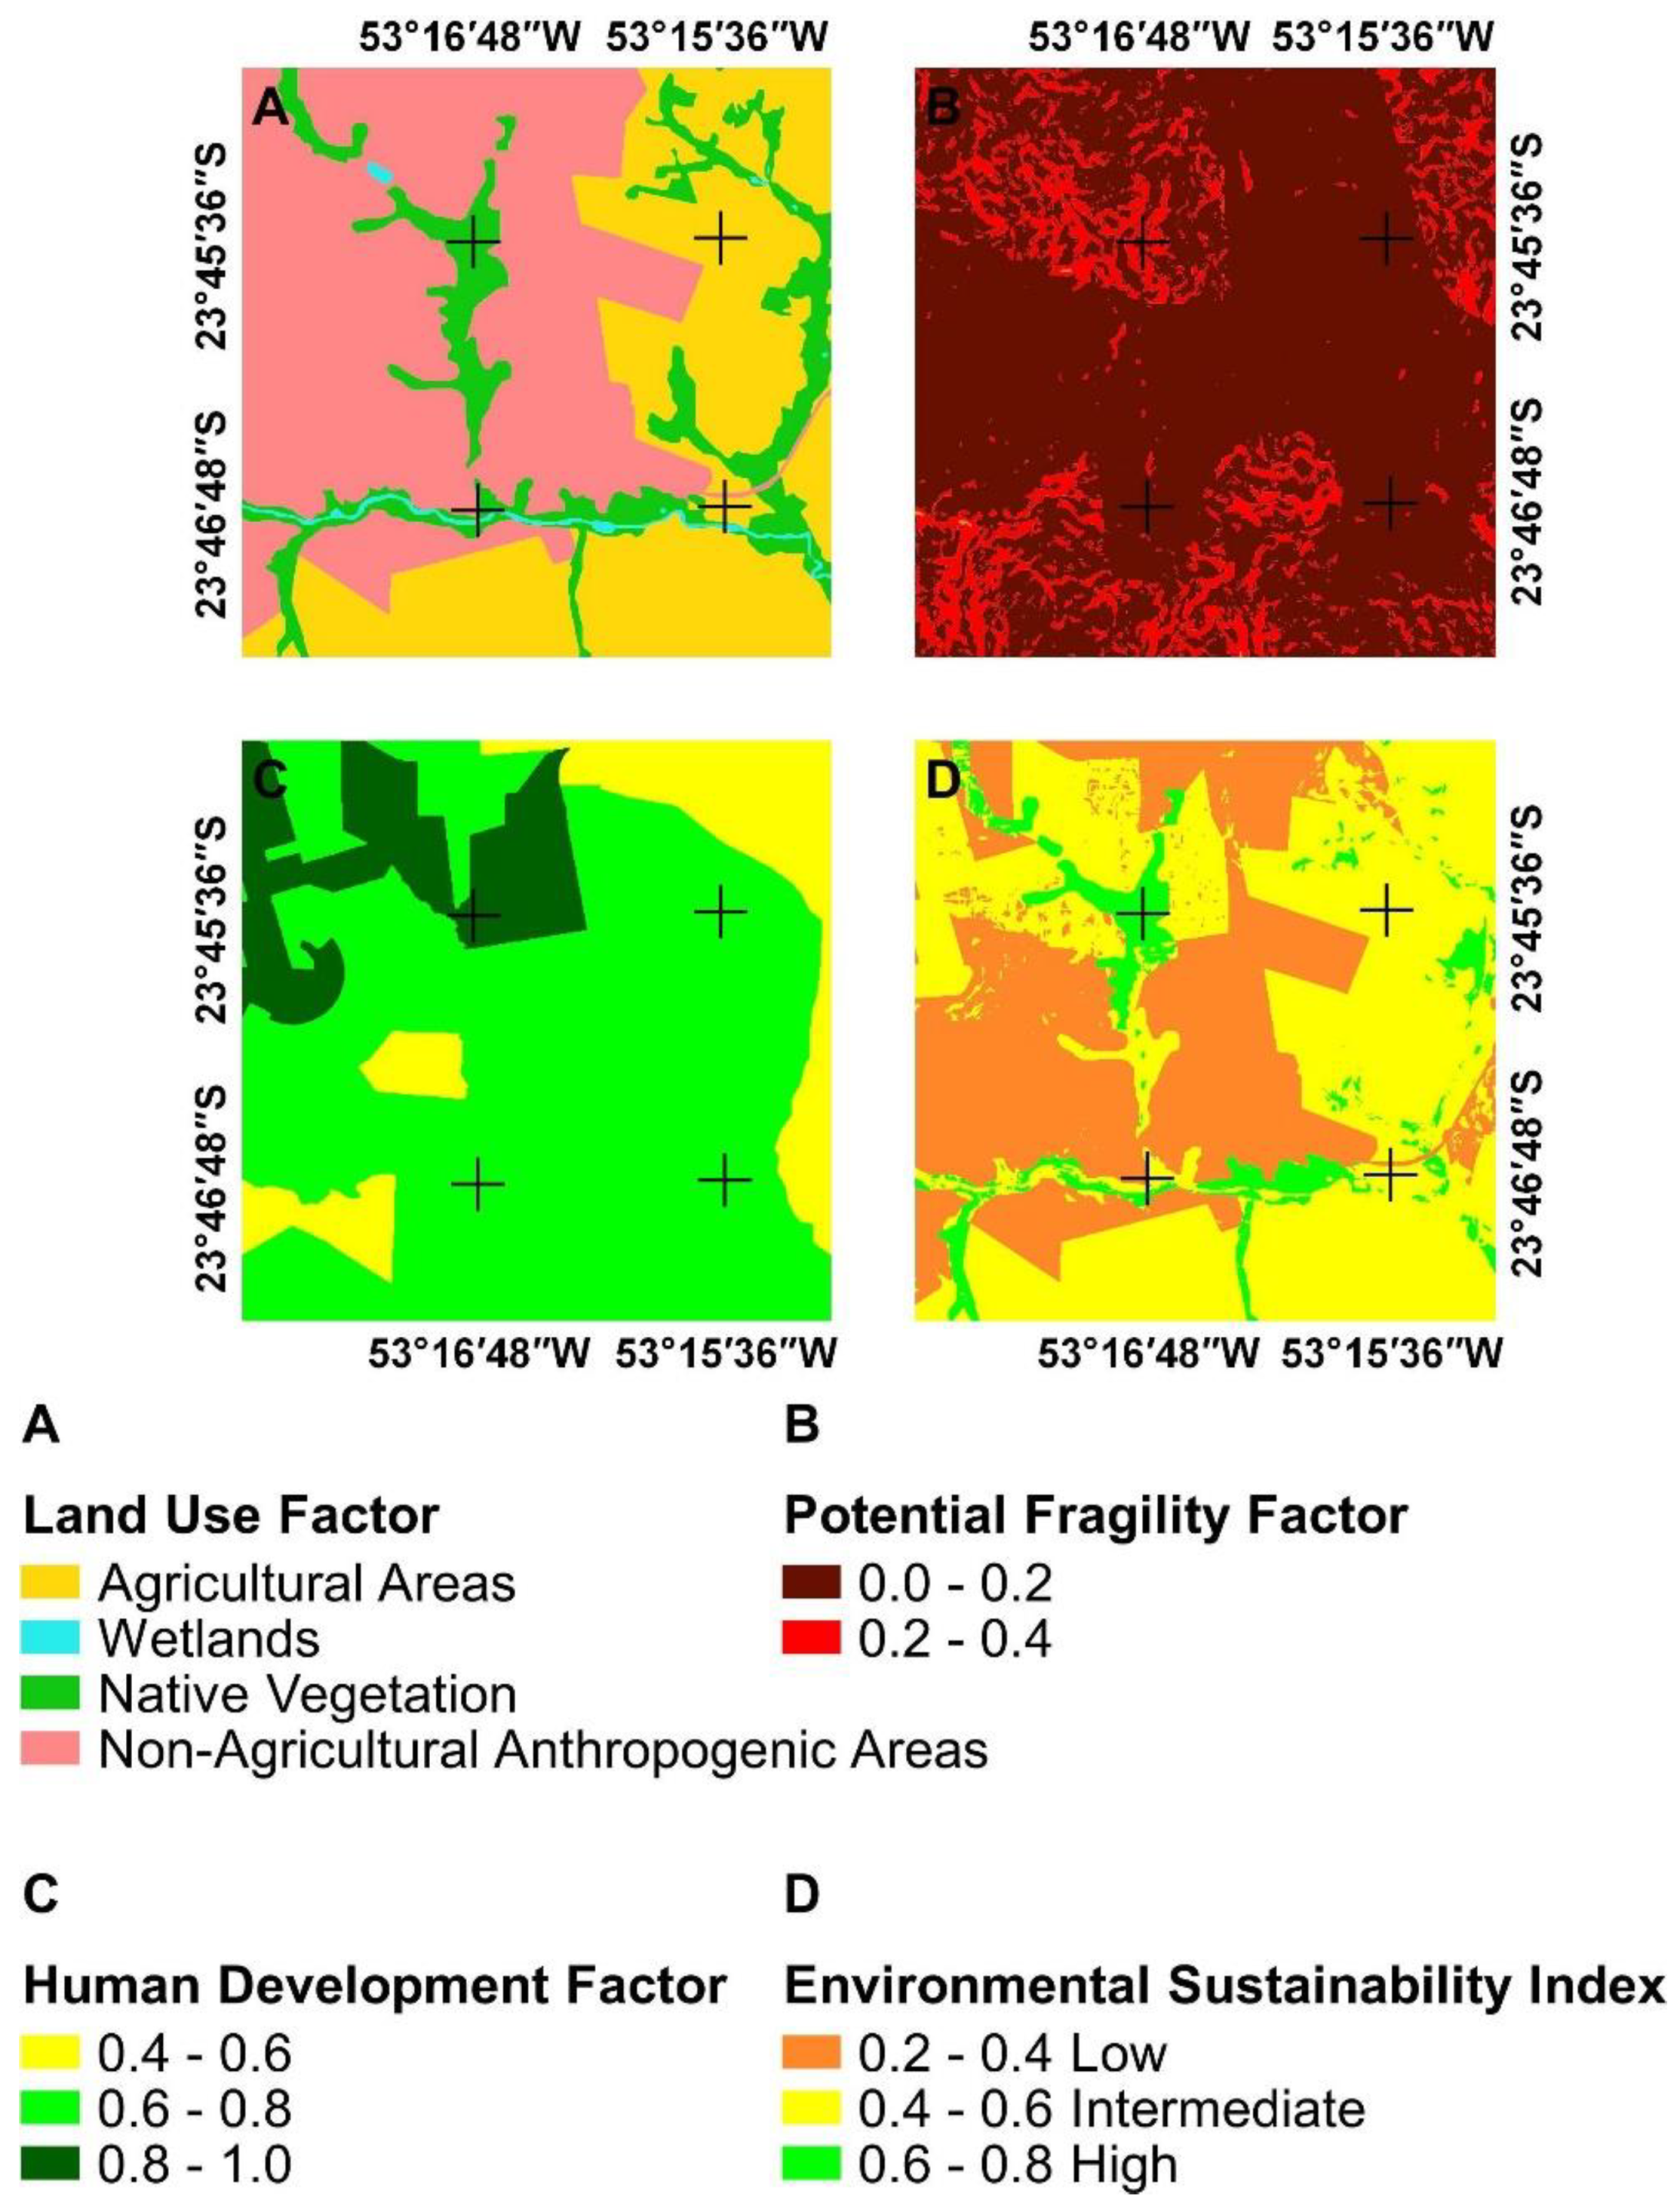
2.3. Sustainability Index Factors for the Hydrographic Basins

The ESI presented here is a new version based on previous work [12,13,21,24,28]. It was implemented in GIS by means of an algorithm developed in spatial language for algebraic geoprocessing (LEGAL). For the calculation of the ESI, we opted to assign equal weights to the three dimensions: (1) land use factor (LUF) corresponds to the pressures exerted by the development model; (2) potential fragility factor (PFF) corresponds to the geomorphological and pedological state of the HBGR; and (3) human development factor (HDF) corresponds to the impact of the development model adopted by society and to the effect of the actions taken. These factors reflect the proposed aspects of the evaluation model “pressure-state-impact/effect-response” (PSI/ER) [21] recommended by the OECD [28].

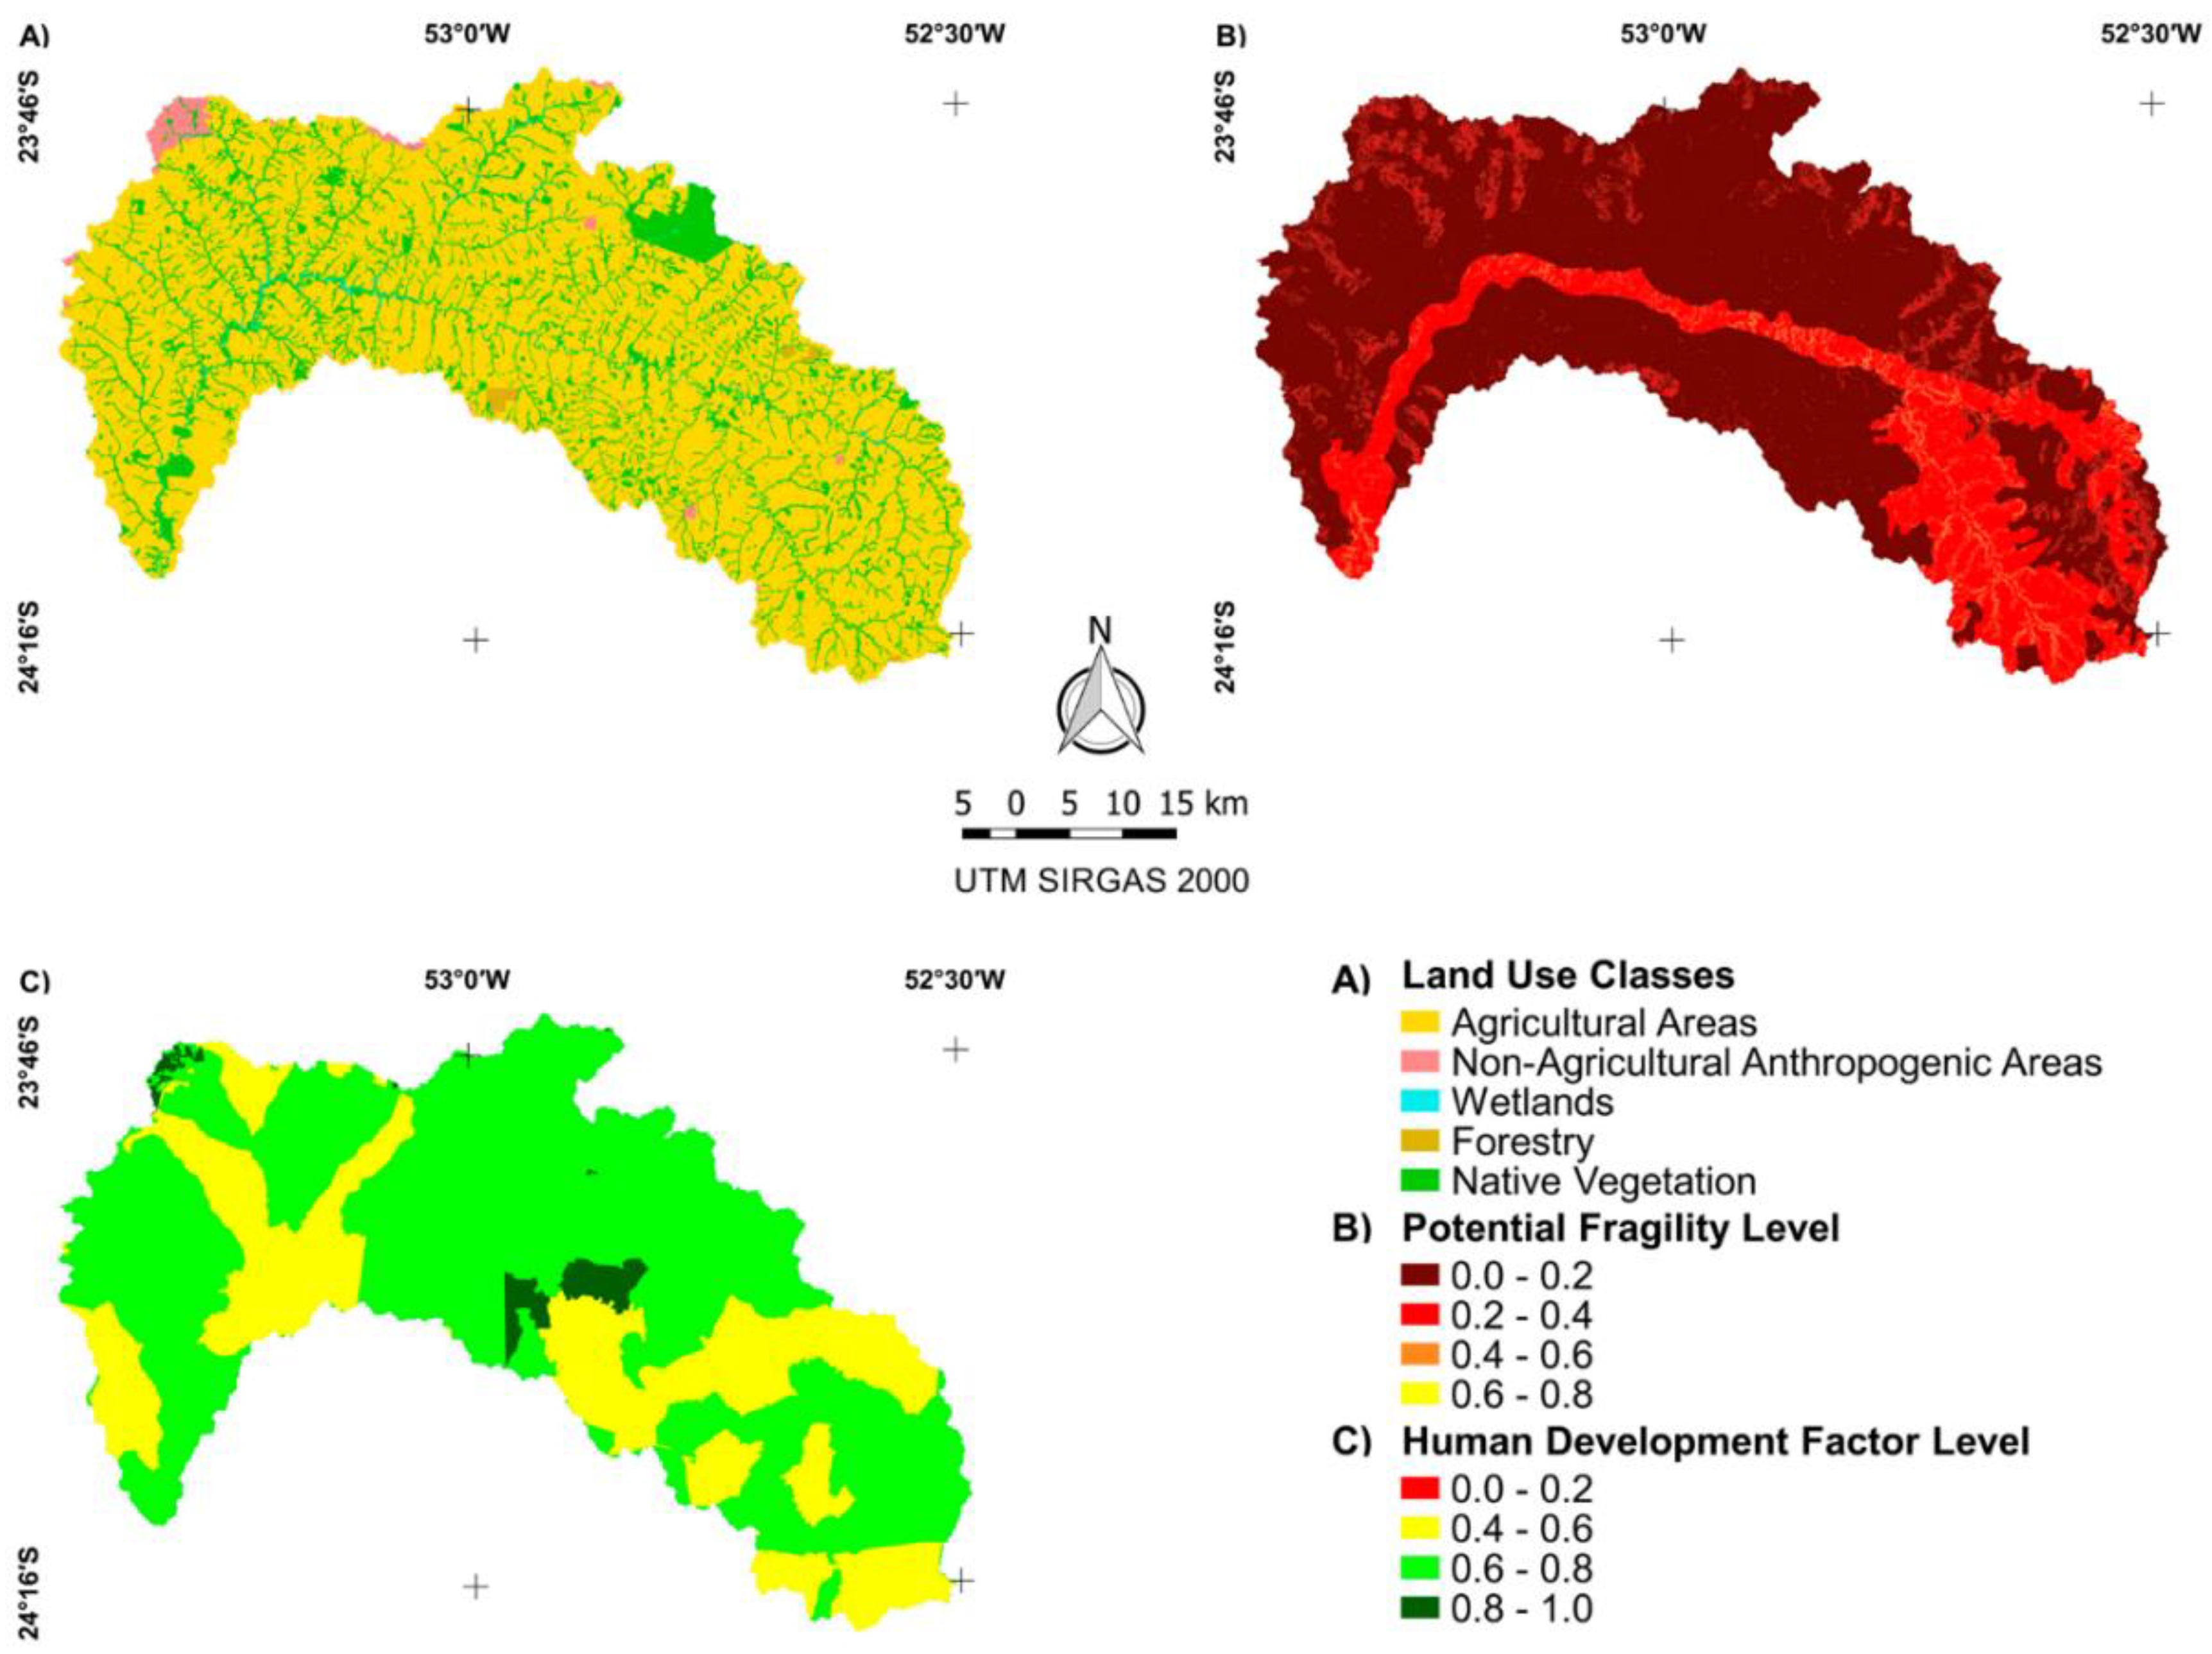
2.4. Calculation of LUF

The land use classification presented essential information for the calculation of the index. For each type of land use, we assigned a value according to the impacts it generates on the environment.
Land use classes with the respective weight required for the calculation were non-agricultural anthropic areas (0.25), rural areas (0.50), silviculture (0.625), wetlands (0.875) and native vegetation (1.00). For the attribution of these weights to the classes, we considered the degree of protection and the degree of susceptibility to the erosive processes suffered. We also incorporated the effects of the variation of the permeability of the forest edge in relation to the landscape matrix [38,39,40,41]. Greater weight was given to areas that experienced less anthropogenic interference. The LUF were determined according to Equation (1).
L U F = S
where LUF is the land use factor and S is the weight (0 ≤ S ≤ 1) assigned to each land use class in the basin.

2.5. Calculation of PFF

We used topographic attribute data obtained from the DEM using the ALOS-PALSAR [33] altimetric data. All data came from the study area that reported the physical aspects of the HBGR and that contributed to the ESI.
The PFF was calculated by applying the LEGAL algorithm over the slope data (SD) of the study area, joined with soil texture data (TD) obtained from the soil map of the Paraná state [42] (Equation (2)). The textures and their respective weights found in the study area were texture (0.4), sand (0.1) and clay (1). In the attribution of these weights, we took into account the susceptibilities that each texture presents, in relation to erosion and the topographic attributes of the terrain [43,44].
P F F = S D + T D
where PFF is the potential fragility factor, SD is the slope data and TD is the soil texture data.

2.6. Calculation of HDF

The HDF was calculated using the municipal human development index (MHDI), alongside information from the 2010 demographic census of Brazil [44], using the guidelines proposed by the United Nations Development Program (UNDP) [45] (Equation (3)).
The MHDI is typically composed of the dimensions of education, longevity and income. For this study we adapted the MHDI to additionally include the basic sanitation dimension, comprising the use of water resources and the rate of sewage collection, while also considering the socioeconomic status of the communities. This information has never before been included in sustainability index.
H D F = H D I E + H D I S + H D I L + H D I I 4
where HDF is the human development factor, HDIE is the education dimension, HDIS is the sanitation dimension, HDIL is the longevity dimension and HDII is the income dimension.
The HDF’s basic unit of analysis was the census section of the IBGE. The values of the four proposed dimensions were later assigned to each of the sectors by an algorithm (see Supplementary Materials).
The units of the census sectors were analyzed according to the five ranges of municipal human development recommended by the UNDP [45]: very low (less than 0.5), low (between 0.5 and 0.6), medium (between 0.6 and 0.7), high (between 0.7 and 0.8) and very high (greater than or equal to 0.8).
The HDIE referred to the literacy rate of the population (60% of HDIE) and the average number of years of study of the heads of municipal households (64% of HDIE) (Equation (4)). These are good indicators in determining the number of years studied by dependents under 18 years of age (in Brazil, children under 18 years are considered to be financially dependent on their parents).
H D I E = ( L R x 0.60 ) + ( A N Y S x 0.40 )
where HDIE is the education dimension, LR is the literacy rate (0 ≤ LR ≤ 1) and ANYS is the average number of years of study (0 ≤ ANYS ≤ 1).
The HDIS considered the water supply rate (RWS; 30% of HDIE), the sewage collection rate (RCS; 30% of HDIE), the collected garbage rate (CGR; 30% of HDIE) and the number of residents per household (RPH; 30% of HDIE) (Equation (5)). It was not possible to include the urban drainage rate, because these data are not present in the 2010 IBGE census.
H D I S = ( R W S x 0.30 ) + ( R C S x 0.30 ) + ( C G R x 0.30 ) + ( R P H x 0.10 )
where HDIS is the sanitation dimension, RWS is the water supply rate (0 ≤ RWS ≤ 1), RCS is the sewage collection rate (0 ≤ RCS ≤ 1), CGR is the collected garbage rate (0 ≤ CGR ≤ 1) and RPH is the number of residents per household (0 ≤ RPH ≤ 1).
The longevity dimension considered the municipal human development index (Equation (6)) regarding the longevity factor.
H D I L = M H D I L x L F
where HDIL is the longevity dimension, MHDIL is the municipal human development index in the longevity dimension and LF is the longevity factor.
The longevity factor considered the number of inhabitants in the census sectors who exceed the average life expectancy at birth (LLB) of the municipality in years. This value does not include the number of years by which an individual exceeds the LLB, or the sector in which the individual resides. We based the estimations of LF on the following considerations: if the sector does not reach the estimated LLB for the municipality, then LF = 0; if the sector reaches the estimated LLB for the municipality but does not exceed, then LF = 1 and HDIL = MHDIL; if the sector exceeds the estimated LLB for the municipality, then LF will increase the value of MHDIL. In the HBGR, LLB had an average of 74 (± 1.12) n = 16.
The calculation of the longevity factor established, as a reference, the average census area that exceeds the estimated LLB for the municipality to which it belongs (Equations (7) and (8)).
L L B + ( n º i n h a b i t a n t s   e x c e e d i n g   L L B x A g e ) n º i n h a i t a n t s   e x c e e d i n g   L L B
L F = 1 + ( L L B + ) ( L L B ) L L B
where LLB+ is the average age above the LLB verified for each sector of the municipality. According to the estimated LLB for each municipality, LF is the percentage to be increased in MHDIL if the sector exceeds LLB estimated for the municipality.
The income dimension considered the per capita income of those responsible for permanent private households in Brazilian real (BRL, the currency of Brazil). This excludes minimum and maximum reference values, according to the standards presented by the UNDP [45] (Equation (9)).
H D I I = ( log P C I ) ( log R V M I N ) ( log R V M A X ) ( log R V M I N )
where HDII is the income dimension, PCI is the per capita income of those responsible for permanent private households, RVMIN is the minimum reference value and RVMAX is the maximum reference value.
The minimum reference value present in the calculation was BRL 8.00 and the maximum reference value was BRL 4033. This was the lowest income value per capita among the top 10% richest residents of the federation unit with the highest average income in the country–the Federal District–based on the demographic census of the IGBE [36].
At the end of the process of acquiring data concerning the three factors (LUF, PFF and HDF), the LEGAL algorithm was applied, resulting in the ESI for the HBGR.

2.7. Calculation of the ESI

The ESI was expressed numerically between zero and one. The closer the value is to one, the better the sustainability condition of the basin (Equation (10)).
E S I = L U F + P F F + H D F 3
where the ESI is the basin’s environmental sustainability index (0 ≤ ESI ≤ 1), LUF is the land use factor, PFF is the potential fragility factor and HDF is the human development factor.

3. Results

3.1. Results for the Factors

The use of remote sensing made it possible to classify LUF in the HBGR as follows: agricultural areas 80.7%, non-agricultural anthropic areas 1.4%, wetlands 0.9%, silviculture 0.3% and remaining fragments of native vegetation 16.6% (Figure 2A).
Most of the sub-basins in the HBGR revealed a high (73.4%; PFF = 0–0.2) or moderately high (24.3%; PFF = 0.2–0.4) level of susceptibility to erosive processes. Medium, moderately low and low susceptibility accounted for 2.3%, 0.0009% and 0%, respectively. Thus, it is clear that almost every sub-basin has a high degree of susceptibility to erosive processes, indicating a considerable risk of degradation in the HBGR (Figure 2B).
In order to determine the HDF, it was necessary to calculate education, sanitation, longevity and income in relation to each census sector, as this was the smallest scale of data available for the calculation (Figure 2C). The HBGR has 242 census sectors defined by the IBGE [29,35], of which 2.9% belong to the municipality of Alto Piquirí, 2.5% to Araruna, 2.5% to Boa Esperança, 1.2% to Campo Mourão, 0.8% to Cianorte, 12% to Cruzeiro do Oeste, 5% to Farol, 0.4% to Goioerê, 7% to Janiópolis, 2% to Mamborê, 2.9% to Mariluz, 5.8% to Moreira Sales, 1.2% to Perobal, 6.2% to Tapejara, 7% to Tuneiras do Oeste and 40.5% to Umuarama municipality (Figure 1). The results indicated that the HDF in the HBGR was distributed as follows: 0% of the census sectors presented a level between 0 and 0.2; 0, 1% were between 0.2 and 0.4; 31% were between 0.4 and 0.6; 66.7% were between 0.6 and 0.8; and 2.2% were between 0.8 and 1.0 (Figure 2C).

3.2. Environmental Sustainability Index (ESI)

The level of sustainability in the HBGR was distributed into five classes with different proportions of occurrence: very low 0%, low 16.6%, intermediate 72.6%, high 10.8% and very high 0% (Figure 3). This distribution demonstrates the predominance of intermediate and low sustainability, followed by high sustainability in certain areas of the HBGR.

4. Discussion

The HBGR presented only 10.8% of the high ESI. This was mainly due to the low values found for the PFF, HDF and LUF throughout the basin, demonstrating that the HBGR has poor sustainability indicators. However, a positive result is that in areas where the native vegetation has been preserved, environmental sustainability exhibited a much higher level than in areas with other types of use (Figure 2A and Figure 3). Nevertheless, there is a predominance of agricultural areas in the HBGR, which can be mostly explained by its location within one of the largest centers of agribusiness in Latin America [46,47]. Agribusiness and a recent increase in urban infrastructure are responsible for the fragmentation and deforestation of the Atlantic rainforest in the western-central region of the Paraná state [46,47,48,49,50].
The absence of native vegetation in the hydrographic basin has created critical areas, as agricultural areas represent 80.72% of the landscape. Forests play an important role in the control and regulation of water quality [51] and diminish the amount of erosion that can leach soil into the waterways [52]. In the Johor River Basin of Malaysia, it has been recognized that the hydrological cycle is influenced by land use change, as areas composed of agriculture increased runoff and groundwater flow and decreased percolation [53]. Furthermore, massive agricultural expansion in the Kelantan River Basin of Malaysia had a significant impact on current flow, directly influencing the leaching and silting of the river and consequently reducing the hydrographic basin’s sustainability index as a whole [54].
We must also emphasize the significance of the PFF in the ESI result, as most of the basin expressed very low and low values (0–0.2 and 0.2–0.4), indicating high susceptibility to erosion (Figure 2B). It is important to highlight that the geological substrate of the HBGR consists of Caiuá group (sandstone) [55] and is highly susceptible to intense erosive processes, where strong morphodynamical processes alter river patterns [56]. This susceptibility reinforces the need for the planning and sustainable management of natural resources in the HBGR.
When we analyzed the PFF together with land use, we noticed that areas where the basin presented high erosive potential were accompanied by an absence of native vegetation, resulting in lower ESI. According to McMahon et al. [57], this relationship between the inclination of the slope and vegetation intervenes in the dynamic effects of the slope; indeed, areas that present larger declivities with an absence of vegetation are predisposed to erosive processes. The consequences of erosion include the pollution of water bodies and wetlands and the reduction of agricultural land productivity, thereby degrading natural resources and negatively influencing the HDF [58].
The variation in our HDF results makes it difficult to achieve sustainable levels for this factor. Moreover, reaching an optimal condition demands a balance between education, sanitation, longevity and income. According to the five bands of municipal development proposed by the UNDP [45], 97.82% of the HBGR has a HDF range between the low and medium levels (between 0.4 and 0.8). In order to reach satisfactory levels of HDF in education, it is necessary to optimize educational activities in a broad way. Therefore, this should be the focus of public policy [59].
To achieve adequate levels of sanitation development, it is essential that public agencies aim to provide health services to the population. Health services are an important sustainability indicator because they lead to a better quality of life [60]. By providing potable water, health services facilitate the reduction of diseases, increase environmental safety and diminish the lack of sanitation, this being a threat to water and soil resources [60].
We also highlight that Brazil’s national health system (i.e., Sistema Único de Saúde (SUS) in Portuguese) has been an outstanding success. The vision of a system providing “health for all” emerged towards the end of the military dictatorship that started in 1964 and during the years of political opposition, that was to a large extent framed in terms of access to health care. This struggle culminated in the 1988 constitution, which enshrined health as a citizens’ right and which requires the state to provide universal and equal access to health services. Therefore, strengthening Brazil’s national health system through financial investments is very important for improving the population’s quality of life and, consequently, improving the ESI.
To achieve acceptable and sustainable longevity values, it is necessary to monitor a set of constitutive characteristics, including health and sanitation, among others. These factors are decisive for the social well-being of a locality or region. An individual’s socioeconomic level, education and access to health equipment (geographically) can contribute to changes in longevity. The availability of basic care in local communities also has a positive impact on public health and consequently on the continuity of productive activities [61].
We adopted the income indicator per capita in BLR for our analyses. This indicator assists in the understanding of patterns of consumption and production and is considered one of the basic indicators to observe the behavior of an economy [62].
In order for Brazil to move towards sustainability (social, economic and environmental), much larger investments should be made to expand natural protected areas and sanitation (environmental dimension). The focus of the economic dimension should be to improve income distribution, housing conditions and security. In addition, economics must rethink consumption patterns in a more sustainable way. Lastly, decision makers should strive for greater investments in research and development [63].
Water resource management is of considerable importance in achieving sustainable human development, as water use takes many forms, including food production, health conditions, the security of domestic water supply and basic sanitation [64,65].
We emphasize the importance of interactions between the factors composing the ESI presented. This interaction has a direct influence on environmental sustainability. For example, areas with native vegetation, low PFF and medium-high HDF can attain a high level of environmental sustainability (see Figure A1, A to D in Appendix A). This is because forests protect the soil from erosion, thereby preserving local biodiversity and water resources (which are also important for carbon capture), a hallmark of highly sustainable environments. In this aspect, we can highlight an important protected area of the Atlantic Forest biome, the Biological Reserve of Perobas. Measuring 8716 ha, this is the largest area with native vegetation located northeast of the HBGR. Indeed, the Perobas Reserve is an integral protection area categorized for the use of natural resources (SNUC in Portuguese–Federal Law 9985/2000). However, Brazilian biodiversity is undergoing numerous attacks and misguided policies that aim to reduce protected areas (PA), with the argument of expanding agribusiness to improve the country’s economic performance [66,67].
In areas seeing considerable anthropization, characterized by lower values of PFF and a medium-high level of HDF, there are low values of environmental sustainability. This demonstrates the major influence of LUF and HDF in the ESI (see Figure A2, A to D in Appendix B).
The HBGR presented more than 72% predominance of intermediate ESI values (0.4–0.6). The main drivers of this result were aspects such as LUF being primarily agricultural (temporary crops of monocultures) and the predominance of low values of PFF, as the sandy pedological structure presents a high degree of susceptibility to erosion. The hydrographic basin of the Pitimbu River in northeastern Brazil was classified as a “potentially critical conflict” in 2000 and was subsequently downgraded to “critical conflict” in 2015 [27]. This reclassification was justified by the fact that there was an increase in the use and occupation of irregular land in areas of permanent preservation, along the banks of the rivers composing the basin. The Cambé River watershed (southern Brazil) was also identified as highly unsustainable, containing water bodies suffering from water scarcity and/or pollution, due to the overexploitation of aquifers and the presence of agricultural areas in the region [68,69].
Applying an ESI to river hydrographic basins allows us to assess whether a river basin is on a sustainable growth trajectory. It is difficult to evaluate the impact of indexes and indicators on the progress of environmental sustainability in a context of changes in public decisions with regards to sustainable development [70]. Nevertheless, indexes and indicators have a significant effect, because they make general problems and weaknesses visible, and thereby raise awareness to stakeholders and decision makers [71].

5. Conclusions

The construction and application of an ESI for a hydrographic basin using geoprocessing and remote sensing tools has yielded consistent results, facilitating an assessment of its sustainability patterns at a synoptic scale and revealing that it is not on a sustainable growth trajectory. This represents important knowledge for stakeholders during the decision-making process, because it enables—in an easily understandable way—the prompt identification of areas that should be central to the focus of practical sustainability actions.
Furthermore, the strong influence of the land use and occupation factor has highlighted the relevance of the human component in the basin. Highly anthropized areas, allied with greater susceptibility to soil erosion, represented the main factors leading to lower sustainability values. This highlights the importance of finding a balance between social, environmental/spatial and ecological aspects during the allocation of new cities, settlements, agricultural areas or other kinds of human interference in the environment.
The ESI developed here presents quick answers to decision makers and can be developed with free data and in free software. In addition, it is easy to apply, and can be developed anywhere in the world.

Supplementary Materials

The following is available online at https://0-www-mdpi-com.brum.beds.ac.uk/2071-1050/12/7/3057/s1: Algorithm A1: Algorithm of the Environmental Sustainability Index.

Author Contributions

All of the authors have read and agreed to the published version of the manuscript. Conceptualization, E.V.D.C. and P.B.O.; methodology, E.V.D.C., P.B.O., L.M.V., J.H.D.F.; software, E.V.D.C. and J.H.D.F.; writing—original draft preparation, E.V.D.C., P.B.O.; writing—review and editing, E.V.D.C., M.H.S., L.M.V. All authors have read and agreed to the published version of the manuscript.

Funding

Coordenação de Aperfeiçoamento de Pessoal de Nível Superior-Brasil (CAPES)-Finance Code 88882.344486/2019-01.

Acknowledgments

The authors acknowledge Federal University of Technology, Paraná (UTFPR), Campus Campo Mourão for providing the institutional infrastructure and for paying to make this publication open access. This study was financed in part by the Coordenação de Aperfeiçoamento de Pessoal de Nível Superior-Brasil (CAPES)-Finance Code 88882.344486/2019-01. We also thank Eudes José Arantes for suggesting the subject of study.

Conflicts of Interest

The authors declare no conflict of interest.

Appendix A

Figure A1. Representation of the four factors in the protected area, Paraná State, Brazil.
Sustainability 12 03057 g0a1

Appendix B

Figure A2. Representation of the four factors in a highly anthropized region within the Goioerê River hydrographic basin.
Sustainability 12 03057 g0a2

References

  1. Du Pisani, J. Sustainable development–Historical roots of the concept. Environ. Sci. 2006, 3, 83–96. [Google Scholar] [CrossRef]
  2. Hák, T.; Janoušková, S.; Moldan, B. Sustainable Development Goals: A need for relevant indicators. Ecol. Indic. 2016, 60, 565–573. [Google Scholar] [CrossRef]
  3. Report of the World Commission on Environment and Development. Our Common Future; Oxford University Press: Oxford, UK, 1987. [Google Scholar]
  4. United Nations General Assembly. Road Map towards the Implementation of the United Nations Millennium Declaration—Report of the Secretary-General; Fifty-Sixth Session: New York, NY, USA, 2001. [Google Scholar]
  5. Andrée, B.; Chamorro, A.; Spencer, P.; Koomen, E.; Dogo, H. Revisiting the relation between economic growth and the environment; A global assessment of deforestation, pollution and carbon emission. Renew. Sustain. Energy Rev. 2019, 114, 109221. [Google Scholar] [CrossRef]
  6. Özdemir, E.; Härdtlein, M.; Jenssen, T.; Zech, D.; Eltrop, L. A confusion of tongues or the art of aggregating indicators—Reflections on four projective methodologies on sustainability measurement. Renew. Sustain. Energy Rev. 2011, 15, 2385–2396. [Google Scholar] [CrossRef]
  7. Braga, T.; Freitas, A.; Duarte, G.; Carepa-Sousa, J. Índices de sustentabilidade municipal: O desafio de mensurar. Nova Econ. 2004, 14, 11–33. [Google Scholar]
  8. Turnhout, E.; Hisschemöller, M.; Eijsackers, H. Ecological indicators: Between the two fires of science and policy. Ecol. Indic. 2007, 7, 215–228. [Google Scholar] [CrossRef]
  9. Todorov, V.; Marinova, D. Modelling sustainability. Math. Comput. Simul. 2011, 81, 1397–1408. [Google Scholar] [CrossRef] [Green Version]
  10. Kemerich, P.; Martins, S.; Kobiyama, M.; Buriol, G.; Borba, W.; Ritter, L. Avaliação da sustentabilidade ambiental em bacias hidrográficas mediante a aplicação do modelo P-E-R. Revista Eletrônica em Gestão Educação e Tecnologia Ambiental 2013, 10. [Google Scholar] [CrossRef] [Green Version]
  11. Dizdaroglu, D. The role of indicator-based sustainability assessment in policy and the decision-making process: A review and outlook. Sustainability 2017, 9, 1018. [Google Scholar] [CrossRef] [Green Version]
  12. Vieira, P.; Studart, T. Proposta metodológica para o desenvolvimento de um índice de sustentabilidade hidro- Ambiental de áreas serranas no semiárido Brasileiro - Estudo de caso: Maciço de Baturité, Ceará. Revista Brasileira de Recursos Hídricos 2009, 14, 125–136. [Google Scholar] [CrossRef]
  13. Silva, L.; Lima, E. Índice de sustentabilidade da dimensão ambiental da bacia hidrográfica do Rio Banabuiú, CE. Espaço Aberto 2017, 7, 71–85. [Google Scholar] [CrossRef]
  14. Gan, X.; Fernandez, I.; Guo, J.; Wilson, M.; Zhao, Y.; Zhou, B.; Wu, J. When to use what: Methods for weighting and aggregating sustainability indicators. Ecological Indicators 2017, 81, 491–502. [Google Scholar] [CrossRef]
  15. Kates, R.; Clark, W.; Corell, R.; Hall, J.; Jaeger, C.; Lowe, I.; McCarthy, J.; Schellnhuber, H.; Bolin, B.; Dickson, N.; et al. Environment and development. Sustainability science. Science 2001, 292, 641–642. [Google Scholar] [CrossRef]
  16. Böhringer, C. Measuring the immeasurable: A survey of sustainability indices. Ecol. Econ. 2006, 63, 1–8. [Google Scholar] [CrossRef] [Green Version]
  17. Sachs, J. The Age of Sustainable Development; Columbia University Press: New York, NY, USA, 2015; p. 544. [Google Scholar]
  18. Childers, D.; Cadenasso, M.; Grove, J.; Marshall, V.; McGrath, B.; Pickett, S. An ecology for cities: A transformational nexus of design and ecology to advance climate change resilience and urban sustainability. Sustainability 2015, 7, 3774–3791. [Google Scholar] [CrossRef] [Green Version]
  19. Leigh, M.; Li, X. Industrial ecology, industrial symbiosis and supply chain environmental sustainability: A case study of a large UK distributor. J. Clean. Prod. 2015, 106, 632–643. [Google Scholar] [CrossRef]
  20. Franzitta, V.; Curto, D.; Rao, D. Energetic sustainability using renewable energies in the Mediterranean Sea. Sustainability 2016, 8, 1164. [Google Scholar] [CrossRef] [Green Version]
  21. Chaves, H.; Alipaz, S. An integrated indicator based on basin hydrology, environment, life, and policy: The watershed sustainability index. Water Resour. Manag. 2006, 21, 883–895. [Google Scholar] [CrossRef]
  22. Bui, N.T.; Kawamura, A.; Bui, D.D.; Amaguchi, H.; Bui, D.D.; Truong, N.T.; Du, H.H.T.; Nguyen, C.T. Groundwater sustainability assessment framework: A demonstration of environmental sustainability index for Hanoi, Vietnam. J. Environ. Manag. 2019, 24, 479–487. [Google Scholar] [CrossRef]
  23. Nyerges, T. Linked Visualizations in Sustainability Modeling: An Approach Using Participatory GIS for Decision Support; Association of American Geographers Illustrated: Los Angeles, CA, USA, 2002; p. 18. [Google Scholar]
  24. Couto, O. Geração de um Índice de Sustentabilidade Ambiental para Bacias Hidrográficas em áreas Urbanas Através do Emprego de Técnicas Integradas de Geoprocessamento. Master’s Thesis, Universidade Federal do Rio Grande do Sul, Porto Alegre, Brazil, 2007. [Google Scholar]
  25. Pellicer-Martínez, F.; Martínez-Paz, J. The Water Footprint as an Indicator of Environmental Sustainability in Water Use at the River Basin Level. Sci. Total Environ. 2016, 571, 561–574. [Google Scholar] [CrossRef]
  26. Oliveira, V.; Reis, L. Conflitos em áreas de preservação permanente na bacia hidrográfica do rio Pitimbu-RN: Proposta de um indicador institucional sustentável. Guaju 2017, 3, 91. [Google Scholar] [CrossRef] [Green Version]
  27. Silva, D.; Albuquerque Filho, J.; Oliveira, R.; Lourenço, R. Metodologia para análise do potencial de degradação dos recursos hídricos em bacias hidrográficas/Methodology for potential degradation analysis of water resources in watershed]. Caderno de Geografia 2017, 27, 455. [Google Scholar] [CrossRef] [Green Version]
  28. Organisation for Economic Co-operation and Development (OECD). OECD Environmental Indicators: Development, Measurement and Use; OECD: Paris, France, 2003. [Google Scholar]
  29. Instituto Paranaense de Desenvolvimento Econômico e Social (IPARDES). 2017. Available online: www.ipardes.gov.br (accessed on 19 December 2019).
  30. Alvares, C.A.; Stape, J.L.; Sentelhas, P.C.; Gonçalves, J.L.M.; Sparovek, G. Köppen’s climate classification map for Brazil. Meteorologische Zeitschrift 2013, 22, 711–728. [Google Scholar] [CrossRef]
  31. Tomadon, L.; Dettke, G.; Caxambu, M.; Ferreira, I.; Couto, E. Significance of forest fragments for conservation of endangered vascular plant species in southern Brazil hotspots. Écoscience 2019, 26, 221–235. [Google Scholar] [CrossRef]
  32. Endlich, A.M. Pensando os Papéis e Significados das Pequenas Cidades do Noroeste do Paraná. Ph.D. Thesis, Universidade Etadual Paulista, Presidente Prudente São Paulo state, São Paulo, Brazil, 2006. [Google Scholar]
  33. Câmara, G.; Souza, R.; Freitas, U.; Garrido, J. Spring: Integrating remote sensing and GIS by object-oriented data modelling. Comput. Graph. 1996, 20, 395–403. [Google Scholar] [CrossRef]
  34. Japan Aerospace Exploration Agency (JAXA). Earth Observation Research Center: ALOS User Handbook. 2007. Available online: www.eorc.jaxa.jp/alos/en/doc/handbk.htm (accessed on 19 December 2019).
  35. Instituto Brasileiro de Geografia e Estatística (IBGE). Censo Demográfico 2010: Resultados do Universo. 2010. Available online: www.ibge.gov.br/home/estatistica/populacao/censo2010/default.shtm (accessed on 19 December 2019).
  36. Instituto Brasileiro de Geografia e Estatística (IBGE). Geociências: Bases Cartográficas Contínuas. 2014. Available online: www.ibge.gov.br/geociencias/cartas-e-mapas/bases-cartograficas-continuas/ (accessed on 19 December 2019).
  37. Development Team QGIS. QGIS Geographic Information System. Open Source Geospatial Foundation. 2016. Available online: www.qgis.org/pt_BR/site/about/index.html (accessed on 19 December 2019).
  38. Lidicker, W. Responses of mammals to habitat edges: An overview. Landsc. Ecol. 1999, 14, 333–343. [Google Scholar] [CrossRef]
  39. López-Barrera, F.; Manson, R.; González-Espinosa, M.; Newton, A. Effects of varying forest edge permeability on seed dispersal in a neotropical montane forest. Landsc. Ecol. 2006, 22, 189–203. [Google Scholar] [CrossRef]
  40. Umetsu, F.; Pardini, R. Small mammals in a mosaic of forest remnants and anthropogenic habitats—Evaluating matrix quality in an Atlantic forest landscape. Landsc. Ecol. 2006, 22, 517–530. [Google Scholar] [CrossRef]
  41. Eycott, A.; Stewart, G.; Buyung-Ali, L.; Bowler, D.; Watts, K.; Pullin, A. A meta-analysis on the impact of different matrix structures on species movement rates. Landsc. Ecol. 2012, 27, 1263–1278. [Google Scholar] [CrossRef]
  42. Bhering, S.; Santos, H. (Eds.) Mapa de Solos do Estado do Paraná: Legenda Atualizada; Embrapa florestas, Embrapa solos, Instituto Agronômico do Paraná: Rio de Janeiro, Brazil, 2008. [Google Scholar]
  43. Tricart, J.; Kiewietdejonge, C. Ecogeography and Rural Management; Longman Scientific & Technical: Harlow, Essex, UK, 1992; p. 304. [Google Scholar]
  44. Crepani, E.; Medeiros, J.; Hernandez-Filho, P.; Florenzano, T.; Duarte, V.; Barbosa, C. Sensoriamento Remoto e Geoprocessamento Aplicados ao Zoneamento Ecológico-Econômico e ao Ordenamento Territorial; Instituto Nacional de Pesquisas Espaciais (INPE): São José dos Campos, Brazil, 2001; p. 124. [Google Scholar]
  45. United Nations (UN). Programa das Nações Unidas Para o Desenvolvimento. Atlas do Desenvolvimento Humano no Brasil 2013: O Índice de Desenvolvimento Humano Municipal Brasileiro. PNUD/IPEA/FJP, Brasília, Brazil, 2017. Available online: www.atlasbrasil.org.br/2013/pt/consulta/ (accessed on 19 December 2019).
  46. Instituto Paranaense de Desenvolvimento Economico e Social (IPARDES). Leituras Regionais: Mesorregião Geográfica Centro-Ocidental; IPARDES: Curitiba, Brazil, 2004; p. 133.
  47. Ferreira, I.; Bragion, G.; Ferreira, J.; Benedito, E.; Couto, E. Landscape pattern changes over 25 years across a hotspot zone in southern Brazil. South. For. J. For. Sci. 2019, 81, 175–184. [Google Scholar] [CrossRef]
  48. Ribeiro, M.; Metzger, J.; Martensen, A.; Ponzoni, F.; Hirota, M. The Brazilian Atlantic Forest: How much is left, and how is the remaining forest distributed? Implications for conservation. Biol. Conserv. 2009, 142, 1141–1153. [Google Scholar] [CrossRef]
  49. Trevisan, D.; Moschini, L. Dinâmica de uso e cobertura da terra em paisagem no interior do estado de São Paulo: Subsídios para o planejamento. Front. J. Soc. Technol. Environ. Sci. 2015, 4, 16. [Google Scholar] [CrossRef]
  50. Ferreira, I.; Ferreira, J.; Bueno, P.; Vieira, L.; Bueno, R.; Couto, E. Spatial dimension landscape metrics of Atlantic forest remnants in Paraná state, Brazil. Acta Sci. Technol. 2018, 40, 1–8. [Google Scholar] [CrossRef]
  51. Huang, J.; Zhan, J.; Yan, H.; Wu, F.; Deng, X. Evaluation of the impacts of land use on water quality: A case study in the Chaohu Lake Basin. Sci. World J. 2013, 2013, 1–7. [Google Scholar] [CrossRef] [PubMed] [Green Version]
  52. Dechen, S.; Telles, T.; Guimarães, M.; Maria, I. Perdas e custos associados à erosão hídrica em função de taxas de cobertura do solo. Bragantia 2015, 74, 224–233. [Google Scholar] [CrossRef] [Green Version]
  53. Tan, M.; Ibrahim, A.; Yusop, Z.; Duan, Z.; Ling, L. Impacts of land-use and climate variability on hydrological components in the Johor River basin, Malaysia. Hydrol. Sci. J. 2015, 1–17. [Google Scholar] [CrossRef]
  54. Adnan, N.; Atkinson, P. Exploring the impact of climate and land use changes on streamflow trends in a monsoon catchment. Int. J. Climatol. 2011, 31, 815–831. [Google Scholar] [CrossRef]
  55. Fernandes, L.; Ribeiro, C. Evolution and palaeoenvironment of the Bauru Basin (Upper Cretaceous, Brazil). J. S. Am. Earth Sci. 2015, 61, 71–90. [Google Scholar] [CrossRef]
  56. Do Couto, E.V.; Cordeiro dos Santos, L.; Vinicius de Sordi, M.; Bourlés, D.; Braucher, R.; Rodrigues Salgado, A.; Léanni, L.; Ferreira, J.H.D. Changes of the base levels in the Ivaí and Paraná Rivers confluence zone (Southern Brazil): Denudational reflexes in the evolution of the upstream drainage network. Zeitschrift für Geomorphologie 2018, 62, 23–40. [Google Scholar] [CrossRef]
  57. McMahon, J.M.; Olley, J.M.; Brooks, A.P.; Smart, J.C.R.; Stewart-Koster, B.; Venables, W.N.; Curwen, G.; Kemp, J.; Stewart, M.; Saxton, N.; et al. Vegetation and longitudinal coarse sediment connectivity affect the ability of ecosystem restoration to reduce riverbank erosion and turbidity in drinking water. Sci. Total Environ. 2020, 707, 135904. [Google Scholar] [CrossRef]
  58. Issaka, S.; Ashraf, M. Impact of soil erosion and degradation on water quality: A review. Geol. Ecol. Landsc. 2017, 1, 1–11. [Google Scholar] [CrossRef] [Green Version]
  59. Batalhão, A.; Teixeira, D. Indicadores de Sustentabilidade para a Educação: Uma Análise do Tema Conhecimento e Cultura a Partir do Barômetro da Sustentabilidade em Ribeirão Preto (SP). In Políticas Públicas e Desenvolvimento; Espirito-Santo, P., Bandos, M., Eds.; Editora UniFacef: Franca, Brazil, 2013; pp. 1–23. [Google Scholar]
  60. Moreira-Braga, T. Sustentabilidade e condições de vida em áreas urbanas: Medidas e determinantes em duas regiões metropolitanas brasileiras. EURE 2006, 32. [Google Scholar] [CrossRef] [Green Version]
  61. Kronemberger, D.; Clevelario-Junior, J.; Nascimento, J.; Collares, J.; Silva, L. Desenvolvimento sustentável no brasil: Uma análise a partir da aplicação do barômetro da sustentabilidade. Sociedade Natureza 2008, 20, 25–50. [Google Scholar] [CrossRef] [Green Version]
  62. Carr, G.; Blöschl, G.; Loucks, D. Evaluating participation in water resource management: A review. Water Resour. Res. 2012, 48. [Google Scholar] [CrossRef] [Green Version]
  63. Augusto, L.; Gurgel, I.; Câmara-Neto, H.; Melo, C.; Costa, A. O contexto global e nacional frente aos desafios do acesso adequado à água para consumo humano. Ciência Saúde Coletiva 2012, 17, 1511–1522. [Google Scholar] [CrossRef] [Green Version]
  64. Xu, W.; Zhang, X.; Xu, Q.; Gong, H.; Li, Q.; Liu, B.; Zhang, J. Study on the Coupling Coordination Relationship between Water-Use Efficiency and Economic Development. Sustainability 2020, 12, 1246. [Google Scholar] [CrossRef] [Green Version]
  65. Burch, C.; Busch, M.; Higgins, E.; Bittner, S.; Perera, N.; Neal, K.; Burkett, L.; Castro, A.J.; Anderson, C. Revisiting a Water Conflict in Southeastern Oklahoma 6 Years Later: A New Valuation of the Willingness to Pay for Ecosystem Services. Sustainability 2020, 12, 819. [Google Scholar] [CrossRef] [Green Version]
  66. Alves, G.H.Z.; Tófoli, R.M.; Rodrigues-Filho, J.L.; Sacramento, P.A.; Cionek, V.M.; Figueiredo, B.R.S.; do Couto, E.V. Brazil’s vegetation ravage may be encouraged by law. Biodivers. Conserv. 2020, 29, 8–10. [Google Scholar] [CrossRef]
  67. Brandão, A., Jr.; Rausch, L.; Paz Durán, A.; Costa, C., Jr.; Spawn, S.A.; Gibbs, H.K. Estimating the Potential for Conservation and Farming in the Amazon and Cerrado under Four Policy Scenarios. Sustainability 2020, 12, 1277. [Google Scholar] [CrossRef] [Green Version]
  68. Vieira, L.; Rizzi, J.; do Couto, E.; Souza, D.; Ferreira, P.; Figueira, R.; Froehner, S. Historical pollution of an urban watershed based in geochemical, geoacumulation, and EROD activity in PLHC-1 analyses in sediment cores. Arch. Environ. Contam. Toxicol. 2018, 76, 191–205. [Google Scholar] [CrossRef]
  69. Vieira, L.; Neto, D.; do Couto, E.; Lima, G.; Peron, A.; Halmeman, M.; Froehner, S. Contamination assessment and prediction of 27 trace elements in sediment core from an urban lake associated with land use. Environ. Monit. Assess. 2019, 191. [Google Scholar] [CrossRef] [PubMed]
  70. Hák, T.; Janoušková, S.; Moldan, B.; Dahl, A. Closing the sustainability gap. Ecol. Indic. 2018, 87, 193–195. [Google Scholar] [CrossRef]
  71. Dahl, A. Achievements and gaps in indicators for sustainability. Ecol. Indic. 2012, 17, 14–19. [Google Scholar] [CrossRef]
Figure 1. Locality of the hydrographic basin of the Goioerê River. The municipalities that compose the hydrographic basin of the Goioerê River (HBGR); 01—Umuarama, 02—Cruzeiro do Oeste, 03—Tapejara, 04—Tuneiras do Oeste, 05—Cianorte, 06—Araruna, 07—Campo Mourão, 08—Farol, 09—Mamborê, 10—Boa Esperança, 11—Janiópolis, 12—Goioerê, 13—Moreira Sales, 14—Mariluz, 15—Alto Piquiri, 16—Perobal.
Sustainability 12 03057 g001
Figure 2. Factors affecting distribution in Goioerê River hydrographic basin: (A) Land use classes; (B) Potential fragility levels; (C) Human development factor levels.
Sustainability 12 03057 g002
Figure 3. Map of the environmental sustainability levels in the Goioerê River hydrographic basin. For A and B, see details in Appendix A and Appendix B.
Sustainability 12 03057 g003

