Productivity Growth in Chinese Medical Institutions during 2009–2018


1
Chinese Academy of Social Sciences, Beijing 100732, China
2
Program in Public Health, Western Michigan University, Grand Rapids, MI 49503, USA
3
School of International Trade and Economics, Central University of Finance and Economics, 39 South College Road, Beijing 100081, China
*
Author to whom correspondence should be addressed.
Sustainability 2020, 12(8), 3080; https://0-doi-org.brum.beds.ac.uk/10.3390/su12083080
Submission received: 6 March 2020
/
Revised: 8 April 2020
/
Accepted: 10 April 2020
/
Published: 12 April 2020
(This article belongs to the Special Issue Sustainability of Public Policy and Health Economics)
Abstract
:China is the most populous nation and considerations of economic efficiency in the social sectors is important for maintaining the wellbeing of such a large population. This is especially true when gauging the performance of the healthcare sector treating the population. In this paper, we examine the total factor productivity (TFP) growth in Chinese medical institutions during the period 2009–2018, which experienced a systemic healthcare reform. In order to identify the contribution from each component of TFP indicators and from each provincial or regional medical institutions, a generalized decomposition of productivity gains is applied to analyze hospital operations based on an aggregate directional distance function (DDF). The results show that the annual average TFP growth rate in Chinese medical institutions is 1.87% that is mainly driven by technological progress (0.75%, per annum), while less contributed by technical efficiency change (0.65%, p.a.) and scale efficiency change (0.47%, p.a.). Disparities of provincial hospital performances are observed that may provide policy implications for decision makers.
1. Introduction
Since the reform and opening in 1978 of markets and trade, the Chinese healthcare system has experienced significant changes covering policy making, equipment replacement, organization management, institution expansion, staff training, and so on [1]. The recent reform started from 2009 represents a new era in public health development. Yip and Hsiao [2] reviewed the reforms in the Chinese healthcare system. Specifically, changes have focused on the increase in public financing for hospitals. The impetus for this change was that the healthcare system was not functioning with low quality and high costs. Government oversight is accomplished through regulations, laws, and direct ownership of institutions providing healthcare and other social good services [2]. In 2002–2008, the government implemented reforms of social insurance to pay for hospital care. After 2009, reforms included increased public financing as well as promoting prevention to reach a “healthy China” by 2020.
However, reforms require evaluation and one such evaluation tool is measuring total factor productivity (TFP). This method has been applied to hospitals in many different nations, however, a majority of these studies have focused on using data envelopment analysis (DEA) and the Malmquist approach that decomposes overall technical efficiency into efficiency changes (moving closer to the frontier) and technological changes (moving to a new frontier). The incomplete productivity indices, such as the popular Malmquist index, may not always be regarded as a TFP measure but shall be called technology indices [3]. These biased productivity indices may also generate unclear economic interpretation and even contradictory results for policy and decision makers [4].
This type of analysis is relevant because once hospitals select the quantity and quality of the care provided, costs should still be minimized. What we address here is that once these decisions are made, as reflected in the amount of outputs provided, we pursue the objective of which Regions/Provinces have a medical sector that increases efficiency and productivity. This can also be further noted by the presentation of the variability within each Region/Province to present if there is consistency in hospital performance within each geographical unit. If there is a wide variability within each Region/Province, a policy assessment can be made as to what is source of deviations of “best” practice as well as identify in which Regions/Provinces need more government attention.
The objective of this paper is to estimate TFP growths for Chinese medical institutions and expand on the existing literature in three different ways. First, we expand on estimating TFP using the Luenberger–Hicks–Moorsteen (LHM) approach, which permits us to employ an additively complete indicator. Further, by employing an aggregate directional distance function (DDF), we can capture the contribution of each evaluated unit to the overall productivity gains. Second, in response to reforms, we can evaluate the performance of medical institutions in Chinese provinces based on a generalized decomposition of TFP indicator. Hence, technical efficiency change, scale efficiency change, and technological progress in terms of output and input changes can be addressed. Third, we use the sample that covers main provincial Chinese medical institutions during 2009–2018 and empirical results may provide more recent information or policy implication for decision makers.
The rest of the paper is organized as follows: In Section 2, we review research on the productivity of health and medical operating in China; we introduce the methodology applied in the estimation of TFP of Chinese medical services in Section 3. We present the data and results in Section 4; Section 5 concludes the paper with a discussion of findings, applicability to policymakers, the role of this approach in sustainability, as well as limitations in this study.
2. Literature Review
Since 2009, the Chinese government has started a novel healthcare reform covering construction of the basic medical security and the basic national drug systems, promoting equalization of basic public health services, and improving services of public hospitals, etc. In this paper, we mainly focus on public hospitals’ reform starting from 2009. In Table 1, we illustrate the timeline of Chinese hospitals’ reforms during the period 1978–2018. One can notice that Chinese reforms on public hospitals can be divided by three main stages: First, the marketization stage, which was focused on transformation of public hospitals from fiscal appropriation to self-financing; after the transition stage, the novel medical reform started from 2009, and has been improving the quality of medical and health services, especially in hospitals by promoting organization optimization, staff training, recourses allocation, infrastructure construction, and technological innovation, etc.
The Chinese government have made moves boosting public health and medical services. Reforms focused on developing the world’s largest basic medical insurance so that patients could receive emergency care, treatment for serious illnesses, and increased service in urban and rural areas. Although lofty goals, it is also important that these reforms and the medical services provided within these reforms are efficient and productive in order to reduce wasted resources. These issues of efficiency and productivity have been addressed in low- and middle-income countries worldwide including Botswana [6], Vietnam [7], and Iran [8]), among others. These countries are similar to China in several ways. First, there is a need for reform based on the need for an access to quality healthcare. Second, Vietnam is similar to China as it has a growing economy and has a similar government structure. Even though the countries cited above are not identical to China in terms of socio-economic status, size, or geographical location, what is similar in all these studies is the use of TFP using DEA and the Malmquist approach in addressing similar medical issues. To facilitate the following discussion, we provide Table 2, which summarizes a brief explanation of each method, the pros and cons, and whether the approach is parametric or non-parametric. For a complete review of the non-parametric methods, see Fare et al. [9].
There are two popular approaches to evaluate TFP growth: The first group, TFP change, is computed by the Solow residuals; the second category, TFP gain, is represented by index or indicator. Our paper is based on the LHM TFP indicator. Before proceeding to the literature review, we distinguish between the concepts of efficiency and productivity. Efficiency refers to movement along the production isoquant and, in economics, relies on prices. By using the DEA framework, movement along the isoquant is input based in units since in the healthcare and hospital services, prices are often missing (see Table 2). Productivity refers to movement to a higher (or lower) isoquant reflecting improved or diminished production. This movement is not reliant on prices.
Pang [10] evaluated the operation efficiency of 249 Chinese hospitals in 2005 based on DEA and suggested that the valid methods to increase hospital’s operation efficiency were to adjust the operation scale of hospital and increasing the validity of treatments. Gai et al. [11] assessed the efficiency score of China’s county hospitals in 31 provinces from 1993–2005 by using DEA framework. They found that even though the number of county hospitals and their inputs grew rapidly, the overall efficiency at the national level decreased slightly and the eastern area have better overall, scale, and technical efficiency in comparison to the inland and the western areas. Ng [12] used the Malmquist approach for hospitals operating in Guangdong province in 2004–2008. He found that inefficiency among these hospitals was due to pure technical inefficiency in the DEA framework, and that productivity growth was due to technological change. Hu et al. [13] assessed health insurance reform on the New Rural Cooperative Medical System’s efficiency using a series of DEA and Malmquist models from 2002 through 2008. They found that hospital efficiency increased from an average of 0.68 to 0.81.
Along similar lines, Yang and Zeng [14] assessed private and public medical facilities operating in Shenzhen province between 2006–2010. They found that there was a tradeoff between efficiency and quality mostly among small- and medium-sized hospitals. Liu et al. [15] assessed 12 third grade class-A hospitals in Beijing operating in 2006–2009. They reported average technological growth among these hospitals of 28.3% but lower efficiency change of −1.3%. Li et al. [16] examined the efficiency and productivity of 12 third-grade Class A general public hospitals in Beijing from 2006–2009. They noted that the sample hospitals in Beijing experienced substantial productivity growth and technological change was the main contributor to the growth. Conversely, Cheng et al. [17] studied 114 hospitals in Henan Province from 2010 through 2010. These authors reported that hospital performance improvements were attributed to efficiency change (an improvement of 6.8%) as compared to technological change (0.9%).
Chen et al. [18] analyzed 64 hospitals from Shenzhen Province between 2010–2015. They found that 48% of first level hospitals and 46% of second level hospitals were inefficient and no third level hospitals exhibited inefficiency. Similarly, 46% of first-level hospitals, 17% of second-level hospitals, and 13% of third-level hospitals exhibited negative technological changes. Li and He [19] also focused on the impact of healthcare reforms and they found that a balance of market competition and government intervention lead to improved quality and subsequently improved efficiency performance.
From these studies, it is apparent that there is an interest in measuring medical service performance over time since healthcare reform in China. Whereas there is consistency among these findings, there are some drawbacks. These authors focused on medical services applied to individual provinces, which may or may not be generalizable. Because of the advantages of the approach we take here and outlined in the introduction, we provide additional information helpful to policymakers. Specifically, we can provide a direct comparison among regions and provinces as well as identify the source of productivity gains—technical, scale, and mix. Even though these earlier studies focused on a variety of regions/provinces throughout the country as well as demonstrate similarities, in their findings, we expand on the earlier approaches by being able to directly compare across regions and provinces. Because of these drawbacks, we propose a different approach and model. We address the questionable generalizability by assessing one province by employing the LHM.
One of the benefits of the LHM approach as compared to traditional Malmquist measures is that the former permits additivity so that productivity analysis can be combined at the firm and at the industry level. Further, there can be more precise decomposition including efficiency change, productivity change, technical efficiency, mix of services, and scale efficiency changes. This can be done since the LHM approach uses an arithmetic means (t and t + 1) and by aggregating inputs and outputs, a common direction can be derived by the efficiency scores. Boussemart et al. [20]used Luenberger approach to assess Chinese healthcare reforms at the provincial and regional levels in 2009–2014. They found that overall improvements were achieved by 0.73% at the central region, 0.53% at the eastern region, and 0.14% at the western region. Using the decomposition of the overall measure, these authors found that at the regional levels, improvements at different degrees of scale and mix inefficiency should be pursued and that reallocations would lead to different approaches in reform. Compared to the Luenberger indicator, the LHM approach has been regarded as a better total factor productivity indicator [4]. Given the improvement in methodology, we expand on this to measure TFP in Chinese medical services. We expand our discussion on the methodology we employ below.
3. Methodology
3.1. Definition of Production Technology
The Neo-Walrasian production theory initially was introduced by Koopmans [21], Debreu [22], Shephard [23], and Farrell [24]. Based on their seminal works, the production technology could be interpreted by production possibility sets, which has provided new measurement for performance evaluation. The production technology of medical institutions is illustrated by the production set with inputs and outputs. Assume that K number of decision-making units (DMUs), here represented as provincial hospitals, can use multiple-inputs to produce multiple-outputs. Specifically, N number of inputs (x) is able to produce M number of outputs (y) in the hospital production process. The production possibility set T is defined in Equation (1).
The technology T is required to satisfy some standard economic assumptions in Equation (2). For instance, A1 assumption implies it is always feasible to produce zero output and that there is no free lunch, namely i.e., outputs cannot be produced without inputs. A2 and A3 guarantee that unlimited outputs cannot be produced by given inputs and that efficient production is on the frontier. In addition, other assumptions (free disposability of inputs and outputs, convexity, and returns to scale) are usually imposed on production sets. In this paper, the assumption of variable returns to scale (VRS) is introduced to characterize various hospital sizes across provinces. A detailed interpretation of economic axioms is available from Hackman [25] and Shen [26].
3.2. Aggregate Directional Distance Function
As a usual measure of production sets, the distance function is an equivalent representation of production technology. Unlike the Shephard distance function, the DDF proposed by Chambers et al. [27] can expand outputs and reduce inputs simultaneously in a linear programming framework. Further, by providing flexibility to approximate hospital production technology [20], a generalized DDF can be defined as the difference as seen in Equation (3).
where and are inefficiency scores for inputs and outputs. In other words, these parameters measure the potential decrease in inputs (by a given level of outputs), or possible increase in outputs by a given level of inputs, respectively. Given this, are non-negative with the minimum inputs and maximum outputs, which are projected onto the hospital production frontier. In order to capture the contributions of each provincial performance to the overall productivity gains, we follow Shen et al. [28] by employing an aggregate directional distance function to measure the inefficiency scores. The direction vector is defined as the aggregated value of inputs and outputs in Equation (4), and using China’s performance as a whole as the benchmark. The benefit of this directional distance approach over traditional DEA is that inefficiency scores can be directly compared across all hospitals interpreted as the possible decrease of inputs or potential improvement of outputs in terms of inputs and outputs for all hospitals operating in China [29].
Thanks to the aggregate DDF, all provinces are evaluated using a common direction vector allowing the summation of each individual hospital’s productivity [30]. Therefore, the TFP indicator is additive and the whole TFP growth is the sum of provincial productivity changes. Please see the detail illustration in the next section.
3.3. TFP Indicator and Its Decomposition
Compared to static efficiency scores, productivity indicators or indices are constructed on a combination of distance functions over time that provides more information for decision or policymakers. For instance, the productivity measures not only contain efficiency changes, but also technological progress (shift to a higher frontier) is included in productivity decomposition [31].
Some technical productivity measures have been widely used in literature, such as Malmquist index and Luenberger indicator. Such productivity index and indicator may bias TFP measures as they are incomplete and could not be regarded as a well approximation of TFP [3] [4]. In this paper, we employed the LHM indicator introduced by Briec and Kerstens [32] as the TFP measure, which satisfies the conditions for completeness defined as: the distances between the evaluated DMU and its benchmark on the frontiers across time. Specifically, this indicator contains 12 different directional distance functions over periods t and t+1 where both input- and output-oriented are considered as the elements in LHM-TFP indicator that three times of the distance functions comparing with Malmquist index and Luenberger indicator. Hence, the LHM-TFP measure is more complete than either the Malmquist or the Luenberger indicators. To facilitate the text, we present the detailed equations in Appendix A.
Like other productivity measures, the LHM-TFP indicator could be decomposed into terms of efficiency change and technological progress. Following Ang and Kerstens [33] and Shen et al. [34], specifically, productivity gains (TFP) is decomposed into technical efficiency change (TEC), scale efficiency change (SEC)and technological progress (TP). See Equation (5) for the formal decomposition.
TEC measures the distances to the production frontiers across time, where a positive score indicates improvement of TFP is driven by using resource efficiently, while a negative change means the hospitals are using resources inefficiently; SEC denotes the distances to the most productive scale sizes (MPSS) over period t and t + 1, where a positive change implies the productivity growth is motivated by approaching to optimal production scale, while a negative score suggests the size of the hospital is farther away from optimal size. Finally, TP measures the changes in productivity resulting from shifts of the hospital production frontier. Productivity changes may be attributed to technological innovation in hospital equipment or improvement in organizational structure. See details in Appendix B.
Moreover, Shen et al. [34] argue that a generalize decomposition of TFP indicator should be considered to integrate input- and output-oriented contributions in estimation. Therefore, each component of TFP indicator could be decomposed into sub-indicators by using input- and output-oriented distance functions. The detailed decomposition of input- and output-oriented changes for TEC, SEC, and TP is displayed in Appendix A.
Based on the common direction vector, this additively complete TFP indicator allows one to take the summation of individual productivity changes. In this case, the overall productivity gains in Chinese medical institutions could be computed by cumulating provincial performances [30]. This additive TFP is given as:
3.4. Estimation Strategy
The distance functions can be estimated both by parametric and nonparametric models and the main difference between them is whether the functional forms of production sets are predefined. In this paper, we applied a nonparametric approach as it is more flexible and does not require a specific functional form. A piecewise linear production frontier was constructed on combinations of efficient DMUs using linear programs. All linear programs were modelled in a special VBA program in Excel developed by authors. We now turn to the specification of linear programs applied in this paper. Two examples on estimating output/input directional distance functions are given in Equations (7) and (8). Firstly, the output directional distance function can be solved by the following linear program:
where and are the activity variable and inefficiency score, respectively. A positive value of implies the corresponding DMU is taking as reference on the frontier, and denotes the maximum potential expansion of outputs. The assumption of VRS is defined by the constraint of . Secondly, the input directional distance function can be obtained by solving the following linear program:
where is inefficiency score representing the maximum possible reduction in inputs. Note that the direction vector is defined as aggregate output/input values of Chinese medical institutions.
4. Data and Empirical Results
4.1. Data
For estimating productivity growth in Chinese medical institutions, we used the provincial public health dataset from National Bureau of Statistics of China (2009–2018). Following Shen and Valdmanis [30], and Boussemart et al. [20], we used the following inputs and outputs. Specifically, the inputs of medical institutions included inputs of medical institutions (measured in 10,000 s), including number of beds, number of licensed doctors, number of registered nurses, and other technical staff. The outputs (measured in millions) included the number of outpatient visits, the number of inpatients visits, the number of inpatient surgeries, and emergency room visits. Due to data availability, balanced provincial data were selected for 31 main provinces (municipalities) during the period over 2009–2018. The recent reform of Chinese medical and health system was covered in the sample period. All data were from National Bureau of Statistics of China (2009–2018).
The statistical description of sample data is given in Table 3. Note the significant variation in sample according to values of the standard deviation (S.D.) implying different development levels among provincial medical institutions over 2009–2018. The annual growth rates of inputs and outputs are denoted as the trend that suggest the fastest expansion of outputs is number of surgery while the lowest growth is in number of outpatient visits. In addition, the increase of outputs is mainly motivated by inputs expansion, especially in utilizing more nurses and beds in healthcare institutions.
The provinces are grouped into six geographical zones for performance analysis except Hong Kong, Macao, and Taiwan in China. These regions include: North China (Beijing, Tianjin, Hebei, Shanxi, Inner Mongolia), Northeastern (Liaoning, Jilin, Heilongjiang), East China (Shanghai, Jiangsu, Zhejiang, Anhui, Fujian, Jiangxi, Shandong), Central China (Henan, Hubei, Hunan, Guangdong, Guangxi, Hainan), Southwest (Chongqing, Sichuan, Guizhou, Yunnan, Tibet), Northwest (Shaanxi, Gansu, Qinghai, Ningxia, Xinjiang).
4.2. Results and Discussion
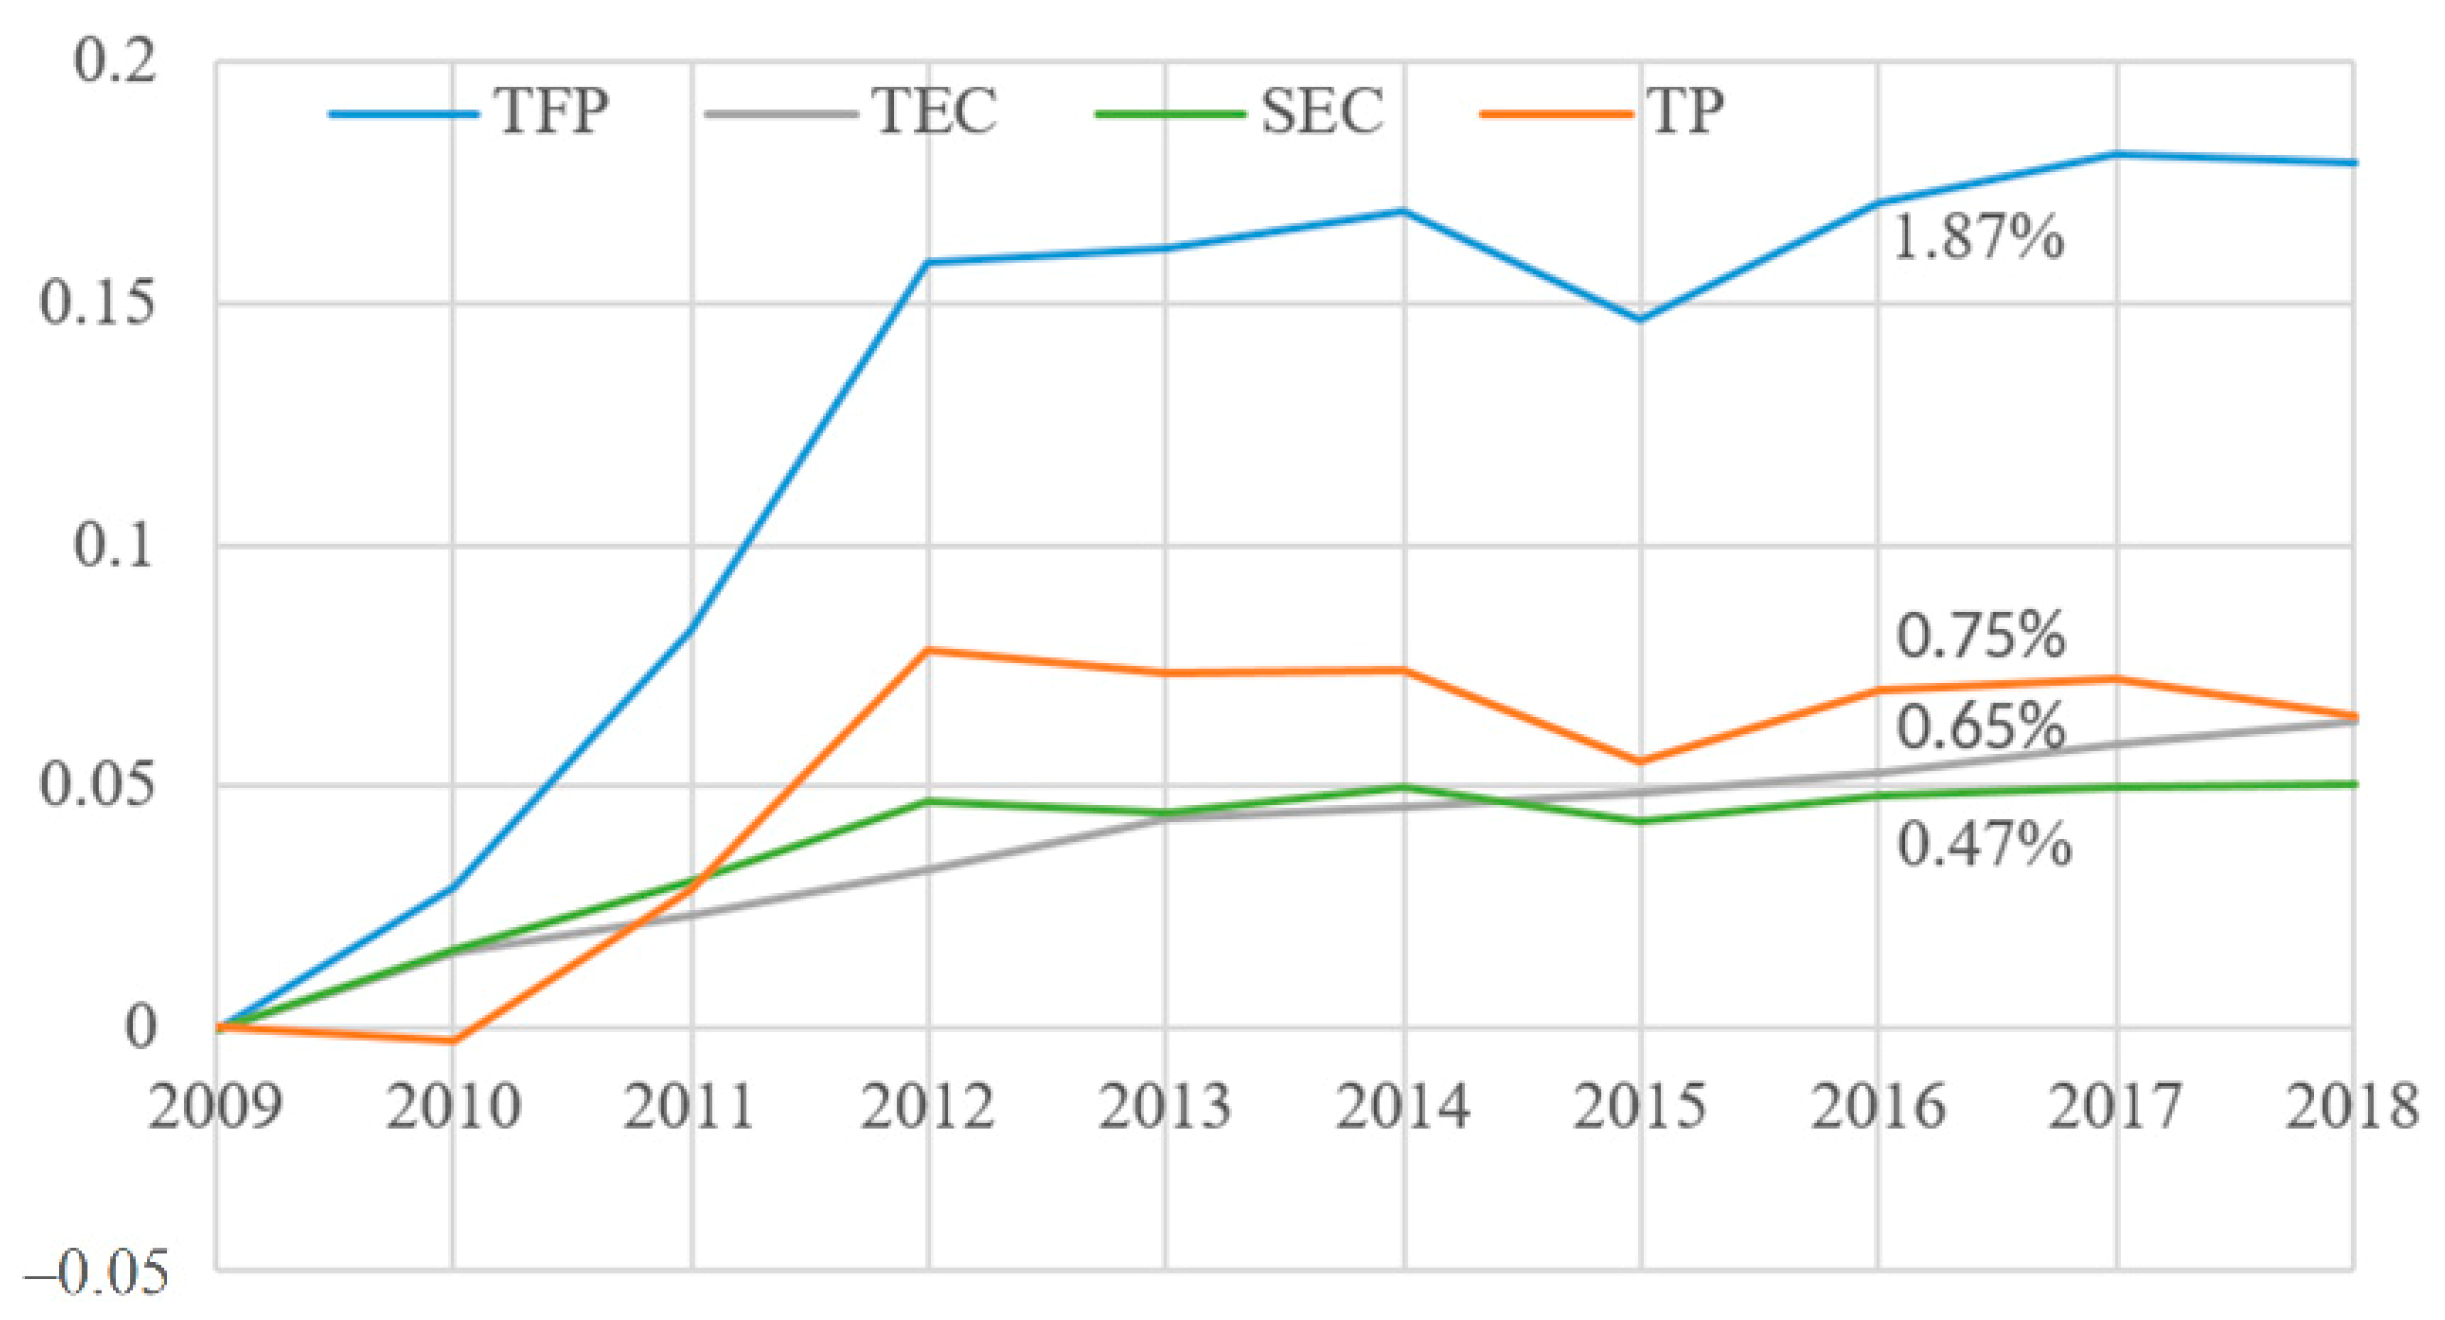
Based on the proposed approach, the contribution of individual DMU is additive thanks to the application of aggregate DDF. We begin to illustrate results from annual average growth rates of TFP measurement for total China. In Table 4, the second column presents TFP indicator and its decomposition at aggregate level. The trend of TFP growth in Chinese medical institutions was around 1.87% per annum that is mostly driven by the component of TP (0.75%, p.a.), which implies technological innovation or managerial measure in medical institutions is improving during the sample period. As the health financing structure continuously increased from 2009–2012, the total healthcare expenditure on GDP grew from 4% to 5% [35]. Chinese national level medical spending significantly exceeded that of all G7 members except the US in 2013 [36], and according to Jakovljevic et al. [37], most of BRICS’ growing share of global medical spending was heavily attributable to the overachievement of China. This provides evidence for the progress of Chinese healthcare reform started from 2009. Besides technological progress, TEC (0.65%, p.a.) and SEC (0.47%, p.a.) also contribute to Chinese medical productivity gains. The former one suggests the utilization of resources is improving while the latter indicates the size of provincial hospitals is approaching to the MPSS.
Moreover, this finding is an additively complete productivity indicator by accounting input and output changes into performance evaluation. As shown in Table 4, there is a difference between the decomposition of output- and input-oriented changes. For instance, the productivity components of TP and TEC are enhanced by the output-based impact, which suggests the frontier shift and the distance to the benchmark are significantly improving when output directional distance function is applied. Conversely, when SEC is affected by the input-based shock, that implies the scale enhancement benefits from input expansion.
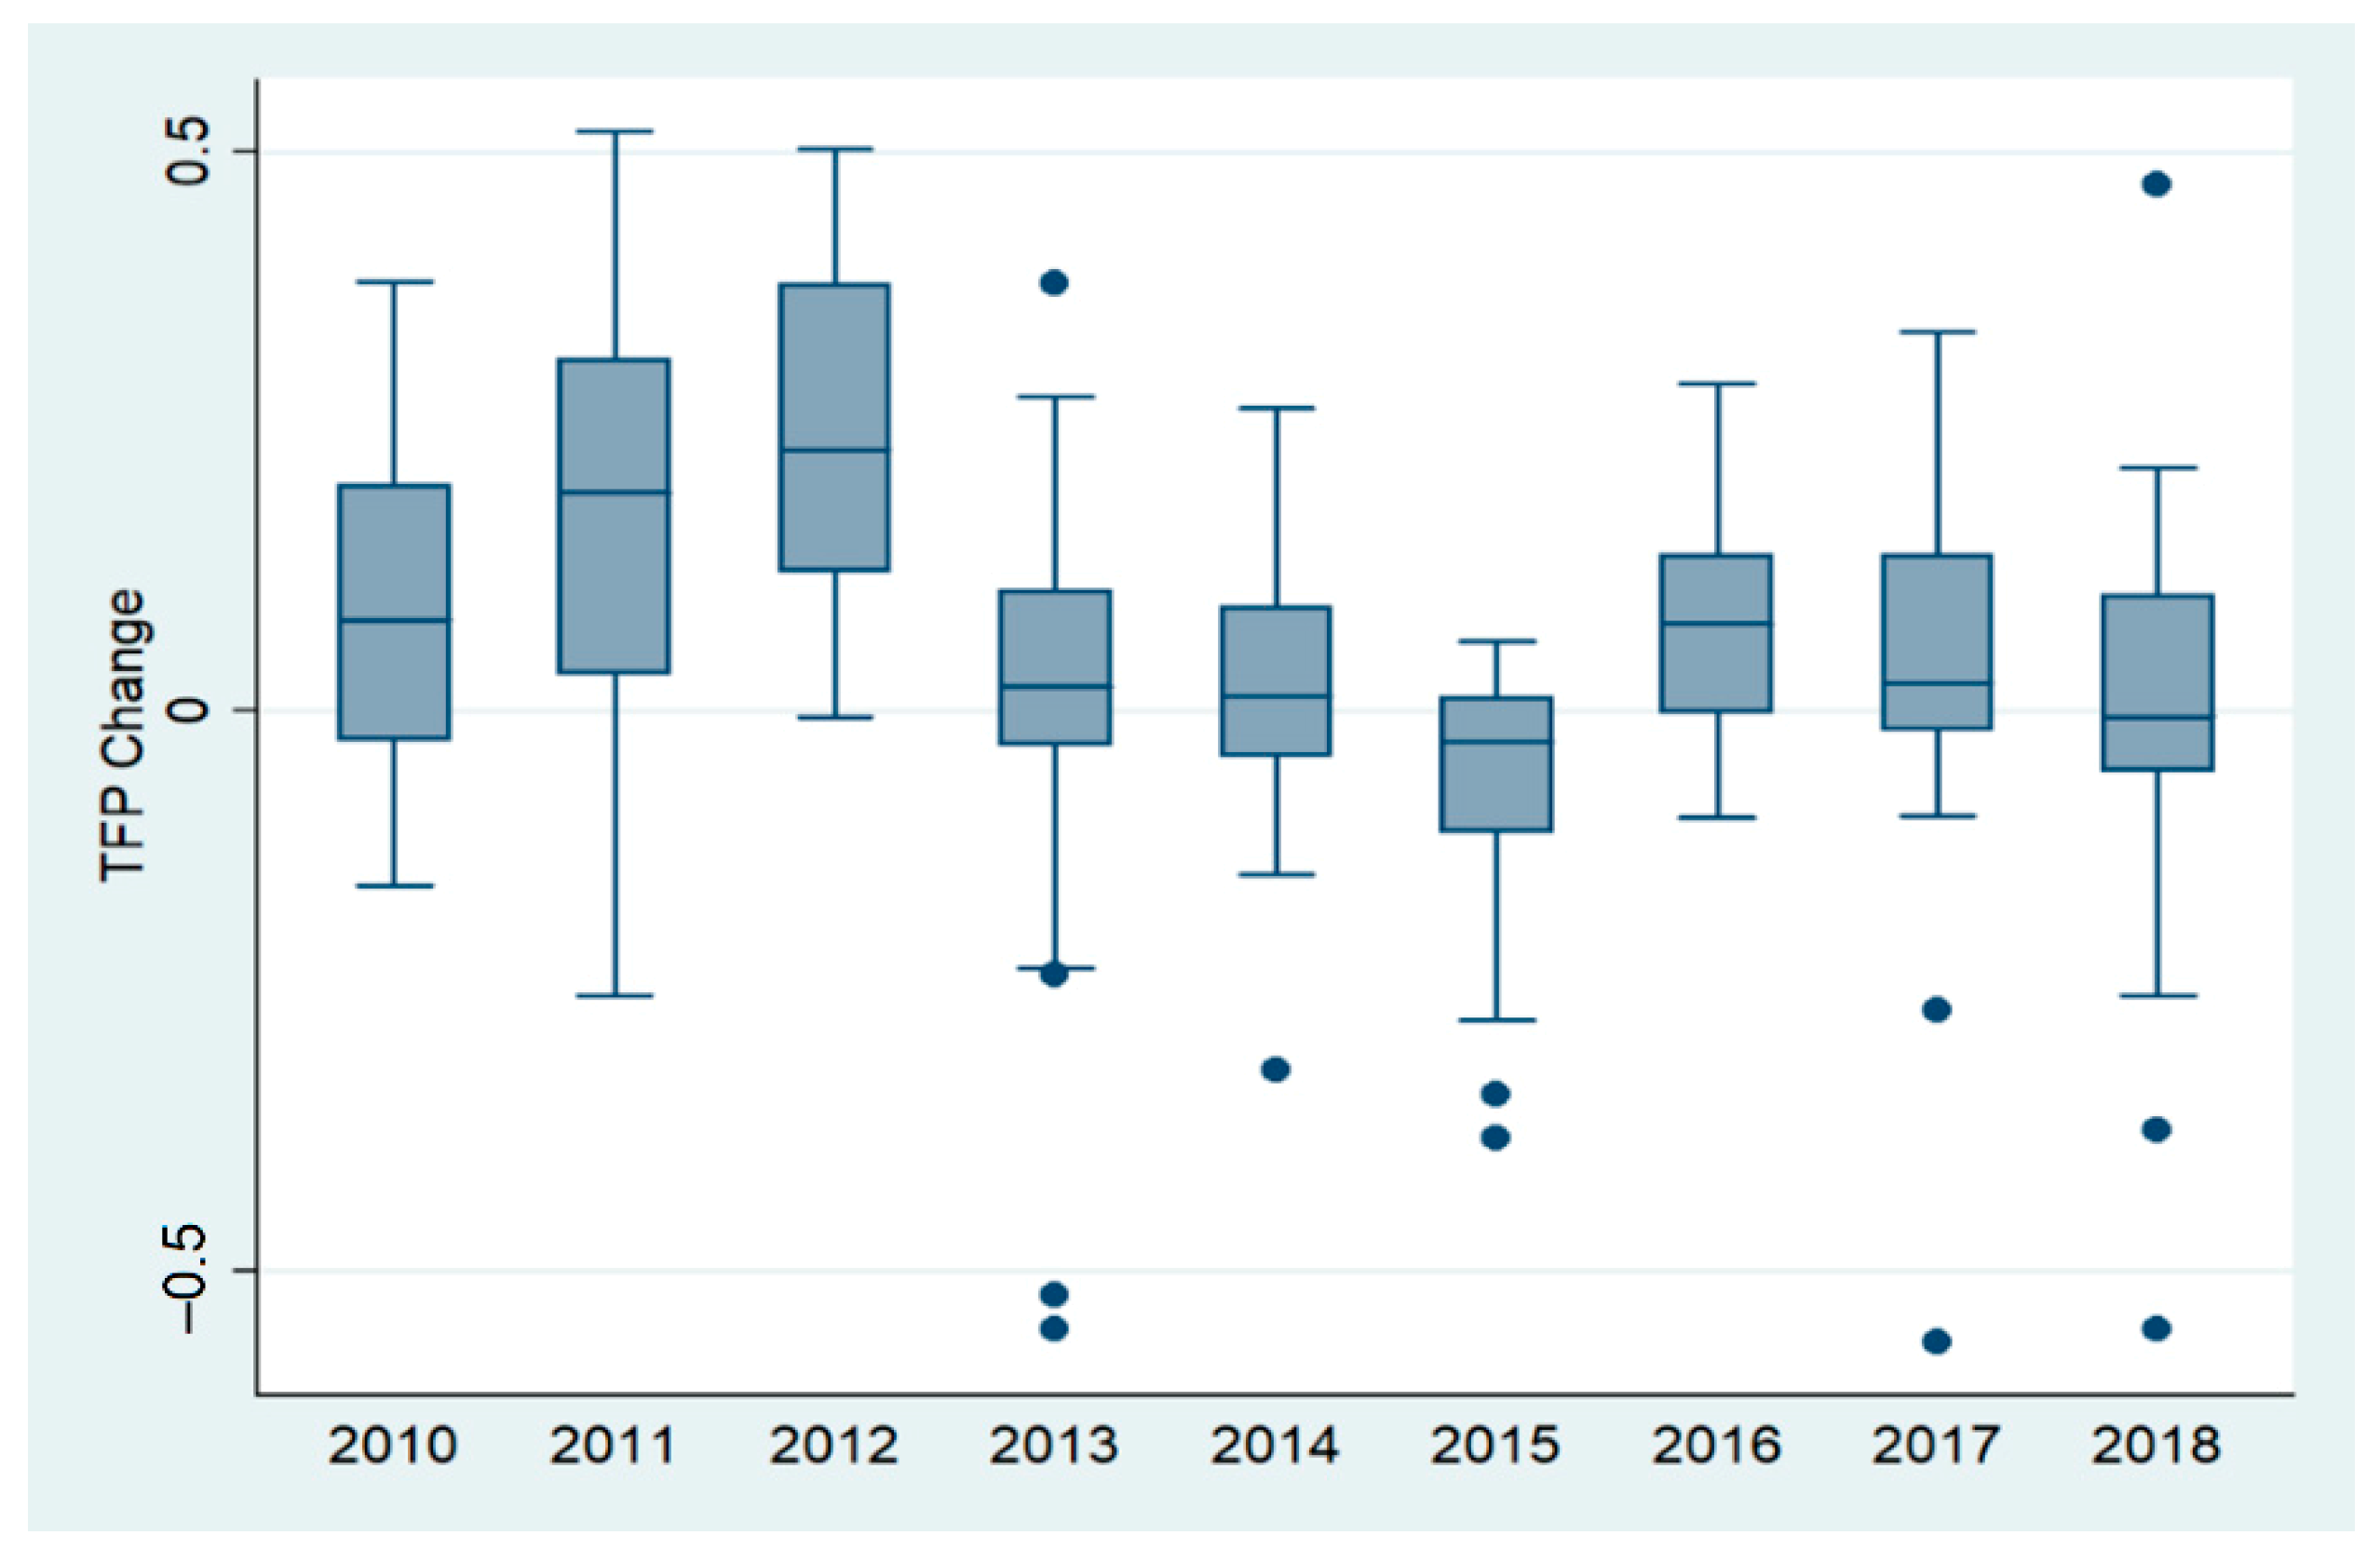
The evolution of cumulative TFP components is shown in Figure 1; the main productivity progress appeared in the first three years of sample (2009–2012), which covers the initial period of medical system reforms. This phenomenon is confirmed by the TFP changes shown in Figure 2. The fast growth in this period might be motivated by expanding governmental investments and expenditure in the healthcare sector [38]. The medium values of the boxplot increased in 2010–2012, then a downward trend appeared until it reached the bottom in 2015, and the TFP changes became stable in the last three years. This may reveal that hospital performance is influenced by the corresponding healthcare reform [30].
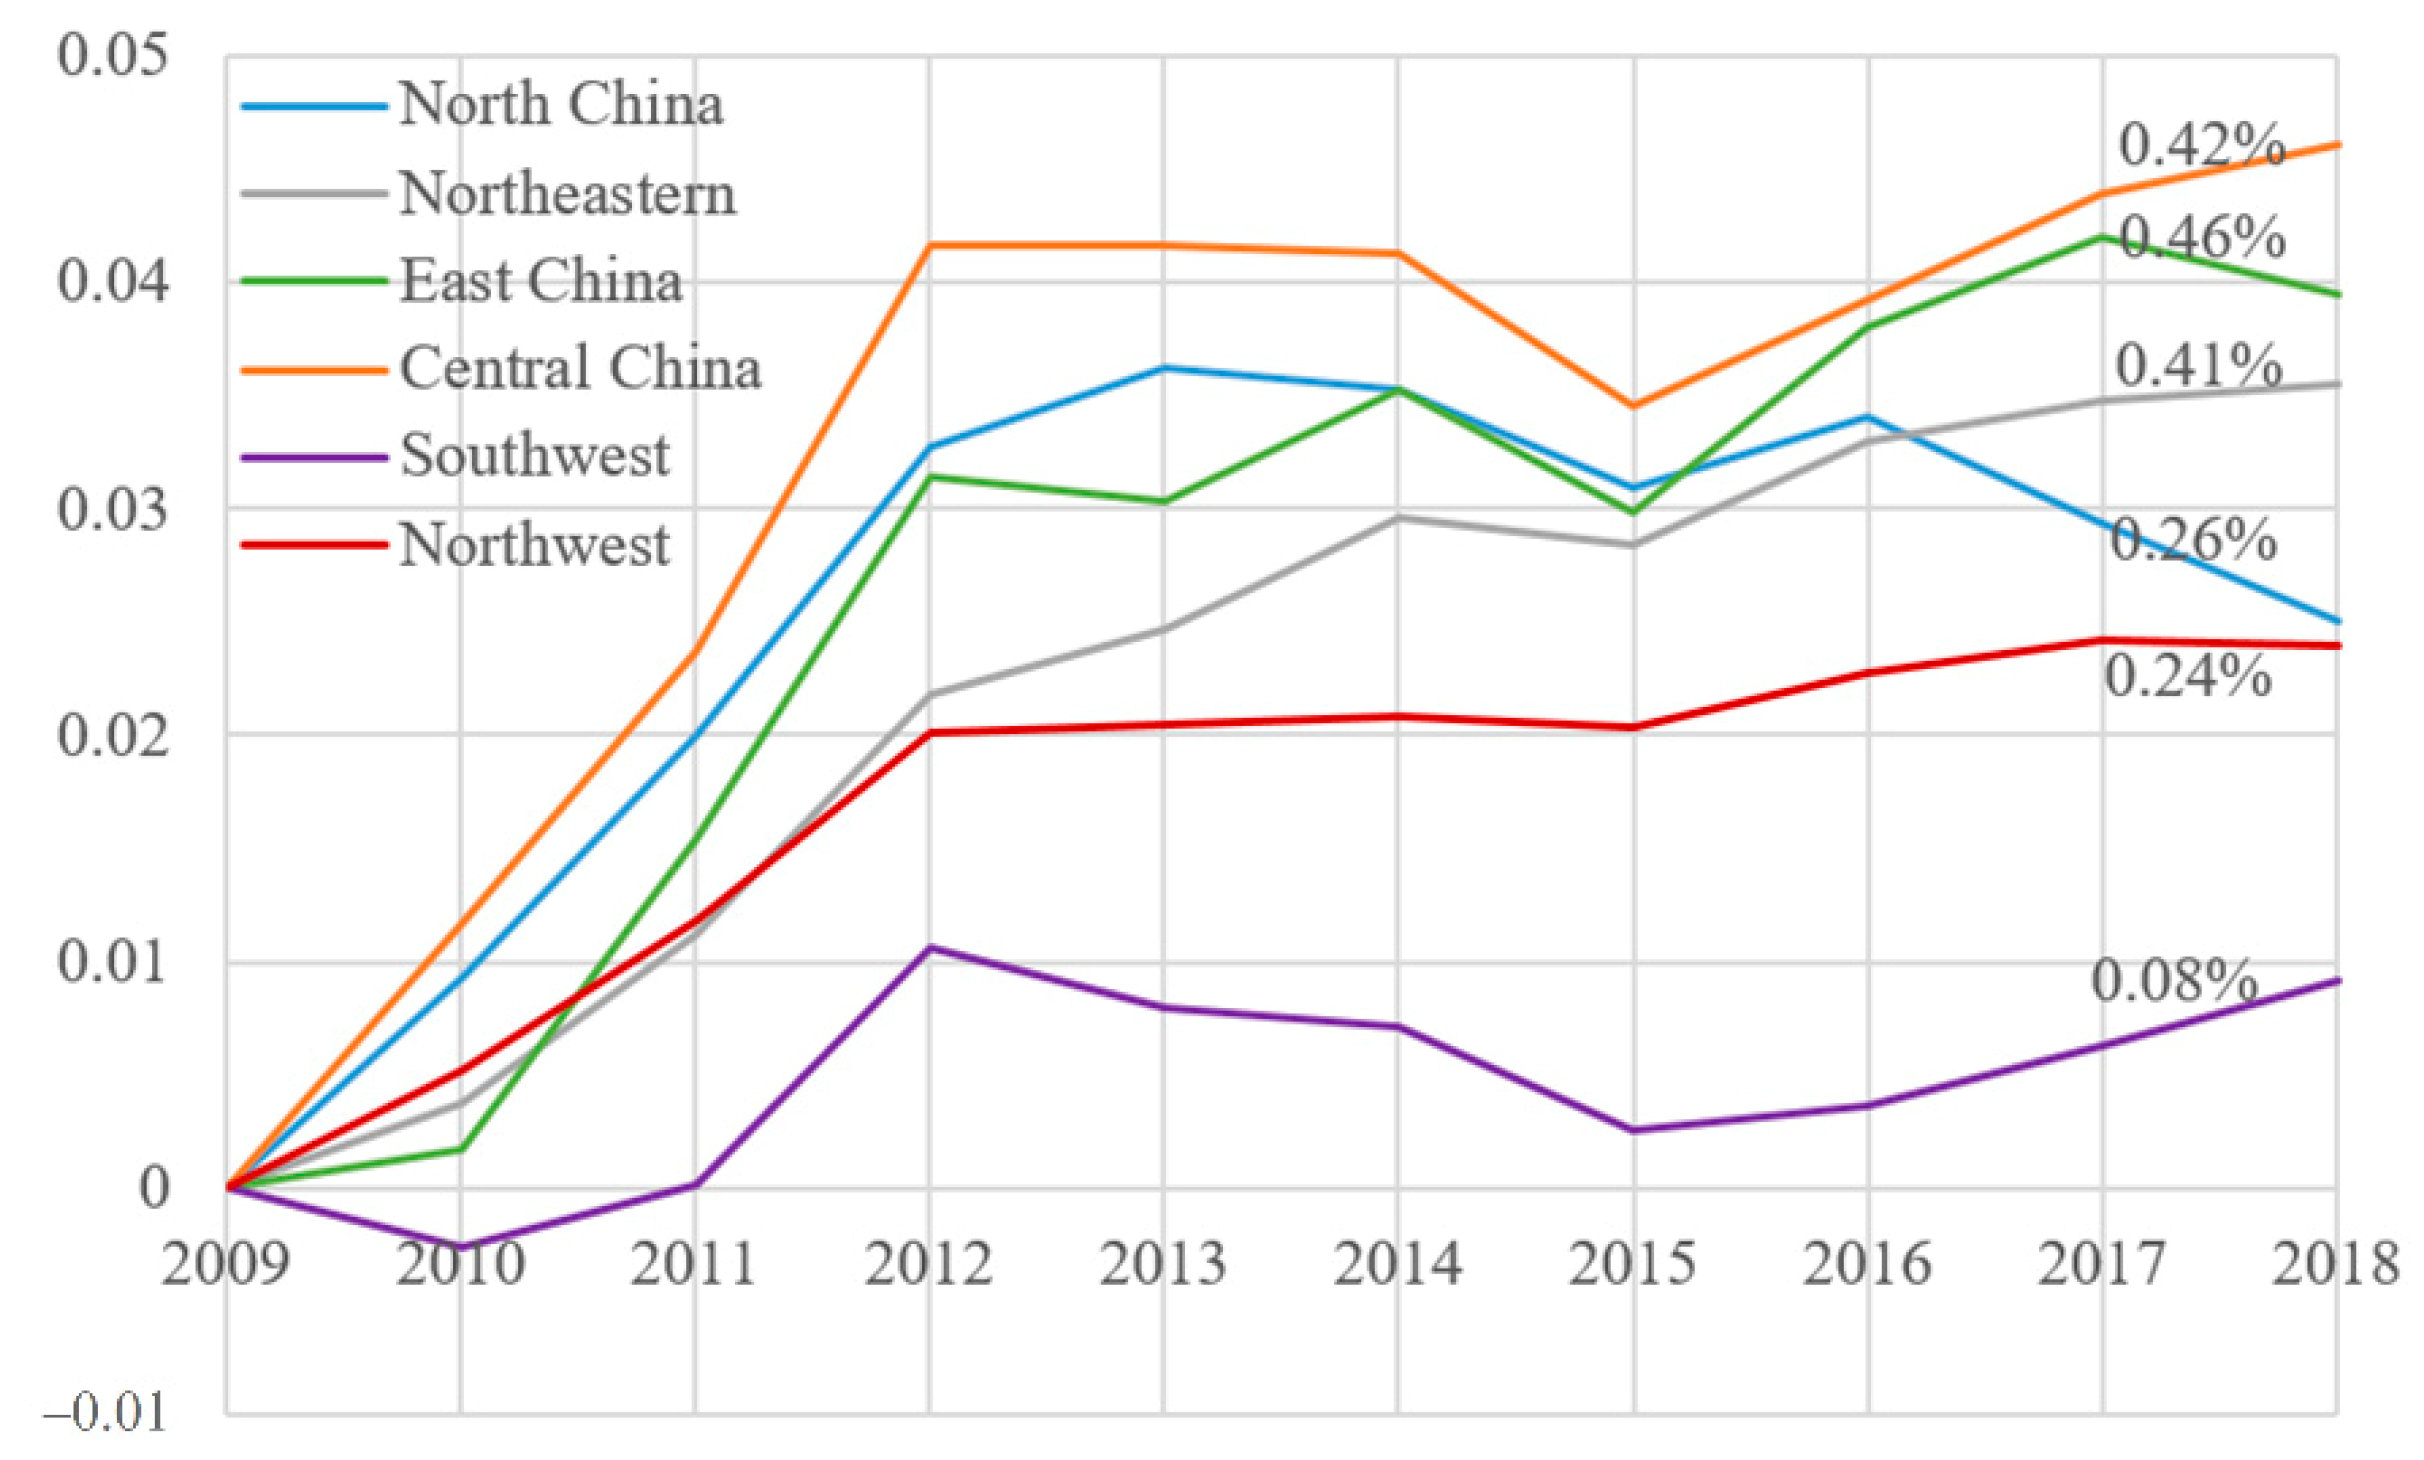
Disparities of regional hospital performances can be observed in Table 2 and Figure 3. Three regions dominate total Chinese productivity growth of medical institutions, namely East China (0.46%, p.a.), Central China (0.42%, p.a.), and Northeastern region (0.41%, p.a.). Other regions have lower contributions due to their negative growth of TP. For instance, the annual trends of TP in North China, Southwest, and Northwest regions are −0.19%, −0.09%, and −0.02%, respectively. This result suggests the decision makers might invest more in medical equipment, healthcare training, and staff organization for these regions. Furthermore, the component of SEC shows negative trends in East and Central China, which implies the policymakers might optimize the scale size of medical institutions in these regions as their scale of is getting far away from the MPSS. This backward efficiency might be due to changes of public subsidies and medical insurance reform ([39].
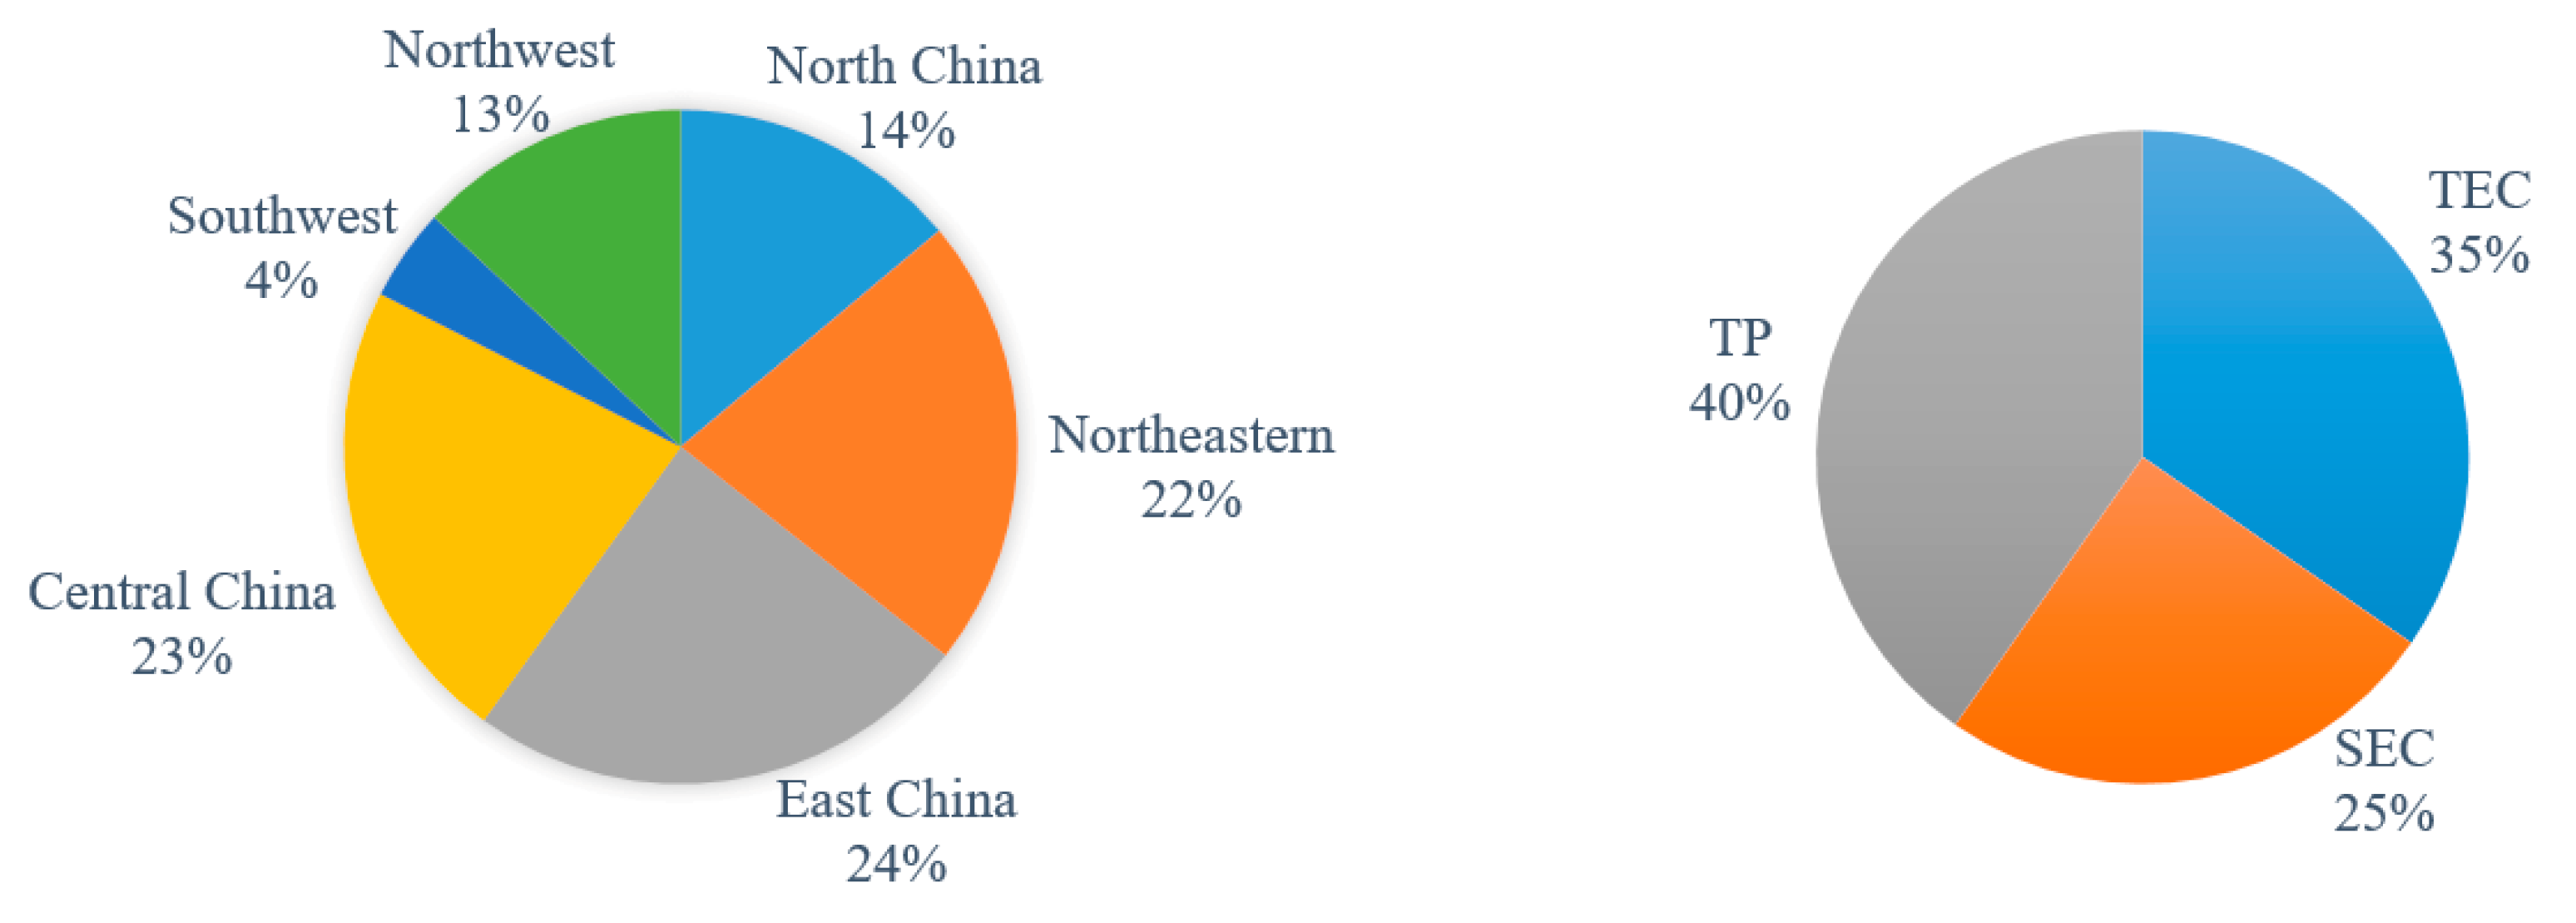
Via the additive TFP indicator and aggregate DDF, productivity gain (loss) can be derived by cumulating individual changes, and the detailed regional and component contributions are illustrated in Figure 4. For example, at regional level, East China, Central China. and Northeastern contribute approximately one-quarter of contributions for total productivity growth respectively; at component level, TP accounts for 40% contributions, which is consistent with Li et al. [16], while TEC and SEC account for 35% and 25% contributions, respectively.
As shown in Table 5, the growth rate of TFP indicator can be further allocated at provincial level. One can note that productivity losses appear in Hebei, Fujian, Shandong, Henan, Guangxi, and Guizhou provinces. Most productivity losses are in less developed provinces, which is consistent with the findings of Audibert et al. [40]. This result suggests more attention on these areas is required by policymakers. Furthermore, technological regress appears in almost half provinces that requires more concerns on innovations, such as improvement of hospital equipment or staff training.
5. Discussion
In this paper, we analyzed TFP growth in Chinese medical institutions over 2009-2018 based on a novel approach using additive productivity indicator and aggregate DDF. The proposed model allows one to identify the contribution from each productivity component and individual DMU. We also apply a generalized decomposition of productivity gains to analyze hospital performance. The result shows that the annual average TFP growth rate in Chinese medical institutions is around 1.87% and technological progress is the main driving force. We also find disparities of hospital performance across regions and provinces.
Assessing performance at the provincial and regional levels, we find that Northeastern, Central China, and Eastern regions exhibited the best performance overall ranging from 0.41% to 0.46%, respectively. However, rather than just assessing performance only this level, we also assessed performance at the provincial level. By breaking down performance, decision makers at the regional level can focus policy remedies at the provincial level. For example, even though East China appeared to have the best performance at the regional level, performance needed to be improved at medical services operating in Fujian and Shandong. Interestingly, at Fujian, technological and technical efficiency was the main culprit for inefficiency whereas in Shandong region, scale inefficiency was the leading cause of overall inefficiency. By decomposing the measures at the regional level, more precise information can be gleaned that was lacking in earlier studies that used only traditional Malmquist approaches. With the ability to further breakdown performance, policymakers can focus on inefficient medical services at the provincial level and further compare why performance may be better (or worse) at neighboring provinces within the region. This latter point is relevant as reforms are changed, including reallocation of resources (inputs from one province to another as needed) and improvements, given any policy changes can be evaluated. We add to the literature on TFP in medical services operating in China in three different ways. First, we use more recent data enabling the analysis to reflect changes encompassing reforms. Second, the use of more rigorous methods provides an ability to extend the analysis beyond radial comparison. Third, the regional productivity gains are obtained by cumulating provincial contributions with well-defined groups. Given the focus of China’s health reform focusing on rural and urban distinctions and medical service ownership, detailed examination enhances the probability of a successful reform. Therefore, decision-makers at all levels of government can have comparable information. As demonstrated by the findings in Table 5, there is a wide variability within each region/province. Hence, a policy assessment can be made as to what is source of deviations of “best” practice as well as identifying which region/province needs more government attention. From our findings, we show which region deserves provincial government attention. In general, our results suggest that the provinces in Southwest may require further assessment by the government in order to provide incentives to improve this Province’s medical services’ productivity.
Our findings do support previous findings in that there are possible productivity gains to be made. Further, earlier studies demonstrated that TFP differences arose because of inefficiency and less so to technological changes. Rather than assessing individual studies, we provide a more global view of all the regions/provinces together, which has the benefit of consistency.
For the sustainability of medical services in China, it is very important to evaluate effectiveness, which includes efficiency, productivity, and the individual factors (purely technical and scale efficiency). From a policy perspective aimed at sustainable medical services, this evaluation needs to be followed by corrective action by policymakers at the provincial, regional, and national level.
The further works could be to examine the relation between productivity growths and policy implementations in the sample period. This may provide evidence to demonstrate if reform measures and new management tools have effective impact on hospital operation. Furthermore, as the technological progress contributes most productivity gains, and the innovation might be driven by governmental preferential policy mix, the investigation of beneficiaries and losers in the reform will help to assess unbalanced development in regional healthcare performance. It has also been argued that there exist several different approaches that can be used to address the same issue of TFP. These approaches include the stochastic frontier analysis, and the semi-parametric Olley–Pakes method. Choosing one method over another is a legitimate concern, however it is also worthwhile to study the same issue using different approaches and after all these studies are completed, can a determination be made as to which approach is most beneficial. Again, this is a call for future research using this rich dataset.
Author Contributions
Introduction and Literature review, V.V.; methodology, X.C.; data and results, X.C. and V.V.; conclusions, V.V., X.C., and T.Y.; writing—original draft preparation, V.V. and X.C.; writing—review and editing, V.V. and X.C. All authors have read and agreed to the published version of the manuscript.
Funding
This research is supported by Central University of Finance and Economics Center for China Fiscal Development Public Health Research Program “Analysis of Social Capital and Mental Health Status of Chinese Private Sector Employees” (023550315008).
Acknowledgments
Authors declare that they have no known competing financial interests or personal relationships that could have appeared to influence the work reported in this paper.
Conflicts of Interest
The authors declare no conflict of interest.
Appendix A
Similarly, and capture the shift of frontiers in terms of output- and input-based changes by considering the distances of output/input combinations, respectively.
As the VRS assumption is imposed on the provincial hospital production technologies, the terms of and could be defined as the difference between TFP and other components, namely as residuals in Equation (A4). The detail transformation is available from Shen et al. [34].
Appendix B

Table A1.
Illustration of productivity indicator and its decompositions.
| Indicator | Interpretation | Example |
|---|---|---|
| TFP | Ratio of aggregate outputs change on inputs change | All below |
| TEC | How well use resources efficiently | More efficiently utilization of medical resources |
| TP | Contribution of technological innovations | New equipment or medical skills |
| SEC | How far is the distance between the evaluated scale and most productive scale size | Approaching to most productive scale size by controlling hospitals’ size |
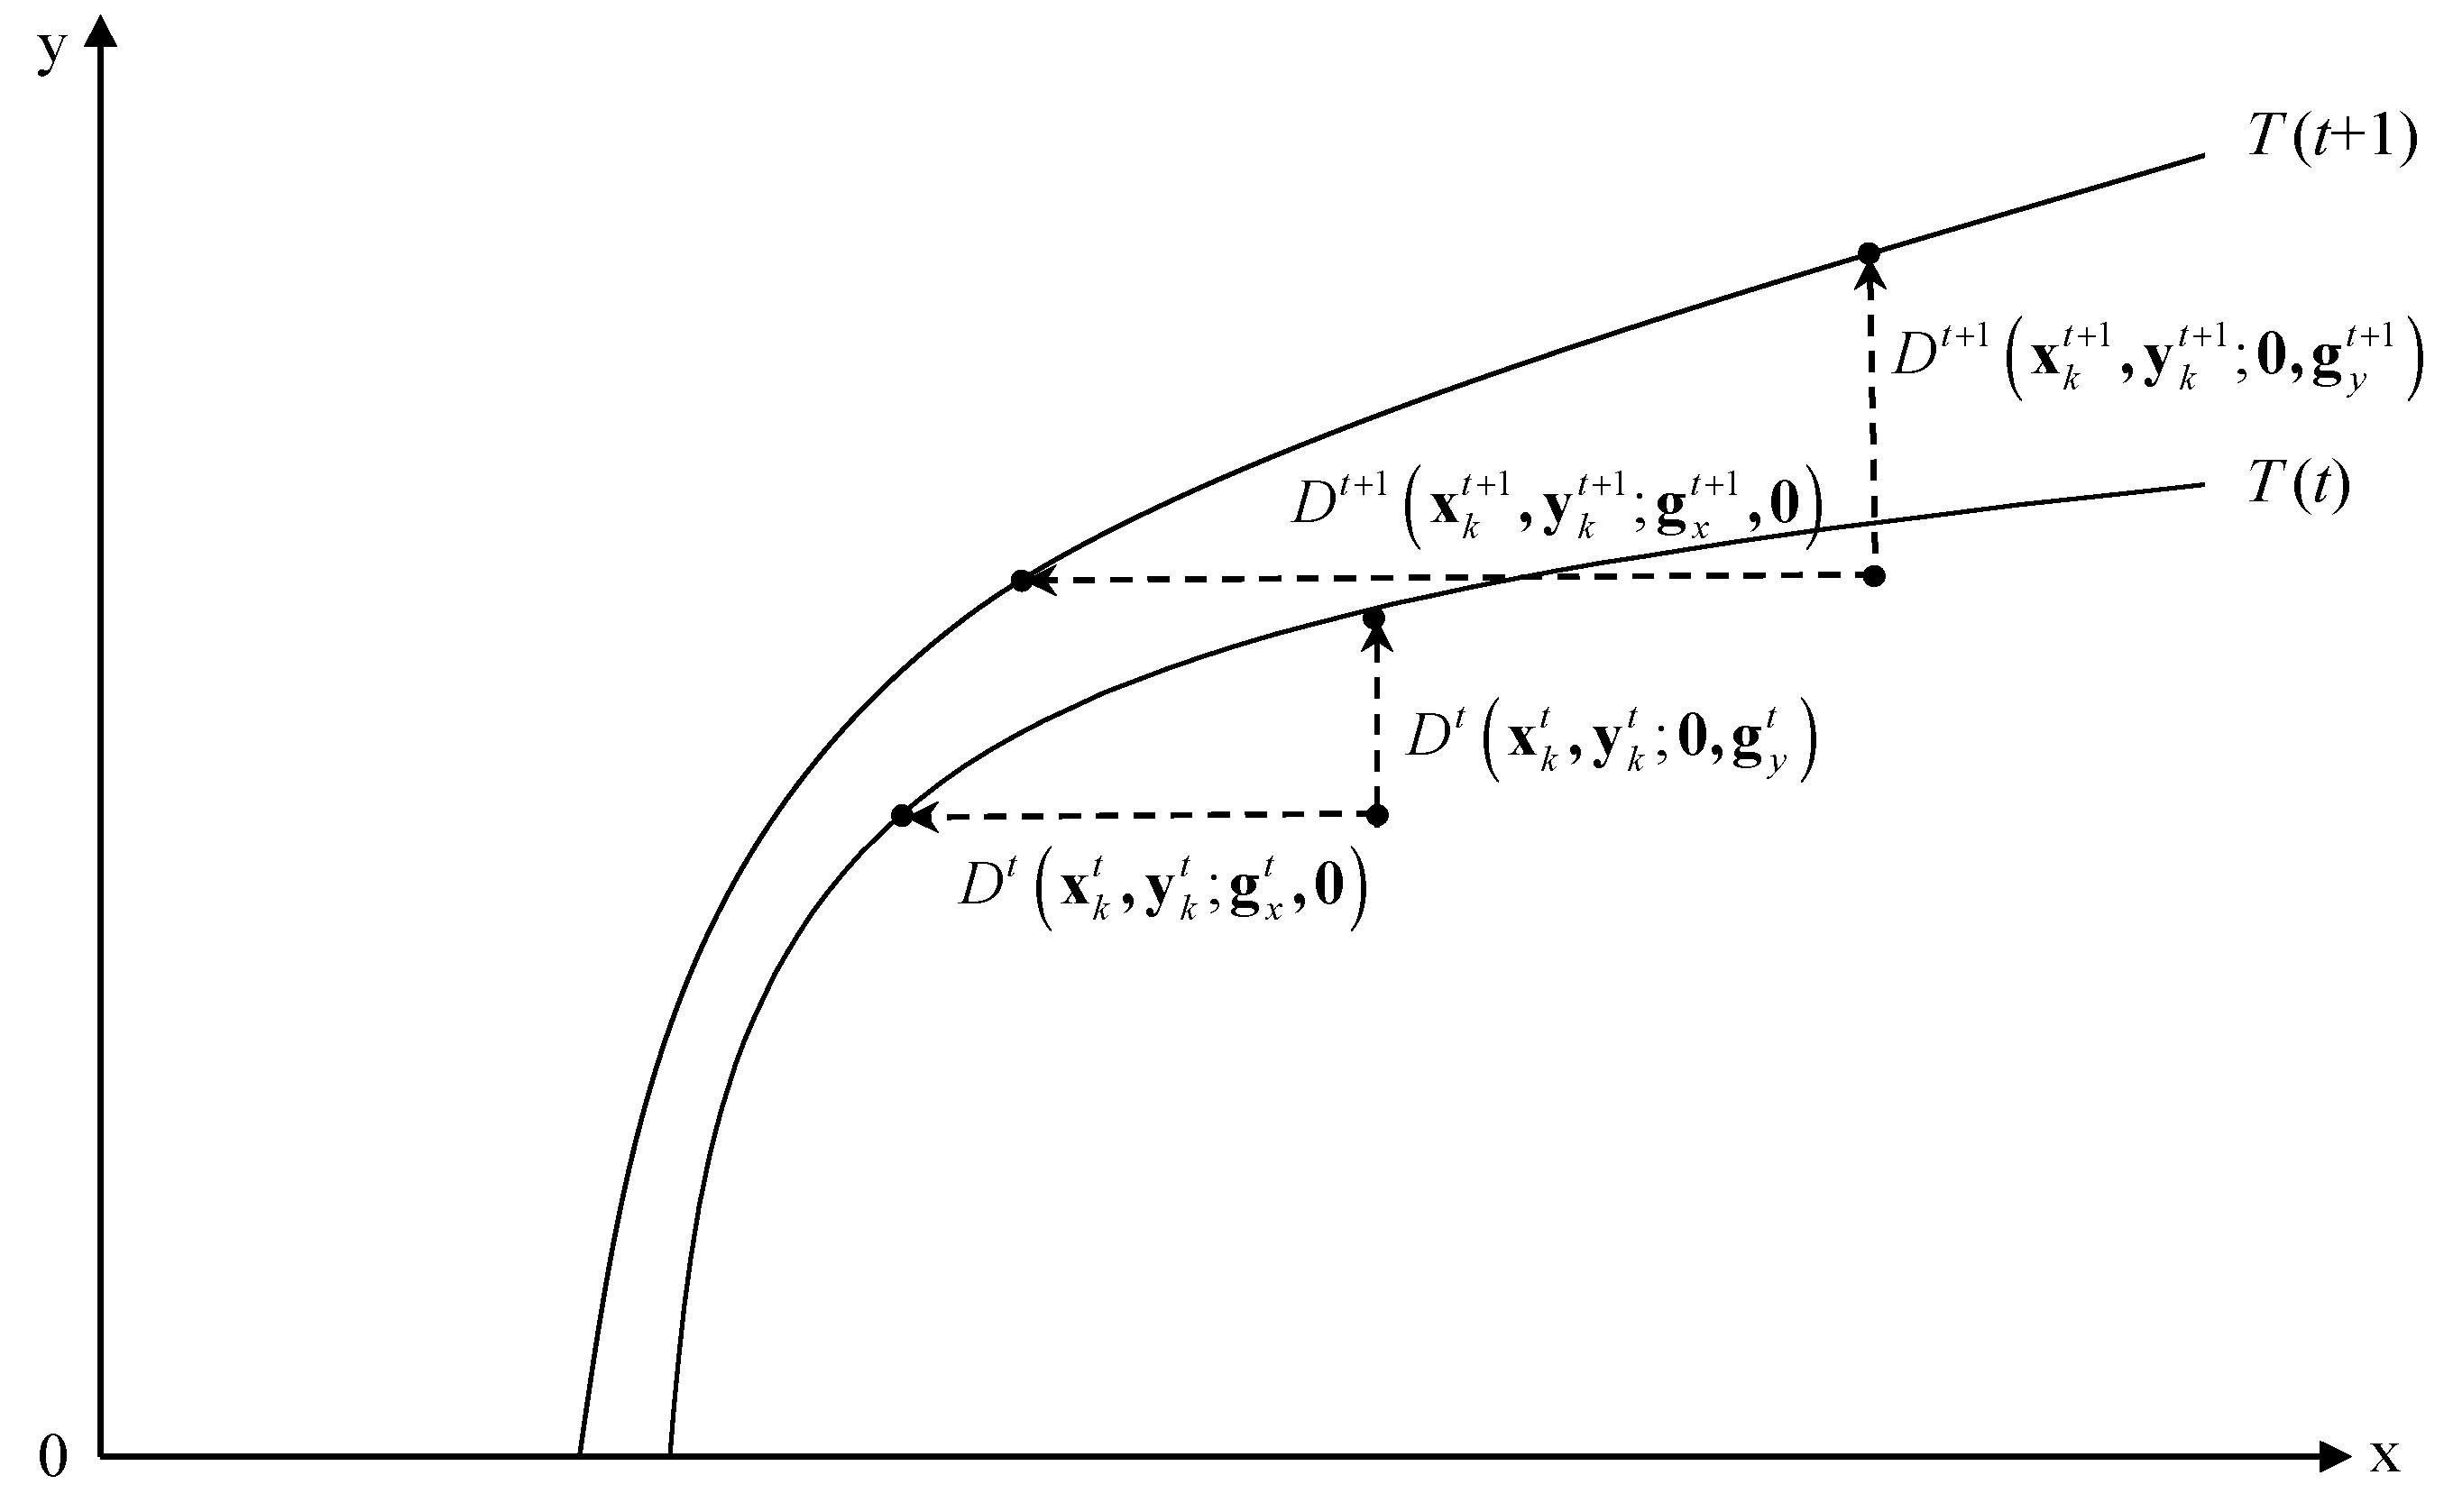
Figure A1.
Decomposition for technical inefficiency change. Source from: Shen et al. [34].
Figure A1.
Decomposition for technical inefficiency change. Source from: Shen et al. [34].

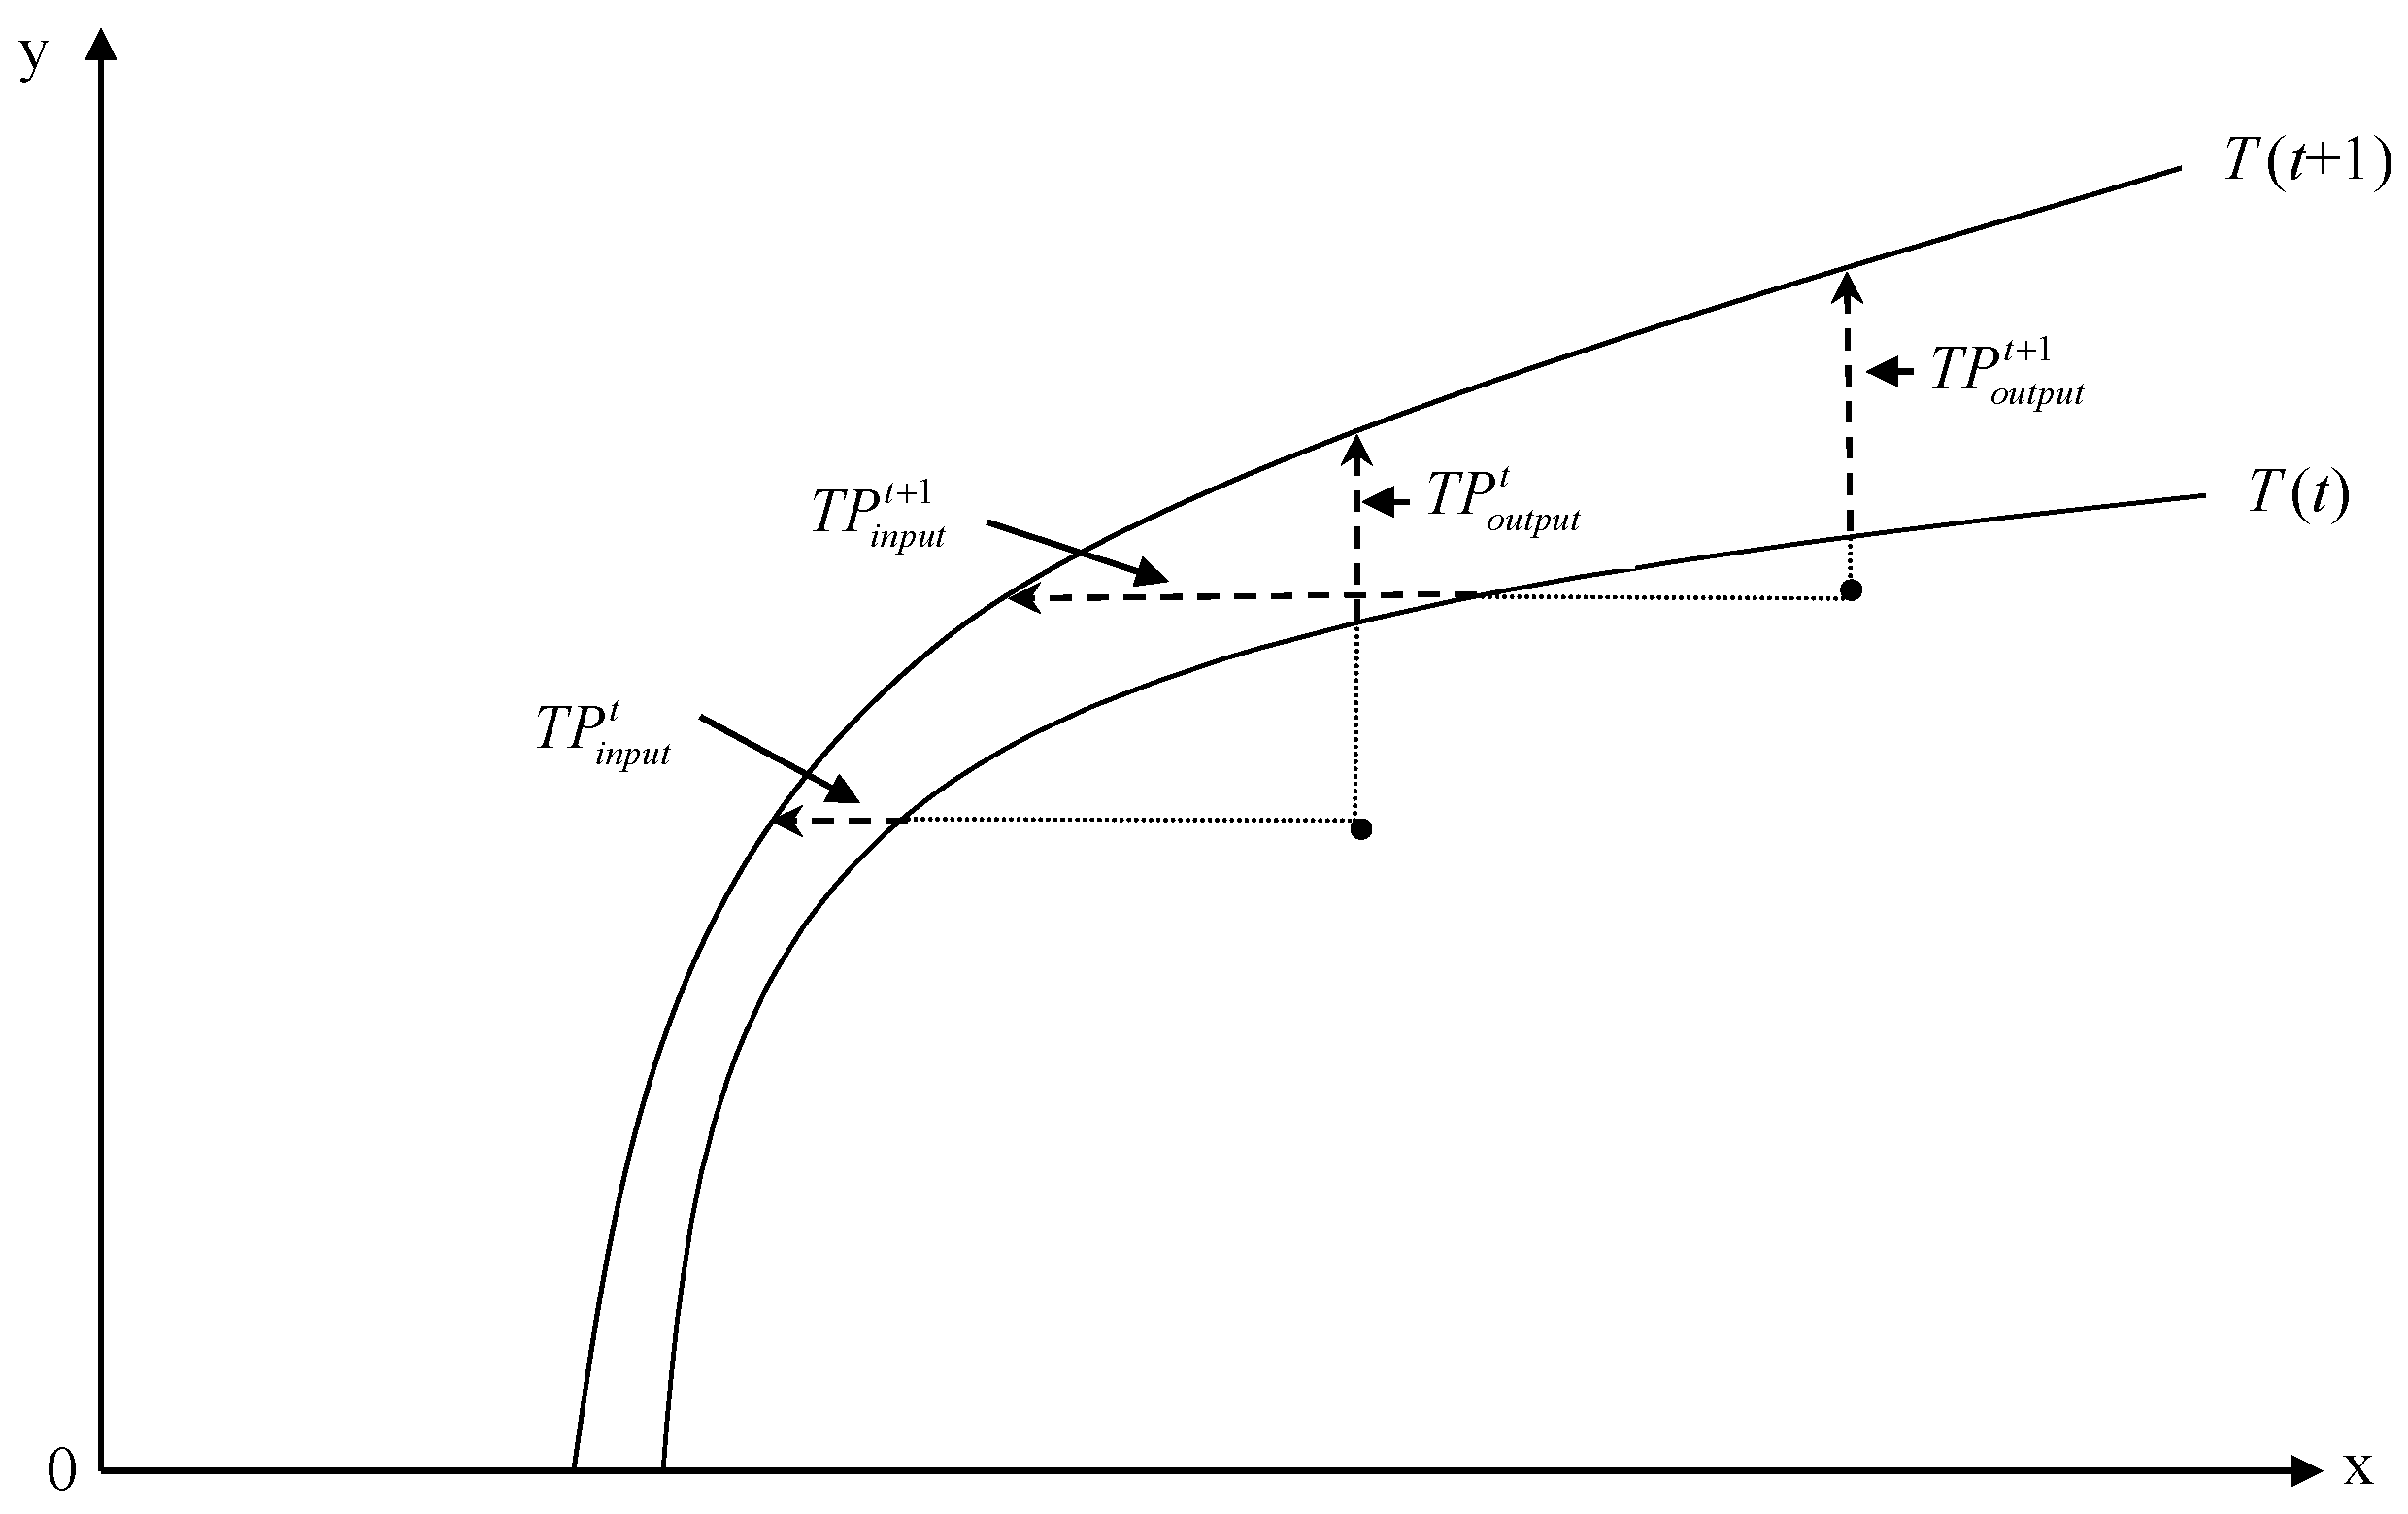
Figure A2.
Decomposition for technological progress. Source from: Shen et al. [34].
Figure A2.
Decomposition for technological progress. Source from: Shen et al. [34].

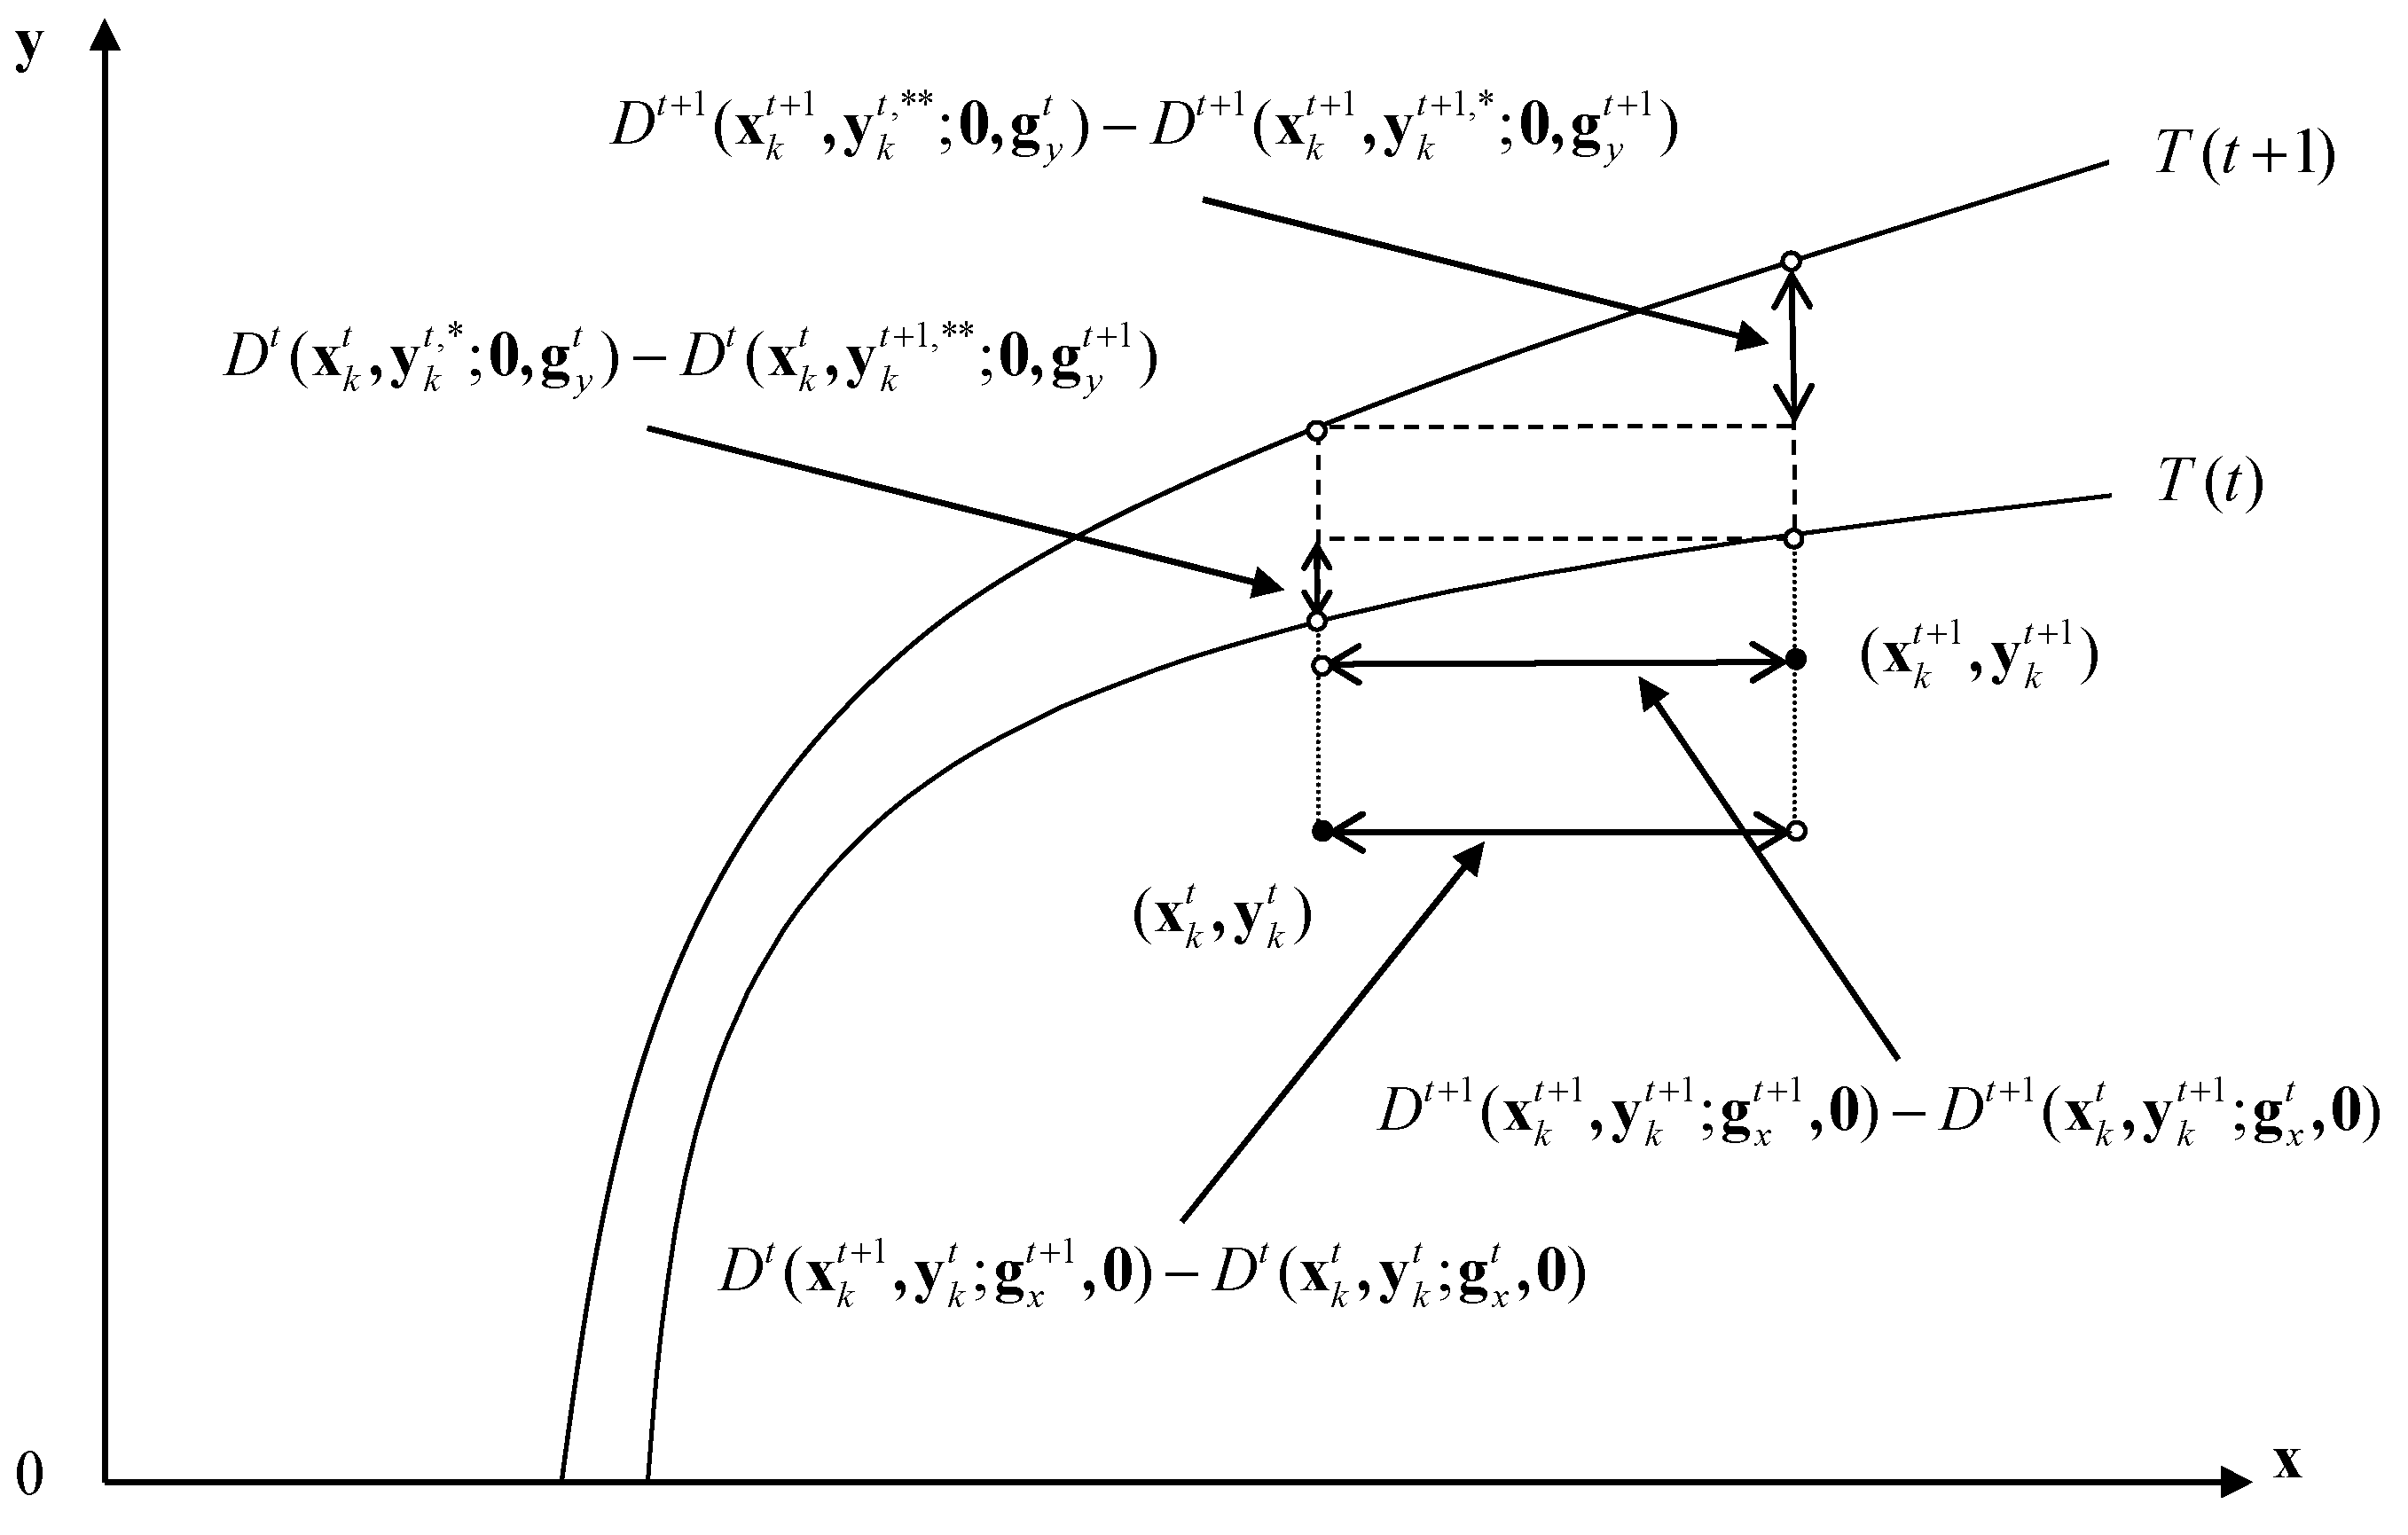
Figure A3.
Output side decomposition for scale efficiency change. Source from: Shen et al. [34].
Figure A3.
Output side decomposition for scale efficiency change. Source from: Shen et al. [34].

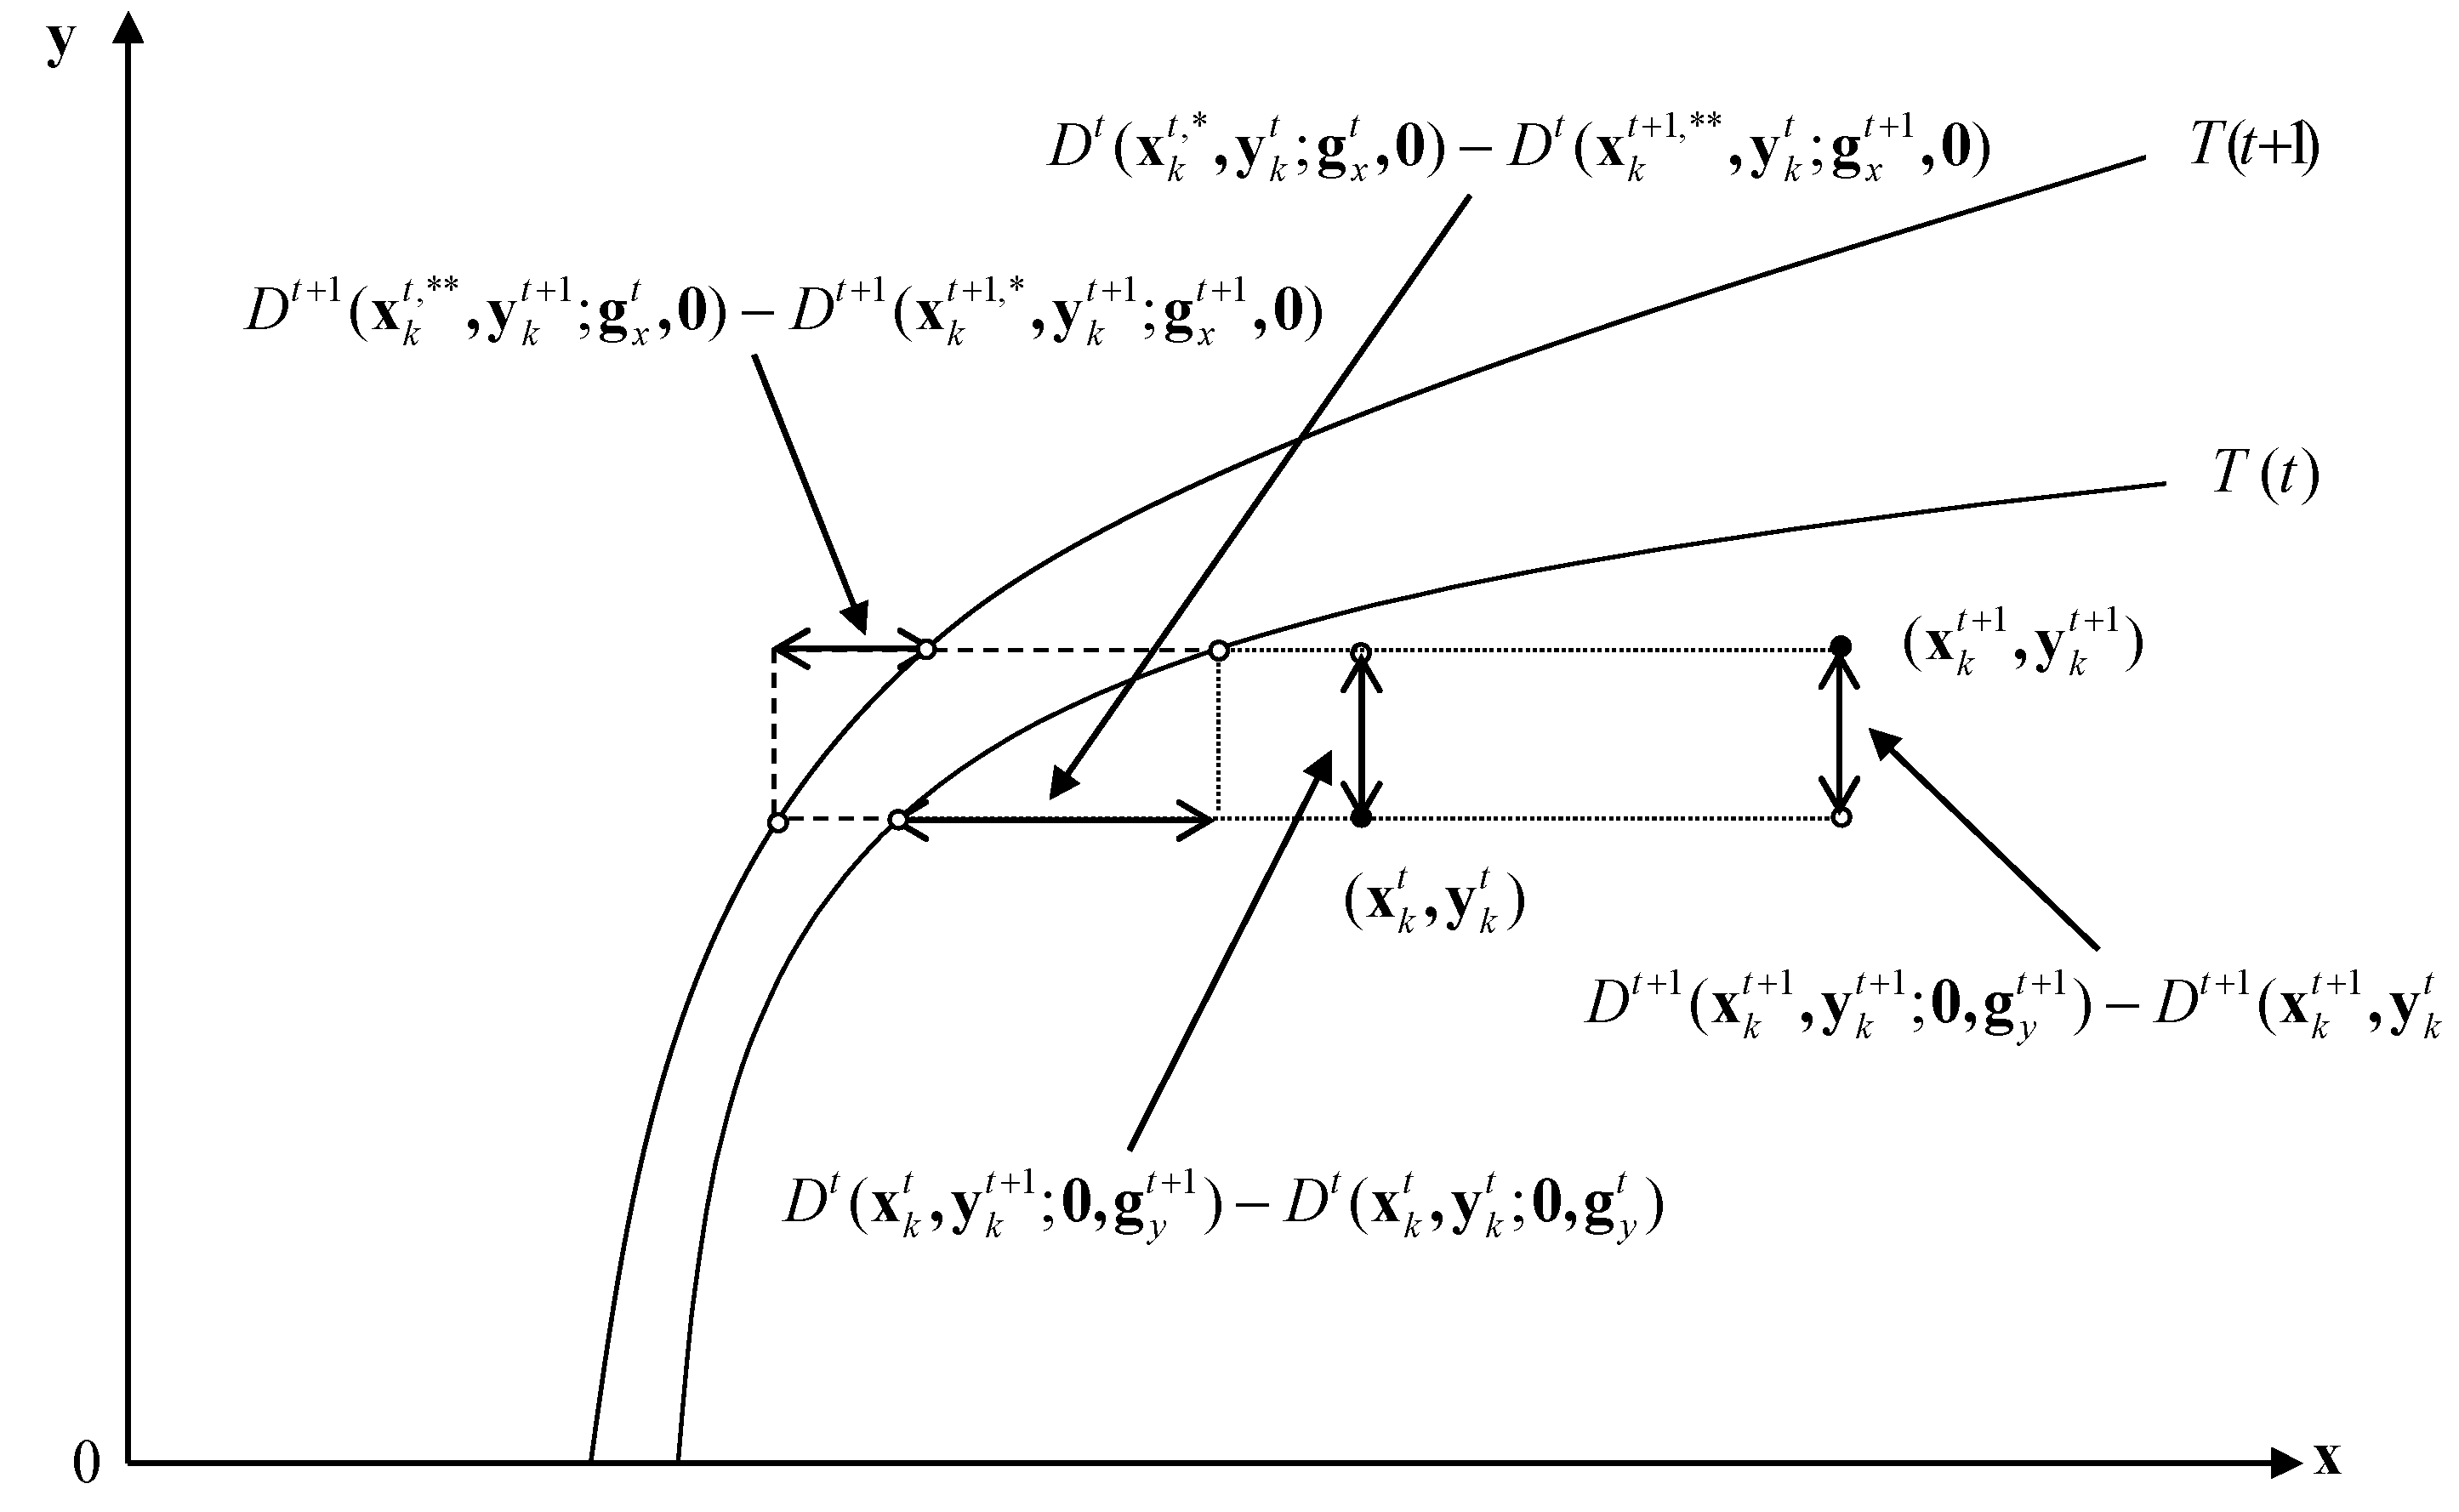
Figure A4.
Input side decomposition for scale efficiency change. Source from: Shen et al. [34].
Figure A4.
Input side decomposition for scale efficiency change. Source from: Shen et al. [34].

References
- National Bureau of Statistics of China. National Annual Data. 2020. Available online: http://www.stats.gov.cn/english/Statisticaldata/AnnualData/ (accessed on 18 March 2020).
- Yip, W.; Hsiao, W. China’s health care reform: A tentative assessment. China Econ. Rev. 2009, 20, 613–619. [Google Scholar] [CrossRef]
- O’Donnell, C. An aggregate quantity-price framework for measuring and decomposing productivity and profitability change. J. Prod. Anal. 2012, 38, 255–272. [Google Scholar] [CrossRef]
- Kerstens, K.; Shen, Z.; Van de Woestyne, I. Comparing Luenberger and Luenberger-Hicks-Moorsteen productivity indicators: How well is total factor productivity approximated? Int. J. Prod. Econ. 2018, 195, 311–318. [Google Scholar] [CrossRef] [Green Version]
- The State Council Information Office of the People’s Republic of China. Development of China’s Public Health as an Essential Element of Human Rights. National Health Commission of the People’s Republic of China. 2017. Available online: http://en.nhc.gov.cn/2019-04/29/c_75161.htm (accessed on 18 March 2020).
- Tlotlego, N.; Nonvignon, J.; Sambo, L.G.; Asbu, E.Z.; Kirigia, J.M. Assessment of productivity of hospitals in Botswana: A DEA application. Int. Arch. Med. 2010, 3, 27. [Google Scholar] [CrossRef] [Green Version]
- Pham, T.L. Efficiency and productivity of hospitals in Vietnam. J. Health Organ. Manag. 2011, 25, 195–213. [Google Scholar] [CrossRef]
- Nabilou, B.; Yusefzadeh, H.; Rezapour, A.; Ebadi Fard Azar, F.; Salem Safi, P.; Sarabi Asiabar, A.; Ahmadzadeh, N. The productivity and its barriers in public hospitals: Case study of Iran. Med J. Islamic Repub. Iran 2016, 30, 36–43. [Google Scholar]
- Fare, R.; Grosskopf, S.; Norris, M.; Zhang, Z. Productivity growth, technical progress, and efficiency change in industrialized countries. Am. Econ. Rev. 1994, 84, 66–83. [Google Scholar]
- Pang, R. Evaluation of Chinese Hospital’s Operation Performances-Two Stages Analysis Based on Data Envelopment Analysis (DEA). Nankai Econ. Stud. 2006, 4, 71–81. (In Chinese) [Google Scholar]
- Gai, R.; Zhou, C.; Xu, L.; Zhu, M.; Tang, W. Health resource allocation and productive efficiency of Chinese county hospitals: Data from 1993 to 2005. Biosci. Trends 2010, 4, 218–224. [Google Scholar]
- Ng, Y.C. The productive efficiency of Chinese hospitals. China Econ. Rev. 2011, 22, 428–439. [Google Scholar] [CrossRef]
- Hu, H.; Qi, Q.; Yang, C. Analysis of hospital technical efficiency in China: Effect of health insurance reform. China Econ. Rev. 2012, 23, 865–877. [Google Scholar] [CrossRef]
- Yang, J.; Zeng, W. The trade-offs between efficiency and quality in the hospital production: Some evidence from Shenzhen. China Econ. Rev. 2014, 31, 166–184. [Google Scholar] [CrossRef]
- Liu, C.; Jiang, D.; Wang, H. Analysis on the technical efficiency and total factor productivity of township hospitals in the county of Hubei province under the background of national health. Chin. Prim. Health Care 2018, 9, 10–12. (In Chinese) [Google Scholar]
- Li, H.; Dong, S.; Liu, T. Relative efficiency and productivity: A preliminary exploration of public hospitals in Beijing, China. BMC Health Serv. Res. 2014, 14. [Google Scholar] [CrossRef] [PubMed] [Green Version]
- Cheng, Z.; Tao, H.; Cai, M.; Lin, H.; Lin, X.; Shu, Q.; Zhang, R. Technical efficiency and productivity of Chinese county hospitals: An exploratory study in Henan province. BMJ Open 2015, 5, e007267. [Google Scholar] [CrossRef] [Green Version]
- Chen, S.; Wu, Y.; Chen, Y.; Zhu, H.; Wang, Z.; Feng, D.; Feng, Z.; Yao, L.; Xiang, L.; Wong, E.; et al. Analysis of operation performance of general hospitals in Shenzhen, China: A super-efficiency data envelopment analysis. Lancet 2016, 388, S57. [Google Scholar] [CrossRef]
- Li, S.; He, X. The impacts of marketization and subsidies on the treatment quality performance of the Chinese hospitals sector. China Econ. Rev. 2019, 54, 41–50. [Google Scholar] [CrossRef]
- Boussemart, J.P.; Leleu, H.; Ferrier, G.; Shen, Z. An Expanded Decomposition of the Luenberger Productivity Indicator with an Application to the Chinese Healthcare Sector. OMEGA 2020, 91, 102010. [Google Scholar] [CrossRef]
- Koopmans, T.C. (Ed.) Activity Analysis of Production and Allocation (No. 13); Wiley: New York, NY, USA, 1951. [Google Scholar]
- Debreu, G. The coefficient of resource utilization. Econometrica 1951, 19, 273–292. [Google Scholar] [CrossRef]
- Shephard, R.W. Cost and Production Functions; Princeton University Press: Princeton, NJ, USA, 1953. [Google Scholar]
- Farrell, M.J. The measurement of productive efficiency. J. R. Stat. Soc. Ser. A Gen. 1957, 120, 253–282. [Google Scholar] [CrossRef]
- Hackman, S.T. Production Economics: Integrating the Microeconomic and Engineering Perspectives; Springer: Berlin, Germany, 2008. [Google Scholar]
- Shen, Z. Essays on Green Productivity. 2016. Available online: http://www.theses.fr/2016LIL12004 (accessed on 12 January 2020).
- Chambers, R.; Chung, Y.; Färe, R. Benefit and distance functions. J. Econ. Theory 1996, 70, 407–419. [Google Scholar] [CrossRef]
- Shen, Z.; Baležentis, T.; Chen, X.; Valdmanis, V. Green growth and structural change in Chinese agricultural sector during 1997–2014. China Econ. Rev. 2018, 51, 83–96. [Google Scholar] [CrossRef]
- Shen, Z.; Boussemart, J.-P.; Leleu, H. Aggregate green productivity growth in OECD’s countries. Int. J. Prod. Econ. 2017, 189, 30–39. [Google Scholar] [CrossRef] [Green Version]
- Shen, Z.; Valdmanis, V. Identifying the contribution to hospital performance among Chinese regions by an aggregate directional distance function. Health Care Manag. Sci. 2020, 23, 142–152. [Google Scholar] [CrossRef]
- Baležentis, T.; Blancard, S.; Shen, Z.; Štreimikienė, D. Analysis of environmental total factor productivity evolution in European agricultural sector. Decis. Sci. 2019. [CrossRef]
- Briec, W.; Kerstens, K. A Luenberger-Hicks-Moorsteen productivity indicator: Its relation to the Hicks-Moorsteen productivity index and the Luenberger productivity indicator. Econ. Theory 2004, 23, 925–939. [Google Scholar] [CrossRef]
- Ang, F.; Kerstens, P.J. Decomposing the Luenberger–Hicks–Moorsteen total factor productivity indicator: An application to U.S. Agric. Eur. J. Oper. Res. 2017, 260, 359–375. [Google Scholar] [CrossRef]
- Shen, Z.; Baležentis, T.; Ferrier, G. Agricultural productivity evolution in China: A generalized decomposition of the Luenberger-Hicks-Moorsteen productivity indicator. China Econ. Rev. 2019, 57, 101315. [Google Scholar] [CrossRef]
- National Bureau of Statistics of China. National Annual Data. 2009–2018. Available online: http://www.stats.gov.cn/english/Statisticaldata/AnnualData/ (accessed on 2 March 2020).
- Jakovljevic, M. Comparison of historical medical spending patterns among the BRICS and G7. J. Med. Econ. 2016, 19, 70–76. [Google Scholar] [CrossRef]
- Jakovljevic, M.; Potapchik, E.; Popovich, L.; Barik, D.; Getzen, T.E. Evolving health expenditure landscape of the BRICS nations and projections to 2025. Health Econ. 2017, 26, 844–852. [Google Scholar] [CrossRef]
- Wang, Y.; Zhang, Y.; Ma, C.; Jiang, Y.; Li, Y.; Wang, X.; Ma, S. Limited effects of the comprehensive pricing healthcare reform in China. Public Health 2019, 175, 4–7. [Google Scholar] [CrossRef] [PubMed]
- Chen, Z.; Barros, C.; Hou, X. Has the medical reform improved the cost efficiency of Chinese hospitals? Soc. Sci. J. 2016, 53, 510–520. [Google Scholar] [CrossRef]
- Audibert, M.; Mathonnat, J.; Pelissier, A.; Huang, X.; Ma, A. Health insurance reform and efficiency of township hospitals in rural China: An analysis from survey data. China Econ. Rev. 2013, 27, 326–338. [Google Scholar] [CrossRef] [Green Version]
Figure 1.
Cumulative TFP indicators and its decomposition. TFP is computed by Equation (A1); technical efficiency change (TEC) is computed by Equation (A2); TP is computed by Equation (A3); SEC is computed by Equation (A4).
Figure 1.
Cumulative TFP indicators and its decomposition. TFP is computed by Equation (A1); technical efficiency change (TEC) is computed by Equation (A2); TP is computed by Equation (A3); SEC is computed by Equation (A4).

Figure 2.
The box-plot of TFP change in Chinese provincial hospitals. Reported results are computed by Equation (A1).
Figure 2.
The box-plot of TFP change in Chinese provincial hospitals. Reported results are computed by Equation (A1).

Figure 3.
Cumulative TFP growths among Chinese regions. Cumulative TFP growths are computed by Equations (6) and (A1).
Figure 3.
Cumulative TFP growths among Chinese regions. Cumulative TFP growths are computed by Equations (6) and (A1).

Figure 4.
Decomposition of TFP contributions at regional and component levels. TFP contributions are allocated by Equations (5) and (6).
Figure 4.
Decomposition of TFP contributions at regional and component levels. TFP contributions are allocated by Equations (5) and (6).

Table 1.
The main objectives and actions in Chinese hospitals’ reforms (1978–2018).
| Period | Objectives | Actions | Achievements |
|---|---|---|---|
| 1978–2004 | Reform on medical services from planned system to marketization | Encouraging hospitals to operate independently and self-financing while reducing government intervention. | Medical conditions have been improved significantly and health resources have increased rapidly. |
| 2004–2009 | Transition stage | Preparing for new reform. | |
| 2009–2018 | Current medical reform | Accelerating the building of an integrated medical and health service system of good quality and high efficiency, and improve the medicine supply system. | Great improvement in the quality of medical and health services, more people are satisfied with services provided by public hospitals. |
Source from: The State Council Information Office of the People’s Republic of China [5].
Table 2.
Methods used for measuring efficiency/productivity.
| Method | Approach | Measurement | Pros/Cons |
|---|---|---|---|
| Data Envelopment Analysis | Non-Parametric | Technical Efficiency: How well use resources; Allocative Efficiency: Efficient mix of inputs/outputs; Scale Efficiency: How far is approaching to most productive scale size. | Pros: Does not impose a predetermined functional form based on cost minimization or profit maximization which may not be applicable to non-markets including hospitals. Prices are also not required but based on inputs/outputs in whole units. Cons: Is data dependent therefore efficiency may be over/underestimated due to external factors. |
| Malmquist Measure | Non-Parametric/Parametric | Efficiency change: moving to the frontier; Technological change: moving to a new frontier. | See Above |
| Stochastic Frontier Analysis | Parametric | Explanation of costs given input and environmental factors. | Pros: Includes all factors of production and environmental variables to estimate costs. Cons: Uses costs that may not be market based. |
| Luenberger productivity indicator | Non-Parametric/Parametric | Efficiency change, Technology change in addition to the ability to add the scores across observations under study. | Pros: Expands on the traditional Malmquist approach with directional distance functions including additivity and improved capacity for comparability. Cons: The same as for the traditional Malmquist approach. |
| Olley-Pake | Semi-Parametric | Productivity | Pros: Provide consistent results. Cons: Focuses on investment of inputs which may be exogenously determined—Medical services are required as a social good. |
Table 3.
Statistical description of variables (2009–2018).
| Indicator | Mean | Max | Min | S.D. | Trend | |
|---|---|---|---|---|---|---|
| Inputs | Beds | 20.53 | 60.85 | 0.84 | 13.64 | 7.16% |
| Doctors | 9.27 | 29.04 | 0.40 | 6.04 | 4.90% | |
| Nurses | 9.38 | 33.46 | 0.17 | 6.50 | 8.83% | |
| Other staffs | 5.21 | 14.43 | 0.35 | 3.24 | 3.32% | |
| Outputs | Outpatients | 10.71 | 42.29 | 0.36 | 9.17 | 0.61% |
| Inpatients | 6.26 | 19.16 | 0.15 | 4.45 | 7.41% | |
| Surgery | 1.36 | 7.35 | 0.02 | 1.09 | 9.20% | |
| Treatment | 219.98 | 825.89 | 9.23 | 174.69 | 4.83% | |
Note: The trend is annual growth rate computed by ordinary least square.
Table 4.
Annual average regional growth rates of total factor productivity (TFP) indicator and its decomposition (2009–2018).
Table 4.
Annual average regional growth rates of total factor productivity (TFP) indicator and its decomposition (2009–2018).
| Variable | China | North China | Northeastern | East China | Central China | Southwest | Northwest |
|---|---|---|---|---|---|---|---|
| TFP | 1.87% | 0.26% | 0.41% | 0.46% | 0.42% | 0.08% | 0.24% |
| TEC | 0.65% | 0.18% | 0.18% | 0.05% | 0.11% | 0.01% | 0.13% |
| -output | 0.73% | 0.22% | 0.20% | 0.05% | 0.11% | 0.01% | 0.14% |
| -input | 0.57% | 0.14% | 0.16% | 0.05% | 0.10% | 0.01% | 0.11% |
| SEC | 0.47% | 0.27% | 0.17% | −0.08% | −0.19% | 0.17% | 0.14% |
| -output | 0.19% | 0.44% | 0.13% | −0.16% | −0.39% | 0.06% | 0.12% |
| -input | 0.75% | 0.10% | 0.20% | 0.01% | 0.01% | 0.27% | 0.15% |
| TP | 0.75% | −0.19% | 0.06% | 0.48% | 0.51% | −0.09% | −0.02% |
| -output | 0.95% | −0.40% | 0.08% | 0.57% | 0.71% | 0.01% | −0.02% |
| -input | 0.55% | 0.02% | 0.04% | 0.40% | 0.30% | −0.20% | −0.01% |
Note: Reported results are computed by Equations (A1)–(A4).
Table 5.
Annual average provincial growth rates of TFP indicator and its decomposition (2009–2018).
| Province | TFP | TEC | SEC | TP |
|---|---|---|---|---|
| North China | 0.26% | 0.18% | 0.27% | −0.19% |
| Beijing | 0.13% | 0.06% | 0.07% | 0.00% |
| Tianjin | 0.02% | 0.01% | 0.02% | −0.01% |
| Hebei | −0.15% | 0.00% | 0.03% | −0.18% |
| Shanxi | 0.21% | 0.09% | 0.08% | 0.04% |
| Inner Mongolia | 0.05% | 0.02% | 0.07% | −0.04% |
| Northeastern | 0.41% | 0.18% | 0.17% | 0.06% |
| Liaoning | 0.22% | 0.06% | 0.06% | 0.09% |
| Jilin | 0.12% | 0.08% | 0.05% | −0.01% |
| Heilongjiang | 0.07% | 0.04% | 0.05% | −0.02% |
| East China | 0.46% | 0.05% | −0.08% | 0.48% |
| Shanghai | 0.16% | 0.00% | 0.02% | 0.14% |
| Jiangsu | 0.21% | 0.05% | 0.00% | 0.15% |
| Zhejiang | 0.08% | 0.00% | 0.11% | −0.02% |
| Anhui | 0.15% | 0.03% | 0.03% | 0.09% |
| Fujian | −0.02% | −0.03% | 0.04% | −0.03% |
| Jiangxi | 0.00% | 0.00% | 0.00% | −0.01% |
| Shandong | −0.13% | 0.00% | −0.28% | 0.16% |
| Central China | 0.42% | 0.11% | −0.19% | 0.51% |
| Henan | −0.09% | 0.00% | −0.18% | 0.09% |
| Hubei | 0.25% | 0.08% | −0.02% | 0.19% |
| Hunan | 0.13% | 0.02% | −0.07% | 0.18% |
| Guangdong | 0.14% | 0.00% | 0.05% | 0.09% |
| Guangxi | −0.01% | 0.00% | 0.01% | −0.02% |
| Hainan | 0.01% | 0.00% | 0.01% | −0.01% |
| Southwest | 0.08% | 0.01% | 0.17% | −0.09% |
| Chongqing | 0.04% | 0.01% | 0.02% | 0.01% |
| Sichuan | 0.04% | 0.00% | 0.08% | −0.04% |
| Guizhou | −0.02% | 0.00% | 0.02% | −0.04% |
| Yunnan | 0.03% | 0.00% | 0.04% | −0.02% |
| Tibet | 0.00% | 0.00% | 0.00% | 0.00% |
| Northwest | 0.24% | 0.13% | 0.14% | −0.02% |
| Shaanxi | 0.14% | 0.05% | 0.06% | 0.03% |
| Gansu | 0.01% | 0.02% | 0.02% | −0.03% |
| Qinghai | 0.00% | 0.00% | 0.01% | 0.00% |
| Ningxia | 0.01% | 0.00% | 0.01% | 0.00% |
| Xinjiang | 0.08% | 0.06% | 0.04% | −0.01% |
| China | 1.87% | 0.65% | 0.47% | 0.75% |
Note: Reported results are computed by Equations (1)–(4) in Appendix A.
© 2020 by the authors. Licensee MDPI, Basel, Switzerland. This article is an open access article distributed under the terms and conditions of the Creative Commons Attribution (CC BY) license (http://creativecommons.org/licenses/by/4.0/).
Share and Cite
MDPI and ACS Style
Chen, X.; Valdmanis, V.; Yu, T. Productivity Growth in Chinese Medical Institutions during 2009–2018. Sustainability 2020, 12, 3080. https://0-doi-org.brum.beds.ac.uk/10.3390/su12083080
AMA Style
Chen X, Valdmanis V, Yu T. Productivity Growth in Chinese Medical Institutions during 2009–2018. Sustainability. 2020; 12(8):3080. https://0-doi-org.brum.beds.ac.uk/10.3390/su12083080
Chicago/Turabian StyleChen, Xueli, Vivian Valdmanis, and Tuotuo Yu. 2020. "Productivity Growth in Chinese Medical Institutions during 2009–2018" Sustainability 12, no. 8: 3080. https://0-doi-org.brum.beds.ac.uk/10.3390/su12083080
Note that from the first issue of 2016, this journal uses article numbers instead of page numbers. See further details here.