Intellectual Capital Disclosure: Some Evidence from Healthy and Distressed Banks in Italy


1
Department Management and Business Administration, D’Annunzio University of Chieti-Pescara, 65127 Pescara, Italy
2
Department of Economia e Management, University of Pisa, 56124 Pisa, Italy
*
Author to whom correspondence should be addressed.
Sustainability 2020, 12(8), 3174; https://0-doi-org.brum.beds.ac.uk/10.3390/su12083174
Submission received: 16 March 2020
/
Revised: 10 April 2020
/
Accepted: 13 April 2020
/
Published: 15 April 2020
(This article belongs to the Special Issue New Economic and Financial Challenges for Social and Environmental Sustainability)
Abstract
:The article investigates the intellectual capital disclosure of Italian banks over the years 2016–2017, applying the specific lens of healthy and distressed banks. To this end, we used content analysis and encoding techniques. The main results point out that intellectual capital (IC) disclosure is generally poor and that the intensity of disclosure varies slightly between healthy and distressed banks. Regarding the quality of disclosure, healthy banks present a higher, albeit modest, tendency to disclose non-qualitative and forward-looking information, maybe due to the fact that they are more focused on the strategies and the relationships with stakeholders as opposed to a more short-term approach of the distressed banks. To complement our study on healthy and distressed banks, we repeated the analysis focusing on bank size and independent directors. In this case, results do not show relevant differences in terms of IC disclosure. Hence, our findings suggest the need to consider banks’ IC disclosure as a strategic asset for increasing, among others, transparency and reputation.
1. Introduction
Although there is not an unambiguous definition of intellectual capital (IC), there is no doubt that it is focused on the concepts of knowledge and information, as well as their capacity to contribute to the creation of firms’ value [1]. In order to clarify the IC scope, some approaches have been elaborated over recent decades, including those which identify certain IC elements, all aimed at achieving the creation of value [2,3]. Firstly, we refer to Sveiby’s [4] Intangible Asset Monitor which outlines the external structure (customers), internal structure (organization), and employee competence (people) as IC categories, and provides specific indicators (related to growth, renewal, efficiency, and stability) for each of them. Another categorization, proposed by the business navigator Skandia, is anchored on the following business elements: financial, renewal and development, customer, process, and human focus [1]. Additionally, the Balanced Scorecard identifies different perspectives of analysis, which are: financial, customer, business process, and learning and growth [5]. These models are linked by a multi-disciplinary approach, as they define the IC by using both external and internal means that firms may use for achieving future benefits in general and for increasing the creation of value in particular [6]. Therefore, currently, the scope of IC is designed as a blend—and not merely a sum—of firms’ capital, specifically human, organizational, and relational capital [7]. Emphasis should hence be placed on the interconnectedness between all these resources, achievable by means of the intangible activities undertaken by firms. This also helps explain the dynamic character of IC and the reason it could be considered a “phenomenon of interrelationships and interactions, having each component little value if considered per se, but as a whole it represents great value for the organization” [8].
In respect of the individual types of capital, it is possible, consistent with the existing literature, to detect some characterizing features. Human capital, defined by Sveiby [4] as “the capacity to act in a wide variety of situations to create both tangible and intangible assets”, consists of personnel’s attributes (e.g., knowledge, skills, motivation, experience, abilities); some of them are linked to individuals (such as technical competence, previous experience, and creativity), while others are connected with the firm as a whole (e.g., teamwork, healthy work environment). Brooking [2] defines structural capital as “the skeleton and the adhesive of the organization, which strengthens the company and creates a close and coherent relationship between individuals and their processes”, so that it may be regarded as the knowledge inherent in a single organization. Some examples include procedures, systems, cultures, databases, technologies, and organizational learning capacity. Lastly, relational capital focuses on the relations of a firm with third parties, such as customers, suppliers, investors, and creditors, and also includes the external perception of the firm. For this, it may relate to elements such as image, customer loyalty and satisfaction, and environmental activities [9].
It is therefore clear how the IC could be enhanced within a knowledge-based scenario, taking into account that only a profitable knowledge management, aimed at achieving the best benefit of stakeholders, may represent a significant driver of the companies’ success [9]; this is particularly significant in the case of banks, as “perfect” representatives of a knowledge-based economy. Thus, IC is essential in the banking activity [6]: banks are considered knowledge-intensive institutions, due to a business model highly focused on individual knowledge workers, great use of technology, and the interaction between employees and customers [10,11,12].
The centrality of knowledge in the banking sector explains, moreover, the need for an increase in the transparency of IC information, especially in times of financial crisis, and, therefore, of general lack of belief in banks’ reliability. Truly, in this respect, existing literature shows different empirical evidence: some studies find that IC disclosure increases in crisis periods, since it is considered a tool for improving reputation and credibility according to social expectations (e.g., [13]); other research reveals that firms do not enrich their IC reporting during a crisis, probably in order to limit the costs and to adopt more conservative behaviors (e.g., [14]).
If some studies address the link between the IC disclosure and crisis periods, to the best of our knowledge, research on the connection IC disclosure–corporate distress is even more limited. Hence, this study aimed to investigate intellectual capital disclosure applying the specific lens of healthy and distressed banks. Specifically, our study focused on the intensity and quality of IC disclosure of a sample of Italian banks. Indeed, Italian banks during the global financial crisis faced situations of distress resulting in negative performance and, in the worst cases, in corporate instability (e.g., [15]). Such situations persisted and even worsened over the years for some Italian banks, as evidenced by the first comprehensive assessment carried out by the European Central Banks. Given these considerations and the transposition of the European Directive on non-financial disclosure into Italian law (Legislative Decree 2016/254) making such reporting mandatory since 2017, we considered the 2016–2017 years suitable to analyze early evidence on the banks’ IC disclosure both in general and with reference to corporate distress.
To conduct the research, we used a multi-step methodology based on content analysis and encoding techniques and we collected data on IC disclosure from integrated reports, non-financial statements, and annual reports.
Our results revealed that IC disclosure of healthy and distressed banks does not show widespread differences. Indeed, distressed banks rarely disclosed more information than healthy banks. For example, in the case of distressed intermediaries, we found a higher positive variation of the values of the items related to the recruitment of skilled personnel and the enhancement of the use of social media, maybe considered key factors. On the other hand, the healthy banks presented a slight tendency to disclose forward-looking information, maybe due to the fact that they were more focused on the strategies as opposed to a more short-term approach of the distressed banks. To complement our study on healthy and distressed banks, we repeated the analysis focusing on bank size and independent directors. In this case, results did not show relevant differences in terms of IC disclosure.
Our paper contributes to the existing literature along different dimensions.
In consideration of the limited number of studies on banking disclosure on IC during crisis times and the corresponding uncertain results, we tried to provide a contribution in this respect by focusing on corporate distress. The link between IC and crises is often investigated for the non-financial sector and independently of the disclosure-related aspects [16,17,18,19]. When the financial sector is involved, studies are mainly focused on the IC and financial performance relationship, also in crisis periods [20,21,22]. Lastly, few studies are targeted to analyze the IC disclosure by banks during periods of general crisis [13,14,23].
Moreover, we defined a new detailed intellectual capital framework for banks on the basis of some frameworks provided by literature [6,9,12,24]. Additionally, our study provided evidence that Italian banks do not attribute sufficient importance to IC disclosure in general, and in particular, they do not consider such issues a strategic asset for improving their credibility and reputation. On the contrary, they seem to perceive IC disclosure as a cost; thus, a cultural shift will be desirable. In addition, policymakers may work on this direction by adopting specific actions aiming at fostering IC disclosure, even before the valorization of IC as a peculiar and strategic intangible asset. The Legislative Decree no. 254 of 30 December 2016 (transposing the Directive 2014/95/EU into the Italian law), which makes mandatory the disclosure of non-financial information for public-interest entities and large-sized enterprises, banks included, may be an important step to the achievement of this goal [25]. Undoubtedly, it is equally important that bank management increases the sensitivity and commitment to the IC issues and their disclosure, as a tool for the creation and/or increase of firms’ value.
2. The Intellectual Capital Disclosure
2.1. Rationale of IC Disclosure
Growing concerns about the shortcomings connected with traditional financial disclosure emphasize the relevance of the reporting of non-financial information. The latter is defined by Robb et al. [26] as “all information disclosed outside the financial statements issued by the company”, and it is generally related to corporate social responsibility (CSR) and IC issues. In particular, CSR and IC reporting are regarded as notably appropriate to evaluate, respectively, the business activities and the value of firms; both are not fully considered by financial disclosure.
Specifically, the IC reporting seems to be suitable for promoting key objectives, such as the sustainability enhancement by firms with benefits also in terms of improvement of their image [27]. Indeed, in recent times, firms have been strongly concerned with intangible value drivers. Intangible assets are commonly defined as non-physical resources able to produce positive effects by means of innovation, unique organizational models, human resources management policies, etc. [28]. On the basis of an accounting-based approach, IC allows for the assessment of the gap between the market and the book value of a firm: the more the firm is knowledge-intense, the higher the difference between the two values is. I.e., IC may be expressed by the gap between the market and the book value of a firm [1,4], a difference quite ignored by the traditional balance sheet and financial statements, which, thus, provide a partial picture of a firm’s value [29,30]. It is worth adding that the incomplete account of the firm’s value could lead to suboptimal decisions, such as those about capital allocation and investments in IC-creating activities [31]. Therefore, the completeness of the information about a firm’s value should include information on IC; that is the best way to assess the viability and the true value of a firm [32].
Hence, IC, linked to specific resources, capabilities, and competences of a firm, is strategically (and increasingly) relevant in the contemporary context, as it contributes to the wealth and the growth of the economy [33]. Such significance also helps identify the drivers of IC disclosure. This could hence contribute to achieving different goals, such as the reduction of information asymmetries and litigation risk exposure, and the recuperation of corporate reputation and credibility by fostering greater market trust. Other important objectives may be related to the opportunity to make investment decisions more efficiently, as well as decreasing the cost of funding and contributing to the long-term sustainability of the business.
Among the various theories that have attempted to explain the rationale of IC disclosure, we could mention the stakeholder theory [34], the legitimacy theory (e.g., [35]), and the signaling theory. The stakeholder theory focuses on the IC disclosure beneficiaries (precisely the stakeholders, like investors, customers, and creditors.); in this case, the reporting of IC issues is the means by which information asymmetries may be mitigated and a fair representation of the value of the firm provided. Consistently with the legitimacy theory, such disclosure is an appropriate tool for ensuring the compliance of the activities carried out by the firm with the regulations and market requirements. The central issue of the signaling theory, finally, is that the IC reporting may contribute in particular to mitigating the agent and management information asymmetry by impacting positively on the firm’s value. In light of the contributions of the single theoretical approaches, An et al. [36] state that an appropriate IC disclosure framework cannot depart from the combination of all of them, which should consequently be integrated with each other.
As to the international practices for the reporting of information on IC, we have to consider that a separate report, closely focused on IC data, is available only in some countries (e.g., Denmark and Sweden), whilst in general there is the tendency to limit the IC disclosure. Particularly the absence of an IC reporting scheme [24] explains the reasons for the inclusion of the IC data in different reports (primarily annual reports and CSR/sustainability reports) with the risk of losing or overlapping specific IC content. This raises the need—as argued by the existing literature [37,38], practitioners [39,40], and interest groups [41,42]—for an integrated reporting model for non-financial information. In this respect, the Directive 2014/95/EU, which establishes provisions on the non-financial information to be provided by public-interest entities and large-sized enterprises (both financial and non-financial), seeks to fill this gap [25].
2.2. The Inspiring Literature
Among the knowledge-intensive sectors, banking is strongly representative; indeed, banks are increasingly called upon to manage the knowledge basis as a source of competitive advantage. Consequently, the disclosure on IC issues is crucial for banks [6], which over recent years have experienced, and they are still experiencing, great challenges on several fronts [43]: regulations, digitalization, and technology disruption, to name a few. All these challenges significantly impact on the competitiveness of the banking system [44] and require a rethinking of the way they relate to the market (e.g., strategies for customers satisfaction), as well as the way they decide (or not) to (re)structure and (re)organize their business (e.g., new technologies and qualified personnel). This is likely to imply interventions on each of the firms’ capitals; for example, there may be the need to recruit new skills (human capital), adapt the internal procedures and systems (structural capital), and, finally, intensify relations with all the stakeholders (relational capital).
In order to guarantee viability over the long term, banks should, therefore, improve their ability to better promote IC management, also considering that their business is authentically intellectual in nature [45] and that their employees are intellectually more uniform than the workers in other industries [46].
As already pointed out, banking products and services are knowledge-based; this is linked to the combination of professional skills and market needs aimed at realizing favorable economic results from financial knowledge and risk management [47]. In other words, banks are considered knowledge-intensive institutions due to a business model highly focused on individual knowledge workers, great use of technologies, and the interaction between employees and customers [6].
The quality of the banking business is closely connected to IC and this stresses the role of knowledge as a unique resource. Indeed, there are different factors likely affecting the successful banking business: the quality of human capital and the ability to attract the best talent [11], as well as the offer of new products and services and the process of automation thanks to the latest technologies, with the opportunity of enhancing the connections with the market and consequently stressing the relational capital and structural capital link [10].
The centrality of knowledge in the banking sector explains, essentially, the need for great transparency of IC information, in the interests of the stakeholders, in order, also, to safeguard their protection [48]. There are not only economic reasons for this; above all, there is the need to defend their legitimacy, especially in times of financial crisis. There is a general lack of belief in banks’ reliability [9].
More generally speaking, IC’s role in times of economic and financial turbulence is an increasingly crucial issue to consider. Indeed, there are recent studies focusing on the analysis of IC investments undertaken by firms during crisis periods. Although the literature underlines the relevance of IC’s role for firms’ activity and performance, including during periods of economic downturn (e.g., [49,50,51,52]), the empirical evidence carried out on this topic is not always unequivocal. Among others, Guevera and Bounfour [16] examine how a large company deals with IC in an economic crisis context, pointing out that the trend is to concentrate the resources on the activities able to generate margins in the short-term, avoiding those assumed not to be immediately productive. Similar conclusions are drawn by Cohen et al. [18] in the case of small and medium businesses, which even though they care about their IC, during financial crises, they do not manage it in a very strategic or beneficial way. The importance of intangibles during market instability is shown by Shakina and Barajas [19], who particularly highlight, among the intellectual resources, human capital as a key factor for success during the 2008–2009 recession. Human capabilities, knowledge, skills, and experience as determining factors of organizational procedures in a turbulent business environment are also confirmed by Sumedrea [17].
Other studies investigate specifically the banking sector, by analyzing, in particular, the relationship between IC and financial performance (e.g., [21,45,53]); then, with the advent of the international crisis, the topic has been addressed also considering the possible influence of periods of downturn on IC. This is the case of the research carried out by Radianto [20] on the Indonesian listed banks for the years from 2006 to 2010. The main findings of this study reveal that IC affects banks’ performance (expressed by ROA), but banks’ IC performance does not show discrepancies before and after the 2008 monetary crisis. El-Bananny [21] examines the determinants of the IC performance of banks in the United Arab Emirates over the period 2004–2010, showing that the financial crisis has a significantly negative impact on IC performance. Curado et al. [22] analyze the intellectual capital–banks performance link in Portugal over the period 2005–2010, split into three sub-periods: 2005-2006 (pre-crisis), 2007–2008 (crisis), and 2009–2010 (post-crisis). They state that intellectual capital represents a good predictor of performance; for all the three sub-periods, top banks in intellectual capital scores match with top banks in financial performance levels.
Another strand of research on IC issues investigated during periods of crisis regards disclosure behavior. Rodrigues et al. [13], for example, study the IC reporting of Portuguese companies over 2007-2011, pointing out that the financial crisis does not reduce the level of IC disclosure, as firms consider it a tool for maintaining reputation and competitive advantage. Haji and Ghazali [23] analyze the trend of IC disclosure of major listed Malaysian companies over the 2008–2010 period and they find an overall increase, although significantly relevant only for the human capital. Manolopoulou and Tzeleps [14] examine the IC reporting by Greek firms, across various sectors, banking included, over the 2008–2010 period. They show different results compared to the above-mentioned studies (and others: e.g., [53,54]), as they reveal that firms decrease their IC reporting during the crisis.
If some studies address the link between IC disclosure and crisis periods, to the best of our knowledge, research on the connection between IC disclosure and corporate distress is even more limited. Such topics, in other terms, need to be further developed; it was, therefore, our intention to contribute to this strand by analyzing a sample of Italian banks, part of which has experienced/is still experiencing corporate distress, maybe not exclusively but undoubtedly linked with the international crisis. Particularly, our goal was to check whether the intensity and quality of IC disclosure may depend on the conditions of banks: healthy versus distressed.
3. Sample and Methodology
3.1. Sample
The disclosure of intangible assets, and specifically IC disclosure, has gained a renewed interest after the global financial crisis. Indeed, intangibles have started to be considered an important driver to recover competitiveness and to clean banking’s image. In this respect, the study examined six Italian banks, which are listed and with complex activity. Additionally, they are suitable for analyzing IC reporting practices due to their high representativeness of the Italian banking system: indeed, they covered approximately 65% and 68% of total bank assets in Italy respectively in 2016 and 2017.
All the sample banks participated in the 2014 comprehensive assessment carried out by the European Central Bank in preparation for the Single Supervisory Mechanism [55]. In particular, we chose the four largest healthy banks and the two banks that showed a capital shortfall. These latter banks are still experiencing a situation of distress (albeit with differing degrees of intensity).
We collected data from many sources: annual reports and, if available, integrated reports and non-financial statements.
3.2. Methodology
To analyze the intensity and quality of IC disclosure, we employed content analysis and encoding techniques. Content analysis is frequently used to analyze IC disclosure [56]. Indeed, content analysis allows researchers to summarize a large amount of text into a concise number of categories [57,58,59,60]. In particular, we employed a deductive approach [61], since we elaborated on earlier studies to create our coding system.
Section 3.2.1 describes the research phases of content analysis, while Section 3.2.2 details our coding system and, thus, the intellectual capital framework used for the analysis.
The encoding technique allowed us to verify the extent of disclosure on IC and how banks reported such information (intensity and quality of disclosure). An accurate description of the encoding technique is reported in Section 3.2.3.
3.2.1. The Content Analysis Process
The content analysis process consisted of some steps resulting from the scheme used by Weber [60], which allows researchers to achieve a satisfactory level of reliability and validity of the findings. In the first step, we defined the recording units [62]. We chose sentences as units of analysis because research proved they are more reliable than words, pages, or paragraphs [63,64]. In the second step, we defined the IC framework that represents our coding system (Section 3.2.2) and we established our coding rules [62,63,64,65]. The coding system is good “if the results can be replicated by other researchers” and “if they mean what the researchers intend” [66]. In the next steps, we addressed the most common concern on content analysis: the reliability. According to Stemler [67], content analysis is reliable when it is stable and reproducible. Stability means that the researcher who conducted the analysis finds the same results in two different times; reproducibility is present when two different researchers analyzing the text obtain the same findings.
To ensure the reliability of our analysis, in a first step two researchers analyzed two bank reports, each repeating the same analysis two times. The first test showed some differences between the two researchers in the identification of indicators, so the coding rules were revised and after a month, the same coders performed the content analysis on the same banks to test the new framework. Then, the two researchers performed a content analysis on the other four bank reports. As for the first two banks, the analysis was repeated by the two researchers one month later. The other two authors supported the analysis as trainers: they examined especially the test coding rules and discussed them with coders.
We followed the approach of Mention [6] to summarize the level of reproducibility of our content analysis. Specifically, we employed Scott’s pi (1) indicator.
3.2.2. The Framework of IC Disclosure
Our study used a detailed intellectual capital framework consisting of three levels (categories, items, and indicators) because a more accurate structure helps with the identification of the information to be investigated, increases the completeness and validity of the content analysis, and facilitates the interpretation of the results [71,72].
We defined the framework according to studies using a detailed intellectual capital framework; in particular, we followed four models: two models on the IC disclosure of European banks [6,9]; one model on the IC reporting of Italian listed firms, including banks [24]; and a model specifically developed for Italian banks [12].
Our framework includes the most frequently used categories of IC—human, structural, and relational capital [73]. The second level of our framework consists of 16 specific items, which are sub-classified by identifying 79 indicators (third level of analysis).
Human capital describes relevant characteristics of employees—education, age, gender, attitudes, and skills—as well as training, stability of employability, staff incentives and satisfaction, and how talents are managed. The category is composed of six items and 30 indicators. Structural capital provides information on mission and strategies, operational and innovation processes, teamwork and internal cooperation, communication systems, and management and control systems. The category includes five items and 20 indicators. Finally, relational capital maps information about bank relationships with customers, investors, and society, as well as other stakeholders, and information on corporate reputation. It is divided into five items, which in turn consist of 29 indicators. Table 1 presents the framework and the specification of all the IC items and indicators.
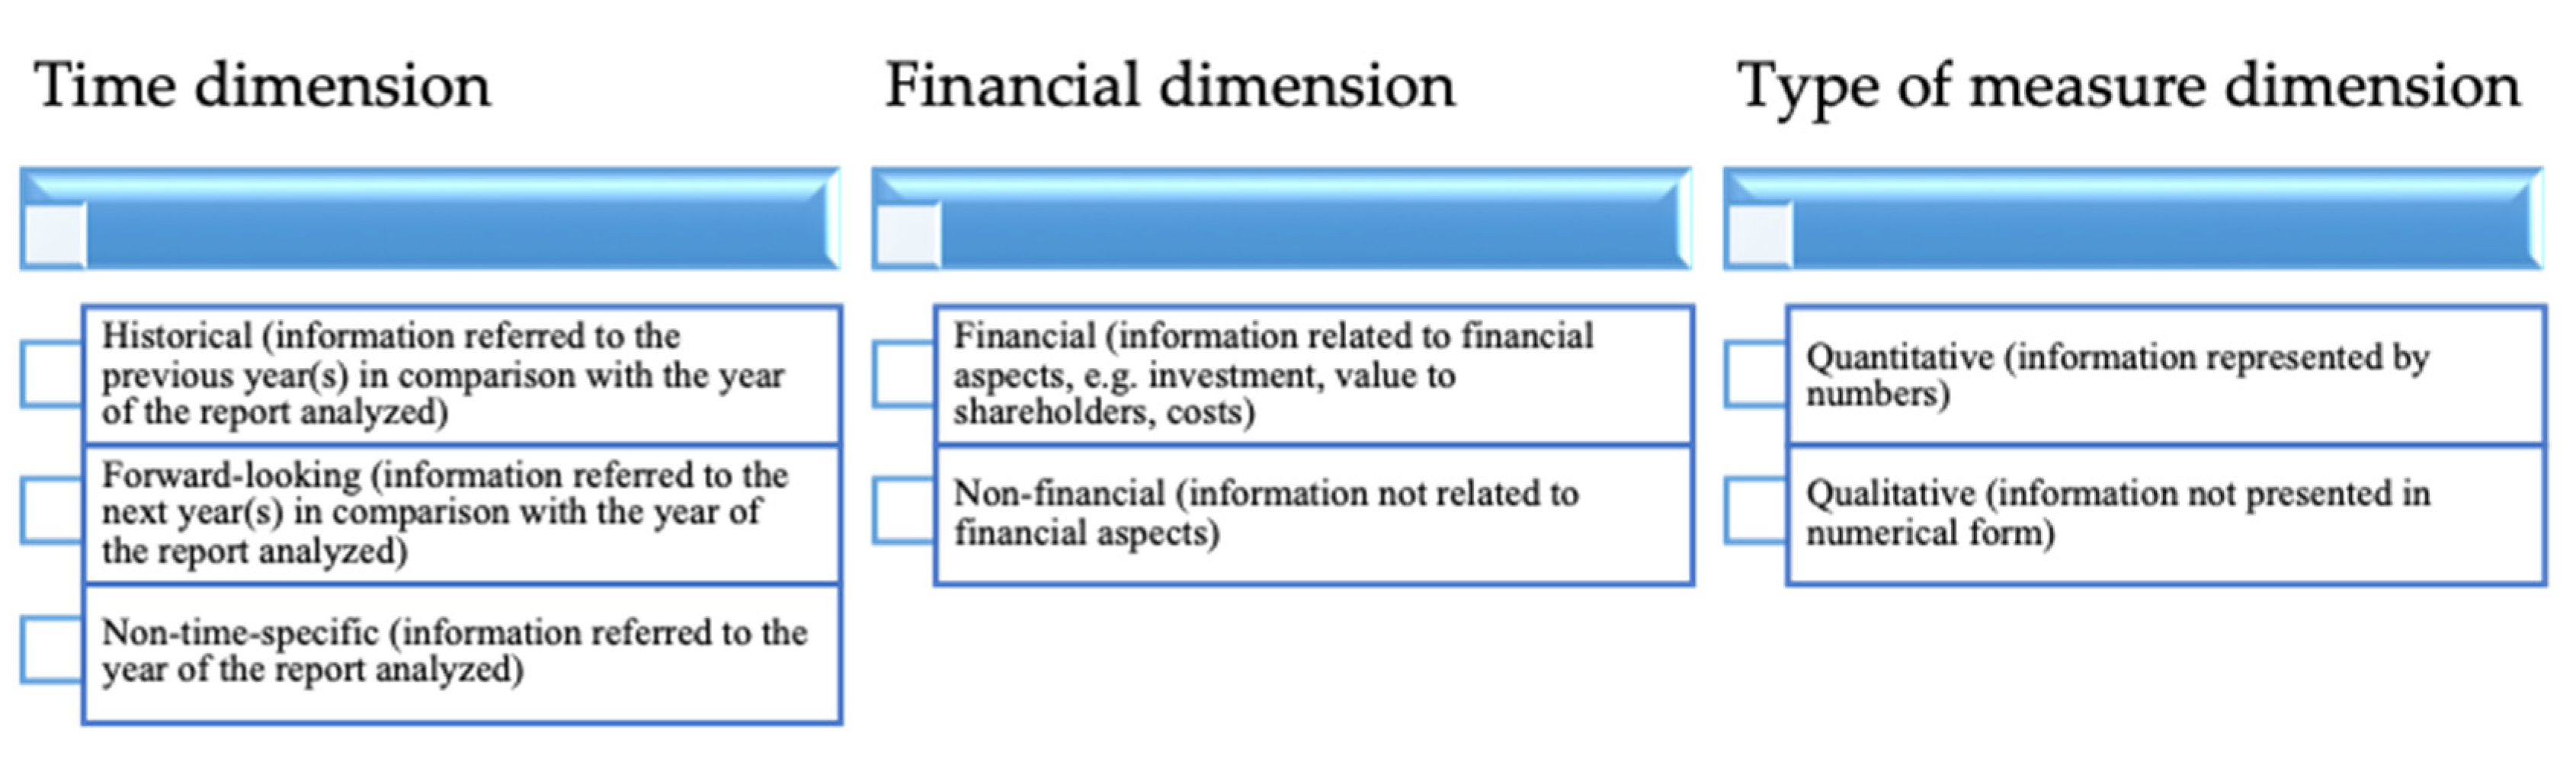
Our framework and our coding rules also considered the quality of information disclosed. Indeed, there is a close relationship between the intensity and the quality of information disclosed (the intensity evidently affects the quality), but an assessment of the disclosure quality cannot be based merely on this relation [74]. Actually, “how” the disclosure is carried out is significant for quality assessment. In particular, three attributes of information are considered important in evaluating disclosure quality: the time dimension, the financial dimension, and the type of measure dimension [74]. The time dimension analyzes whether the information is historical, forward-looking, or non-time-specific; the financial dimension analyzes financial vs. non-financial information; finally, the type of measure dimension analyzes quantitative vs. qualitative information (Figure 1).
Therefore, our analysis captured the time orientation, financial/non-financial and quantitative/qualitative attributes of each recording unit, highlighting the cases in which a unit had not only one descriptor of a certain attribute.
3.2.3. The Encoding Technique
The encoding technique allowed us to verify the extent of disclosure on IC and how the banks reported such information [6]. First of all, recording units were coded as follows: with a score of 0 when information was not reported by banks; with a score of 1 when banks disclosed information. An overall index was calculated for each bank. The index related the number of indicators disclosed with the total of the indicators, as in Equation (2) [6,12]. Sub-indexes of disclosure level were calculated for each category and item.
Likewise, we also calculated the weight of the indicators that have one (or more) dimension(s) compared to the total of the indicators in order to have a synthetic representation of disclosure quality.
The encoding technique was conducted through manual methods (using human coders) because a manual technique can be more efficient, and even more objective and valid than automated methods when working with small datasets [75,76]. Indeed, according to Beattie and Thomson [72], the results of studies using electronic word searches to analyze IC disclosure are questionable given the inferiority of this method.
4. Findings and Discussion
4.1. IC Disclosure of Italian Banks: A Focus on Healthy and Distressed Banks
This section summarizes the results of our analysis on banks’ IC disclosure, emphasizing the intensity and quality of such disclosure and shedding light on healthy and distressed banks.
An overview of the IC disclosure level of the whole sample (Table 2) shows that, according to other studies [6,9,73,77,78], the category with a higher average value over the two years is the relational capital and within it, the information related to “customer relations” weighs more than the others.
Looking at the changes during the sample period, however, the most significant increase concerns human capital, where the positive variation of “talent management” (as one of the current key challenges for the banking sector as well as other sectors) is largely sufficient to offset the decrease of other items (e.g., “incentives and satisfaction”). Another point worthy of attention is the increase of the structural capital [6] with a peak for “systems of communication”, probably due to the growing centrality of the web in the relationships between banks and stakeholders.
A more in-depth analysis was provided on how the disclosure was carried out, in order to assess the quality of disclosure; to this end, we investigated three information dimensions: time, financial, and type of measure. In descending order, the information provided by the whole sample was non-financial, non-time specific, qualitative, and non-qualitative (Table 3). Generally speaking, this means that IC disclosure was quite standardized and poor. Quantitative information is considered to be strongly relevant for stakeholders and able to reinforce the credibility of reporting [79]. Moreover, forward-looking information is crucial in signaling to the market the corporate perspectives in creating value [24]. Lastly, a balanced mix of financial and non-financial information gives a better picture of the organization considered as a whole [38]. Hence, the completeness and quality of the disclosure provided could be ensured only by the information enrichment, achieved also by balancing appropriately all the kinds of data.
Moving the perspective to the healthy and distressed banks, we can underline some evidence (Table 4). Distressed banks showed, in particular, positive variation for the items “talent management” (human capital) and “systems of communication” (structural capital). Maybe these increases could be interpreted as attempts by banks with difficulties to give a positive signal to the market and therefore to recover their market positions, at least in part, by using drivers like recruitment of skilled personnel and enhancement of the use of social media.
On the other hand, the analysis of the quality of the IC disclosure (Table 5) suggests that the healthy banks presented more forward-looking information, although its presence is generally limited. However, the relatively greater use of forward-looking information by healthy banks could mean a more focused strategic vision as opposed to a more short-term approach of the distressed banks. The healthy banks also showed more non-qualitative information, which was relevant to enhance the credibility of IC disclosure.
To summarize our results, the IC disclosure, in terms both of intensity and quality, does not change notably over time and varies slightly comparing distressed and healthy banks. Notwithstanding the need to provide further evidence by a larger sample and across a longer period, our findings showed that generally there is the need to improve IC reporting by increasing financial, forward-looking, and non-qualitative information, and that there was no significant difference among distressed and healthy banks. It means that all kinds of banks still have a few more steps to take, as IC disclosure may actually help the restoration of trust and confidence, as core intangibles, in particular in times of general lack of belief in banks’ reliability [9]. Obviously, such general assertions apply in particular to the distressed banks.
4.2. Other Bank Sub-Samples
Previous research related IC disclosure to several variables, including firm size and number of independent board directors [56,73,80]. Thus, to complement our study on healthy and distressed banks, we carried out a second step of the investigation by focusing on bank size and independent directors. To this purpose, we created the following sub-samples of banks: (i) large banks and small banks, distinguished by total assets above or below the sample average total assets, respectively and (ii) banks with a number of independent directors above or below the sample average. We retrieved data from Refinitiv and Bank Focus databases.
Table 6 shows results on large and small banks, pointing out that the two sub-samples are characterized by similar features, also compared to healthy and distressed banks (Table 5). Few differences concern the disclosure of qualitative and non-qualitative information. Indeed, compared to small banks—but also to healthy and distressed banks—large banks gave less qualitative and more non-qualitative information. Furthermore, small banks disclosed the largest amount of non-time-specific information.
Table 7 compares the IC disclosure of banks with large and small numbers of independent directors (above and below the sample average, respectively). The analysis showed that banks with the largest large number of independent directors mostly disclosed financial information, a combination of financial and non-financial, and historical information. Comparing such evidence with results on healthy and distressed banks (Table 5), we did not detect great differences.
5. Conclusions
The growing significance of IC reporting is connected with the opportunity for promoting key objectives, such as the enhancement and improvement of corporate reputation and credibility. Hence, over the years, the drivers of firms’ value have increasingly been represented by intangibles rather than tangibles. Since IC may refer to the concepts of knowledge and information [1], knowledge-based firms, such as banks, are the most suitable for showing the importance of the IC-related issues and realizing the benefits associated with the increase in corporate value.
Given the above considerations, we decided to investigate the IC disclosure of a sample of Italian banks, highly representative of the Italian banking system.
The main results of our study, in agreement with the literature, indicated that IC disclosure is still incomplete and poor, meaning that in general banks should increase the level of reporting on IC issues. Particularly, there was not a large discrepancy in the IC reporting practices between healthy and distressed banks. Only on very few occasions did banks with difficulties seem to be interested in giving positive signals to stakeholders as an attempt to recover, at least in part, their reputations and credibility. In this respect, for example, these intermediaries showed a higher positive variation of the values of the items related to the recruitment of skilled personnel and the enhancement of the use of social media, maybe considered key drivers. On the other hand, the healthy banks presented a slightly higher tendency to disclose non-qualitative and forward-looking information, maybe due to the fact that they are more focused on the strategies and the expectations of the stakeholders as opposed to the more short-term approach of the distressed banks. To complement our study on healthy and distressed banks, we repeated the analysis focusing on bank size and independent directors. In this case, results also did not show relevant differences in terms of IC disclosure.
Apart from a few differences, hence, all kinds of banks still have a few more steps to take, as IC disclosure may actually help to restore trust and confidence, as core intangibles, in particular in times of a general lack of belief in banks’ reliability. Our study contributes to this strand of research, still limited, shedding light on the perception that banks have of IC disclosure: a cost to be minimized or an opportunity to recover credibility, especially in banks’ distressed conditions.
However, this study suffers some limitations that need to be overcome by extending both the sample, considering Italian banks also in an international comparison, and the time horizon. The sample extension will support the application of quantitative analyses to test, for example, the two-way causality between IC disclosure and banks’ financial performance or other bank-specific characteristics, including some corporate governance mechanisms. Lastly, other lines of research could empirically investigate the sign of the relationship between intensity/quality of IC disclosure and the level of reputation and credibility in banks.
Author Contributions
This article is the result of the joint efforts of the authors, who equally contributed to the work. All authors have read and agreed to the published version of the manuscript.
Funding
This research received no external funding.
Acknowledgments
The authors would like to thank the three anonymous referees for their useful comments and suggestions.
Conflicts of Interest
The authors declare no conflict of interest.
References
- Edvinsson, L.; Malone, M. Intellectual Capital: Realizing Your Company’s True Value by Finding Its Hidden Brainpower; Harper Collins: New York, NY, USA, 1997; 240p. [Google Scholar]
- Brooking, A. Intellectual Capital: Core Asset for the Third Millennium Enterprise, 1st ed.; International Thomson Business Press: London, UK, 1996; 224p. [Google Scholar]
- Marr, B.; Schiuma, G.; Neely, A. The dynamics of value creation: mapping your intellectual performance drivers. J. Intellect. Cap. 2004, 5, 312–325. [Google Scholar] [CrossRef]
- Sveiby, K.E. The New Organizational Wealth: Managing and Measuring Knowledge-Based Assets; Berrett-Koehler: San Francisco, CA, USA, 1997. [Google Scholar]
- Kaplan, R.S.; Norton, D.P. Strategy Maps: Converting Intangible Assets into Tangible Outcomes; Harvard Business School Press: Boston, MA, USA, 2004; 324p. [Google Scholar]
- Mention, A.-L. Exploring voluntary reporting of intellectual capital in the banking sector. J. Manag. Control. 2011, 22, 279–309. [Google Scholar] [CrossRef]
- Meritum Project. Guidelines for Managing and Reporting on Intangibles (Intellectual Capital Report); Meritum Project: Madrid, Spain, 2002. [Google Scholar]
- Cabrita, M.R. Intellectual capital as a phenomenon of interrelationships. Int. J. Bus. Syst. Res. 2009, 3, 229–256. [Google Scholar] [CrossRef]
- Cabrita, M.D.R.; Silva, M.D.L.R.D.; Rodrigues, A.M.G.; Dueñas, M.D.P.M. Competitiveness and disclosure of intellectual capital: an empirical research in Portuguese banks. J. Intellect. Cap. 2017, 18, 486–505. [Google Scholar] [CrossRef]
- Cabrita, M.D.R.; Bontis, N. Intellectual capital and business performance in the Portuguese banking industry. Int. J. Technol. Manag. 2008, 43, 212. [Google Scholar] [CrossRef] [Green Version]
- Muhammad, N.M.N.; Ismail, K.A. Intellectual Capital Efficiency and Firm’s Performance: Study on Malaysian Financial Sectors. Int. J. Econ. Finance 2009, 1, 206–212. [Google Scholar] [CrossRef]
- Birindelli, G.; Ferretti, P.; Chiappini, H. Intellectual Capital Disclosure: Evidence from the Italian Systemically Important Banks. In Socially Responsible Investments. The Crossroads between Institutional and Retail Investors; La Torre, M., Chiappini, H., Eds.; Palgrave MacMillan: Cham, Switzerland, 2018; pp. 37–59. [Google Scholar]
- Rodrigues, L.; Tejedo-Romero, F.; Craig, R.; Rodrigues, L. Corporate governance and intellectual capital reporting in a period of financial crisis: Evidence from Portugal. Int. J. Discl. Gov. 2016, 14, 1–29. [Google Scholar] [CrossRef] [Green Version]
- Manolopoulou, E.; Tzelepis, D. Intellectual capital disclosure: the Greek case. Int. J. Learn. Intellect. Cap. 2014, 11, 33–51. [Google Scholar] [CrossRef]
- Visco, I. Banche E. Finanza Dopo La Crisi: Lezioni E Sfide (Banks and Finance after the Crisis: Lessons and Challenges). SSRN Electron. J. 2018, 71, 282. [Google Scholar] [CrossRef]
- Guevara, D.; Bounfour, A. Monitoring intellectual capital: A case study of a large company during the recent economic crisis. Knowl. Manag. Res. Pr. 2013, 11, 196–207. [Google Scholar] [CrossRef]
- Sumedrea, S. Intellectual Capital and Firm Performance: A Dynamic Relationship in Crisis Time. Procedia Econ. Financ. 2013, 6, 137–144. [Google Scholar] [CrossRef] [Green Version]
- Cohen, S.; Naoum, V.-C.; Vlismas, O. Intellectual capital, strategy and financial crisis from a SMEs perspective. J. Intellect. Cap. 2014, 15, 294–315. [Google Scholar] [CrossRef]
- Shakina, E.; Barajas, A. The dynamics of intellectual resources during the economic crisis. Econ. Res.-Ekon. Istraž. 2014, 27, 861–881. [Google Scholar] [CrossRef] [Green Version]
- Radianto, W.E.D. The influence of intellectual capital on banking industry performance: A case in Indonesia Stock Exchange before and after the 2008 global financial crisis. Asia Pac. J. Account. Financ. 2011, 2, 39–50. [Google Scholar]
- El-Bannany, M. A study of determinants of intellectual capital performance in banks: The UK case. J. Intellect. Cap. 2008, 9, 487–498. [Google Scholar] [CrossRef]
- Curado, C.; Guedes, M.J.; Bontis, N. The Financial Crisis of Banks (Before, During and After): An Intellectual Capital Perspective. Knowl. Process. Manag. 2014, 21, 103–111. [Google Scholar] [CrossRef]
- Haji, A.A.; Ghazali, N.A.M. Intellectual capital disclosure trends: Some Malaysian evidence. J. Intellect. Cap. 2012, 13, 377–397. [Google Scholar] [CrossRef]
- Cinquini, L.; Passetti, E.; Tenucci, A.; Frey, M. Analyzing intellectual capital information in sustainability reports: Some empirical evidence. J. Intellect. Cap. 2012, 13, 531–561. [Google Scholar] [CrossRef]
- Venturelli, A.; Caputo, F.; Cosma, S.; Leopizzi, R.; Pizzi, S. Directive 2014/95/EU: Are Italian companies already compliant? Sustainability 2017, 9, 1385. [Google Scholar] [CrossRef] [Green Version]
- Robb, S.W.G.; Single, L.E.; Zarzesky, M.T. Non-financial disclosures across Anglo-American countries. J. Int. Account. Audit. Tax. 2001, 10, 71–83. [Google Scholar] [CrossRef]
- Polo, F.C.; Vázquez, D.G. Social information within the intellectual capital report. J. Int. Manag. 2008, 14, 353–363. [Google Scholar] [CrossRef]
- Lev, B. Intangibles: Management, Measurement and Reporting; Brookings Institution Press: Washington, DC, USA, 2001. [Google Scholar]
- Hope, J.; Hope, T. Competing in the Third Wave: The Ten Key Management Issues of the Information Age; Harvard Business School Press: Boston, MA, USA, 1998. [Google Scholar]
- Brennan, N.M.; Connell, B. Intellectual capital: Current issues and policy implications. J. Intellect. Cap. 2000, 1, 206–240. [Google Scholar] [CrossRef]
- Carroll, R.F.; Tansey, R.R. Intellectual capital in the new Internet economy—Its meaning, measurement and management for enhancing quality. J. Intellect. Cap. 2000, 1, 296–312. [Google Scholar] [CrossRef]
- Guthrie, J.; Cuganesan, S.; Ward, L. Extended Performance Reporting: Evaluating Corporate Social Responsibility and Intellectual Capital Management. Issues Soc. Environ. Account. 2007, 1, 1. [Google Scholar] [CrossRef]
- Cabrita, M.; Vaz, J. Intellectual capital and value creation: Evidence from the Portuguese banking industry. Electron. J. Knowl. Manag. 2006, 4, 11–20. [Google Scholar]
- Guthrie, J.; Petty, R.; Ricceri, F. The voluntary reporting of intellectual capital. J. Intellect. Cap. 2006, 7, 254–271. [Google Scholar] [CrossRef]
- Deegan, C. Introduction: The legitimising effect of social and environmental disclosures—A theoretical foundation. Account. Audit. Account. J. 2002, 15, 282–311. [Google Scholar] [CrossRef]
- An, Y.; Davey, H.; Eggleton, I.R. Towards a comprehensive theoretical framework for voluntary IC disclosure. J. Intellect. Cap. 2011, 12, 571–585. [Google Scholar] [CrossRef]
- Lev, B.; Zambon, S. Intangibles and intellectual capital: An introduction to a special issue. Eur. Account. Rev. 2003, 12, 597–603. [Google Scholar] [CrossRef]
- Nardo, M.; Veltri, S. On the plausibility of an integrated approach to disclose social and intangible issues. Soc. Responsib. J. 2014, 10, 416–435. [Google Scholar] [CrossRef]
- Veltri, S.; Nardo, M.T. Bilancio sociale e bilancio del capitale intellettuale: Quali relazioni? Econ. Aziend. Online 2008, 1, 239–260. [Google Scholar]
- DeMartini, P.; Paoloni, P. Awareness of your own intangible assets. J. Intellect. Cap. 2013, 14, 360–375. [Google Scholar] [CrossRef]
- Global Reporting Initiative—Gri. G3 Sustainability Reporting Guidelines; Version 3.1.; Global Reporting Initiative: Amsterdam, The Netherlands, 2011. [Google Scholar]
- Integrated Reporting. The International IR Framework; IR Council: Zurich, Switzerland, December 2013. [Google Scholar]
- Joshi, M.; Cahill, D.; Sidhu, J. Intellectual capital performance in the banking sector. J. Hum. Resour. Costing Account. 2010, 14, 151–170. [Google Scholar] [CrossRef]
- Latif, M.; Malik, M.S.; Aslam, S. Intellectual capital efficiency and corporate performance in developing countries: A comparison between Islamic and conventional banks of Pakistan. Interdiscip. J. Contemp. Res. Bus. 2012, 4, 405–420. [Google Scholar]
- Mavridis, D.G. The intellectual capital performance of the Japanese banking sector. J. Intellect. Cap. 2004, 5, 92–115. [Google Scholar] [CrossRef]
- Kubo, I.; Saka, A. An inquiry into the motivations of knowledge workers in the Japanese financial industry. J. Knowl. Manag. 2002, 6, 262–271. [Google Scholar] [CrossRef] [Green Version]
- Shih, K.; Chang, C.; Lin, B. Assessing knowledge creation and intellectual capital in banking industry. J. Intellect. Cap. 2010, 11, 74–89. [Google Scholar] [CrossRef] [Green Version]
- Chen, K.; Pan, C. A study of credit risk efficiency and productivity change for commercial banks in Taiwan. J. Am. Acad. Bus. 2011, 16, 279–286. [Google Scholar]
- Barro, R. Modern Business Cycle Theory, 1st ed.; Harvard University Press: Cambridge, MA, USA, 1989. [Google Scholar]
- Johanson, U.; Mårtensson, M.; Skoog, M. Mobilizing change through the management control of intangibles. Account. Organ. Soc. 2001, 26, 715–733. [Google Scholar] [CrossRef]
- Patel, N.; Narain, U. Can Intangible Assets Act as a Cushion in a Downturn? Online Report by Watson Wyatt. 2008. Available online: http://www.watsonwyatt.com/pubs/directions/media/2009_EU_12783_ Directions_CP05_Intangibles.pdf (accessed on 20 January 2020).
- Bontis, N.; Fitz-Enz, J. Intellectual capital ROI: A causal map of human capital antecedents and consequents. J. Intellect. Cap. 2002, 3, 223–247. [Google Scholar] [CrossRef] [Green Version]
- Morris, R.D.; Ho, B.U.S.; Pham, T.; Gray, S.J. Financial reporting practices of Indonesian companies before and after the Asian financial crisis. Asia-Pac. J. Account. Econ. 2004, 11, 193–221. [Google Scholar] [CrossRef]
- Haji, A.A.; Ghazali, N.A.M. The influence of the financial crisis on corporate voluntary disclosure: Some Malaysian evidence. Int. J. Discl. Gov. 2011, 9, 101–125. [Google Scholar] [CrossRef]
- European Central Bank—ECB. Aggregate Report on the Comprehensive Assessment; European Central Bank: Frankfurt, Germany, October 2014. [Google Scholar]
- Guthrie, J.; Petty, R.; Yongvanich, K.; Ricceri, F. Using content analysis as a research method to inquire into intellectual capital reporting. J. Intellect. Cap. 2004, 5, 282–293. [Google Scholar] [CrossRef]
- Berelson, B. Content Analysis in Communication Research; Free Press: New York, NY, USA, 1952. [Google Scholar]
- Parker, E.B.; Holsti, O.R. Content Analysis for the Social Sciences and Humanities. Am. Sociol. Rev. 1970, 35, 356. [Google Scholar] [CrossRef]
- Krippendorff, K. Content Analysis: An Introduction to Its Methodology; Sage Publications: Beverly Hills, CA, USA, 1980. [Google Scholar]
- Weber, R.P. Basic Content Analysis—Quantitative Applications in the Social Sciences; Sage Publications: Beverly Hills, CA, USA, 1985. [Google Scholar]
- Kyngas, H.; Vanhanen, L. Content analysis (Finnish). Hoitotiede 1999, 11, 3–12. [Google Scholar]
- Krippendorff, K. Content Analysis: An Introduction to Its Methodology, 2nd ed.; Sage: Thousand Oaks, CA, USA, 2004. [Google Scholar]
- Hackston, D.; Milne, M. Some determinants of social and environmental disclosures in New Zealand companies. Account. Audit. Account. J. 1996, 9, 77–108. [Google Scholar] [CrossRef]
- Milne, M.; Adler, R.W. Exploring the reliability of social and environmental disclosures content analysis. Account. Audit. Account. J. 1999, 12, 237–256. [Google Scholar] [CrossRef] [Green Version]
- Mayring, P. Qualitative Content Analysis: Theoretical Background and Procedures. In Approaches to Qualitative Research in Mathematics Education; Springer: Berlin/Heidelberg, Germany, 2014; pp. 365–380. [Google Scholar]
- Marston, C.L.; Shrives, P.J. The use of disclosure indices in accounting research: A review article. Br. Account. Rev. 1991, 23, 195–210. [Google Scholar] [CrossRef]
- Stemler, S. An overview of content analysis. Pract. Assess. Res. Eval. 2001, 7, 137–146. [Google Scholar]
- Boyatzis, R.E. Transforming Qualitative Information: Thematic Analysis and Code Development; Sage Publications: Thousand Oaks, CA, USA, 1998. [Google Scholar]
- Guthrie, J.; Matthews, M.R. Corporate social accounting in Australasia. In Research in Corporate Social Performance and Policy; JAI Press: Greenwich, CT, USA, 1985; pp. 251–277. [Google Scholar]
- Perreault, W.D., Jr.; Leigh, L.E. Reliability of nominal data based on qualitative judgments. J. Mark. Res. 1989, 26, 135–148. [Google Scholar] [CrossRef]
- Gray, R.; Kouhy, R.; Lavers, S. Constructing a research database of social and environmental reporting by UK companies. Account. Audit. Account. J. 1995, 8, 78–101. [Google Scholar] [CrossRef]
- Beattie, V.; Thomson, S.J. Lifting the lid on the use of content analysis to investigate intellectual capital disclosures. Account. Forum 2007, 31, 129–163. [Google Scholar] [CrossRef]
- Striukova, L.; Unerman, J.; Guthrie, J. Corporate reporting of intellectual capital: Evidence from UK companies. Br. Account. Rev. 2008, 40, 297–313. [Google Scholar] [CrossRef]
- Beattie, V.; McInnes, B.; Fearnley, S. A methodology for analysing and evaluating narratives in annual reports: A comprehensive descriptive profile and metrics for disclosure quality attributes. Account. Forum 2004, 28, 205–236. [Google Scholar] [CrossRef] [Green Version]
- Matthes, J.; Kohring, M.; Matthes, J. The Content Analysis of Media Frames: Toward Improving Reliability and Validity. J. Commun. 2008, 58, 258–279. [Google Scholar] [CrossRef]
- De Graaf, R.; Van Der Vossen, R. Bits versus brains in content analysis. Comparing the advantages and disadvantages of manual and automated methods for content analysis. J. Commun. Res. 2013, 38, 433–443. [Google Scholar] [CrossRef]
- Guthrie, J.; Petty, R. Intellectual capital: Australian annual reporting practices. J. Intellect. Cap. 2000, 1, 241–251. [Google Scholar] [CrossRef]
- April, K.A.; Bosma, P.; Deglon, D.A. IC measurement and reporting: Establishing a practice in SA mining. J. Intellect. Cap. 2003, 4, 165–180. [Google Scholar] [CrossRef] [Green Version]
- Beretta, S.; Bozzolan, S. Quality versus Quantity: The Case of Forward-Looking Disclosure. J. Account. Audit. Financ. 2008, 23, 333–376. [Google Scholar] [CrossRef]
- Lim, S.J.; White, G.; Lee, A.; Yuningsih, Y. A longitudinal study of voluntary disclosure quality in the annual reports of innovative firms. Account. Res. J. 2017, 30, 89–106. [Google Scholar] [CrossRef]
Figure 1.
Voluntary narrative disclosure: the Beattie et al. framework (2004). Source: Adapted from Beattie et al. [74].
Figure 1.
Voluntary narrative disclosure: the Beattie et al. framework (2004). Source: Adapted from Beattie et al. [74].


Table 1.
Intellectual capital (IC) framework.
| Category | Item | Indicator |
|---|---|---|
| Human Capital | Characteristics | Staff breakdown by job function |
| Staff breakdown by age | ||
| Staff breakdown by gender | ||
| Staff breakdown by function and gender | ||
| Staff breakdown by education | ||
| Staff seniority | ||
| Qualified employees per level of salary | ||
| Employee efficiency | ||
| Attitude and skills | Teamwork | |
| Technical competencies | ||
| Leadership | ||
| Customer-centric attitude | ||
| Communication attitude | ||
| Training | Training program | |
| Investments in training | ||
| Distinctive features of training per employee | ||
| Incentives and satisfaction | Benefits and compensation | |
| Employee controversies | ||
| Health | ||
| Internal social/cultural activities | ||
| Stability | Part-time employment | |
| Apprenticeship | ||
| Turnover | ||
| Absenteeism | ||
| Talent management | Diversity and equal opportunities | |
| Internal job rotation | ||
| Career opportunities | ||
| Work–life balance plans | ||
| Incentives plan to attract talent | ||
| Recruitment policy | ||
| Structural Capital | Mission and corporate strategies | Mission and values statement |
| Code of conduct | ||
| Organization’s functional structures | ||
| Operational and innovation processes | Management by objectives systems | |
| Performance evaluation systems | ||
| Policy, strategy and/or objective of innovation and development (I&D) activities | ||
| I&D investments | ||
| Teamwork and internal cooperation | Projects and activities | |
| Programs of internal mobility and working flexibility | ||
| Programs and activities of knowledge sharing | ||
| Systems of communication | Internal communication channels | |
| External communication channels | ||
| Social media | ||
| Communication technologies in development | ||
| Management and control systems | Technology investments to meet regulatory requirements | |
| Investments in digitalization and big data | ||
| Systems of internal control | ||
| Cybersecurity systems | ||
| Information technologies in development | ||
| Quality evaluation process and certifications | ||
| Relational Capital | Customer relations | Branches/agencies and their location |
| Online customer service channels (access) | ||
| Products/services solutions for clients | ||
| Promotional strategies and activities | ||
| Segmentation of customers | ||
| Business per segment or product | ||
| Market share by segment/product | ||
| Dependence on key customers | ||
| Information regarding systems for handling suggestions and complaints | ||
| Customers litigations and legal actions | ||
| Client satisfaction measuring process | ||
| Investor relations | Company growth | |
| Future projects | ||
| Relationship with investors | ||
| Shareholders’ satisfaction | ||
| Actions in social and environmental fields | Identification of stakeholders | |
| Social responsibility activities | ||
| Social and environmental impact investments | ||
| Commitments regarding good environmental and energetic practice | ||
| Relationships with other actors | Actors with whom partnerships are maintained | |
| Relations with regulatory bodies | ||
| Outsourcing/subcontracting | ||
| Collaborations with universities, research centers, and other stakeholders | ||
| Donations to stakeholders | ||
| Corporate reputation | Financial reputation | |
| Social reputation | ||
| Environmental reputation | ||
| Reputation evaluation process | ||
| Prizes and awards received |
Table 2.
Overall IC disclosure by category and item.
| Total Amount | Variation | Average Value | ||||||
|---|---|---|---|---|---|---|---|---|
| 2016 | 2017 | |||||||
| n | % | n | % | ∆n | ∆% | n | % | |
| Human Capital (1) | 105 | 58.33 | 113 | 62.78 | 8 | 7.62 | 109 | 60.56 |
| Characteristics | 29 | 60.42 | 30 | 62.50 | 1 | 3.45 | 29.5 | 61.46 |
| Attitude and skills | 2 | 6.67 | 2 | 6.67 | 0 | / | 2 | 6.67 |
| Training | 16 | 88.89 | 16 | 88.89 | 0 | / | 16 | 88.89 |
| Incentives and satisfaction | 19 | 79.17 | 18 | 75.00 | −1 | −5.26 | 18.5 | 77.08 |
| Stability | 19 | 79.17 | 21 | 87.50 | 2 | 10.53 | 20 | 83.33 |
| Talent management | 20 | 55.56 | 26 | 72.22 | 6 | 30.00 | 23 | 63.89 |
| Structural Capital (2) | 72 | 60.00 | 77 | 64.17 | 5 | 6.94 | 74.5 | 62.08 |
| Mission and corporate strategies | 17 | 94.44 | 17 | 94.44 | 0 | / | 17 | 94.44 |
| Operational and innovation processes | 8 | 33.33 | 8 | 33.33 | 0 | / | 8 | 33.33 |
| Teamwork and internal cooperation | 5 | 27.78 | 5 | 27.78 | 0 | / | 5 | 27.78 |
| Systems of communication | 18 | 75.00 | 21 | 87.50 | 3 | 16.67 | 19.5 | 81.25 |
| Management and control systems | 24 | 66.67 | 26 | 72.22 | 2 | 8.33 | 25 | 69.44 |
| Relational Capital (3) | 124 | 71.26 | 127 | 72.99 | 3 | 2.42 | 125.5 | 72.13 |
| Customer relations | 51 | 77.27 | 52 | 78.79 | 1 | 1.96 | 51.5 | 78.03 |
| Investor relations | 16 | 66.67 | 17 | 70.83 | 1 | 6.25 | 16.5 | 68.75 |
| Actions in social and environmental fields | 21 | 87.50 | 21 | 87.50 | 0 | / | 21 | 87.50 |
| Relationships with other actors | 17 | 56.67 | 18 | 60.00 | 1 | 5.88 | 17.5 | 58.33 |
| Corporate reputation | 19 | 63.33 | 19 | 63.33 | 0 | / | 19 | 63.33 |
| (1) + (2) + (3) | 301 | 63.50 | 317 | 66.88 | 16 | 5.32 | 309 | 65.19 |
Source: Authors’ elaboration.
Table 3.
Overall IC disclosure by quality.
| Total Amount | Variation | Average Value | ||||||
|---|---|---|---|---|---|---|---|---|
| 2016 | 2017 | |||||||
| n | % | n | % | ∆n | ∆% | n | % | |
| Financial dimension | ||||||||
| Financial (F) | 25 | 8.31 | 22 | 6.94 | −3 | −12.00 | 23.5 | 7.62 |
| Non-Financial (NF) | 252 | 83.72 | 267 | 84.23 | 15 | 5.95 | 260 | 83.97 |
| F&NF | 24 | 7.97 | 28 | 8.83 | 4 | 16.67 | 26 | 8.40 |
| Type of measure dimension | ||||||||
| Qualitative (Q) | 139 | 46.18 | 153 | 48.26 | 14 | 10.07 | 146 | 47.22 |
| Non-Qualitative (NQ) | 105 | 34.88 | 108 | 34.07 | 3 | 2.86 | 106.5 | 34.48 |
| Q&NQ | 57 | 18.94 | 56 | 17.67 | −1 | −1.75 | 56.5 | 18.30 |
| Time dimension | ||||||||
| Historical (H) | 63 | 20.93 | 71 | 22.40 | 8 | 12.70 | 67 | 21.66 |
| Non-Time-Specific (NTS) | 210 | 69.77 | 217 | 68.45 | 7 | 3.33 | 214 | 69.11 |
| Forward-Looking (FL) | 6 | 1.99 | 5 | 1.58 | −1 | −16.67 | 5.5 | 1.79 |
| H&NTS | 17 | 5.65 | 18 | 5.68 | 1 | 5.88 | 17.5 | 5.66 |
| NTS&FL | 3 | 1.00 | 4 | 1.26 | 1 | 33.33 | 3.5 | 1.13 |
| H&FL | 1 | 0.33 | 2 | 0.63 | 1 | 100.00 | 1.5 | 0.48 |
| H&NTS&FL | 1 | 0.33 | 0 | 0.00 | −1 | −100.00 | 0.5 | 0.17 |
Source: Authors’ elaboration.
Table 4.
IC disclosure by type of bank and by category and item.
| Healthy Banks | Distressed Banks | |||||||||||||||
|---|---|---|---|---|---|---|---|---|---|---|---|---|---|---|---|---|
| Total Amount | Variation | Average Value | Total Amount | Variation | Average Value | |||||||||||
| 2016 | 2017 | 2016 | 2017 | |||||||||||||
| n | % | n | % | ∆n | ∆% | n | % | n | % | n | % | ∆n | ∆% | n | % | |
| Human Capital (1) | 76 | 63.33 | 77 | 64.17 | 1 | 1.32 | 76.5 | 63.75 | 30 | 50.00 | 36 | 60.00 | 6 | 20.00 | 33 | 55.00 |
| Characteristics | 22 | 68.75 | 23 | 71.88 | 1 | 4.55 | 22.5 | 70.31 | 8 | 50.00 | 8 | 50.00 | 0 | / | 8 | 50.00 |
| Attitude and skills | 2 | 10.00 | 1 | 5.00 | −1 | −50.00 | 1.5 | 7.50 | 0 | / | 1 | 10.00 | 1 | / | 0.5 | 10.00 |
| Training | 11 | 91.67 | 11 | 91.67 | 0 | / | 11 | 91.67 | 5 | 83.33 | 5 | 83.33 | 0 | / | 5 | 83.33 |
| Incentives and satisfaction | 14 | 87.50 | 13 | 81.25 | −1 | −7.14 | 13.5 | 84.38 | 5 | 62.50 | 5 | 62.50 | 0 | / | 5 | 62.50 |
| Stability | 14 | 87.50 | 15 | 93.70 | 1 | 7.14 | 14.5 | 90.63 | 5 | 62.50 | 6 | 75.00 | 1 | 20.00 | 5.5 | 68.75 |
| Talent management | 13 | 54.17 | 14 | 58.33 | 1 | 7.69 | 13.5 | 56.25 | 7 | 58.33 | 11 | 91.67 | 4 | 57.14 | 9 | 75.00 |
| Structural Capital (2) | 53 | 6.25 | 55 | 68.75 | 2 | 3.77 | 54 | 67.50 | 19 | 47.50 | 22 | 55.00 | 3 | 15.79 | 20.5 | 51.25 |
| Mission and corporate strategies | 12 | 100.00 | 12 | 100.00 | 0 | / | 12 | 100.00 | 5 | 83.33 | 5 | 83.33 | 0 | / | 5 | 83.33 |
| Operational and innovation processes | 6 | 37.50 | 6 | 37.50 | 0 | / | 6 | 37.50 | 2 | 25.00 | 2 | 25.00 | 0 | / | 2 | 25.00 |
| Teamwork and internal cooperation | 4 | 33.33 | 4 | 33.33 | 0 | / | 4 | 33.33 | 1 | 16.67 | 1 | 16.67 | 0 | / | 1 | 16.67 |
| Systems of communication | 14 | 87.50 | 15 | 93.75 | 1 | 7.14 | 14.5 | 90.63 | 4 | 50.00 | 6 | 75.00 | 2 | 50.00 | 5 | 62.50 |
| Management and control systems | 17 | 70.80 | 18 | 75.00 | 1 | 5.88 | 17.5 | 72.92 | 7 | 58.33 | 8 | 66.67 | 1 | 14.29 | 7.5 | 62.50 |
| Relational Capital (3) | 85 | 73.28 | 87 | 75.00 | 2 | 2.35 | 86 | 74.14 | 39 | 67.24 | 40 | 68.97 | 1 | 2.56 | 39.5 | 68.10 |
| Customer relations | 33 | 75.00 | 34 | 77.27 | 1 | 3.30 | 33.5 | 76.14 | 18 | 81.82 | 18 | 81.82 | 0 | / | 18 | 81.82 |
| Investor relations | 11 | 68.75 | 12 | 75.00 | 1 | 9.09 | 11.5 | 71.88 | 5 | 62.50 | 5 | 62.50 | 0 | / | 5 | 62.50 |
| Actions in social and environmental fields | 15 | 93.75 | 15 | 93.75 | 0 | / | 15 | 93.75 | 6 | 75.00 | 6 | 75.00 | 0 | / | 6 | 75.00 |
| Relationships with other actors | 11 | 55.00 | 11 | 55.00 | 0 | / | 11 | 55.00 | 6 | 60.00 | 7 | 70.00 | 1 | 16.67 | 6.5 | 65.00 |
| Corporate reputation | 15 | 75.00 | 15 | 75.00 | 0 | / | 15 | 75.00 | 4 | 40.00 | 4 | 40.00 | 0 | / | 4 | 40.00 |
| (1) + (2) + (3) | 214 | 67.72 | 219 | 69.30 | 5 | 2.34 | 216.5 | 68.51 | 88 | 55.70 | 98 | 62.03 | 10 | 11.36 | 93 | 58.86 |
Source: Authors’ elaboration.
Table 5.
IC disclosure by quality and quality type of banks.
| Healthy Banks | Distressed Banks | |||||||||||||||
|---|---|---|---|---|---|---|---|---|---|---|---|---|---|---|---|---|
| Total Amount | Variation | Average Value | Total Amount | Variation | Average Value | |||||||||||
| 2016 | 2017 | 2016 | 2017 | |||||||||||||
| n | % | n | % | ∆n | ∆% | n | % | n | % | n | % | ∆n | ∆% | n | % | |
| Financial dimension | ||||||||||||||||
| Financial (F) | 19 | 8.88 | 19 | 8.68 | 0 | / | 19 | 8.78 | 6 | 6.82 | 3 | 3.06 | −3 | −50.00 | 4.5 | 4.94 |
| Non-Financial (NF) | 176 | 82.24 | 182 | 83.11 | 6 | 3.41 | 179 | 82.67 | 76 | 86.36 | 85 | 86.73 | 9 | 11.84 | 80.5 | 86.55 |
| F&NF | 18 | 8.41 | 18 | 8.22 | 0 | / | 18 | 8.32 | 6 | 6.82 | 10 | 10.20 | 4 | 66.67 | 8 | 8.51 |
| Type of measure dimension | ||||||||||||||||
| Qualitative (Q) | 92 | 42.99 | 98 | 44.75 | 6 | 6.52 | 95 | 43.87 | 47 | 53.41 | 55 | 56.12 | 8 | 17.02 | 51 | 54.77 |
| Non-Qualitative (NQ) | 79 | 36.92 | 82 | 37.44 | 3 | 3.80 | 80.5 | 37.18 | 26 | 29.55 | 26 | 26.53 | 0 | / | 26 | 28.04 |
| Q&NQ | 42 | 19.63 | 39 | 17.81 | −3 | −7.14 | 40.5 | 18.72 | 15 | 17.05 | 17 | 17.35 | 2 | 13.33 | 16 | 17.20 |
| Time dimension | ||||||||||||||||
| Historical (H) | 42 | 19.63 | 50 | 22.83 | 8 | 19.05 | 46 | 21.23 | 21 | 23.86 | 21 | 21.43 | 0 | / | 21 | 22.65 |
| Non-Time-Specific (NTS) | 152 | 71.03 | 152 | 69.41 | 0 | / | 152 | 70.22 | 58 | 65.91 | 65 | 66.33 | 7 | 12.07 | 61.5 | 66.12 |
| Forward-Looking (FL) | 5 | 2.34 | 5 | 2.28 | 0 | / | 5 | 2.31 | 1 | 1.14 | 0 | / | −1 | −100.00 | 0.5 | 1.14 |
| H&NTS | 9 | 4.21 | 8 | 3.65 | −1 | −11.11 | 8.5 | 3.93 | 8 | 9.09 | 10 | 10.20 | 2 | 25.00 | 9 | 9.65 |
| NTS&FL | 3 | 1.40 | 3 | 1.37 | 0 | / | 3 | 1.39 | 0 | / | 1 | 1.02 | 1 | / | 0.5 | 1.02 |
| H&FL | 1 | 0.47 | 1 | 0.46 | 0 | / | 1 | 0.46 | 0 | / | 1 | 1.02 | 1 | / | 0.5 | 1.02 |
| H&NTS&FL | 1 | 0.47 | 0 | / | −1 | −100.00 | 0.5 | 0.47 | 0 | / | 0 | / | 0 | / | 0 | / |
Source: Authors’ elaboration.
Table 6.
IC disclosure by quality and bank size.
| Large Banks | Small Banks | |||||||||||||||
|---|---|---|---|---|---|---|---|---|---|---|---|---|---|---|---|---|
| Total Amount | Variation | Average Value | Total Amount | Variation | Average Value | |||||||||||
| 2016 | 2017 | 2016/2017 | 2016 | 2017 | 2016/2017 | |||||||||||
| n | % | n | % | ∆n | ∆ % | n | % | n | % | n | % | ∆n | ∆ % | n | % | |
| Nature | ||||||||||||||||
| Financial (F) | 11 | 9.82 | 13 | 11.82 | 2 | 18.18 | 12 | 10.82 | 14 | 7.41 | 9 | 4.35 | −5 | −35.71 | 11.5 | 5.88 |
| Non-Financial (NF) | 89 | 79.46 | 85 | 77.27 | −4 | −4.49 | 87 | 78.37 | 163 | 86.24 | 182 | 87.92 | 19 | 11.66 | 172.5 | 87.08 |
| F/NF | 12 | 10.71 | 12 | 10.91 | 0 | / | 12 | 10.81 | 12 | 6.35 | 16 | 7.73 | 4 | 33.33 | 14 | 7.04 |
| Type of measure | ||||||||||||||||
| Qualitative (Q) | 42 | 37.50 | 41 | 37.27 | −1 | −2.38 | 41.5 | 37.39 | 97 | 51.32 | 112 | 54.11 | 15 | 15.46 | 105 | 52.71 |
| Non-Qualitative (NQ) | 45 | 40.18 | 45 | 40.91 | 0 | / | 45 | 40.54 | 60 | 31.75 | 63 | 30.43 | 3 | 5.00 | 61.5 | 31.09 |
| Q/NQ | 25 | 22.32 | 24 | 21.82 | −1 | −4.00 | 24.5 | 22.07 | 32 | 16.93 | 32 | 15.46 | 0 | / | 32 | 16.20 |
| Time dimension | ||||||||||||||||
| Historical (H) | 24 | 21.43 | 32 | 29.09 | 8 | 33.33 | 28 | 25.26 | 39 | 20.63 | 39 | 18.84 | 0 | / | 39 | 19.74 |
| Non-Time-Specific (NTS) | 77 | 68.75 | 68 | 61.82 | −9 | −11.69 | 72.5 | 65.28 | 133 | 70.37 | 149 | 71.98 | 16 | 12.03 | 141 | 71.18 |
| Forward-Looking (FL) | 3 | 2.68 | 3 | 2.73 | 0 | / | 3 | 2.70 | 3 | 1.59 | 2 | 0.97 | −1 | −33.33 | 2.5 | 1.28 |
| H/NTS | 5 | 4.46 | 5 | 4.55 | 0 | / | 5 | 4.50 | 12 | 6.35 | 13 | 6.28 | 1 | 8.33 | 12.5 | 6.31 |
| NTS/FL | 1 | 0.89 | 1 | 0.91 | 0 | / | 1 | 0.90 | 2 | 1.06 | 3 | 1.45 | 1 | 50.00 | 2.5 | 1.25 |
| H/FL | 1 | 0.89 | 1 | 0.91 | 0 | / | 1 | 0.90 | 0 | / | 1 | 0.48 | 1 | / | 0.5 | 0.24 |
| H/NTS/FL | 1 | 0.89 | 0 | / | −1 | −100.00 | 0.5 | 0.45 | 0 | / | 0 | / | 0 | / | 0 | / |
Source: Authors’ elaboration.
Table 7.
IC disclosure by quality and by number of independent directors.
| - | Independent Directors (above the Average Number) | Independent Directors (below the Average Number) | ||||||||||||||
|---|---|---|---|---|---|---|---|---|---|---|---|---|---|---|---|---|
| - | Total Amount | Variation | Average Value | Total Amount | Variation | Average Value | ||||||||||
| - | 2016 | 2017 | 2016/2017 | 2016 | 2017 | 2016/2017 | ||||||||||
| n | % | n | % | ∆ n | ∆ % | n | % | n | % | n | % | ∆ n | ∆ % | n | % | |
| Nature | ||||||||||||||||
| Financial (F) | 14 | 9.21 | 15 | 9.62 | 1 | 7.14 | 15 | 9.41 | 11 | 7.38 | 7 | 4.35 | 7 | −36.36 | 9.0 | 5.87 |
| Non Financial (NF) | 122 | 80.26 | 124 | 79.49 | 2 | 1.64 | 123 | 79.88 | 130 | 87.25 | 143 | 88.82 | 13 | 10.00 | 136.5 | 88.03 |
| F/NF | 16 | 10.53 | 17 | 10.90 | 1 | 6.25 | 17 | 10.71 | 8 | 5.37 | 11 | 6.83 | 3 | 37.50 | 10 | 6.10 |
| Type of Measure | ||||||||||||||||
| Qualitative (Q) | 68 | 44.74 | 72 | 46.15 | 4 | 5.88 | 70.0 | 45.45 | 71 | 47.65 | 81 | 50.31 | 10 | 14.08 | 76 | 48.98 |
| Non Qualitative (NQ) | 56 | 36.84 | 57 | 36.54 | 1 | 1.79 | 57 | 36.69 | 49 | 32.89 | 51 | 31.68 | 2 | 4.08 | 50.0 | 32.28 |
| Q/NQ | 28 | 18.42 | 27 | 17.31 | −1 | −3.57 | 27.5 | 17.86 | 29 | 19.46 | 29 | 18.01 | 0 | / | 29 | 18.74 |
| Time dimension | ||||||||||||||||
| Historical (H) | 32 | 21.05 | 41 | 26.28 | 9 | 28.13 | 37 | 23.67 | 31 | 20.81 | 30 | 18.63 | −1 | −3.23 | 31 | 19.72 |
| Non-Time Specific (NTS) | 108 | 71.05 | 103 | 66.03 | −5 | −4.63 | 105.5 | 68.54 | 102 | 68.46 | 114 | 70.81 | 12 | 11.76 | 108 | 69.63 |
| Forward-Looking (FL) | 3 | 1.97 | 3 | 1.92 | 0 | / | 3 | 1.95 | 3 | 2.01 | 2 | 1.24 | −1 | −33.33 | 2.5 | 1.63 |
| H/NTS | 6 | 3.95 | 7 | 4.49 | 1 | 16.67 | 7 | 4.22 | 11 | 7.38 | 11 | 6.83 | 0 | / | 11.0 | 7.11 |
| NTS/FL | 1 | 0.66 | 1 | 0.64 | 0 | / | 1 | 0.65 | 2 | 1.34 | 3 | 1.86 | 1 | 50.00 | 2.5 | 1.60 |
| H/FL | 1 | 0.66 | 1 | 0.64 | 0 | / | 1 | 0.65 | 0 | / | 1 | 0.62 | 1 | / | 0.5 | 0.31 |
| H/NTS/FL | 1 | 0.66 | 0 | / | −1 | −100.00 | 0.5 | 0.33 | 0 | / | 0 | / | 0 | / | 0 | / |
Source: Authors’ elaboration.
© 2020 by the authors. Licensee MDPI, Basel, Switzerland. This article is an open access article distributed under the terms and conditions of the Creative Commons Attribution (CC BY) license (http://creativecommons.org/licenses/by/4.0/).
Share and Cite
MDPI and ACS Style
Birindelli, G.; Ferretti, P.; Chiappini, H.; Cosentino, A. Intellectual Capital Disclosure: Some Evidence from Healthy and Distressed Banks in Italy. Sustainability 2020, 12, 3174. https://0-doi-org.brum.beds.ac.uk/10.3390/su12083174
AMA Style
Birindelli G, Ferretti P, Chiappini H, Cosentino A. Intellectual Capital Disclosure: Some Evidence from Healthy and Distressed Banks in Italy. Sustainability. 2020; 12(8):3174. https://0-doi-org.brum.beds.ac.uk/10.3390/su12083174
Chicago/Turabian StyleBirindelli, Giuliana, Paola Ferretti, Helen Chiappini, and Andrea Cosentino. 2020. "Intellectual Capital Disclosure: Some Evidence from Healthy and Distressed Banks in Italy" Sustainability 12, no. 8: 3174. https://0-doi-org.brum.beds.ac.uk/10.3390/su12083174
Note that from the first issue of 2016, this journal uses article numbers instead of page numbers. See further details here.