Article

Mitigation of Methane, NMVOCs and Odor Emissions in Active and Passive Biofiltration Systems at Municipal Solid Waste Landfills

DESTEC—Department of Energy, Systems, Territory and Construction Engineering, University of Pisa, 56122 Pisa, Italy
*
Authors to whom correspondence should be addressed.
Sustainability 2020, 12(8), 3203; https://0-doi-org.brum.beds.ac.uk/10.3390/su12083203
Submission received: 21 March 2020 / Revised: 10 April 2020 / Accepted: 13 April 2020 / Published: 15 April 2020
(This article belongs to the Special Issue Municipal Solid Waste Management in a Circular Economy)

Abstract

:
Biofiltration systems are emerging technological solutions for the removal of methane and odors from landfill gas when flaring is no longer feasible. This work analyzed and compared two full-scale biofiltration systems: biofilter and biowindows. The emission mitigation of methane, non-methane volatile organic compounds (NMVOCs) and odors during a two-year management and monitoring period was studied. In addition to diluted methane, more than 50 NMVOCs have been detected in the inlet raw landfill gas and the sulfur compounds resulted in the highest odor activity value. Both systems, biofilter and biowindows, were effective for the oxidation of methane (58.1% and 88.05%, respectively), for the mitigation of NMVOCs (higher than 80%) and odor reduction (99.84% and 93.82% respectively). As for the biofilter monitoring, it was possible to define the oxidation efficiency trend and in fact to guarantee that for an oxidation efficiency of 80%, the methane load must be less than 6.5 g CH4/m2h with an oxidation rate of 5.2 g CH4/m2h.

1. Introduction

Approximately 11% of anthropogenic methane emissions globally are emitted from landfills, which are also sources of odorous emissions [1]. The effect of the degradation of organic waste in landfills leads to landfill gas (LFG) emission, in particular methane (CH4) and carbon dioxide (CO2) [2]. In addition, non-methane volatile organic compounds (NMVOCs) and inorganic compounds lead to complaints from local citizens about the bad smells as well as health problems [3]. The NMVOCs include aliphatic compounds (alkanes and alkenes), aromatic hydrocarbons (benzene, toluene, ethylbenzene, etc.), halogenates (dichlorofluoromethane, vinyl chloride, etc.), hydrocarbons and alcohols (ethanol, methanol, etc.) [4,5,6]. The presence of NMVOCs in landfill gas is mainly due to the process of volatilization of compounds present in the waste during the anaerobic degradation processes [7] and to a lesser extent to the composition of the waste (e.g., paints, adhesive glues and solvents) [8,9,10]. A widely used mitigation strategy is LFG recovery for energy utilization or flaring, but over time, LFG generation will decline to a level where utilization is no longer feasible [11,12].
Biofiltration systems are emerging technological solutions for the removal of methane and odors from LFG [13,14] when flaring is no longer feasible, which include different types, such as: biofilters [15,16]; biocovers [13,17,18]; and biowindows [17,19]; Based on previous small-scale studies [3,20], pilot scales of biocovers have been carried out to study methane removal [18,21,22]. In addition, studies on odor reduction [14,23] and simultaneous reduction of odors and methane [3,24,25] were also performed.
Odor treatment technologies can be classified into three categories, namely ones employing chemical (thermal oxidation, catalytic oxidation, ozonation), physical (condensation, adsorption, absorption) and biological (using biofilters, biotrickling filters, bioscrubbers and other bioreactor types) treatment methods. An important advantage of biological treatment methods over physical and chemical technologies is that the biological processes can be conducted at moderate temperatures (10–40 °C) and atmospheric pressure. Moreover, microbial degradation processes are generally oxidative in nature and produce compounds such as carbon dioxide, water, sulfate and nitrate that are ecologically safe [26]. Many authors analyzed and discussed and the results obtained from experimental studies in terms of the operational conditions, especially with respect to the removal efficiencies and the elimination capacities of the pollutants considered [27,28]. Empty bed residence time, pollutant loading rate, temperature, pH, oxygen availability, trickling liquid flow rate, inoculum selection and biomass control strategies were revealed to be the most important operational factors influencing the removal performance of biotrickling filters [27,28].
Although biocovers studies show high abatement efficiencies, in practice there are complications due to the high surface area, the very extensive gas distribution system, maintenance costs and performance control [19,29].
To overcome the disadvantages of traditional biocovers, the present study proposes a full-scale application of biowindows and biofilters. In the first case, a gas drainage system in the landfill body conveys the LFG passively to the biowindow (of limited surface area); this approach is able to reduce the installation area compared to traditional biocovers, simplifying its management and reducing the costs of both implementation and monitoring. In the second case, in a landfill where a gas capture system with extraction wells is available, it is possible to build a biofilter (outside or beside the landfill area itself) where a blower conveys the gas to be treated. Therefore, in this case it is possible to control the system more punctually than with a biocover. In addition, it is also possible to regulate the quality and quantity of the gas to be treated [30,31].
In this study, therefore, for the first time in the Mediterranean area, the feasibility of the two biofiltration systems mentioned above has been analyzed and compared at full scale. The emission mitigation of CH4, NMVOCs and odors during a two-year management and monitoring period was studied.

2. Materials and Methods

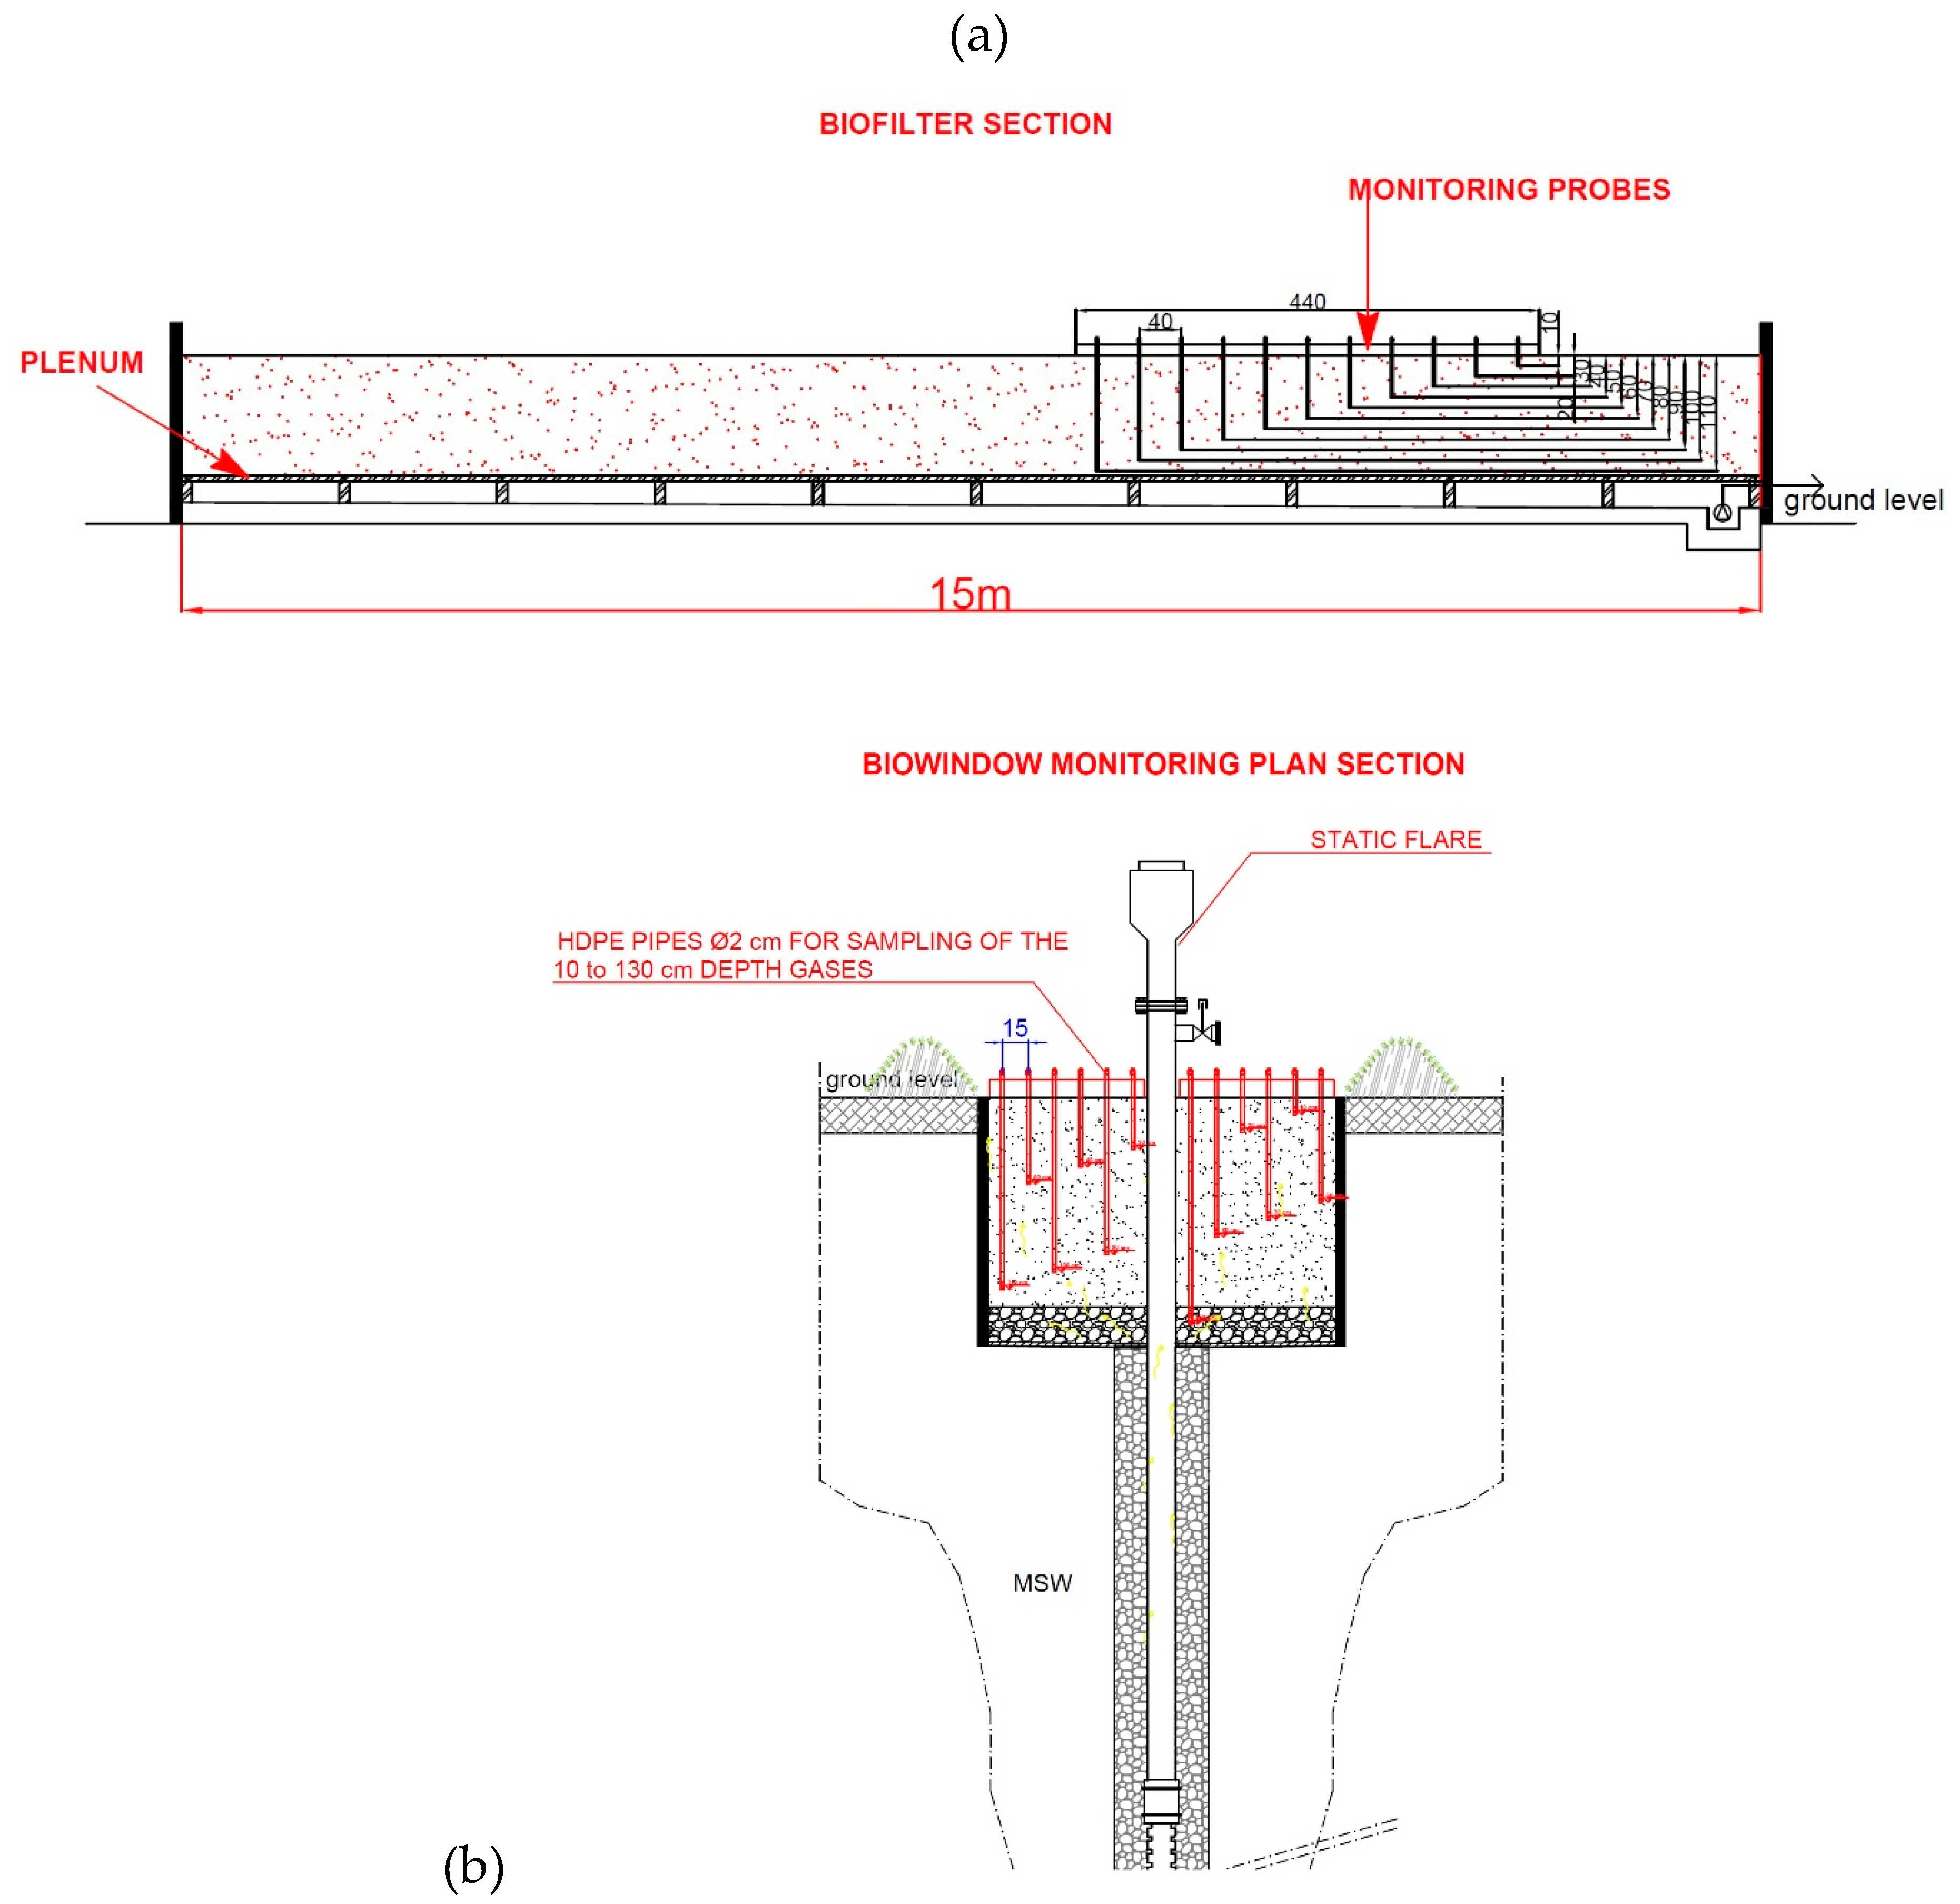
2.1. Biofiltration Systems

The study focused on two landfill sites located in Tuscany (Italy): Podere il Pero landfill that is situated in the province of Arezzo, and Le Fornaci di Monticiano that is situated in the province of Siena. Further descriptions of the sites can be found in Appendix A.
At Podere il Pero landfill, LFG is actively conveyed to a 270 m2 biofilter in which CH4 is biologically oxidized into CO2. Specifically, the LFG supply system is composed of a blower (MAPRO CL 10/01 VG, Monza, Italy), a main supply pipe with an inner diameter of 110 mm and a sub-set of nine high-density polyethylene (HDPE) slotted pipes with an inner diameter ranging between 32 and 40 mm. To ensure an even LFG distribution, the sub-set of pipes are embedded in a coarse gravel layer (grain size 15–30 mm) of approximately 0.4 m. Consequently, the LFG migrates in a 1.5 m biologically oxidizing layer. A geogrid separates this layer and the coarse gravel at the bottom. The biofilter was built above the ground and a concrete structure contains the overall filtering layers. To prevent the infiltration of rainwater and to control the moisture content of the oxidizing layer, a coverage of polyvinyl chloride (PVC) and a pop-up irrigation system was installed. Furthermore, the biofilter floor had a slight inclination to eventually remove, by gravity, leachate, which is then collected in a tank. LFG is supplied to the prototype from the oldest part of the landfill, and by means of valves, the quality was set to maintain an average CH4 concentration of 20% v/v and a flow rate of about 20 Nm3/h. A section of the biofilter is shown in Figure 1a.
At Le Fornaci di Monticiano landfill, LFG is passively conveyed in a set of seven biowindows of 4 m2. Based on the outcomes of a preliminary survey, seven emissive hotspots on the landfill cover were identified; the existing clay soil cover was then removed and the passive biowindows were built to substitute the LFG passive control system in connection with the drainage system of the old well. Each passive biowindow consists of a 0.4 m coarse gravel layer for the proper distribution of LFG in the overlying oxidizing layer of 1.2 m height. Pressure differences and diffusion processes allow the migration of LFG in the oxidizing media. Metal formworks contain the filtering layers and reinforce the whole module, while a geogrid separates the oxidizing and the coarse gravel layers. Clay levees around the module limit the infiltration of the surface runoff. A section of a biowindow is shown in Figure 1b.
Focusing on the oxidizing layer, compost is a suitable filter media for biological CH4 oxidation [13]. Consequently, a local authority in the waste management sector provided the compost from a source-sorted organic fraction of municipal solid waste (MSW) and sand was added in a volume to 1:5 to improve the compost structure. Overall, the compost had good physic and chemical characteristics: average moisture content—28.04 ±10.49% ww; pH—7.25 ± 0.67; nitrogen (NH4+-N)—1968 ± 2655 mg/kgdw; phosphorus (Ptot)—0.81 ± 0.28%dw; and C/N ratio—15.3 ± 0.56. It thus fulfilled the recommended literature range [13]. Moreover, the samples showed high porosity (>25% v/v), low density (0.8 kg/L) and high water-holding capacity (138.3 ± 11%dw). Concerning moisture content, the average value of 28.04% ww corresponds to a moisture content of 40% dw, indicating that moist is not a limiting factor for CH4 oxidation processes [21]. Despite of the good physical and chemical properties, the compost was not completely stable, showing an O2 consumption of 884 mgO2/kgTVS h (175 μgO2/gTS h) and a CO2 production of 570 mgCO2/kgTVS h (113 μgCO2/gTS h). Such measurements were performed using the potential dynamic respirometric index method [32,33]. In order to evaluate compost respiration, a special monitoring survey was performed in June 2018 to measure the specific CO2 flux at the biofilter surface as other authors have done [18,21]. The biofilter was switched off for 48 h and then, as a routine monitoring survey, using the static accumulation chamber, 99 surface flux measurement were performed. The special monitoring survey showed a specific flux of 4.33 NlCO2/m2h. As a consequence, the respiration compost produced 74.72 mgO2/kgTVS h (14.82 μgCO2/gTS h), consistent with the findings of other authors [21].
Subsequently to the construction phase, the biofiltration systems were monitored from November 2016 to January 2019 for an overall period of 820 days considering both the start-up and the operational phase. Concerning the monitoring surveys, a total of 41 routine surveys were performed to assess CH4 oxidation efficiencies, while four specific surveys focused on the screening and the reduction of NMVOC and odor compounds emissions due to each biofiltration system.

2.2. Monitoring Campaigns

2.2.1. Gas Sampling

During the routine surveys, raw LFG and soil gas were sampled to determine its composition (CH4, CO2, O2). Concerning the active biofilter, raw LFG samples were collected in duplicate just downstream of the blower. As a consequence, the CH4 load was evaluated considering the LFG discharge registered by a flow meter. Concerning the passive biowindows, raw LFG samples were collected in duplicate using a 130 cm probe embedded in the coarse gravel layer located between the oxidizing layer and the waste. In this case, CH4 load was not evaluated because of the absence of any active LFG control system. In both biofiltration systems, soil gas was sampled using a set of 11 probes installed in the oxidizing layer at 10, 20, 30, 40, 50, 60, 70, 80, 90, 100 and 110 cm of depth (see Figure 1). The probes were PVC pipes with an inner diameter of 14 mm; each probe was gas-tight at the bottom and at the top, while some slots at the bottom allowed the entrance of the soil gas. To investigate any anisotropic behavior, six sets of probes were installed in the filter media of the active biofilter, while in each biowindow two sets of probes were installed. The gas sampling time was based on the volume of each probe.
CH4 and CO2 surface fluxes were evaluated by the static chamber accumulation method using the equipment developed by Pecorini (2010) [34]. On the active biofilter, 99 surface flux measurements were performed in order to obtain a solid statistical data set on which it would be possible to at first evaluate an average CH4 flux and then the overall oxidation efficiency.
The specific NMVOC and odor compounds monitoring campaigns were performed in March 2017, August 2017, March 2018 and January 2019. Focusing on the NMVOCs, the measurements were performed both at the entrance and at the surface of the biofiltration systems. At the surface, gas samples were collected using the dynamic flux chamber method [35]. The chamber was made of polytetrafluoroethylene (PTFE) and was developed by THEAREN SRL®. The inner diameter was 0.5 m and 4.5 l/min of nitrogen (N2) were conveyed in the control volume thanks to a spiral tube. At the entrance, raw LFG was collected in a polyvinyl fluoride (PVF) tedlar bag. Hydrogen sulfide (H2S) was sampled using a filter in a solid sorbent tube in accordance with NIOSH 6013:1994. Focusing on the odor compounds, surface samples were collected from the control volume of the dynamic chamber using a nalophan bag. Concerning the active biofilter, during each field survey the odor surface measurements were performed in triplicate, while a single sample of raw LFG was collected in the pipe downstream from the blower. Concerning the passive biowindows, the odor surface measurements were performed on single samples and a single sample of raw LFG was collected through the 130 cm probe.
Finally, meteorological parameters were continuously monitored. Ambient temperature (maximum, minimum and average value), and rainfall were obtained on a 15 min basis from meteorological stations of the Tuscany Meteorological Center (CFR). Briefly, in the overall monitoring period at Podere il Pero landfill, the 48 h accumulated precipitation was on average 2.6 ± 7.7 mm, the average ambient temperature ranged from −4.3 to 30.6 °C, and the average atmospheric pressure was 987 ± 7 hPa. On the other hand, at Monticiano landfill, the analysis of the meteorological data showed a 48 h accumulated rainfall of 0.8 ± 2.7 mm, an average ambient temperature ranging from −5.9 to 30.9 °C, and an average atmospheric pressure of 981 ± 6 hPa.

2.2.2. Chemical Analysis

The analysis of soil gas and raw LFG in order to determine the concentrations of CH4, CO2 and O2 was performed on the field using a portable infra-red instrument (Ecoprobe 5—Rs Dynamics, Prague, Czech Republic) with a detection limit of 500 ppm on both CH4 and CO2. For CH4 emissions below 500 ppm the gas was sampled by means of a foil bag and analyzed within 4 h with the micro-gas chromatograph (INFICON, Switzerland) according to the procedure described by Baldi et al. (2019) [36].
With regard to NMVOCs, raw and emitted LFG samples were analyzed accordingly to US EPA TO-15 [8]. The samples were screened to find 177 compounds. The emissive fluxes were evaluated in accordance with the calculation proposed by Liu et al., 2015 [7]. Furthermore, among the odorous compounds, the NIOSH 6013:1994 method was used to measure the H2S concentration in the raw LFG and at the surface of the biofiltration systems, while NIOSH 6016:1996 was used to measure ammonia.
Focusing on the odor compounds, the odor concentration (OC) of emitted LFG was directly evaluated using a olfactometer (TO8 Olfasense GmbH, Kiel, Germany) with the dynamic olfactometry method EN 13725:2003 [37]. Indeed, the OC of raw LFG was estimated by the odor activity value (OAV). In particular, the OAV evaluates the relationship between the chemical composition and the odor nuisance of a gaseous mixture [38,39], weighting the concentration of each odorous component with its odor threshold (OT). In the OAV evaluation the OT measured in a recent research by Wu et al. (2017) [39] were considered, in which 51 odor compounds were analyzed. However, the OAV value is affected by great imprecision because of the difficulty to find a reliable OT [39].

2.3. Performance Evaluation and Statistical Analysis

The performance of biofiltration systems concerning CH4 oxidation efficiency, reduction of NMVOC emissions and odor compounds was evaluated.
Two methodologies were applied to evaluate CH4 oxidation efficiency. At first, CH4, CO2 and O2 concentration profiles were used to qualitatively estimate CH4 oxidation [22]. For the active biofilter, a mass balance on CH4 was applied [18] and an overall CH4 oxidation efficiency was estimated.
To evaluate the performance of biofiltration systems on NMVOC reduction efficiency (RE), the concentrations at the top and at the bottom were compared as following:
RE (%) = (NMVOCin − NMVOCout)/NMVOCin
NMVOCin is the value at the bottom of the biofiltration system and NMVOCout is the value at the top of the biofiltration system. NMVOCin and NMVOCout are the mean concentration of each NMVOC class. The methodology was applied in accordance with Lee et al. (2017) [25].
To evaluate the odor reduction efficiency (ORE), the following equation was applied:
ORE (%) = (OAVin − OAVout)/OAVin
OAVin is the OAV evaluated at the bottom of the biofiltration system and OAVout is the odor activity value at the top of biofiltration system [39].
The sum of the odor activity value (SOAV) was calculated based on the concentrations of the representative odorous compounds using the method of Lee et al. (2018) [3].
Statistical analysis was performed with Microsoft XLStat2018 software (Addinsoft, New York, NY, USA). The Pearson correlation coefficient (r) was used to evaluate the correlation between the odor concentration (OC) and the SOAV [39].

3. Results and Discussion

In the overall monitoring period, for the active biofilter an irrigation system regulated the moisture of the filter media to achieve a moisture content of 30% ww. On the other hand, the pH ranged from 8.2 to 8.5. Concerning the biowindows, the moisture content ranged from 15% ww to 25% ww. In this case, no irrigation system was installed; the pH showed lower values than the biofilter and ranged from 7.7 to 7.2. These parameters, which influence the biofiltration processes, fall within the optimal ranges found in the literature for pH (6.5–8.5) [13] and moisture content (>7.8) [22].

3.1. Raw LFG

Concerning Podere il Pero landfill, in the overall monitoring period, the average composition of raw LFG was 20.0 ± 5.8% v/v CH4, 13.5 ± 6.4% v/v CO2 and 10.5 ± 2.3% v/v O2. Due to the high oxygen concentration, input LFG to the biofilter can be defined as diluted LFG as other authors have done, given the low concentrations of methane used (between 0.35% and 30%) [40]. The average LFG flow rate was 20.3 ± 4.6 Nm3/h. Changing the unit of measurement, the average LFG flow rate was 20.7 ± 1.22 mL/m2s, about four times higher than that of the biocover of Capanema et al.’s [14], equal to 5.9 mL/m2s. Ammonia and H2S, although not organic components, but given their significant importance in LFG [41], were detected and presented in the classes of nitrogen and sulfur compounds, respectively. A total of 53 NMVOCs were detected in the raw LFG samples. The concentrations of the detected compounds are given in Appendix B Table A1, and the compound classes are reported in Table 1. The detected compounds were compiled into six categories listed below in order of chemical contribution: aliphatic compounds > terpenes > sulfur compounds > aromatic compounds > halogenated compounds > oxygenated compounds. Regarding aliphatic compounds, n-butane, propylene and cyclohexane were the most present compounds with a 79% coverage on the class, while the prevailing terpene (71%) was alpha-pinene with a concentration of 2394.8 ± 4035.4 µg/m3 and the prevailing sulfur compound (95%) was hydrogen sulfide with a concentration of 3762.5 ± 1842.6 µg/m3. With regards to aromatic compounds, m,p,o-xylene, (m(+)p)-xylene and toluene together represented 56% of the class. Vinyl chloride and dichlorodifluoromethane accounted for 78% of the class of halogenated compounds. Acetone and ethanol accounted for 62% of the oxygenated class.
Concerning Monticiano landfill, in the overall monitoring period, the average composition of raw LFG was 33.1 ± 16.7% v/v CH4, 19.9 ± 4.6% v/v CO2 and 2.8 ± 3.2% v/v O2. The concentrat ion of methane is comparable with that used by Jung et al. [19] 28.88% applied to biowindows. A total of 72 VOCs were detected in the raw LFG samples. The concentrations of the detected compounds are given in Appendix B Table A2, and the compound classes are reported in Table 1. The detected concentrations contained some order differences with those found for the biofilter, listed below in order of chemical contribution: sulfur compounds > aliphatic compounds > aromatic compounds > halogenated compounds > terpenes > oxygenated compounds. The prevailing sulfur compound (97%) was hydrogen sulfide, with a concentration of 7955.2 ± 7181.4 µg/m3. Regarding aliphatic compounds, n-butane, propylene and cyclohexane were the most present compounds with a 75% coverage on the class. Regarding aromatic compounds, m,p,o-xylene, (m(+)p)-xylene and toluene together represented 53% of the class. Vinyl chloride and dichlorodifluoromethane accounted for 64% of the class of halogenated compounds. The prevailing terpenes (86%) were limonene and alpha-pinene with concentrations of 1132.2 ± 2226.4 µg/m3 and 936.7 ± 1474.6 µg/m3, respectively. Acetone and ethanol accounted for 51% of the oxygenated class.
Comparing the raw LFG emissions of the biofilter and the biowindows, it can be observed that the former had minor standard deviations, because there were three sampled biowindows with different emission levels (from negligible to high). The predominant compounds in the studied classes were the same for both biofilter and biowindos. It is also noted that the emission of hydrogen sulfide in the biowindows was higher than in the biofilter. In both raw LFGs, it was observed that the aromatic toluene and xylenes classes have a higher concentration of benzene, as other authors had found [4,5].
Some of the prevailing compounds were also found by other authors with concentrations of the same order of magnitude as the present study. Scheutz et al. [5] found xylene (8550 µg/m3), toluene (7680 µg/m3), dichlorodifluoromethane (5700 µg/m3), vinyl chloride (2400 µg/m3) and n-butane (5500 µg/m3). The data are reasonably comparable to the results of Eklund et al. [42] for the Fresh Kills landfill receiving municipal solid waste (Staten Island, NY).
In Table 2, the OAV for each class of compounds is provided. In Table A1 and Table A2, the OAV for each compound is provided for the biofilter and for biowindows, respectively. In general, 99% of the SOAV contribution was attributable to the presence of sulfur compounds. In fact, according to Wu et al. (2017) [39], the OTs of Dimethyl Sulfide and of Hydrogen sulfide are 0.28 and 0.42 µg/m3, respectively. In addition, the SOAV of biowindows is one order of magnitude higher than the biofilter, consistently with the concentration of sulfur compounds detected. More specifically, H2S contributed the most to the odor pollution caused by the odorous gases in the landfill [39].

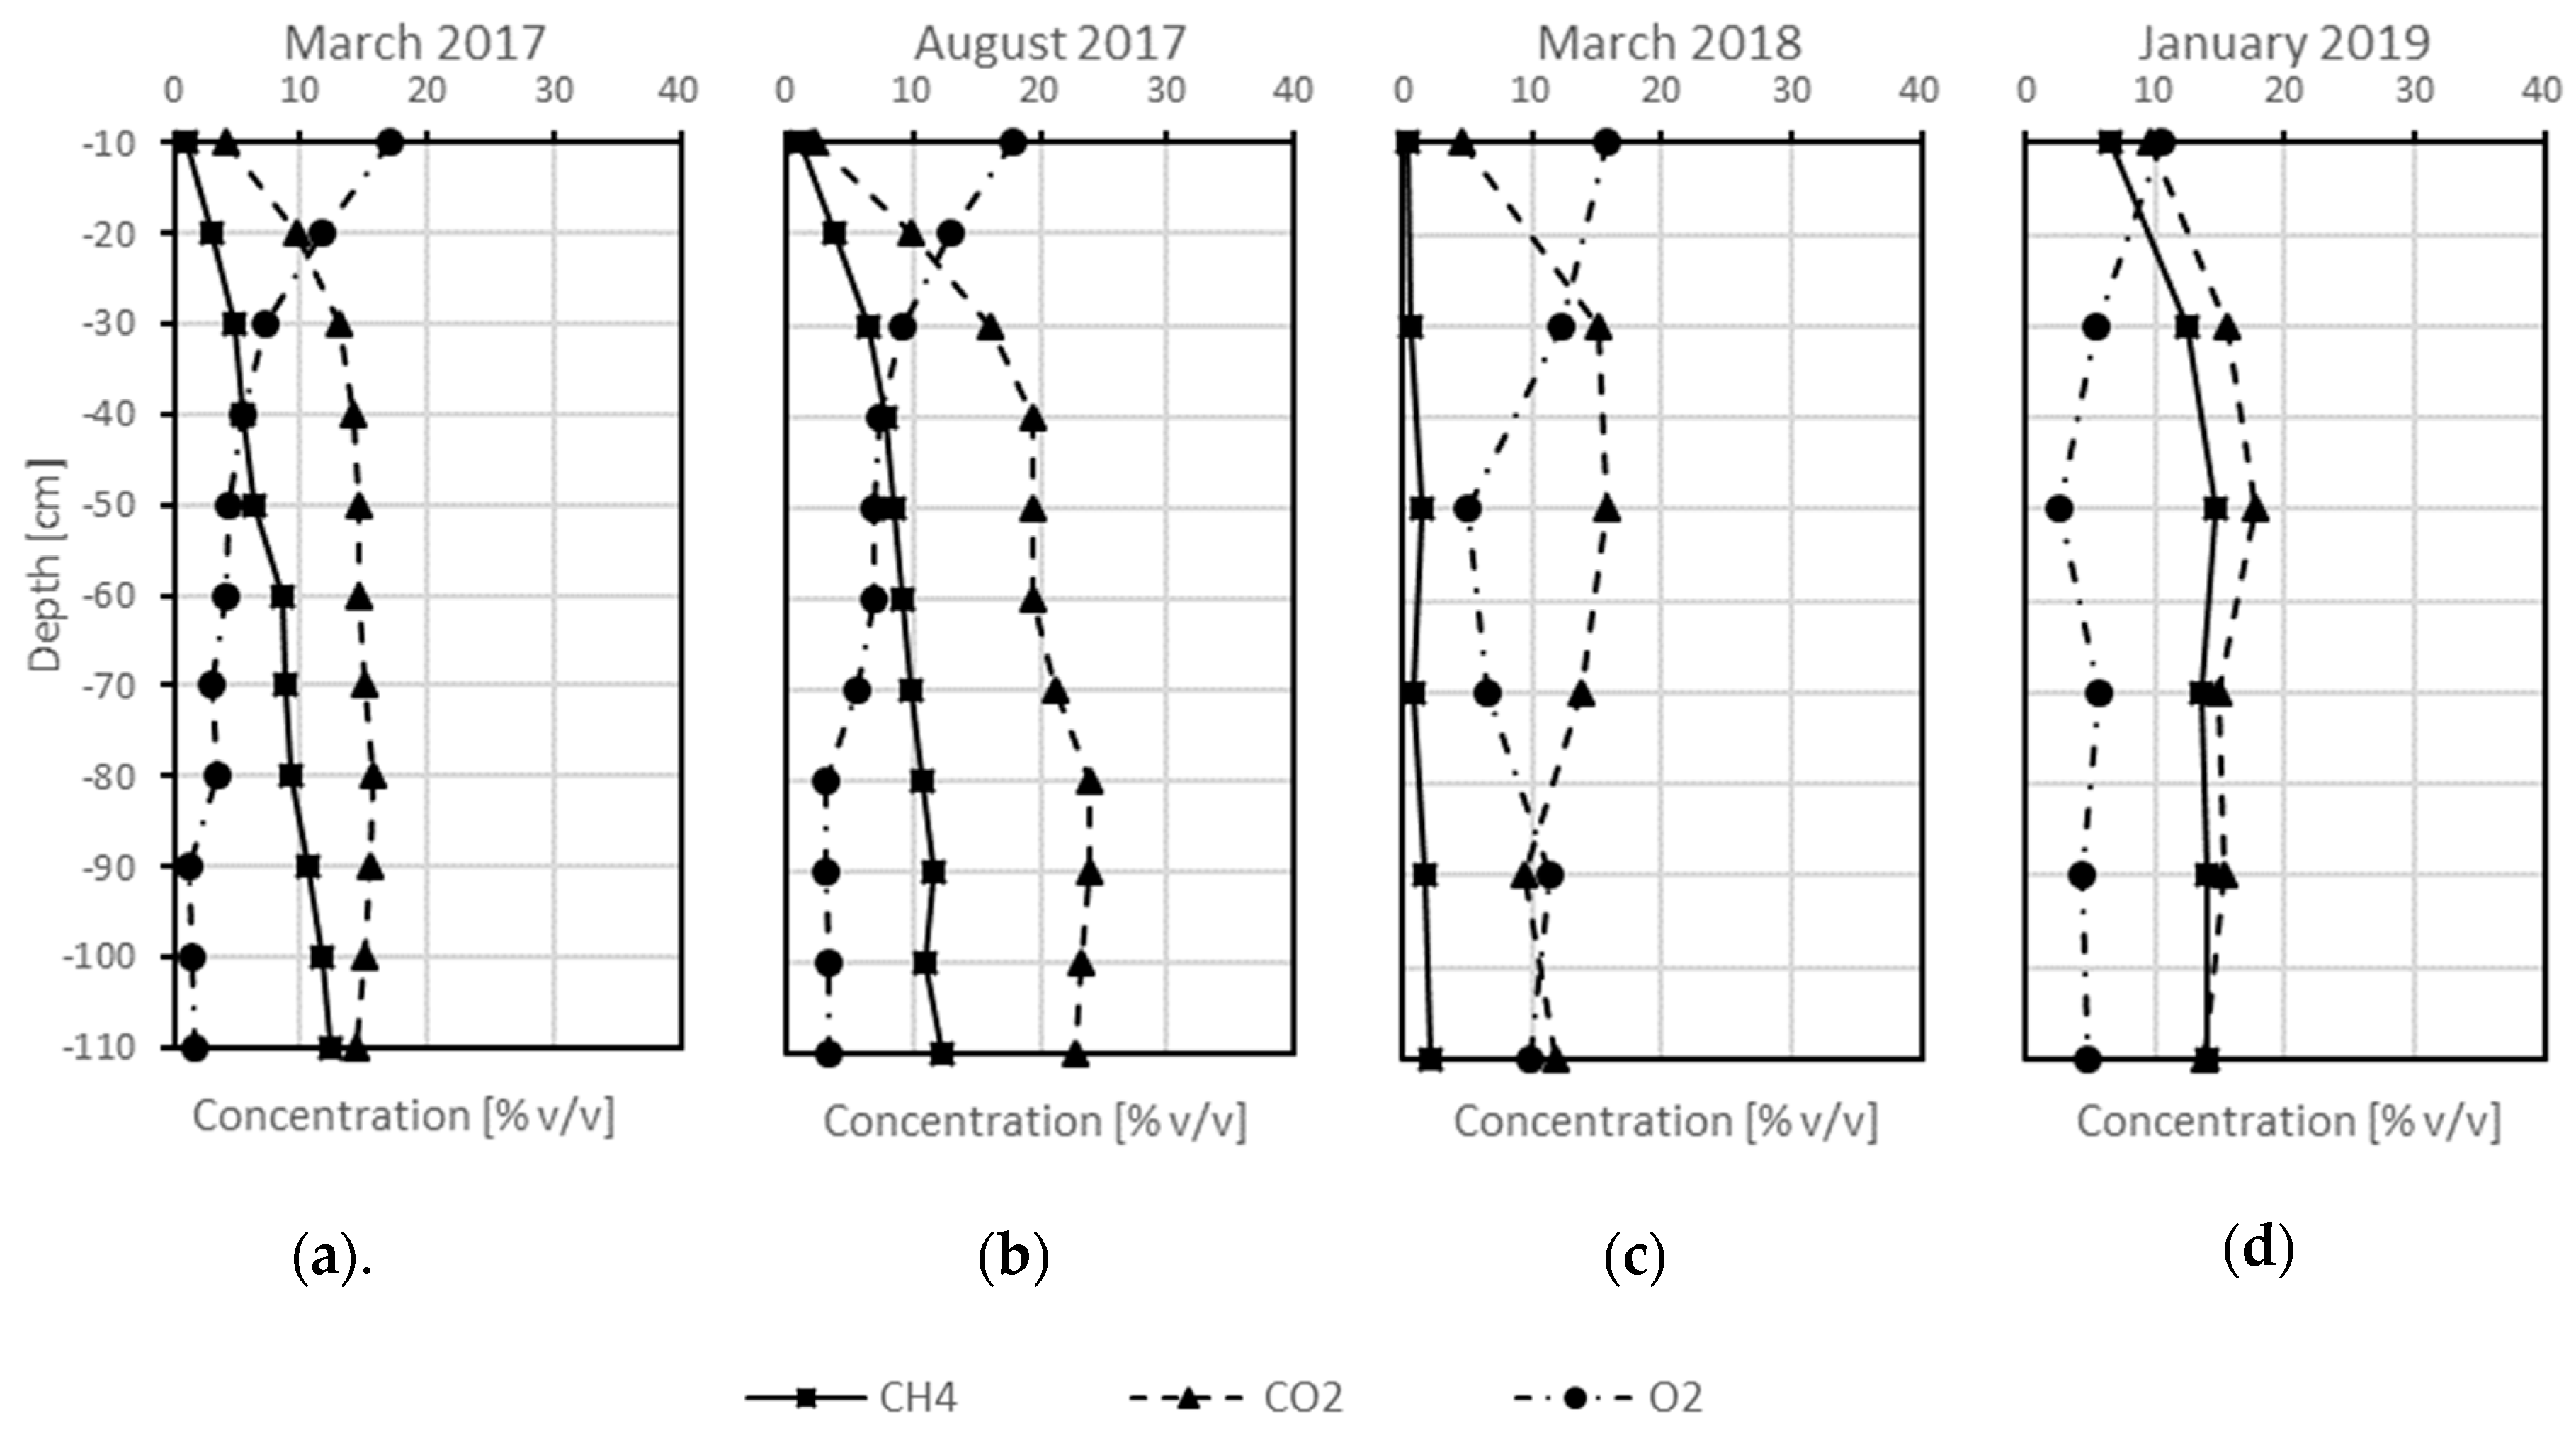
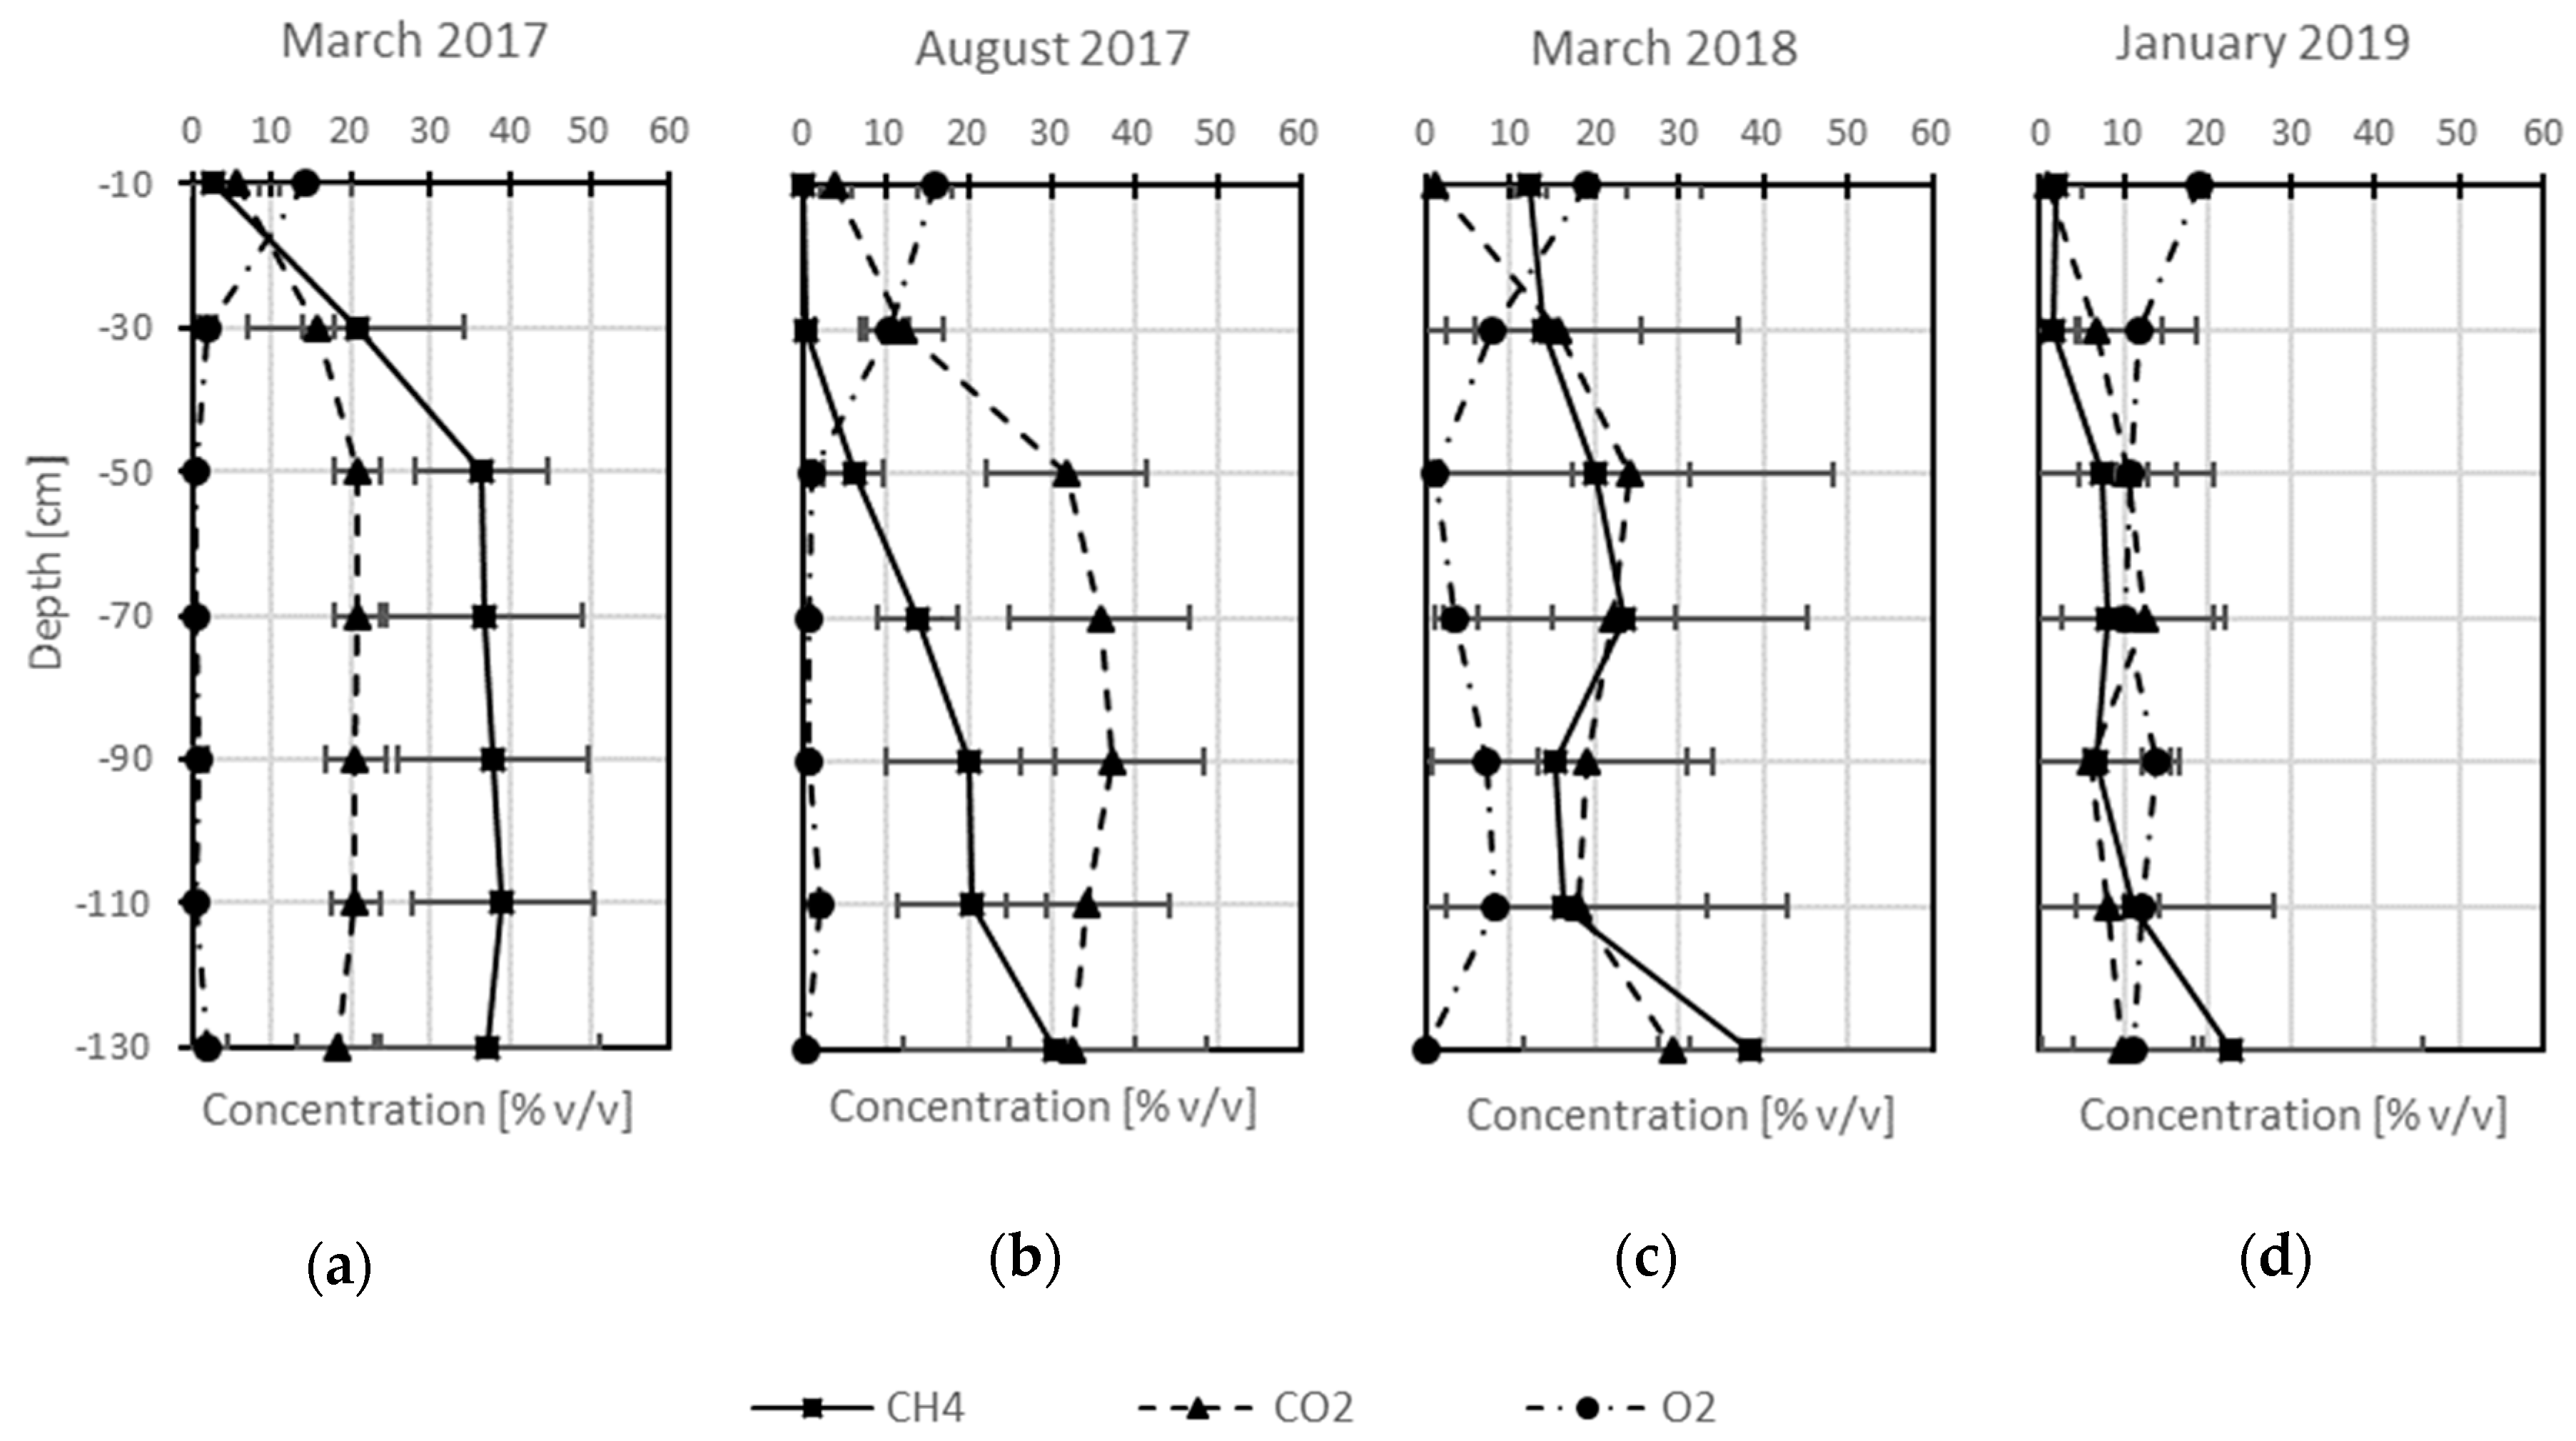
3.2. Surface LFG Emission

At the biofilter, CH4 and CO2 specific fluxes resulted on average 5.4 ± 3 and 13.7 ± 10 Nl/m2h, respectively, measured with the accumulation chamber. Consequently, the overall average LFG flux resulted 19.2 ± 10.2 Nl/m2h. Figure 2 shows the profiles at different depths of concentration of CH4, CO2 and O2 in the four days of volatile compounds sampling in the biofilter.
During the four days a similar trend was evident, the concentration of methane decreased as it approached the surface and the oxygen, already present in the incoming LFG, increased as it approached the top and therefore the atmospheric air. The CO2 in depth seemed to depend on the incoming load and kept its concentration almost unchanged until it decreased drastically in the 20 cm near the top (where the entry of air into the pores of the ground was high). CO2 seemed to increase between depths of 70 and 30 cm (see Figure 2c—March 2018) because microbiological oxidation transformed CH4 into CO2, the latter increasing the concentration in the oxidative layers, as other authors have found [4,17,21].
At the biowindows surface, CH4 and CO2 specific fluxes resulted on average 14.9 ± 18.9 and 15.9 ± 7 Nl/m2h, respectively. Consequently, the overall average LFG flux resulted 30.9 Nl/m2h. In Figure 3 the trends of biowindows concentrations as a function of depth are reported for the four sampling days. The trend was similar to the biofilter with two main differences. First, oxygen was not detected in depth, in contrast to the biofilter, where a certain percentage of oxygen was guaranteed by the regulation of the extraction system, which in the case of passive ventilation cannot be ensured. Second, the standard deviations shown in Figure 3 were due to the three different biowindows analyzed, so a certain variability between concentrations was observed.
The compositions of emitted LFG, in terms of class, at the biofilter and the biowindows surface are reported in Table 3. The biofilter LFG emissions average composition, in terms of components, is reported in Table A3. The emitted LFG concentrations contained two orders of magnitude less than those found for the raw LFG, listed below in order of chemical contribution: aliphatic compounds > aromatic compounds > oxygenated compounds > halogenated compounds > sulfur compounds > terpenes. Regarding aliphatic compounds, n-butane (49.5 ± 44.1 µg/m3), propylene (55.1 ± 85.7 µg/m3) and cyclohexane (41.1 ± 20.3 µg/m3) were the most present compounds with a 67% coverage on the class, decreasing by two orders of magnitude. Regarding aromatic compounds, m,p,o-xylene (15.6 ± 7.5 µg/m3), (m(+)p)-xylene (9.3 ± 4.7 µg/m3) and toluene (4.4 ± 1.5 µg/m3) together represented 43% of the class. Acetone (36.4 ± 57.1 µg/m3) and ethanol (4.1 ± 2.8 µg/m3) accounted for 60% of the oxygenated class, decreasing by two orders of magnitude. Trichloromethane (4.6 ± 0.4 µg/m3) and dichlorodifluoromethane (6.6 ± 4.2 µg/m3) accounted for 54% of the class of halogenated compounds. The prevailing sulfur compound was dimethyl sulfide (5.3 ± 6.7 µg/m3), while hydrogen sulfide was absent. The prevailing terpenes (100%) were limonene and beta-pinene with concentrations of 33 ± 53.1 µg/m3 and 2.9 ± 1.7 µg/m3, respectively.
The biowindows LFG emissions average composition, in terms of components, is reported in Table A4. Similar considerations can be made for the emitted LFG of biowindows. In general, emission concentrations were two orders of magnitude lower than for raw LFG. The prevailing compounds were oxygenated compounds, where isopropanol was 544.5 ± 820.3 µg/m3.
Through the dynamic accumulation chamber, the emissions from the surface of the biofiltration systems in terms of flows have been measured, as shown in Table 4. Biofilter-specific VOC flux emissions and biowindows-specific NMVOC flux emissions are reported in the Appendix B in Table A5 and Table A6, respectively. Consistently with the concentrations detected, for the biofilter, aliphatic compounds were the prevalent ones, while for the biowindows oxygenated compounds were highest. In general, NMVOC species measured in the composite LFG were also identified in the chambers, as other authors have shown [4,5,6,17].
It should be noted that NMVOCs are also emitted naturally from soil surfaces by either soil bacteria or plants. Fukui and Doskey [5] investigated the air–surface exchange of NMVOCs at a grassland site. The average emission rates of isoprene from grassland vegetation were 4.3*10−5 g/m2d, which is similar to the isoprene fluxes measured in the biofiltration systems. Fukui and Doskey [5] found no significant air–surface exchange of aliphatic compounds, which they based on similarities of the concentrations of alkanes (propane, n-butane, n-pentane, n-hexane) in the ambient air and the installed chambers. The average emission rates of 1 propane, n-butane, n-pentane and n-hexane were less than 2.4*10−5 g/m2d, which is comparable to the alkene fluxes from the biofiltration systems. On the basis of these results, it cannot be excluded that surface emissions of isoprene and light aliphatic compounds can be affected from natural sources.
The results of dynamic olfactometry showed an average OC at the biofilter surface of 146.1 ± 64.6 uoE/Nm3, while the OC at the biowindows surface was on average 87.1 ± 51.3 uoE/Nm3. Moreover, the SOAVs of the LFG emitted by the biofilter and biowindows are 16.1 ± 20.6 uoE/m3 and 14.2 ± 16.5 uoE/m3, respectively (Table 5); given the large standard deviations, the values detected by dynamic olfactometry and SOAV were comparable. The contribution of SOAV, like raw LFG, was almost exclusively provided by sulfur compounds, although more than two orders of magnitude less. Some authors have previously investigated the relationship between OAV and OC. Capelli et al. (2013) [38] demonstrated that OC was better correlated to SOAV than to chemical concentrations. Wu et al. (2017) [39] observed strong linear correlations between OC and SOAV (r = 0.95) during the assessment of landfill gas emission. In this case, the Pearson correlation analysis for the biofilter showed a good linear correlation between OC and SOAV (r = +0.74, n = 10, p < 0.05), while for the biowindows it resulted in a stronger linear correlation, resulting in a Pearson coefficient r = +0.85 (n = 11, p < 0.05). The results agree with those reported by Capelli et al. (2013) (r = 0.83) [38], while they are slightly under those found by Wu et al. (2017) [39] (r = 0.95) in a study concerning the correlation between calculated and measured odorous concentration of odorous gases from a landfill in Beijing. However, our linear correlation coefficients at the biofilter and biowindows (r = 0.74 and r = 0.83), are both higher than those reported by Wenjing et al. (2015) (r = 0.39) [43], thus showing a good linear correlation between the OC evaluated by dynamic olfactometry and the calculated odor contentration, SOAV.

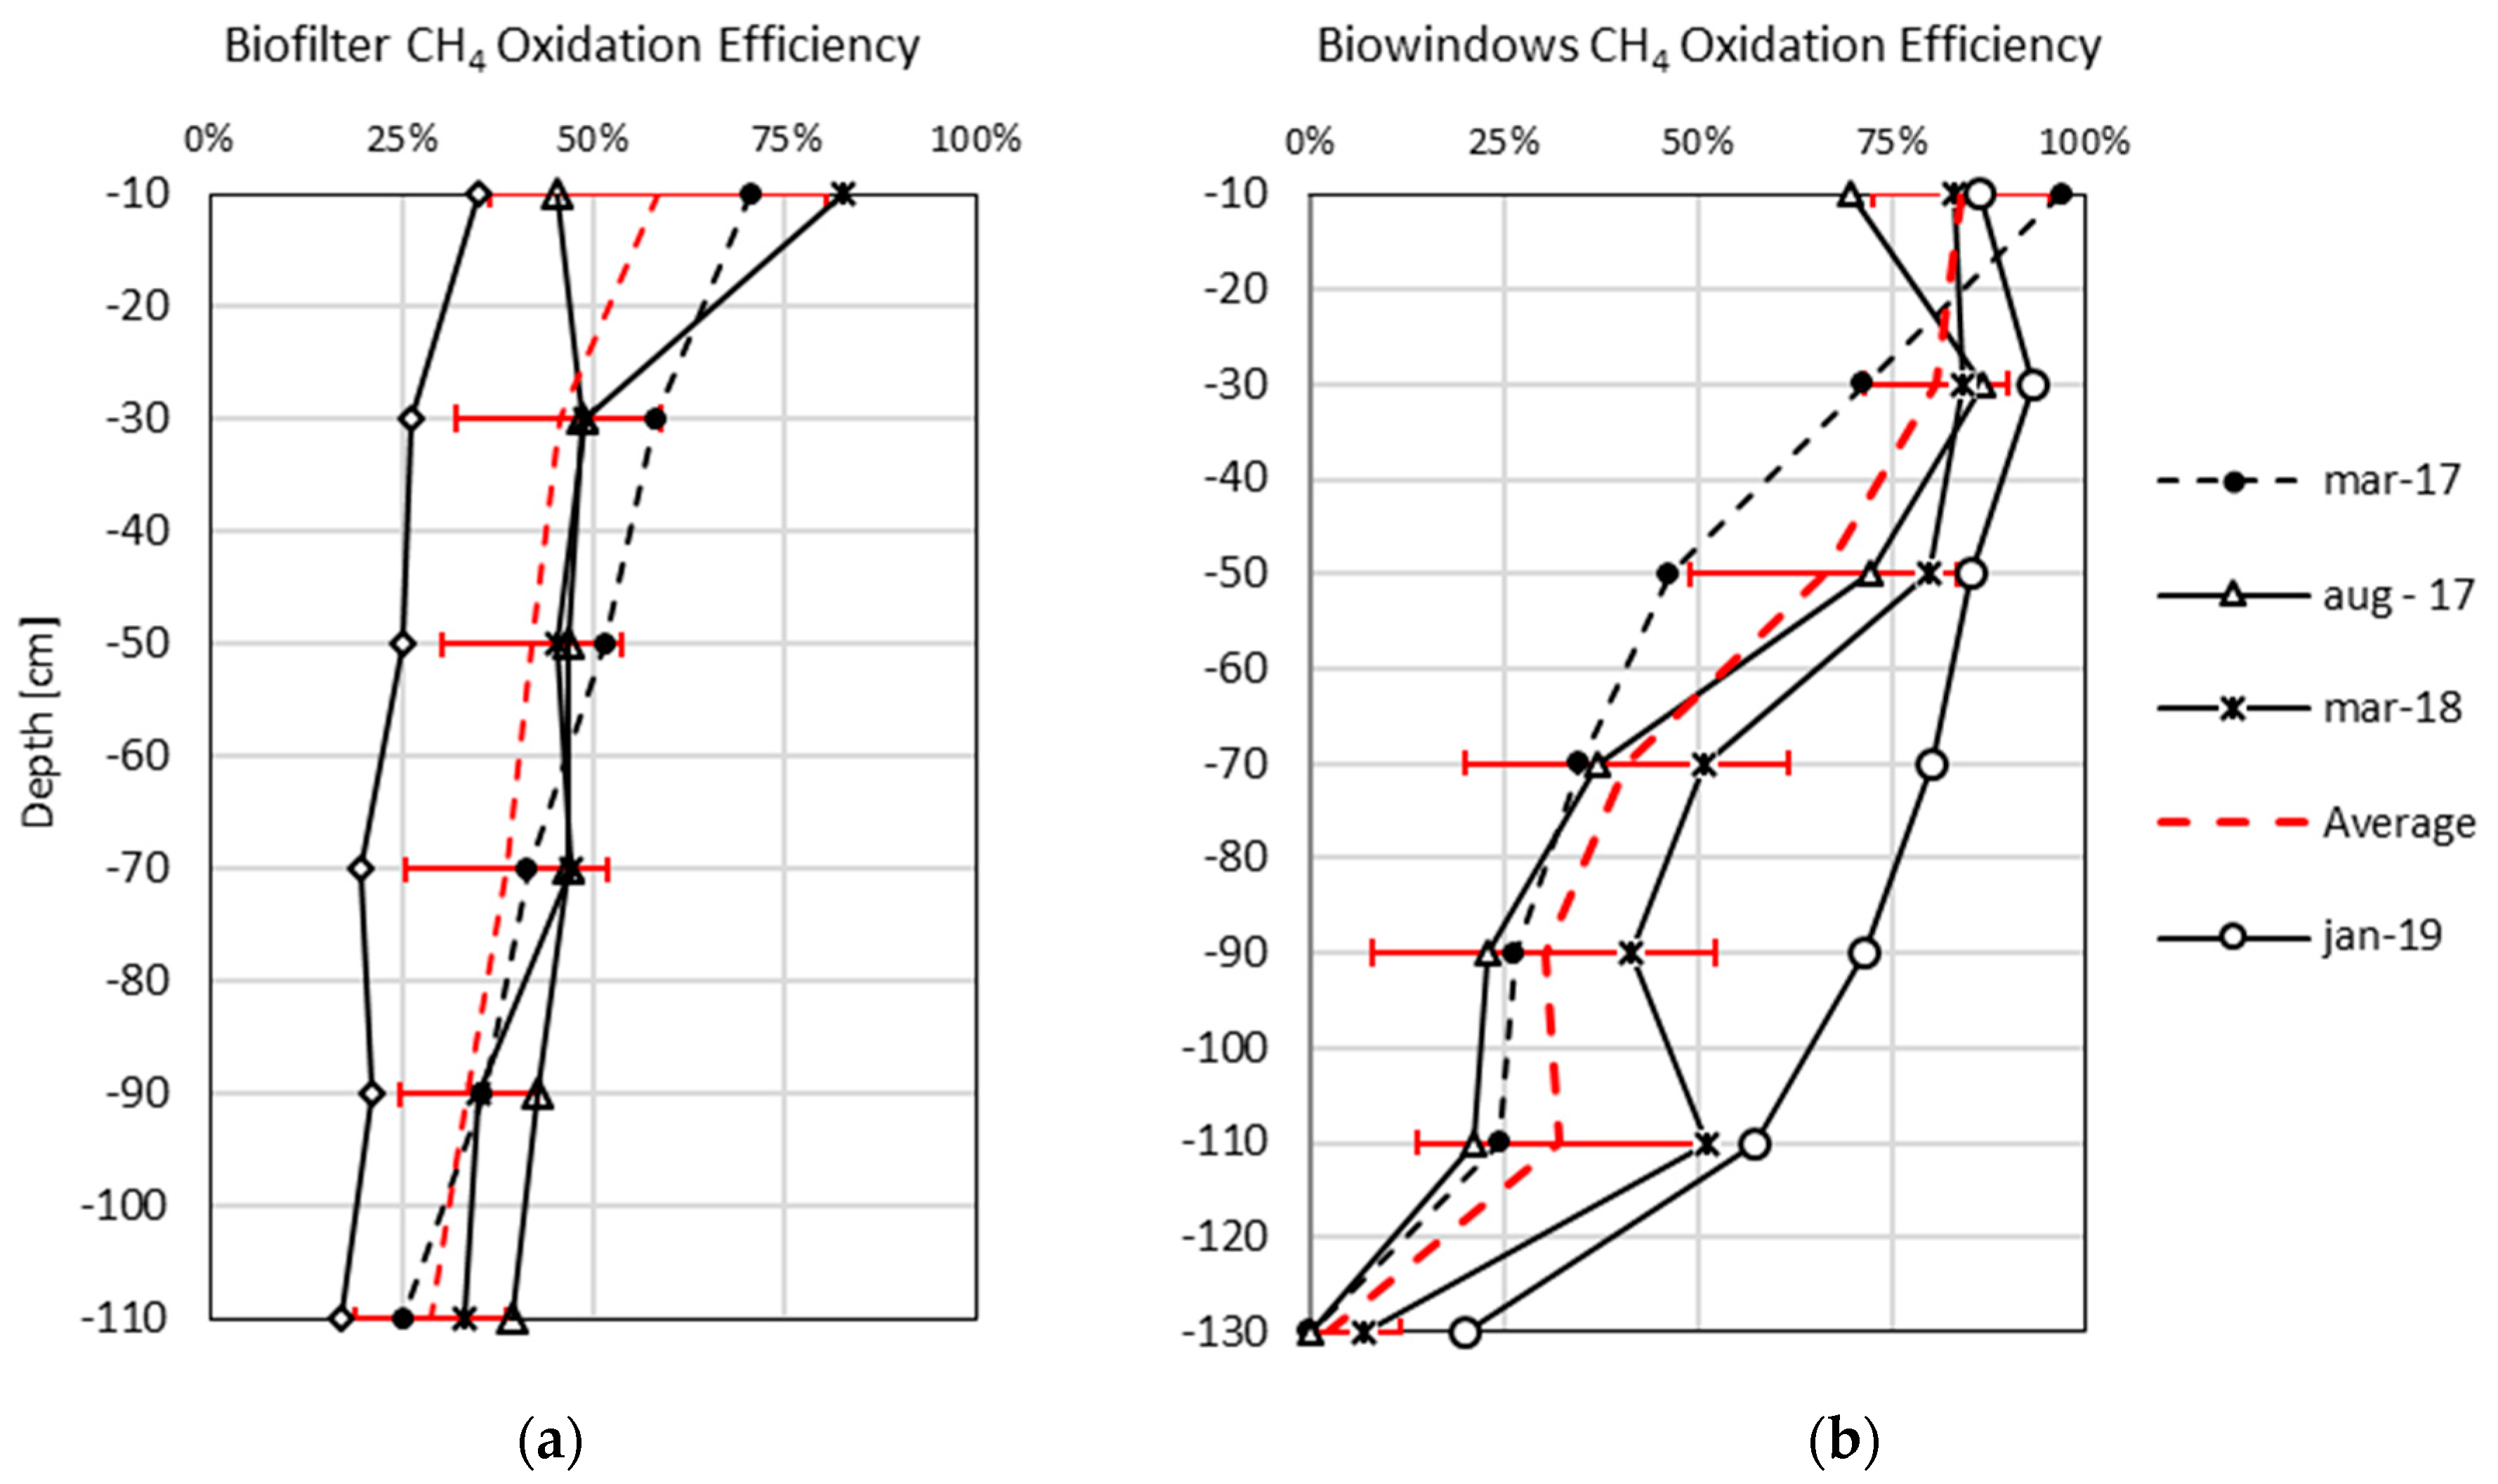
3.3. Performance Efficiency

Figure 4 shows CH4 oxidation efficiency of biofilter and biowindows. The oxidation efficiency has a different trend between biofilter and biowindows.
In the biofilter the presence of LFG oxygen at the inlet makes the aerobic methanotrophic bacterial flora active even in the deep layers, and in fact at a depth of 110 cm an oxidation efficiency of 30% was detected. The oxidation efficiency with decreasing depth goes from 30% to 60% due to the high entry of atmospheric oxygen into the pores of the filter bed in the surface layers. As confirmed by some authors, O2 is important for the oxidation of CH4, and a few studies have investigated actively aerated biofilters (mainly as lab-scale column tests), some with separate air injection at multiple levels [44] and some with CH4 and ambient air or O2 mixed in the inlet, thereby simulating diluted LFG [18,22,45,46]. Therefore, according to Scheutz et al. (2009) [47], an oxygen concentration of less than 1% causes a total inhibition of the methanotrophic bacterial flora, while values between 1%–3% cause a reduced biological oxidation activity in methane. Gebert et al. (2011) [22] stated that the maximum oxidation rates of methane are reached between 3% and 20% oxygen.
The overall biofilter CH4 oxidation efficiency was 58.1 ± 46.5% (n = 20), with an average CH4 load of 10.9 ± 3.5 gCH4/m2h and an average oxidation rate of 5.7 ± 2.3 gCH4/m2h. Regarding the specific NMVOCs monitoring campaigns, biofilter CH4 oxidation efficiency resulted 57.8 ± 21.9% (n = 4), with an average CH4 load of 9.01 ± 1.01 gCH4/m2h and an average oxidation rate of 5.1 ± 1.9 gCH4/m2h. These results are confirmed by the graph shown in Figure 5, where oxidation efficiency and CH4 load monitored during the four NMVOCs measurement campaigns are displayed. The trend line that approximates the data is logarithmic (R2 = 0.71), which defines the oxidation efficiency trend; for example, to guarantee an oxidation efficiency of 80%, the CH4 load must be less than 6.5 gCH4/m2h with an oxidation rate of 5.2 gCH4/m2h, or to guarantee an oxidation efficiency of 70%, the CH4 load must be less than 9.3 with an oxidation rate of 6.5 gCH4/m2h. This result is also confirmed by the findings of Dever et al. (2010) [48] which stated that the performance of a passive biofilter can decline once the landfill gas loading exceeds 20 Nl/m2h and the methane loading exceeds 5 gCH4/m2h.
In biowindows the absence of oxygen in the deep layers affects the oxidation efficiency. Between 110 and 90 cm depth, the biological oxidation was about 30% while between 30 and 10 cm it was about 80%. The trend is comparable with the results found by other authors [31,34,35,49,50]. The overall biowindows CH4 oxidation efficiency was 88.05 ± 7.9% (n = 20). Focusing on the four specific NMVOCs monitoring surveys, CH4 oxidation efficiency reached a value of 84 ± 11.3%, showing a similar trend during the overall monitoring period.
In terms of the RE of the volatile compounds classes, it is observed that it was always 80% higher for both biofilter and biowindows. The lowest value was recorded for oxygenated compounds while all other compounds had RE values higher than 92.45% for biowindows and 94.24% for biofilter (Table 6). Sulfur compounds had the highest RE value of 99.03% for biofilter and 98.88% for biowindows. These results are confirmed by Lee et al. (2018) [3], which showed a great performance (98.8–99.1%) and concluded that biocovers had significantly high removal performances during all seasons.
In terms of ORE, the results confirmed the high percentages found for the RE, as shown in Table 7.
The odor concentration for a single substance OAV and for the entire air sample SOAV is used to assess the odor contribution of individual compounds or chemical categories. SOAV odor Reduction efficiency in the biofilter was 99.84% while in biowindows it was 93.82%. In the biofilter, the lowest OAV is found for aromatic compounds, while in biowindows halogenated compounds have the lowest value.
The SOAV values found in this study and the related ORE are reasonably comparable with those found by Jung et al. (2019) [19]; in fact, the overall average complex odor removal efficiency was 97%. The average SOAV of the biowindow inlet gas was 15,805 uoE/m3, with a range of 6393–27,128 uoE/m3. By contrast, the average SOAV of the gas emitted from the biowindow surface was 1586 uoE/m3, with a range of 297–4526 uoE/m3. The results achieved by the biofiltration systems are similar to those found by Lee et al. (2018) [3], ranging between 95.4–99%, and Capanema et al., (2014) [12], showing a removal efficiency close to 100% even with a grate variability of odor inlet load.

4. Conclusions

This work analyzed and compared two full-scale biofiltration systems: biofilter and biowindows. The emission mitigation of methane, non-methane volatile organic compounds (NMVOCs) and odors during a two-year management and monitoring period was studied. In addition to diluted methane, more than 50 NMVOCs have been detected in the raw landfill gas entering both biofiltration systems, and the sulfur compounds have the highest odor activity value. Both systems, biofilter and biowindows, were effective for the oxidation of methane (58.1% and 88.05%, respectively) and the mitigation of NMVOCs (higher than 80%) and odors (99.84% and 93.82%, respectively). Oxidation efficiencies increase as a function of the oxygen concentration in both systems. Regarding the biofilter, it was possible to define the oxidation efficiency trend, and in fact in order to guarantee an oxidation efficiency of 80%, the CH4 load must be less than 6.5 gCH4/m2h with an oxidation rate of 5.2 gCH4/m2h. An evaluation of the output odor activity values confirmed that dimethyl sulfide and hydrogen sulfide were the most malodorous components in the odorous gases from the biofiltration systems. Moreover, the correlation between the odor concentration and the sum of the odor activity value resulted in a relatively higher correlation coefficient for both biofilter (r = 0.74) and biowindows (r = 0.85).
In conclusion, biofilters are valid systems for the treatment of diluted landfill gas in the presence of an active landfill gas extraction system, while biowindows, in the absence of active extraction, are effective for treating passive emissions when carried out in the vicinity of a gravel drainage system.
Future studies could focus on the seasonal trend of emissions as a function of weather conditions in order to deepen the variation of reduction efficiency. Particular attention could also be given to optimizing the input methane load so as to maximize oxidation efficiency.

Author Contributions

Conceptualization, I.P. and E.R.; methodology, I.P.; software, I.P. and E.R.; validation, I.P., E.R. and R.I.; formal analysis, I.P.; investigation, I.P. and E.R.; resources, I.P.; data curation, I.P. and E.R.; writing—original draft preparation, I.P. and E.R.; writing—review and editing, I.P., E.R. and R.I.; visualization, I.P.; supervision, I.P.; project administration, I.P.; funding acquisition, I.P. All authors have read and agreed to the published version of the manuscript.

Funding

This research was funded by the EU LIFE Program “LIFE RE Mida-LIFE14 CCM/IT/000464”.

Acknowledgments

The authors would like to thank Donata Bacchi, Riccardo Bacci, Francesco Baldi, Elena Albini and Niccolò Frasi for their help during the field sampling. The authors would like to thank CSAI S.p.A. and Sienambiente S.p.A. for hospitality and availability during sampling.

Conflicts of Interest

The authors declare no conflict of interest.

Appendix A

Sites Description

The study focuses on two landfill sites located in Tuscany (Italy): Podere il Pero landfill that is situated in the province of Arezzo, and Le Fornaci di Monticiano that is situated in the province of Siena.
Podere il Pero landfill is a post-closure landfill for non-hazardous and municipal solid waste (MSW) that was in the operational phase from 1994 until March 2014. The final authorized capacity is 631,000 m3 and approximately 660,000 tons of waste were disposed of at the landfill. The predominant waste types are soil fill, household refuse and sludge from wastewater treatment plants. An active extraction system made of 44 vertical wells, eight leachate wells and a network of pipes connected to six points for suction controls LFG gas emissions. An average LFG flow rate of 128 m3/h is collected and then burnt in a flare as imposed by the European Union Landfill Directive [30]. LFG composition is on average 32.8% v/v CH4 and 28.7% v/v CO2. Between 2012–2016, average surface LFG emissions from Podere il Pero accounted for 2.67 ± 2.28 Nl/m2h, while after the installation of the active biofilter (period 2016–2018), average LFG emission decreased to 0.65 ± 0.2 Nl/m2h.
Le Fornaci di Monticiano landfill is an old landfill of MSW and consists of two sections. The older one was in the operational phase between the 1980s and the 1990s, while the more recent section was active between 1996 and 2001. Concerning the older part, there is no reliable information, while in the recent part about 29,300 tons of MSW waste have been disposed of. At the plant, LFG is managed through a passive system (no extraction blower is present). In particular, the passive venting involves 15 vertical wells equipped with riser pipes surrounded by a gravel pack. Each well supports little flares with manual ignition. It was not directly possible to measure the LFG production, but applying a LFG production model, a gas production of almost 10 Nm3/h was estimated. The average composition of the LFG was 25.8% v/v CH4, 15% v/v CO2 and 12.8% v/v O2. In 2016, surface LFG emissions accounted for 0.66 ± 0.35 Nl/m2h.
The characterization of the study sites showed a low quality and quantity of LFG produced. Consequently, the produced gas in the studied landfills is a low calorific value LFG as defined in the guidelines developed by the Ireland Environmental Protection Agency [31]. For this reason, two different biofiltration systems were applied to treat LFG and to mitigate LFG emissions. Both techniques are described in detail in the following section.

Appendix B

Table A1. Biofilter raw LFG average composition, OT and OAV for each compound (n = 4).
ClassCompoundMean Concentration [µg/m³]SDOT [µg/m³]
(Wu et al., 2017)
OAV [uoE/m3]SD
Aliphatic compoundsCyclohexane745.0152.0
n-Butane1652.5928.5
Isoctane23.522.0
n-Heptane76.238.9
n-Hexane109.345.6
Propylene1661.5994.4
n-Nonane126.076.1369400.00.0
n-Pentane400.5229.5
Isoprene12.114.5
2-Methylpentane163.054.6
3-Methylpentane166.536.2
Aromatic CompoundsBenzene62.828.786240.00.0
4-Ethyltoluene23.223.9
m-Xylene281.0141.516100.10.1
(m+p)-Xylene443.8322.4
p-Xylene281.0141.5
m,p,o-Xylene685.0340.0
Ethylbenzene144.399.72500.60.4
1,2,4-Trimethylbenzene58.532.6
Ethenylbenzene (Styrene)27.119.51100.20.2
Toluene347.8259.633650.10.1
1,3,5-Trimethylbenzene40.519.628900.00.0
Isopropylbenzene36.421.1
o-Xylene108.063.232840.00.0
n-Propyl benzene29.220.2
n-Butylbenzene17.413.3
sec-Butylbenzene27.123.7
ter-Butylbenzene25.316.1
Oxygenated CompoundsEthanol116.9190.936620.00.0
Isopropanol24.222.5
Methanol78.7100.9
n-Butanol44.529.6
2-propanone (Acetone)215.8233.0481360.00.0
Methyl Ketone19.711.7
Methyl Isobutyl Ketone22.817.9
Methyl-ter-Butyl ether17.019.1
Sulfur CompoundsDimethyl sulphide16.67.60.2859.427.2
Hydrogen Sulfide3762.51842.60.428979.74397.7
Ethylmercaptan13.818.0
2-Propanethiol (Isopropyl mercaptan)106.889.9
2-Butanethiol (sec-butyl mercaptan)37.038.3
Tiophene23.114.1
Halogenated CompoundsTrichloromethane26.620.0176240.00.0
cis-1,2-Dichloroethene84.352.4
Dichlorodifluoromethane (CFC-12)419.0345.0
1,2-dichloro-1,1,2,2-Tetrafluoroethane48.048.3
trans-1,2-Dichloroethene23.317.3
Tetrachloroethylene30.833.4284170.10.1
Tetrahydrofuran57.061.4
Vinyl Chloride532.0464.6
Terpenesalpha-Pinene (+)2394.84035.441820.20.4
beta-Pinene (+)66.298.2
Limonene916.01515.82557.12.0
NitrogenousAmmonia1800522.836510.35.0
Table A2. Biowindows raw LFG average composition, OT and OAV for each compound (n = 12).
ClassCompoundMean
[µg/m3]
SDOT [µg/m3]
(Wu et al., 2017)
OAV [uoE/m3]SD
Aliphatic compoundsCyclohexane1228.71253.8
n-Butane2274.03847.1
Isoctane24.925.4
n-Heptane251.8311.0
n-Hexane190.6183.1
Propylene1600.73008.9
n-Nonane291.8428.9369400.00.0
n-Pentane516.5657.4
Isoprene)13.714.8
2-Methylpentane222.9216.2
3-Methylpentane215.5191.6
Aromatic compoundsBenzene169.8142.186240.00.0
4-Ethyltoluene23.722.9
m-Xylene255.4354.316100.20.2
(m(+)p)-Xylene501.5716.3
p-Xylene248.2360.4
m,p,o-Xylene628.7910.2
Ethylbenzene222.7311.72500.91.2
1,2,4-Trimethylbenzene58.566.0
Ethenylbenzene (Styrene)40.734.81100.40.3
Toluene429.5564.933650.10.2
1,3,5-Trimethylbenzene57.935.628900.00.0
Isopropylbenzene53.549.8
o-Xylene163.9168.332840.00.0
n-Propyl benzene27.721.8
sec-Butylbenzene49.066.7
ter-Butylbenzene14.514.0
Oxygenated compoundsEthanol112.4198.036620.00.1
Isopropanol28.524.8
Methanol55.862.7
n-Butanol87.081.8
2-propanone (Acetone)206.8254.3481360.00.0
Methyl Ketone53.575.9
Vinyl Acetate15.516.7
Methyl Methacrylate28.623.1
Propyl Acetate21.515.1
Acroleina40.157.5
2-Methoxy-2-methylpropane
(Methyl tert-butyl ether (MTBE))
23.816.2
Sulfur compounds1-Butanethiol (n-butilmercaptan)16.915.8
Dimethyl Sulfide29.030.70.28103.5109.5
Hydrogen Sulfide7955.27181.40.4218986.217139.3
Ethanethiol (ethylmercaptan)17.311.1
2-Propanethiol (Isopropyl mercaptan)60.448.1
Methyl Mercaptan49.169.5
1-Propanethiol16.911.2
2-Butanethiol (sec-butyl mercaptan)48.333.8
ter-butyl mercaptan17.514.4
Tiophene15.414.0
Nitrogenous Acetonitrile25.237.1
Halogenated compoundschlorobenzene72.557.8
Trichloromethane (TCM)58.491.6176240.00.0
cis-1,2-Dichloroethene272.7366.1
1,4-dichlorobenzene29.328.1
Dichlorodifluoromethane (CFC-12)1030.11869.7
1,1-dichloroethane19.619.3
1,2 dichloropropane40.736.3
1,1-dichloroethane20.616.9
1,2-dichloro-1,1,2,2-Tetrafluoroethane68.057.3
3-chloro-1-Propene19.115.1
2-chlorotolueneE25.723.8
trans-1,2-Dichloroethene39.533.0
hexachlorobutadiene71.558.2
dichloromethane19.116.0
tetrachlorothene33.231.0284170.00.0
Tetrahydrofuran26.919.0
trichloroethene32.724.8
1,2,4-trichlorobenzene34.533.3
trichlorofluoromethane73.5120.7
Vinyl Chloride696.1813.5
Terpenesalpha-Pinene (+)936.71474.641820.20.4
beta-Pinene (+)283.0534.4
Limonene1132.22226.42554.48.7
Table A3. Biofilter LFG emissions average composition, OT and OAV for each compound (n = 12).
ClassCompoundMean
[µg/m3]
SDOT [µg/m3]
(Wu et al., 2017)
OAV [uoE/m3]SD
Aliphatic compoundCyclohexane32.524.1
n-Butane37.843.0
2,2,4-Trimethylpentane (Isooctane)4.21.8
n-Heptane5.44.4
n-Hexane9.33.8
Propylene42.674.3
n-Pentane26.721.3
2-Methyl-1,3-butadiene (Isoprene)5.01.4
2-Methylpentane7.33.3
3-Methylpentane7.42.6
Aromatic compoundBenzene4.61.086240.00.0
m-Xylene5.11.916100.00.0
(m(+)p)-Xylene8.04.6
p-Xylene4.92.0
m,p,o-Xylene51.472.0
Ethylbenzene6.81.62500.00.0
1,2,4-Trimethylbenzene5.81.5
Ethenylbenzene (Styrene)5.31.31100.00.0
Toluene4.71.333650.00.0
o-Xylene5.83.232840.00.0
Oxygenated compoundsEthanol71.6135.036620.00.0
Isopropanol3.31.4
Methanol5.21.6
2-propanone (Acetone)28.649.2
Methyl Ketone4.74.2
Vinyl Acetate6.58.3
methyl prop-2-enoate (Methyl acrylate)6.59.5
n-Butyl acetate2.70.5
Isobutyl Acetate1.10.3
Sulfur compoundCarbon Sulfide8.00.135510.00.0
n-butylmercaptan1.02.1
Diethyl Sulfide2.95.8
Dimthyl Sulfide4.55.70.2815.920.3
Isobutyl mercaptan11.519.7
1-propanethiol2.81.0
Thiophene3.51.5
NitrogenousAcetonitrile1.02.1
Halogenated compoundsTrichloromethane (TCM)5.31.5
cis-1,2-dichloroethylene23.843.5
Dichlorodifluoromethane (CFC-12)5.73.8
1,2-dichloro-1,1,2,2-Tetrafluoroethane3.01.4
1,1,2,2-tetrachloroethene (tetrachloroethylene)3.82.1
Chloromethane (MCM)13.922.5176240.00.0
1,1,1,2-tetrachloroethane4.45.5284170.00.0
1,2,3-trichloropropane4.25.0
A,A,A,-trichlorotoluene3.22.0
Terpenesalfa-Pinene (+)2.91.441820.00.0
Limonene25.545.92550.10.2
Table A4. Biowindows LFG emissions average composition, OT and OAV (n = 12).
ClassCompoundMean
[µg/m3]
SDOT [µg/m3]
(Wu et al., 2017)
OAV [uoE/m3]SD
Aliphatic compoundsCyclohexane13.735.0
n-Butane32.650.9
2,2,4-Trimethylpentane (Isooctane)2.80.2
n-Heptane3.84.4
n-Hexane3.75.1
Propylene233.0600.0
n-Nonane3.20.2369400.00.0
n-Pentane8.915.0
2-Methylpentane5.14.8
3-Methylpentane6.86.9
Aromatic compoundm-Xylene11.08.616100.00.0
(m(+)p)-Xylene18.216.7
p-Xylene11.08.6
m,p,o-Xylene26.225.1
Ethylbenzene5.04.82500.00.0
1,2,4-Trimethylbenzene7.98.1
Ethenylbenzene (Styrene)3.73.51100.00.0
Toluene5.94.733650.00.0
1,3,5-Trimethylbenzene3.51.3
o-Xylene7.16.832840.00.0
n-Propyl benzene3.31.2
Oxygentaed compoundsEthanol4.03.236620.00.0
Isopropanol544.5820.3
Methanol12.212.5
2-propanone (Acetone)2.10.4
Methyl Ketone5.14.2
Vinyl Acetate4.46.3
Acetaldehyde2.83.5
Propyl Acetate2.00.8
Halogenated compoundsDimethyl Sulfide4.76.70.2814.016.5
Hydrogen Sulfide82.8165.50.42197.5395.0
chlorobenzene2.80.360830.00.0
Trichloromethane (TCM)3.10.6176240.00.0
Dichlorodifluoromethane (CFC-12)4.63.4
tetrachlorothene4.00.2284170.00.0
Vinyl Chloride2.21.1
1,3- dichlorobenzene5.83.0
Terpenesalpha-Pinene (+)2.21.141820.00.0
beta-Pinene (+)16.914.2
Table A5. Biofilter specific compound flux emissions (n = 12).
ClassCompoundUnitMeanSD
Aliphatic compoundsCyclohexaneµg/m2h43.834.7
n-Butaneµg/m2h52.560.1
n-Heptaneµg/m2h5.41.8
Isooctaneµg/m2h7.26.3
n-Hexaneµg/m2h12.25.7
Propyleneµg/m2h58.9103.5
n-Pentaneµg/m2h35.730.3
2-Methyl-1,3-butadiene (Isoprene)µg/m2h6.51.8
2-Methylpentaneµg/m2h9.54.5
3-Methylpentaneµg/m2h9.62.9
Aromatic compoundBenzeneµg/m2h6.11.4
m-Xyleneµg/m2h6.62.7
(m(+)p)-Xyleneµg/m2h10.56.3
p-Xyleneµg/m2h6.42.8
m,p,o-Xyleneµg/m2h65.791.2
Ethylbenzeneµg/m2h8.71.9
1,2,4-Trimethylbenzeneµg/m2h7.62.2
Styreneµg/m2h6.81.3
Tolueneµg/m2h6.12.0
o-Xyleneµg/m2h7.43.8
Oxygentaed compoundsEthanolµg/m2h91.2171.2
Isopropanolµg/m2h4.32.2
Methanolµg/m2h6.82.6
2-propanone (Acetone)µg/m2h68.568.5
Methyl Ketoneµg/m2h5.35.3
Vinyl Acetateµg/m2h8.310.5
methyl acrylateµg/m2h8.913.3
n-butyl acetateµg/m2h3.60.9
isobutyl acetateµg/m2h1.40.5
Sulfur Compounds Carbon Sulfideµg/m2h10.50.9
n-butylmercaptanµg/m2h1.32.6
Diethyl Sulfideµg/m2h3.77.4
Dimthyl Sulfideµg/m2h6.18.0
Isobutyl mercaptanµg/m2h14.625.0
1-propanethiolµg/m2h3.71.4
Thiopheneµg/m2h4.51.9
Nitrogenous Acetonitrileµg/m2h1.32.6
Halogenated compoundsTrichloromethane (TCM)µg/m2h6.91.9
cis-1,2-dichloroethyleneµg/m2h30.355.2
Dichlorodifluoromethane (CFC-12)µg/m2h7.85.6
1,2-dichloro-1,1,2,2-Tetrafluoroethaneµg/m2h4.02.0
1,1,2,2-tetrachloroethene (tetrachloroethylene)µg/m2h4.82.3
Chloromethane (MCM)µg/m2h17.828.6
1,1,1,2-tetrachloroethaneµg/m2h5.66.9
1,2,3-trichloropropaneµg/m2h5.46.4
A,A,A,-trichlorotolueneµg/m2h4.12.6
Terpenesalfa-Pinene (+)µg/m2h3.82.0
Limoneneµg/m2h35.264.0
Table A6. Biowindow specific compound flux emissions (n = 12).
ClassCompoundUnit[µg/m3]SD
Aliphatic compoundsCyclohexaneµg/m2h19.822.7
n-Butaneµg/m2h39.131.6
Isooctaneµg/m2h3.60.3
n-heptaneµg/m2h4.63.0
n-Hexaneµg/m2h4.73.4
Propyleneµg/m2h238.1435.1
n-nonaneµg/m2h4.10.4
n-Pentaneµg/m2h10.38.7
2-Methylpentaneµg/m2h5.22.6
3-Methylpentaneµg/m2h6.85.5
Aromatic compoundBenzeneµg/m2h4.02.7
m-Xyleneµg/m2h9.43.5
(m(+)p)-Xyleneµg/m2h18.66.9
p-Xyleneµg/m2h9.43.5
m,p,o-Xyleneµg/m2h23.810.6
Ethylbenzeneµg/m2h5.31.7
1,2,4-Trimethylbenzeneµg/m2h8.34.3
Styreneµg/m2h4.31.7
Tolueneµg/m2h6.73.6
1,3,5-trimethylbenzeneµg/m2h4.40.3
o-Xyleneµg/m2h7.53.0
n-propilbenzeneµg/m2h4.10.4
Oxygentaed compoundsEthanolµg/m2h4.23.2
Isopropanolµg/m2h537.7646.4
Methanolµg/m2h12.412.3
Isobutanolµg/m2h2.70.4
Methyl-ter-butyl etherµg/m2h4.23.2
Acetaldehydeµg/m2h3.32.3
Acetoneµg/m2h37.954.5
Methyl ethyl Ketonµg/m2h5.32.6
Halogenated compoundsVinyl Chlorideµg/m2h3.00.9
Trichloromethane (TCM)µg/m2h3.90.4
Dichlorodifluoromethane (CFC-12)µg/m2h5.42.1
Chlorobenzeneµg/m2h3.70.4
Tetrachlorothyleneµg/m2h5.30.5
1,3-dichlorobenzeneµg/m2h6.62.1
SulfurDimethyl Sulfideµg/m2h5.26.0
Hydrogen Sulfideµg/m2h127.063.5
Terpenesalfa-pineneµg/m2h2.80.8
limoneneµg/m2h17.216.5

References

  1. Stolaroff, J.K.; Bhattacharyya, S.; Smith, C.A.; Bourcier, W.L.; Cameron-Smith, P.J.; Aines, R.D. Review of methane mitigation technologies with application to rapid release of methane from the arctic. Environ. Sci. Technol. 2012, 46, 6455–6469. [Google Scholar] [CrossRef] [PubMed]
  2. Lombardi, L.; Carnevale, E.A.; Pecorini, I. Experimental evaluation of two different types of reactors for CO2 removal from gaseous stream by bottom ash accelerated carbonation. Waste Manag. 2016, 58, 287–298. [Google Scholar] [CrossRef] [PubMed]
  3. Lee, Y.-Y.; Jung, H.; Ryu, H.-W.; Oh, K.-C.; Jeon, J.-M.; Cho, K.-S. Seasonal characteristics of odor and methane mitigation and the bacterial community dynamics in an on-site biocover at a sanitary landfill. Waste Manag. 2018, 71, 277–286. [Google Scholar] [CrossRef] [PubMed]
  4. Scheutz, C.; Bogner, J.; Chanton, J.P.; Blake, D.; Morcet, M.; Aran, C.; Kjeldsen, P. Atmospheric emissions and attenuation of non-methane organic compounds in cover soils at a French landfill. Waste Manag. 2008, 28, 1892–1908. [Google Scholar] [CrossRef] [Green Version]
  5. Bogner, J.; Chanton, J.; Blake, D.; Morcet, M.; Kjeldsen, P. Comparative oxidation and net emissions of methane and selected non-methane organic compounds in landfill cover soils. Environ. Sci. Technol. 2003, 37, 5150–5158. [Google Scholar] [CrossRef]
  6. Rossi, E.; Frasi, N.; Pecorini, I.; Ferrara, G. Methane oxidation efficiency and NMVOCs reduction in a full-scale passive bioifltration system for the treatment of residual landfill gas. Procedia Environ. Sci. Eng. Manag. 2018, 5, 147–152. [Google Scholar]
  7. Liu, Y.; Lu, W.; Li, D.; Guo, H.; Caicedo, L.; Wang, C.; Xu, S.; Wang, H. Estimation of volatile compounds emission rates from the working face of a large anaerobic landfill in China using a wind tunnel system. Atmos. Environ. 2015, 111, 213–221. [Google Scholar] [CrossRef]
  8. Winberry, W.T.; Murphy, N.T.; Riggin, R.M. Compendium of Methods for the Determination of Toxic Organic Compounds in Ambient Air. Available online: https://www.epa.gov/amtic/compendium-methods-determination-toxic-organic-compounds-ambient-air (accessed on 12 March 2020).
  9. Bogner, J.E.; Chanton, J.P.; Blake, D.; Abichou, T.; Powelson, D. Effectiveness of a florida landfill biocover for reduction of CH4 and NMHC emissions. Environ. Sci. Technol. 2010, 44, 1197–1203. [Google Scholar] [CrossRef]
  10. Pecorini, I.; Baldi, F.; Bacchi, D.; Carnevale, E.A.; Corti, A. Leaching behaviour of hazardous waste under the impact of different ambient conditions. Waste Manag. 2017, 63, 96–106. [Google Scholar] [CrossRef]
  11. Rossi, E.; Pecorini, I.; Iannelli, R. Methane Oxidation of Residual Landfill Gas in a Full-Scale Biofilter: Human Health Risk Assessment of Volatile and Malodours Compound Emissions; Springer: Berlin, Germany, 2020. [Google Scholar] [CrossRef]
  12. Bacchi, D.; Bacci, R.; Ferrara, G.; Lombardi, L.; Pecorini, I.; Rossi, E. Life Cycle Assessment (LCA) of Landfill Gas Management: Comparison between Conventional Technologies and Microbial Oxidation Systems. Energy Procedia 2018, 148, 1066–1073. [Google Scholar] [CrossRef]
  13. Huber-Humer, M.; Röder, S.; Lechner, P. Approaches to assess biocover performance on landfills. Waste Manag. 2009, 29, 2092–2104. [Google Scholar] [CrossRef] [PubMed]
  14. Capanema, M.A.; Cabana, H.; Cabral, A.R. Reduction of odours in pilot-scale landfill biocovers. Waste Manag. 2014, 34, 770–779. [Google Scholar] [CrossRef] [PubMed]
  15. Mostafid, M.E.; Shank, C.; Imhoff, P.T.; Yazdani, R. Gas transport properties of compost–woodchip and green waste for landfill biocovers and biofilters. Chem. Eng. J. 2012, 191, 314–325. [Google Scholar] [CrossRef]
  16. Rossi, E.; Pecorini, I.; Iannelli, R. Risk assessment of a methane oxidizing biofilter for reducing landfill gas emissions from a post-closure landfill. Procedia Environ. Sci. Eng. Manag. 2019, 6, 209–219. [Google Scholar]
  17. Pecorini, I.; Bacchi, D.; Ferrara, G.; Rossi, E.; Caselli, R.L.; Zipoli, L.; Menghetti, F. Biofiltration prototyes for methane oxidation in landfill aftercare and abatement Of NMVOCs and odorous compounds. Procedia Environ. Sci. Eng. Manag. 2017, 4, 173–181. [Google Scholar]
  18. Cassini, F.; Scheutz, C.; Skov, B.H.; Mou, Z.; Kjeldsen, P. Mitigation of methane emissions in a pilot-scale biocover system at the AV Miljø Landfill, Denmark: 1. System design and gas distribution. Waste Manag. 2017, 63, 213–225. [Google Scholar] [CrossRef] [Green Version]
  19. Jung, H.; Oh, K.-C.; Ryu, H.-W.; Jeon, J.-M.; Cho, K.-S. Simultaneous mitigation of methane and odors in a biowindow using a pipe network. Waste Manag. 2019, 100, 45–56. [Google Scholar] [CrossRef]
  20. Kim, H.; Townsend, T.G. Wet landfill decomposition rate determination using methane yield results for excavated waste samples. Waste Manag. 2012, 32, 1427–1433. [Google Scholar] [CrossRef]
  21. Scheutz, C.; Cassini, F.; De Schoenmaeker, J.; Kjeldsen, P. Mitigation of methane emissions in a pilot-scale biocover system at the AV Miljø Landfill, Denmark: 2. Methane oxidation. Waste Manag. 2017, 63, 203–212. [Google Scholar] [CrossRef] [Green Version]
  22. Gebert, J.; Röwer, I.U.; Scharff, H.; Roncato, C.D.L.; Cabral, A.R. Can soil gas profiles be used to assess microbial CH4 oxidation in landfill covers? Waste Manag. 2011, 31, 987–994. [Google Scholar] [CrossRef]
  23. Raga, R.; Pivato, A.; Lavagnolo, M.C.; Megido, L.; Cossu, R. Methane oxidation and attenuation of sulphur compounds in landfill top cover systems: Lab-scale tests. J. Environ. Sci. 2018, 65, 317–326. [Google Scholar] [CrossRef] [PubMed]
  24. Lakhouit, A.; Schirmer, W.N.; Johnson, T.R.; Cabana, H.; Cabral, A.R. Evaluation of the efficiency of an experimental biocover to reduce BTEX emissions from landfill biogas. Chemosphere 2014, 97, 98–101. [Google Scholar] [CrossRef] [PubMed]
  25. Lee, E.-H.; Moon, K.-E.; Cho, K.-S. Long-term performance and bacterial community dynamics in biocovers for mitigating methane and malodorous gases. J. Biotechnol. 2017, 242, 1–10. [Google Scholar] [CrossRef]
  26. Barbusinski, K.; Kalemba, K.; Kasperczyk, D.; Urbaniec, K.; Kozik, V. Biological methods for odor—A review. J. Clean. Prod. 2017, 152, 223–241. [Google Scholar] [CrossRef]
  27. Schiavon, M.; Ragazzi, M.; Rada, E.C.; Torretta, V. Air pollution control through biotrickling filters: A review considering operational aspects and expected performance. Crit. Rev. Biotechnol. 2016, 36, 1143–1155. [Google Scholar] [CrossRef] [PubMed]
  28. Rybarczyk, P.; Szulczyński, B.; Gębicki, J.; Hupka, J. Treatment of malodorous air in biotrickling filters: A review. Biochem. Eng. J. 2019, 141, 146–162. [Google Scholar] [CrossRef]
  29. Kjeldsen, P.; Scheutz, C. Landfill gas management by methane oxidation. In Solid Waste Landfilling; Elsevier: Amsterdam, The Netherlands, 2018; pp. 477–497. ISBN 978-0-12-818336-6. [Google Scholar]
  30. EUR-Lex—31999L0031—EN. Available online: https://eur-lex.europa.eu/legal-content/EN/TXT/HTML/?uri=CELEX:31999L0031&from=EN (accessed on 12 March 2020).
  31. Environmental Protection Agency (EPA). Management of Low Levels of Landfill Gas. Available online: http://www.epa.ie/pubs/advice/waste/waste/managementoflowlevelsoflandfillgas.html (accessed on 12 March 2020).
  32. Adani, F.; Ubbiali, C.; Generini, P. The determination of biological stability of composts using the dynamic respiration index: The results of experience after two years. Waste Manag. 2006, 26, 41–48. [Google Scholar] [CrossRef] [PubMed]
  33. Pecorini, I.; Bacchi, D.; Iannelli, R. Biodrying of the light fraction from anaerobic digestion pretreatment in order to increase the total recovery rate. Processes 2020, 8, 276. [Google Scholar] [CrossRef] [Green Version]
  34. Pecorini, I. Sistemi Di Monitoraggio Delle Emissioni Diffuse Di Biogas Di Discarica Per La Ottimizzazione Del Sistema Di Gestione. Ph.D. Thesis, University of Florence, Florence, Italy, 2010. Available online: http://hdl.handle.net/2158/600428 (accessed on 15 March 2020).
  35. Measurement of Gaseous Emission Rates from Land Surfaces Using an Emission Isolation Flux Chamber. User’s Guide. Available online: https://cfpub.epa.gov/si/si_public_record_Report.cfm?Lab=ORD&dirEntryID=51253 (accessed on 12 March 2020).
  36. Baldi, F.; Pecorini, I.; Iannelli, R. Comparison of single-stage and two-stage anaerobic co-digestion of food waste and activated sludge for hydrogen and methane production. Renew. Energy 2019, 143, 1755–1765. [Google Scholar] [CrossRef]
  37. EN 13725:2003. Available online: http://store.uni.com/catalogo/en-13725-2003?josso_back_to=http://store.uni.com/josso-security-check.php&josso_cmd=login_optional&josso_partnerapp_host=store.uni.com (accessed on 14 March 2020).
  38. Capelli, L.; Sironi, S.; Del Rosso, R.; Guillot, J.-M. Measuring odours in the environment vs. dispersion modelling: A review. Atmos. Environ. 2013, 79, 731–743. [Google Scholar] [CrossRef]
  39. Wu, C.; Liu, J.; Zhao, P.; Li, W.; Yan, L.; Piringer, M.; Schauberger, G. Evaluation of the chemical composition and correlation between the calculated and measured odour concentration of odorous gases from a landfill in Beijing, China. Atmos. Environ. 2017, 164, 337–347. [Google Scholar] [CrossRef]
  40. Fjelsted, L.; Scheutz, C.; Christensen, A.G.; Larsen, J.E.; Kjeldsen, P. Biofiltration of diluted landfill gas in an active loaded open-bed compost filter. Waste Manag. 2020, 103, 1–11. [Google Scholar] [CrossRef] [PubMed]
  41. Yun, J.; Jung, H.; Ryu, H.-W.; Oh, K.-C.; Jeon, J.-M.; Cho, K.-S. Odor mitigation and bacterial community dynamics in on-site biocovers at a sanitary landfill in South Korea. Environ. Res. 2018, 166, 516–528. [Google Scholar] [CrossRef] [PubMed]
  42. Eklund, B.; Anderson, E.P.; Walker, B.L.; Burrows, D.B. Characterization of landfill gas composition at the fresh kills municipal solid-waste landfill. Environ. Sci. Technol. 1998, 32, 2233–2237. [Google Scholar] [CrossRef]
  43. Wenjing, L.; Zhenhan, D.; Dong, L.; Jimenez, L.M.C.; Yanjun, L.; Hanwen, G.; Hongtao, W. Characterization of odor emission on the working face of landfill and establishing of odorous compounds index. Waste Manag. 2015, 42, 74–81. [Google Scholar] [CrossRef] [PubMed]
  44. Farrokhzadeh, H.; Hettiaratchi, J.P.A.; Jayasinghe, P.; Kumar, S. Aerated biofilters with multiple-level air injection configurations to enhance biological treatment of methane emissions. Bioresour. Technol. 2017, 239, 219–225. [Google Scholar] [CrossRef]
  45. Haththotuwa, C.K.; Hettiaratchi, J.P.A.; Hunte, C.H. Actively aerated methanobiofilters to control methane emissions from landfills. IJETM 2012, 15, 333. [Google Scholar] [CrossRef]
  46. Thomasen, T.B.; Scheutz, C.; Kjeldsen, P. Treatment of landfill gas with low methane content by biocover systems. Waste Manag. 2019, 84, 29–37. [Google Scholar] [CrossRef]
  47. Scheutz, C.; Kjeldsen, P.; Bogner, J.E.; De Visscher, A.; Gebert, J.; Hilger, H.A.; Huber-Humer, M.; Spokas, K. Microbial methane oxidation processes and technologies for mitigation of landfill gas emissions. Waste Manag. Res. 2009, 27, 409–455. [Google Scholar] [CrossRef]
  48. Dever, S.; Swarbrick, G.E.; Stuetz, R.M. Handbook for the Design, Construction, Operation, Monitoring and Maintenance of a Passive Landfill Gas Drainage and Biofiltration System. Available online: https://www.researchgate.net/publication/239998633_Handbook_for_the_design_construction_operation_monitoring_and_maintenance_of_a_passive_landfill_gas_drainage_and_biofiltration_system (accessed on 20 March 2020).
  49. Wu, B.; Xi, B.; He, X.; Sun, X.; Li, Q.; Ouche, Q.; Zhang, H.; Xue, C. Methane emission reduction enhanced by hydrophobic biochar-modified soil cover. Processes 2020, 8, 162. [Google Scholar] [CrossRef] [Green Version]
  50. Geck, C.; Scharff, H.; Pfeiffer, E.-M.; Gebert, J. Validation of a simple model to predict the performance of methane oxidation systems, using field data from a large scale biocover test field. Waste Manag. 2016, 56, 280–289. [Google Scholar] [CrossRef] [PubMed]
Figure 1. Biofilter (a) and Biowindow (b) sections (non-scale scheme).
Sustainability 12 03203 g001
Figure 2. Biofilter soil gas composition CH4, CO2, O2: (a) March 2017; (b) August 2017; (c) March 2018; (d) January 2019.
Sustainability 12 03203 g002
Figure 3. Biowindows soil gas composition of CH4, CO2 and O2: (a) March 2017; (b) August 2017; (c) March 2018; (d) January 2019.
Sustainability 12 03203 g003
Figure 4. CH4 oxidation efficiency: (a) biofilter; (b) biowindows.
Sustainability 12 03203 g004
Figure 5. Logarithmic trend between CH4 load and Oxidation efficiency in the biofilter.
Sustainability 12 03203 g005
Table 1. Composition of raw landfill gas (LFG) for the biofilter and the biowindows.
ClassBiofilter Concentration [µg/m3]Biowindow Concentration [µg/m3]
MeanSDMeanSD
Aliphatic compounds5136.01799.06831.19002.1
Aromatic Compounds2326.31556.92945.33716.6
Oxygenated Compounds539.6237.3673.4319.7
Sulfur Compounds3959.81865.28226.17261.1
Halogenated Compounds1220.9879.82717.03526.6
Terpenes3966.14059.62352.04231.3
Nitrogenous1800255.8<DL<DL
Table 2. Odor activity value (OAV) of raw LFG for the biofilter and the biowindows.
ClassBiofilter SOAV [uoE/m3]Biowindow Concentration [uoE/m3]
MeanSDMeanSD
Aliphatic compounds0.0 °0.00.0 °0.0
Aromatic Compounds1.10.61.62.0
Oxygenated Compounds0.0 °0.00.0 °0.0
Sulfur Compounds9039.14395.019089.717097.8
Halogenated Compounds0.10.10.0 °0.0
Terpenes4.25.94.79.1
Nitrogenous 4.91.4<DL*<DL*
SOAV9049.34397.119096.017092.3
* Nitrogenous compounds showed a concentration below the detection limit (DL), ° < 0.05 uoE/m3. SOAV: sum of odor activity value.
Table 3. Composition of LFG emitted at the biofilter and the biowindows surface.
ClassBiofilter Concentration [µg/m3]Biowindow Concentration [µg/m3]
MeanSDMeanSD
Aliphatic compounds178.2163.2250.4366.0
Aromatic Compounds102.572.4107.375.4
Oxygenated Compounds130.1141.3465.6586.6
Sulfur Compounds 134.229.186.7163.9
Halogenated Compounds67.377.725.53.7
Terpenes28.347.215.614.6
Nitrogenous<DL<DL<DL<DL
1 H2S showed a concentration below the DL except for the biowindows in January 2019.
Table 4. Flux of LFG emitted at the biofilter and the biowindows surfaces.
ClassBiofilter Flux [µg/m2/h]Biowindow Flux [µg/m2/h]
MeanSDMeanSD
Aliphatic compounds241.2232.4336.3502.6
Aromatic Compounds131.991.2105.845.2
Oxygenated Compounds170.0179.9605.0796.0
Sulfur Compounds 126.612.8132.2251.9
Halogenated Compounds86.698.127.54.5
Terpenes39.065.920.019.6
Nitrogenous <DL<DL<DL<DL
1 Except for the biowindows in January 2019, H2S showed a concentration below DL.
Table 5. Odor activity value (OAV) of emitted LFG for the biofilter and the biowindows.
ClassBiofilter SOAV [uoE/m3]Biowindow SOAV [uoE/m3]
MeanSDMeanSD
Aliphatic compounds<DL<DL<DL<DL
Aromatic Compounds0.10.0 °0.10.0 °
Oxygenated Compounds0.0 °0.0 °0.0 °0.0 °
Sulfur Compounds 15.920.414.016.5
Halogenated Compounds0.0 °0.0 °0.0 °0.0 °
Terpenes0.10.20.10.1
Nitrogenous <DL<DL<DL<DL
SOAV16.120.614.216.5
° < 0.05 uoE/m3.
Table 6. Reduction efficiency (RE%) for the biofilter and the biowindows.
ClassBiofilter RE [%]Biowindow RE [%]
MeanSDMeanSD
Aliphatic compounds95.96%4.60%95.27%6.49%
Aromatic Compounds95.15%3.00%92.45%9.73%
Oxygenated Compounds84.80%24.77%80.71% *30.03% *
Sulfur Compounds99.03%0.68%98.88%1.96%
Halogenated Compounds94.24%6.32%98.63%1.00%
Terpenes99.37%0.92%97.88%2.26%
Nitrogenous 100.00%100.00%<DL<DL
* n = 3.
Table 7. Odor reduction efficiency (ORE) for the biofilter and the biowindows.
ClassBiofilter ORE [%]Biowindow ORE [%]
MeanSDMeanSD
Aliphatic compounds100.00%0.00%96.73%2.07%
Aromatic Compounds91.78%2.77%90.11%9.74%
Oxygenated Compounds97.69% *2.59% *93.33%10.60%
Sulfur Compounds99.84%0.15%93.82%11.91%
Halogenated Compounds93.79%8.02%76.86%21.83%
Terpenes98.41%2.90%83.36%16.29%
Nitrogenous 100.00%0.00%<DL<DL °
SOAV99.84%0.15%93.82%11.91%
* n = 3. ° < 0.05 uoE/m3.

