Article

Simulation and Analyses of the Potential Impacts of Different Particle-Size Dust Aerosols Caused by the Qinghai-Tibet Plateau Desertification on East Asia

1
Hubei Key Laboratory for Heavy Rain Monitoring and Warning Research, Institute of Heavy Rain, China Meteorological Administration, Wuhan 430205, China
2
Collaborative Innovation Center on Forecast and Evaluation of Meteorological Disasters, Key Laboratory for Aerosol-Cloud-Precipitation of China Meteorological Administration, PREMIC, Nanjing University of Information Science &Technology, Nanjing, 210044, China
3
State Key Laboratory of Severe Weather, Key Laboratory of Atmospheric Chemistry of CMA, Chinese Academy of Meteorological Sciences, Beijing 100081, China
*
Author to whom correspondence should be addressed.
Sustainability 2020, 12(8), 3231; https://0-doi-org.brum.beds.ac.uk/10.3390/su12083231
Submission received: 10 February 2020 / Revised: 9 April 2020 / Accepted: 14 April 2020 / Published: 16 April 2020
(This article belongs to the Section Environmental Sustainability and Applications)

Abstract

:
In this paper on the analysis of the vertical distribution of different-diameter dust aerosols and the potential impacts on East Asia, the sensitivity simulation tests of dust aerosols during 2002–03 were conducted by changing the underlying surface on the Qinghai-Tibet Plateau in the global atmospheric circulation model Community Atmosphere Model (CAM) 3.1. The results show that dust aerosol particles in East Asia are mainly distributed in the diameters of 0.64–5.12 μm. The high concentrations of dust aerosols are centered on the surface in the source areas and gradually raised during the eastward transport across East Asia, reaching a height of 4 km at 120° E. The small dust particles with diameters less than 1.28 μm are transported higher and farther driven by the midlatitude westerlies. The Qinghai-Tibet Plateau desertification leads to increasing concentrations of dust aerosols in all size bins and raisesthe transport height of dust aerosols in East Asia. The long-range transport in the East Asian troposphere is dominated by dust aerosols particles of diameters 0.64–2.56 μm, as well as a large contribution of dust aerosols with diameters larger than 1.28 μm.

1. Introduction

Dust aerosol is a major type of natural atmospheric aerosols. The amount of dust aerosol emitted into the atmosphere is estimated up to 1000–3000 Tg every year, accounting for about half of the total tropospheric aerosol amount [1,2,3]. Dust aerosols significantly influence local, even global, ecological environment, as well as influence climate change [4,5,6]. Dust aerosols can directly change the global radiation balance through reflecting, absorbing and scattering the solar short-wave radiation and the ground long-wave radiation. The direct effect of aerosol depends on the scattering and absorption capacities of particles, which are mainly decided by the composition, size and shape of particles. As cloud-condensation nuclei or ice nuclei, dust aerosols can also indirectly change the cloud microphysical structure and the rainfall development. The indirect effect depends on the ability of particles to act as cloud-condensation nuclei or ice nuclei [7], which is mainly decided by the activation height of cloud droplets, the hygroscopicity and the size distribution of particles. Hence, constraining the size distribution of dust aerosols is necessary (albeit insufficient) to limit both the direct and indirect aerosol forcing. In particular, the vertical distribution of dust aerosols can affect the magnitude of both effects [8,9].
As the “roof of the world”, the Earth’s “third pole” [10] and the “world water tower” [11], the Qinghai–Tibet Plateau (referred to as the plateau) has an average altitude of more than 4000 m, covering an area of about 250×104 km2. The plateau is located at middle and upper levels of the troposphere with intense and frequent atmospheric activities [12], providing enough power for dust to enter the atmosphere and travel by a long distance. The large area of shifting sand dunes and desertification land on the plateau also provide sufficient sources for dust storms. According to the investigation results of the “Remote Sensing Investigation and Detection of Eco-Geological Environment on the Qinghai-Tibet Plateau” project carried out by the China Aero Geological Survey and Remote Sensing Center for Land and Resources (AGRS), the desertification area of the plateau exceeded the area sum of the four deserts in northern China in 2003 (the Taklamakan Desert for 33.7×10⁴ km2; the Gurbantünggüt Desert for 48.8×10⁴ km2; the Badain Jaran Desert for 44.3×10⁴ km2; and the Tengger Desert for 42.7×10⁴ km2). Different from the continuous areas of deserts in northern China, the dunes on the plateau are mainly distributed as points, strips and blocks in the central and western parts of the plateau. In the past 40 years, warming of the regional climate, more frequent and intense human activities and rampant activities of rats have exacerbated the freezing and thawing of permafrost in the shallow layer of the plateau, thus forming the frozen and thawed desertification land [13]. At present, the desertification land covers 50.6 × 10⁴ km2, accounting for 19.5% of the total area of the plateau, with a net increase of 0.38 × 10⁴ km2 compared with that in the 1970s. Furthermore, it is predicted that in the next 20–30 years the frozen and thawed desertification will continue developing and aggravating with a significantly increasing severity [14].
At present, the research of dust aerosols is limited in regards to analyses of surface observations and satellite remote sensing data [15,16]. A ground laser radar can get the vertical distribution characteristic of aerosols [17]. It is urgently necessary to simulate and study the plateau desertification and the impacts of dust aerosols with different particle sizes. The existing dust model simply parameterizes many elements, such as the underlying surface of the plateau, so it cannot accurately simulate the dust on the plateau. To understand the effects of dust aerosols and the serious plateau desertification, the dust aerosols in East Asia during 2002–03 were simulated by the global atmospheric circulation model Community Atmosphere Model (CAM) 3.1 in this paper. The underlying surface of the plateau was changed for the sensitivity tests. The vertical distribution characteristics of dust aerosols with different diameters in East Asia were analyzed, and the maximum probable contributions of differently size dust aerosols generated by the plateau desertification to the atmospheric aerosols in East Asia were also discussed.

2. Model Description and Simulation Settings

CAM 3.1 is an advanced atmospheric circulation model jointly developed by the National Center for Atmospheric Research/University Corporation for Atmospheric Research (NCAR/UCAR) as the atmosphere component of the community climate system model 3.0 (CCSM3.0). There are three optional dynamic cores in CAM 3.1: the Eulerian spectral transform method (EUL); the semi-Lagrangian scheme (SLD); and the finite volume approach (FV). The spectrum model CAM3.1 can run simulations in the horizontal spectrum resolutions of triangle truncated wave numbers 85, 63, 42 and 31, naming respectively T85, T63, T42and T31 resolutions. T42 was selected in this paper. In the model, the hybrid σ-P (sigmapressure) vertical coordinate was used. The hybrid σ-P vertical coordinate focused on properties of the vertical derivative of the terrain-following coefficient, which affected the smoothness and shape of layer-thickness profiles and determined the coordinate’s monotonicity over variable terrain [18]. This coordinate can take the functional form η = h p , p s , where p s is the surface pressure and h p , p s is a monotonic function of p , such that there is a one-to-one mapping between p   and η for a given p s . The functional dependence on p s permitsterrain-following coordinates. The standard convention is to define η to be normalized and dimensionless, satisfying the lower- and upper-boundary conditions: h p s , p s = 1 , h p top , p s = 0 , respectively, where p top is the pressure at the top model half-layer. The σ coordinate was used at the surface layer; the σ-P transition coordinate was used in the middle layer; and the pure P coordinate was used in the upper layer. The atmosphere was divided into 26 layers vertically, with the top of about 3.5 hPa.
Five main atmospheric aerosols, including black carbon, organic carbon, sulfate, sea salt and sand dust, were taken into account in the CAM [19,20,21].According to the physical setting of CAM3.1, 12 diameter classes from 0.01 to 40.96mm can be only given to represent the size distribution of soil dust (Table 1).All atmospheric aerosol processes, including dust emission fluxes, concentrations and deposition, were calculated in 12 size bins. A size-distributed soil-dust scheme [22,23,24] in the model was modified and driven with a Chinese soil-texture scheme that inferred the size distribution with 12 categories and up-to-date desert distribution in China [19].Combined data sets for the desert distribution/texture, satellite land-use/roughness length and observed soil moisture provided a coherent input parameter set for the soil-dust emission scheme for deserts in East Asia.
The transport model used the physics package from the Canadian global climate model (GCM) and a semi-Lagrangian and semi-implicit transport scheme for dynamics and passive tracers [25].The CAM3.1involved the main aerosol processes, such as aerosol emission, transport, chemical transformation, dry deposition and wet deposition, and dealt with the interaction between aerosol and cloud precipitation through working with the cloud module of microphysics. The mass conservation equation of aerosol is expressed as follows [26]:
x ip t = x ip t | SOURCES + x ip t | TRANSPORT + x ip t | CLEAR AIR + x ip t | DRY + x ip t | IN CLOUD + x ip t | BELOW CLOUDS
In the equation, x ip is the aerosol mass, in which p   is the variation rate of five different dry-particle mass mixing ratios and i represents the 12 bins of aerosol particle size. Local changes of aerosol mass were determined by the aerosol emission, transport, chemical transformation, wet growth, collision growth, dry deposition, incloud scavenging and wash-out. The advective and convective transport and subgrid turbulent diffusion were considered in the aerosol transport. The emission sources contain both natural and artificial aerosol emissions from the surface to the atmosphere. The chemical transformation produces secondary aerosol particles, and the wet growth and collision growth affect the internal and external mixing of aerosols. During the dry removal, aerosol particles are absorbed by vegetation or subsided to the ground by gravity. The aerosols are also removed by incloud scavenging and wash-out under the cloud caused by cloud precipitation, named as wet removal for aerosols, both resulting in the wet deposition of aerosols.
The Asian monsoon is considered as one of the major components of the atmospheric circulation over the northern hemisphere and the globe [27]. The plateau is important for the Asian monsoon, and the variation of the Asian monsoon can also affect the weather and climate of the plateau [28,29]. Moreover, the Asian monsoon is closely related to dust storms and dust aerosols [30,31]. Therefore, to comprehensively illustrate the general situation, the weak (2002) and strong (2003) South-Asian-monsoon years were chosen to carry out the simulation and analyses in this study. A series of contrast sensitivity experiments were carried out by using the model. Experiment 1 set the global desert distribution as the underlying surface of the model (Figure 1), and the simulation experiment of dust aerosols in 2002–03 was carried out as A1. As there is no available data reflecting the desert distribution of the plateau’s underlying surface, the sensitivity simulation, which changed the land type of the plateau (polygonal frame area in Figure 1) into deserts, was conducted for two years of 2002–03 in the experiment A2, with the properties of the ground soil modified correspondingly (that is, the desert proportion of the region was changed to 1.0). After expanding the plateau desert area, the potential impact in East Asia of dust aerosols with different particle sizes could be studied. In this paper, the average result of simulations in 2002 and 2003 was analyzed based on experiments A1 and A2.

3. Results and Discussion

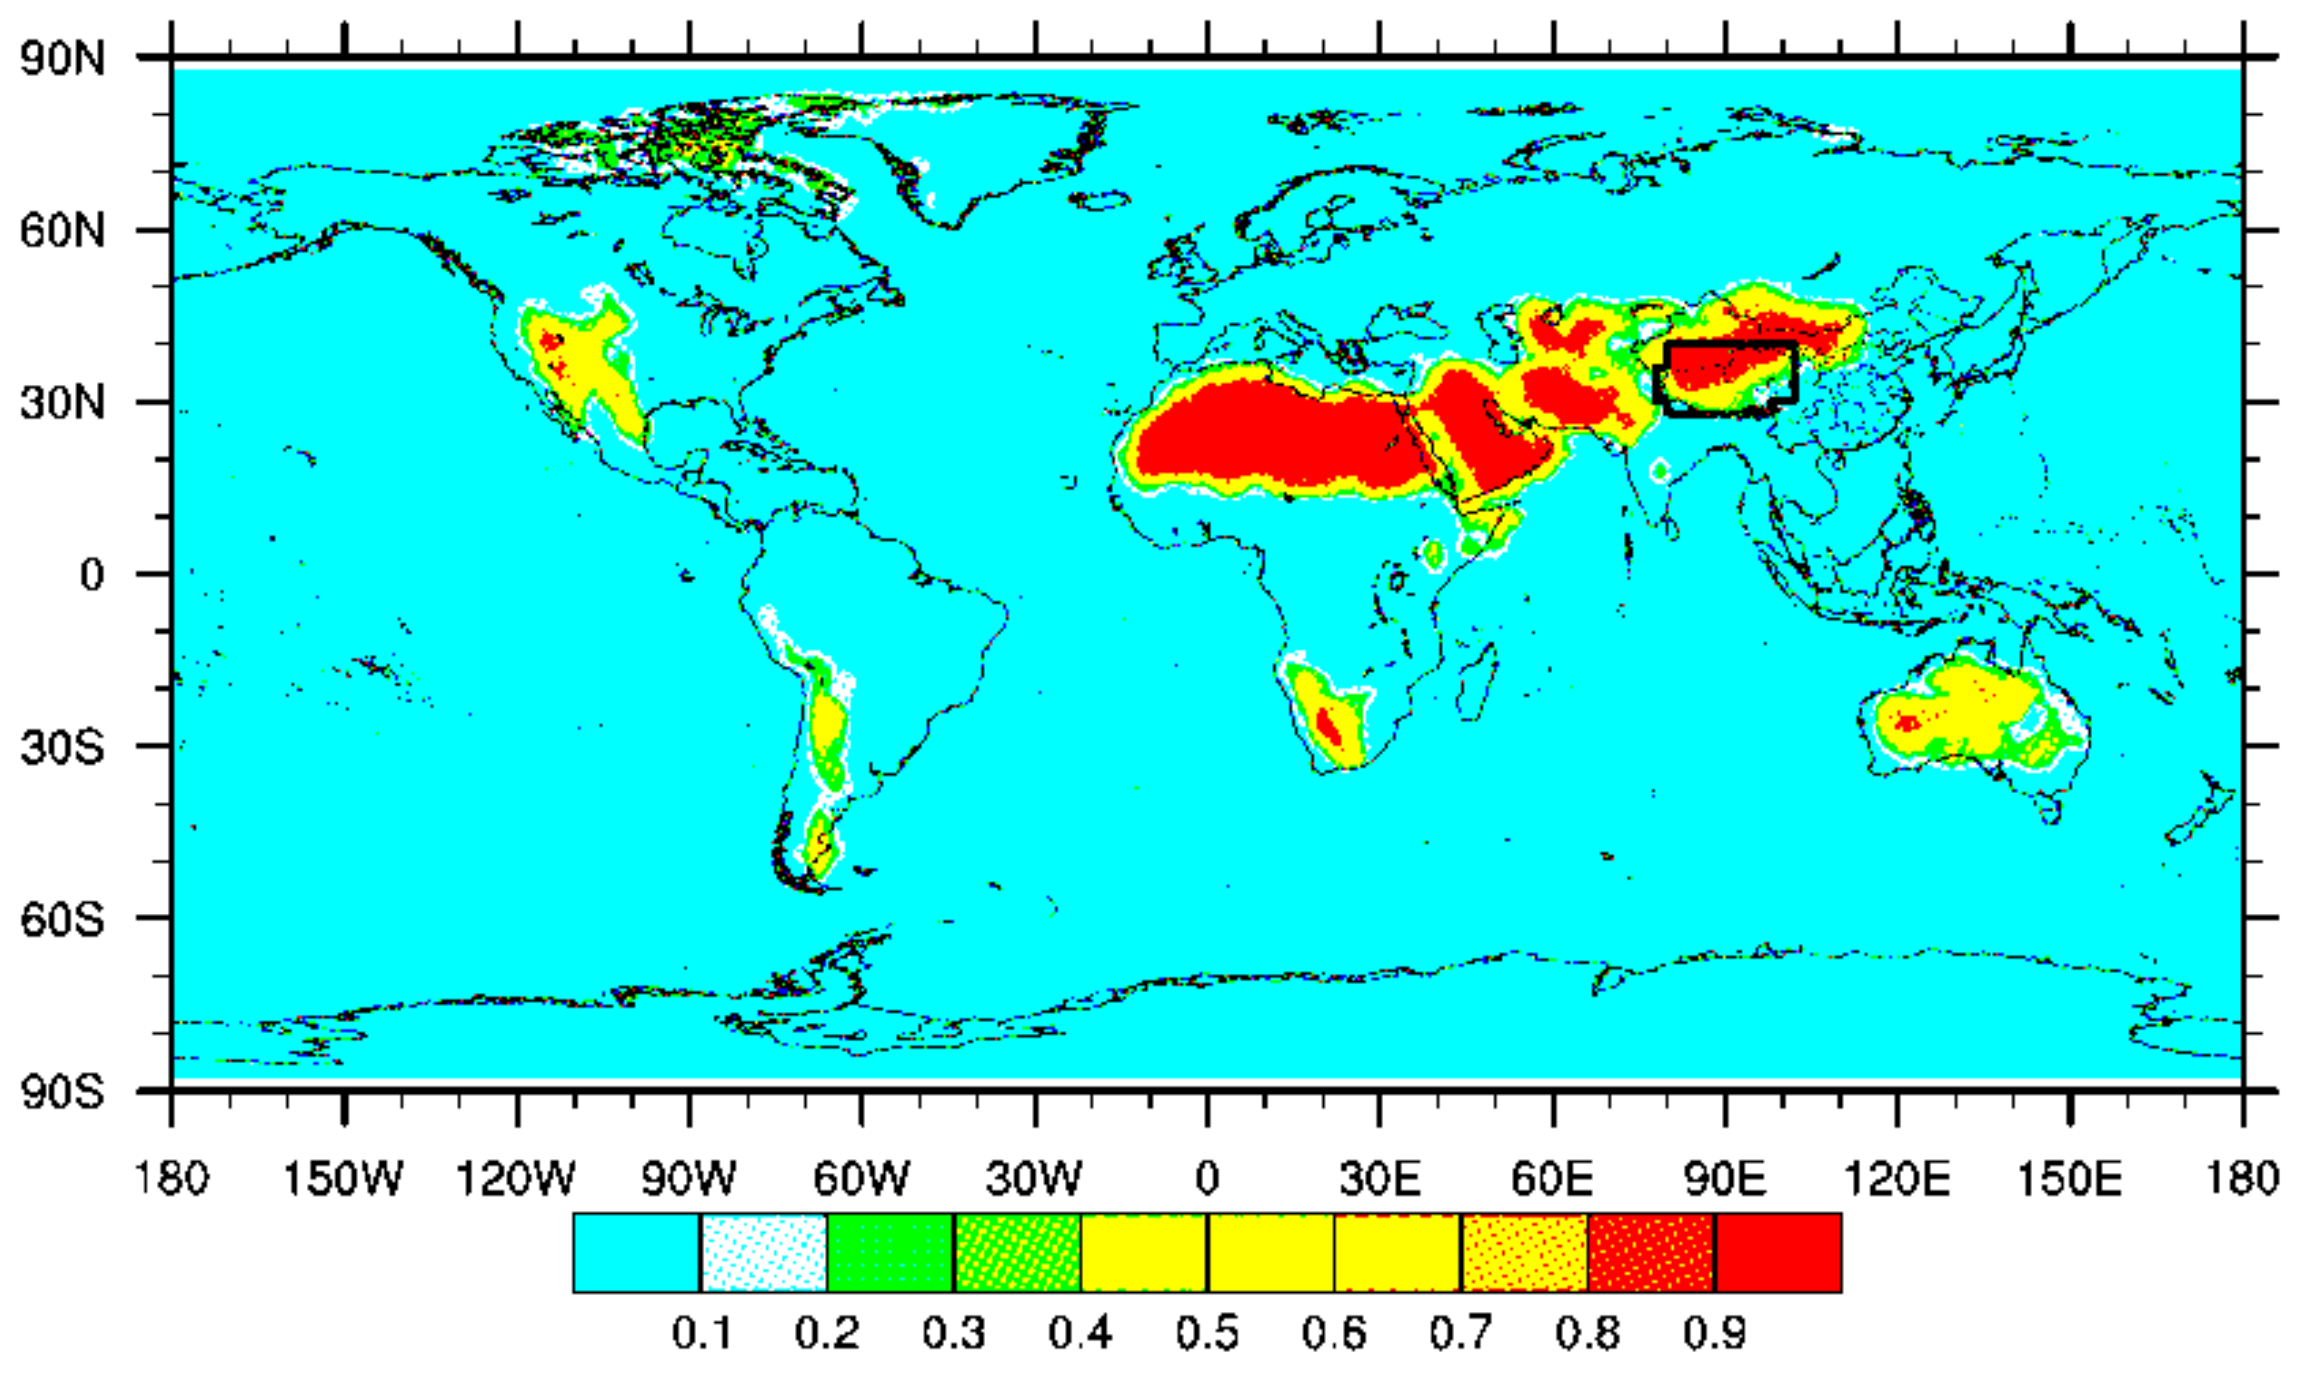
3.1. Dust Aerosol Emission Verification

The annual total emissions simulated by CAM3.1 in the global main region of dust aerosol emission, as well as its proportion to global emissions and its comparison with other simulation results, are shown in Table 2. The results of global and regional dust aerosols during 2002–03 simulated by CAM3.1 are reasonable and can be used for further analyses. However, it should be noted that the simulation results of dust-emission amount from the desert region in North Africa (71%) was slightly more than that in other studies, while that from the desert areas in Central Asia was slightly less (4.5%), which maybe attributed to the two-year simulation with the different resolution of desert areas in this study.

3.2. Simulations and Analyses of the Characteristics of Dust Aerosols with Different Particle Sizes in East Asia

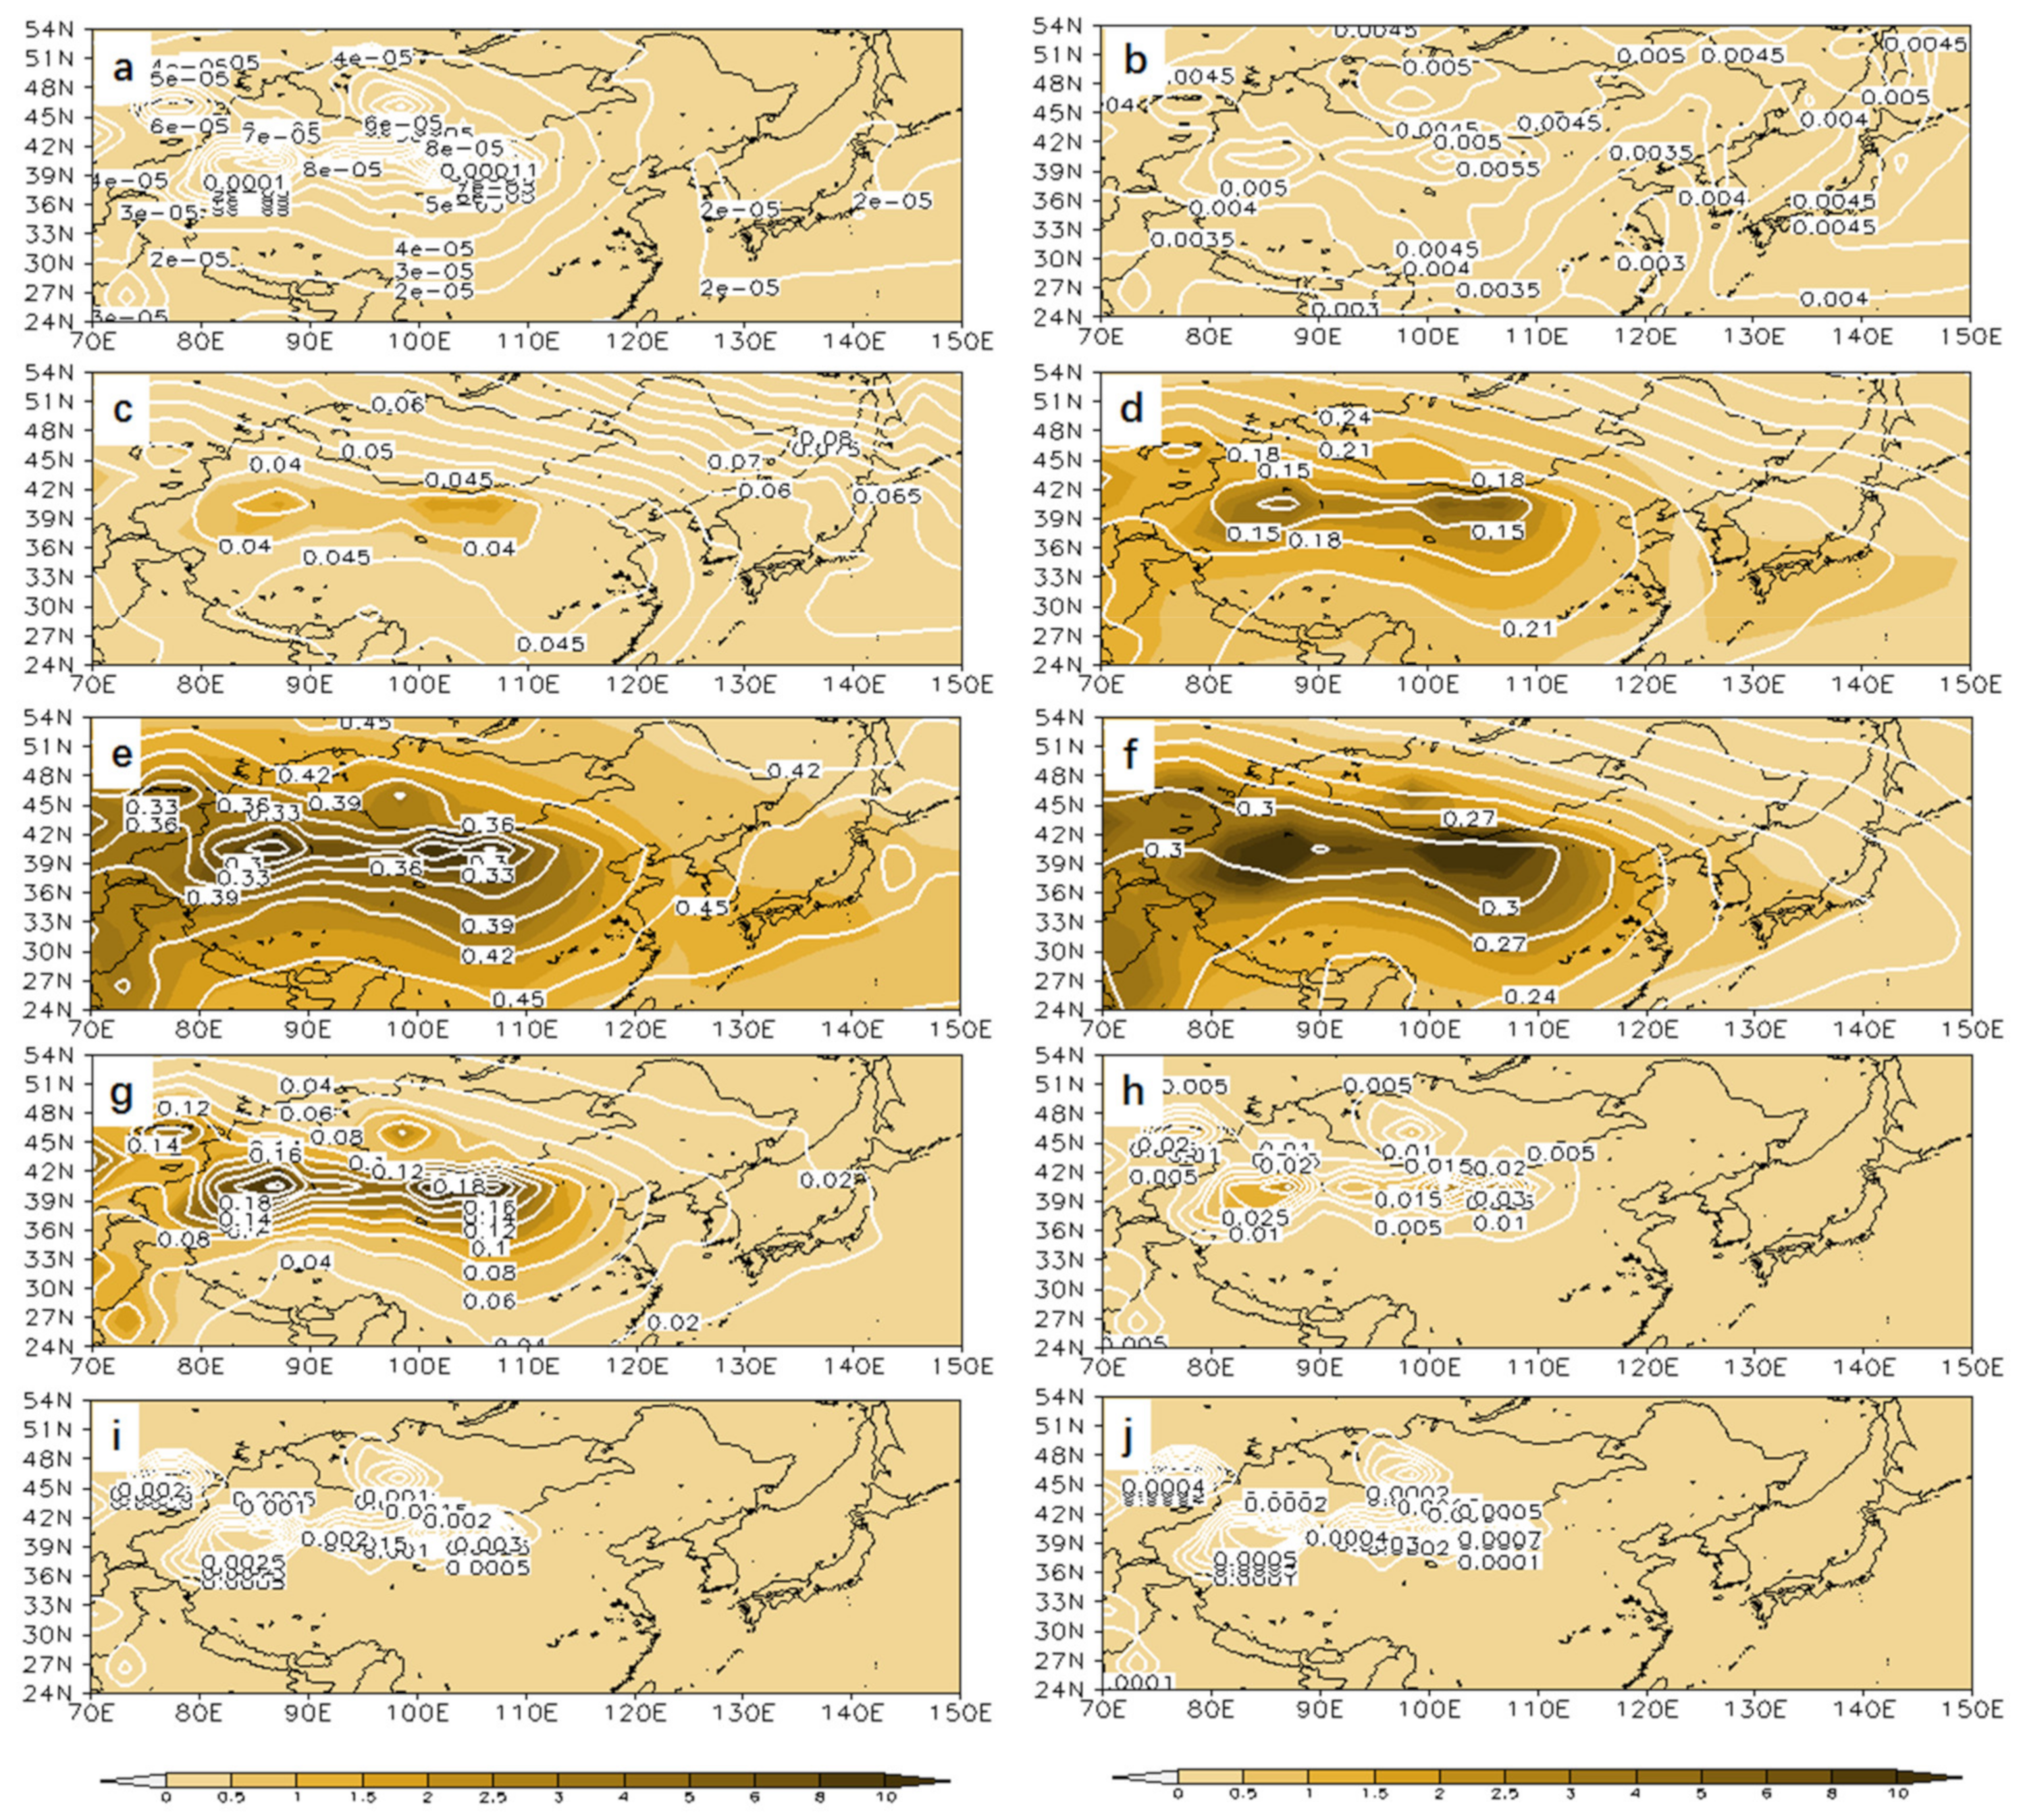
3.2.1. Concentration Distribution of Dust Aerosols with Different Particle Sizes

There were no dust aerosol particles with the diameter of 0.01–0.02 μm or 0.02–0.04 μm. Therefore, the concentration characteristics of the dust aerosols with the diameter of 0.04–40.96 μm are discussed in this paper after being divided into 10 bins. Figure 2 shows the concentration of dust aerosols in each size bin and the distribution of their proportions to the total dust concentration in East Asia. The size bins of 0.04–0.08 μm (Figure 2a), 0.08–0.16 μm (Figure 2b), 10.24–20.48 μm (Figure 2i) and 20.48–40.96 μm (Figure 2j) correspond to the lowest-level surface dust aerosol concentration in East Asia. Their concentrations were all less than 0.5 μg/kg (the unit of mass concentration μg/kg represents the mass of aerosol per kilogram of air) in the source area. Meanwhile the proportions were all below 0.01. Among them, the concentration corresponding to the size bin of 0.04–0.08 μm was the lowest. The diffusion of dust aerosols with the diameter of 0.04–0.08 μm and 0.08–0.16 μm affected the whole East Asia, while those with the diameter of 10.24–20.48 μm and 20.48–40.96 μm concentrated in the source area without diffusion. The concentrations of dust aerosols with the diameter of 0.16–0.32 μm (Figure 2c) and 5.12–10.24 μm (Figure 2h) were the second lowest in East Asia. The proportion of dust aerosols corresponding to the size bin of 0.16–0.32 μm accounted for 0.035–0.04 in the source area, and gradually increased while spreading away from the source area, finally reaching 0.1 at the high latitudes over the Pacific Ocean. The concentration of dust aerosols corresponding to the size bin of 5.12–10.24 μm mainly concentrated in the source area and the surrounding areas, with its proportion decreasing from the maximum of 0.01 in the source area to 0.005 in the surrounding areas. The concentrations of surface dust aerosols with the diameter of 0.32–0.64 μm (Figure 2d) and 2.56–5.12 μm (Figure 2g) corresponded to the second highest in East Asia. The proportion of dust aerosols with the diameter of 0.32–0.64 μm accounted for 0.15 in the source area and increased while spreading away from the source area, while that of 2.56–5.12 μm in the source area accounted for 0.18 and decreased while spreading away from the source area. The concentrations of surface dust aerosols corresponding to the size bins of 0.64–1.28 μm (Figure 2e) and 1.28–2.56 μm (Figure 2f) were the highest in East Asia, and their proportions both accounted for 0.3 in the source area. The one for the size bin of 0.64–1.28 μm increased while spreading away from the source area, while the other decreased.

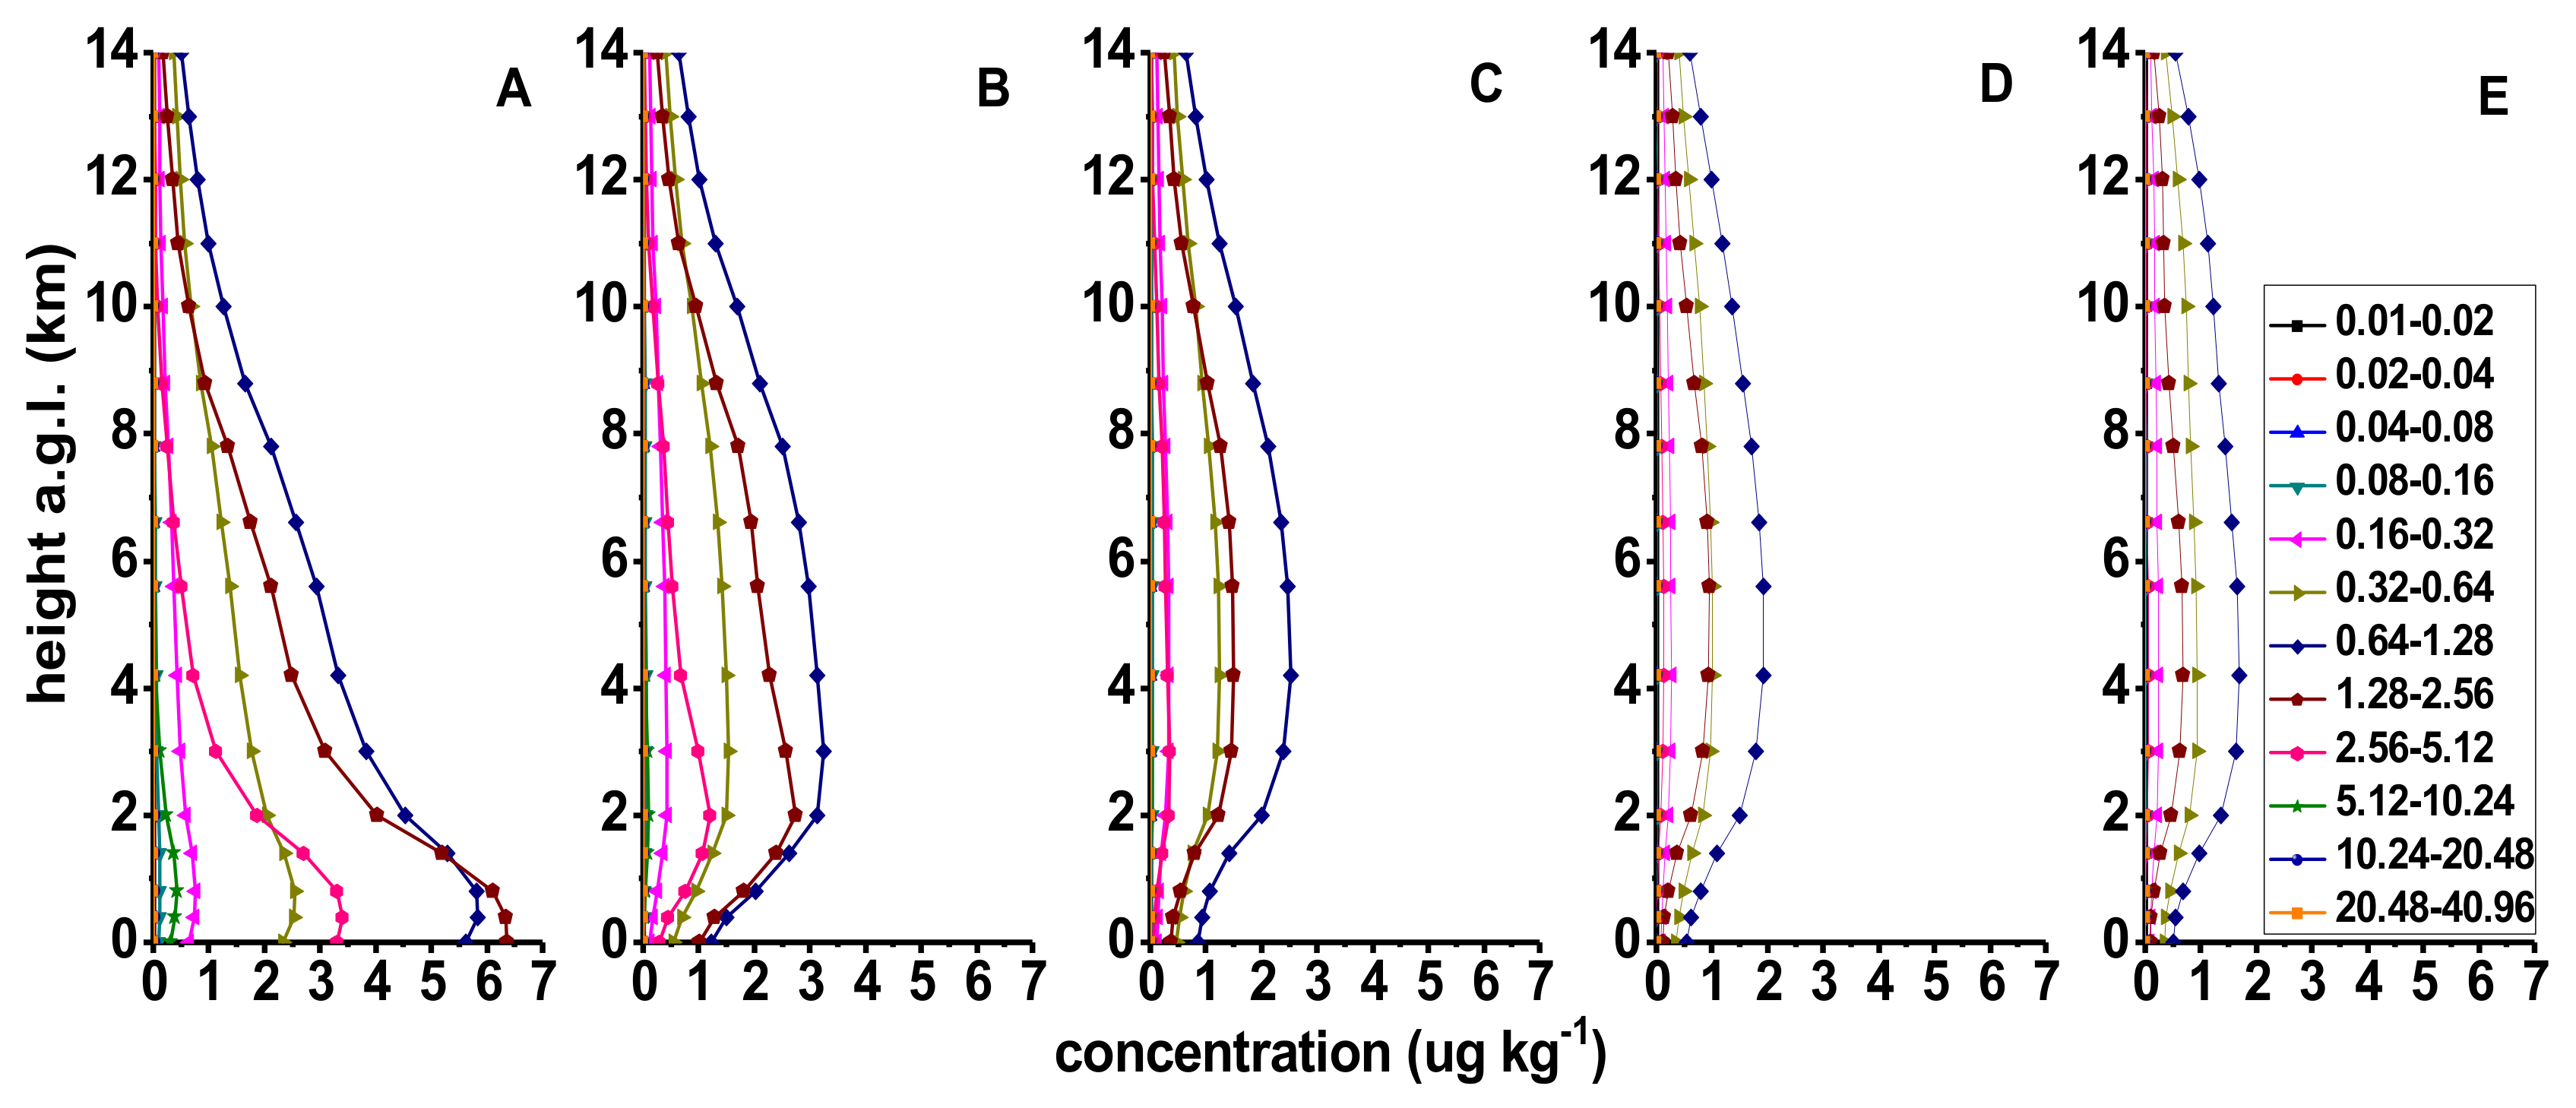
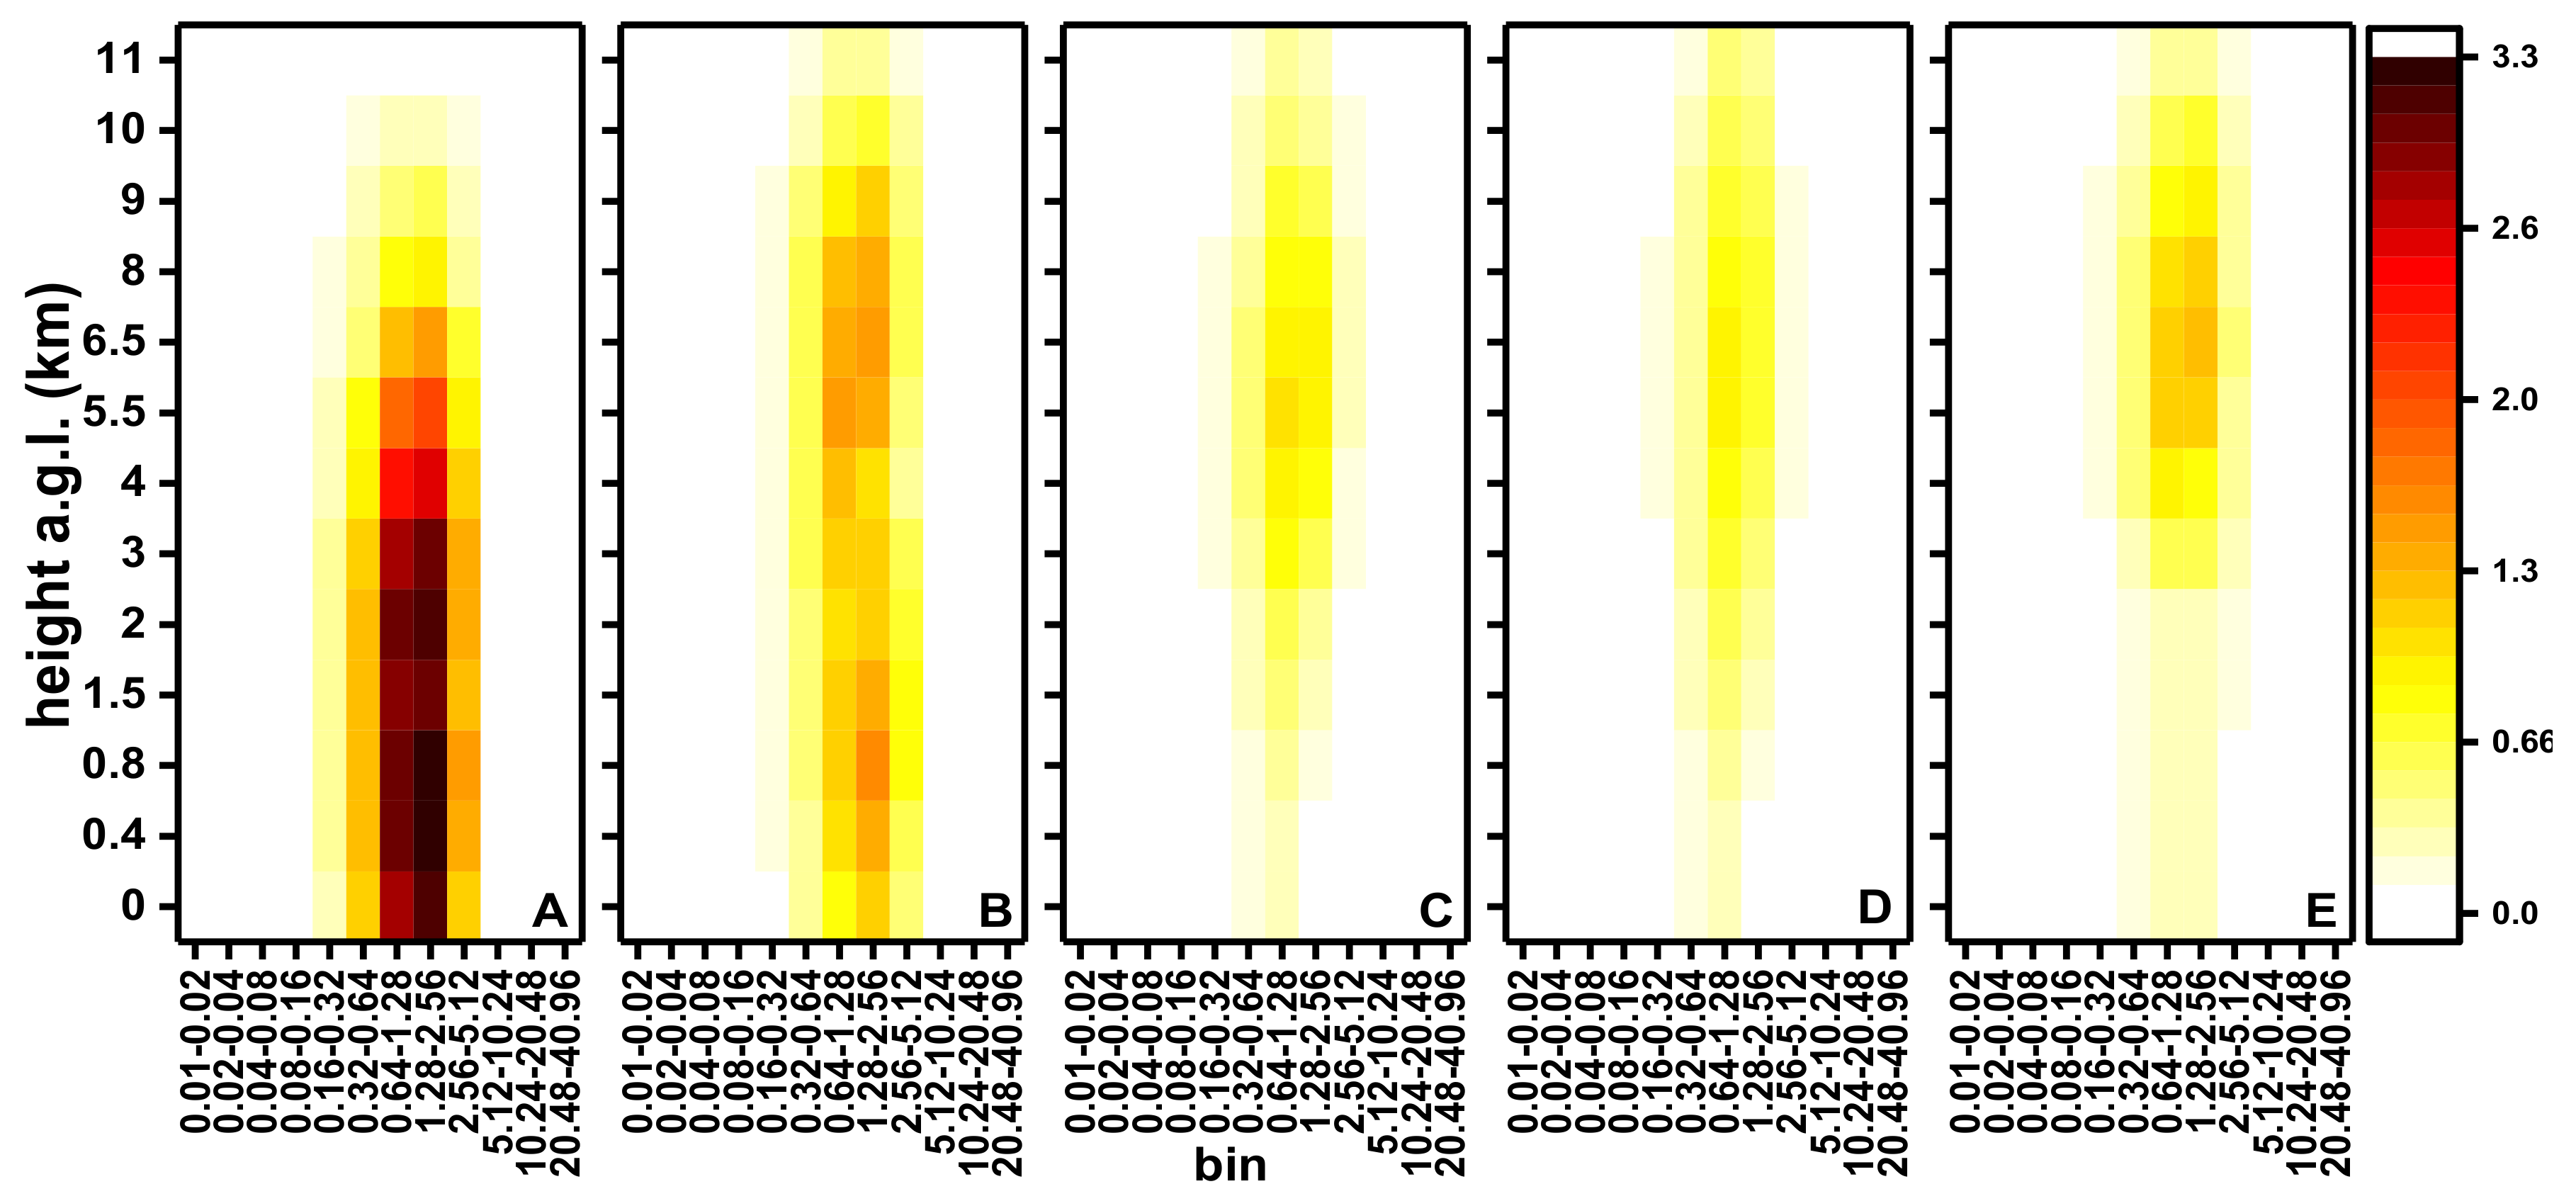
3.2.2. Vertical Distributions of Dust Aerosols with Different Particle Sizes

Five sites along 36° N, i.e., A (36° N, 100° E), B (36° N, 120° E), C (36° N, 140° E), D (36° N, 180° E) and E (36° N, 140° W), were selected to represent the source area of dust on the plateau, the eastern coastal area of East Asia, the western Pacific, the central Pacific and the eastern Pacific, respectively. The annual average concentrations of dust aerosols in different size bins were calculated at each site and at different heights above ground layer (AGL). The vertical profiles are shown in Figure 3. The concentrations of dust aerosols at sites A, B, C, D and E decreased in turn. Meanwhile, the dust aerosol high-concentration center in the source area was on the surface and was gradually raised when being transported eastward, maintaining a height of 4 km when it arrived at 120° E. The dust aerosols were transported across the Eurasian continent. First, the dust was lifted into the air from the surface over the dust-source region and then transported in the troposphere, before finally sinking in the surface of the sink region. As a result, the concentrations of dust aerosols and air were changed [37,38].The concentration of dust aerosol particles with the diameter of 1.28–2.56 μm was higher than that of 0.64–1.28 μm under the height of 1 km at site A. However, the concentrations of dust aerosols with the diameter of 0.64–1.28 μm at other sites and site A above 1 km were the largest. At sites A and B, the dust-aerosol concentration of 1.28–2.56 μm was higher than that of 0.32–0.64 μm under 9 km, while it is opposite above 9 km. The dust-aerosol concentration difference between the two size bins of 0.32–0.64 μm and 1.28–2.56 μm gradually decreased at sites C and D, and the dust-aerosol concentration of 0.32–0.64 μm was higher than that of 1.28–2.56 μm at site E. The second highest concentration level corresponded to the size bins of 2.56–5.12 μm and 0.16–0.32 μm, and the concentrations corresponding to other bins were lower. The dust aerosol particles in the atmosphere were mainly distributed in the size bins 6, 7 and 8 with the diameters ranging from 0.32 to 2.56 μm (Table 1). The dust particles with the diameter less than 1.28 μm could be transported higher and farther by the atmospheric movement, while those with the diameter greater than 1.28 μm were more likely to be raised and settled. The concentration was higher in the source area and near the surface, and decreased faster in the transport.

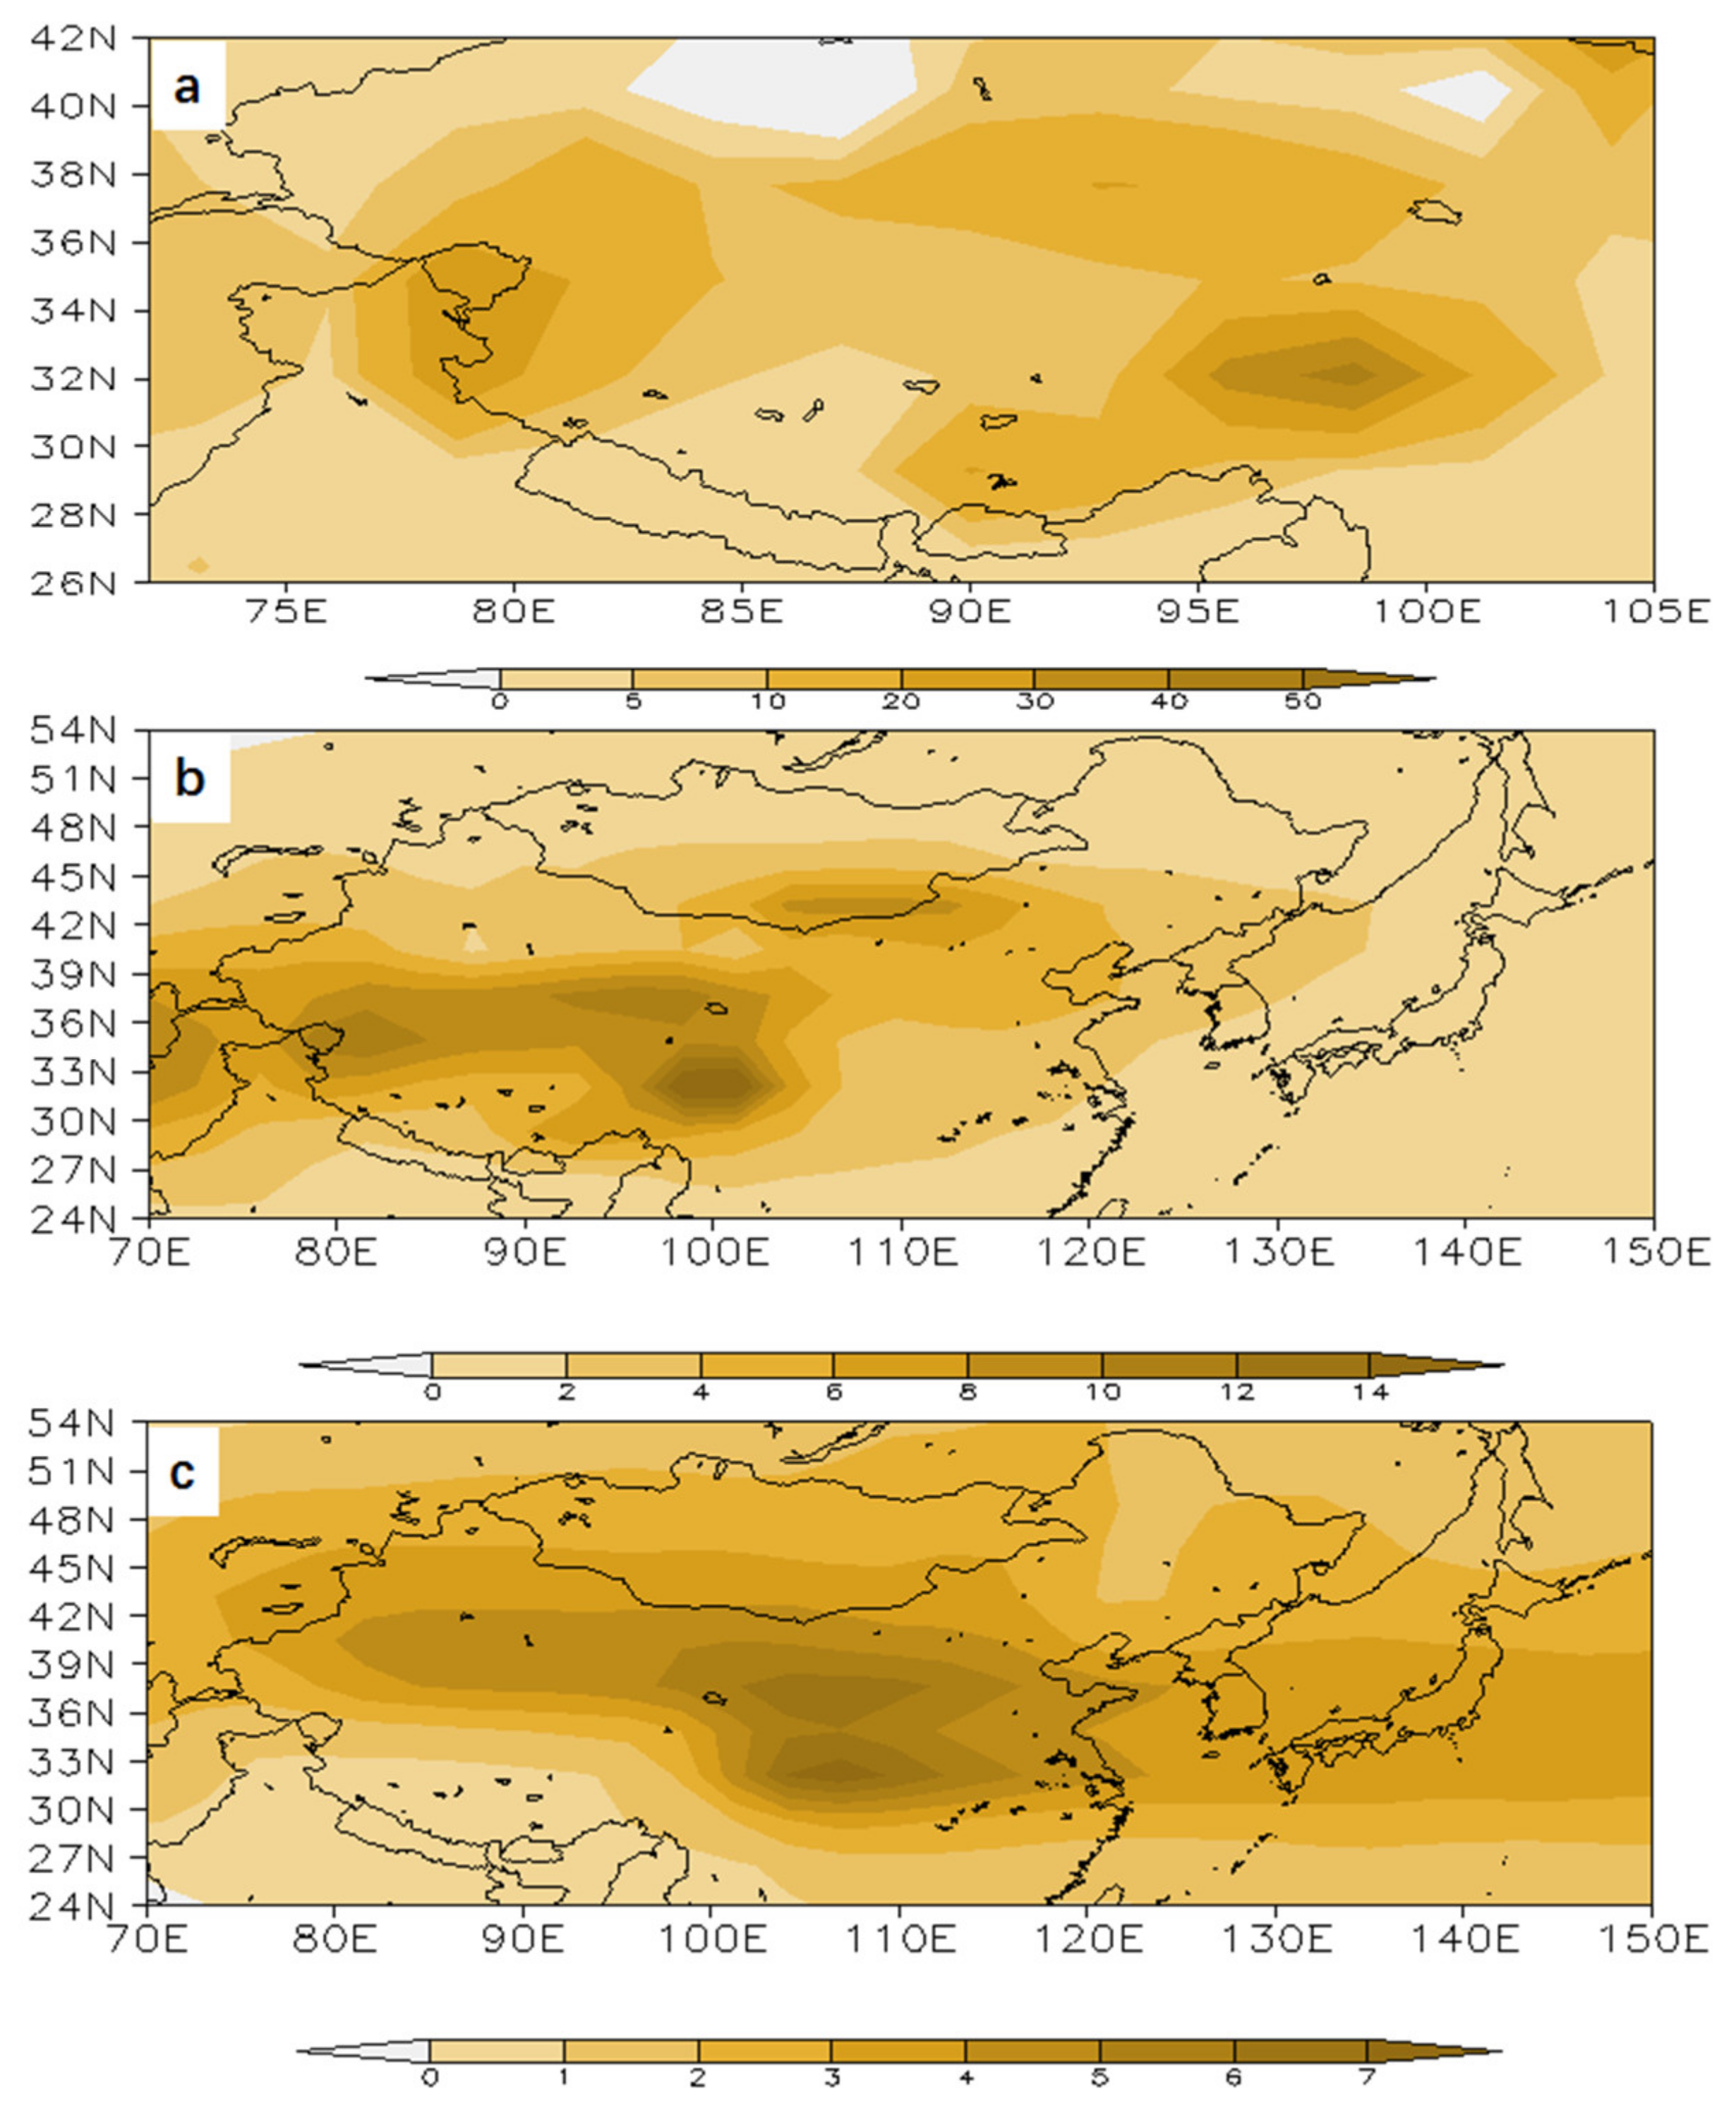
3.3. Sensitivity Analysis on the Contribution of Plateau Desertification to Dust Aerosols in East Asia

3.3.1. Variation of Dust Aerosol Concentration in East Asia

The annual average difference of dust aerosol concentration between experiments A1 and A2 in East Asia is shown in Figure 4 for the heights of 0, 1500 and 6000 m, indicating the impacts of the plateau desertification on the regional dust aerosols. The concentration difference between A1 and A2waspositive in East Asia. The high-value area of ground concentration difference was located in the dust-source areas of the western plateau, the Qaidam Basin, the southern Qinghai Plateau and southern Tibet. The high-value center of concentration difference in the lower troposphere (1500m) was located in the plateau and the surrounding areas, and the concentration difference gradually decreased eastward and southward. The high value of concentration difference in the middle troposphere (6000m) is shaped like a band, one extending from Xinjiang to central and western Inner Mongolia, to Qinghai, to the Sichuan Basin, to the north of the middle and lower reaches of the Yangtze River, and then directly to the Yellow Sea, South Korea and the southern Japan peninsula. The mean altitude of the Tibetan Plateau is above 4000 m. The emitted dust aerosols from the plateau are easily transported into the high levels of the middle troposphere over the downstream areas. The dust source on the plateau mainly affects the low level and the surface in the near-source area, i.e., the plateau and its surrounding areas, while it mainly affects the upper level in areas far away from the source, such as the sea area to the south of Japan Island and the central Pacific.

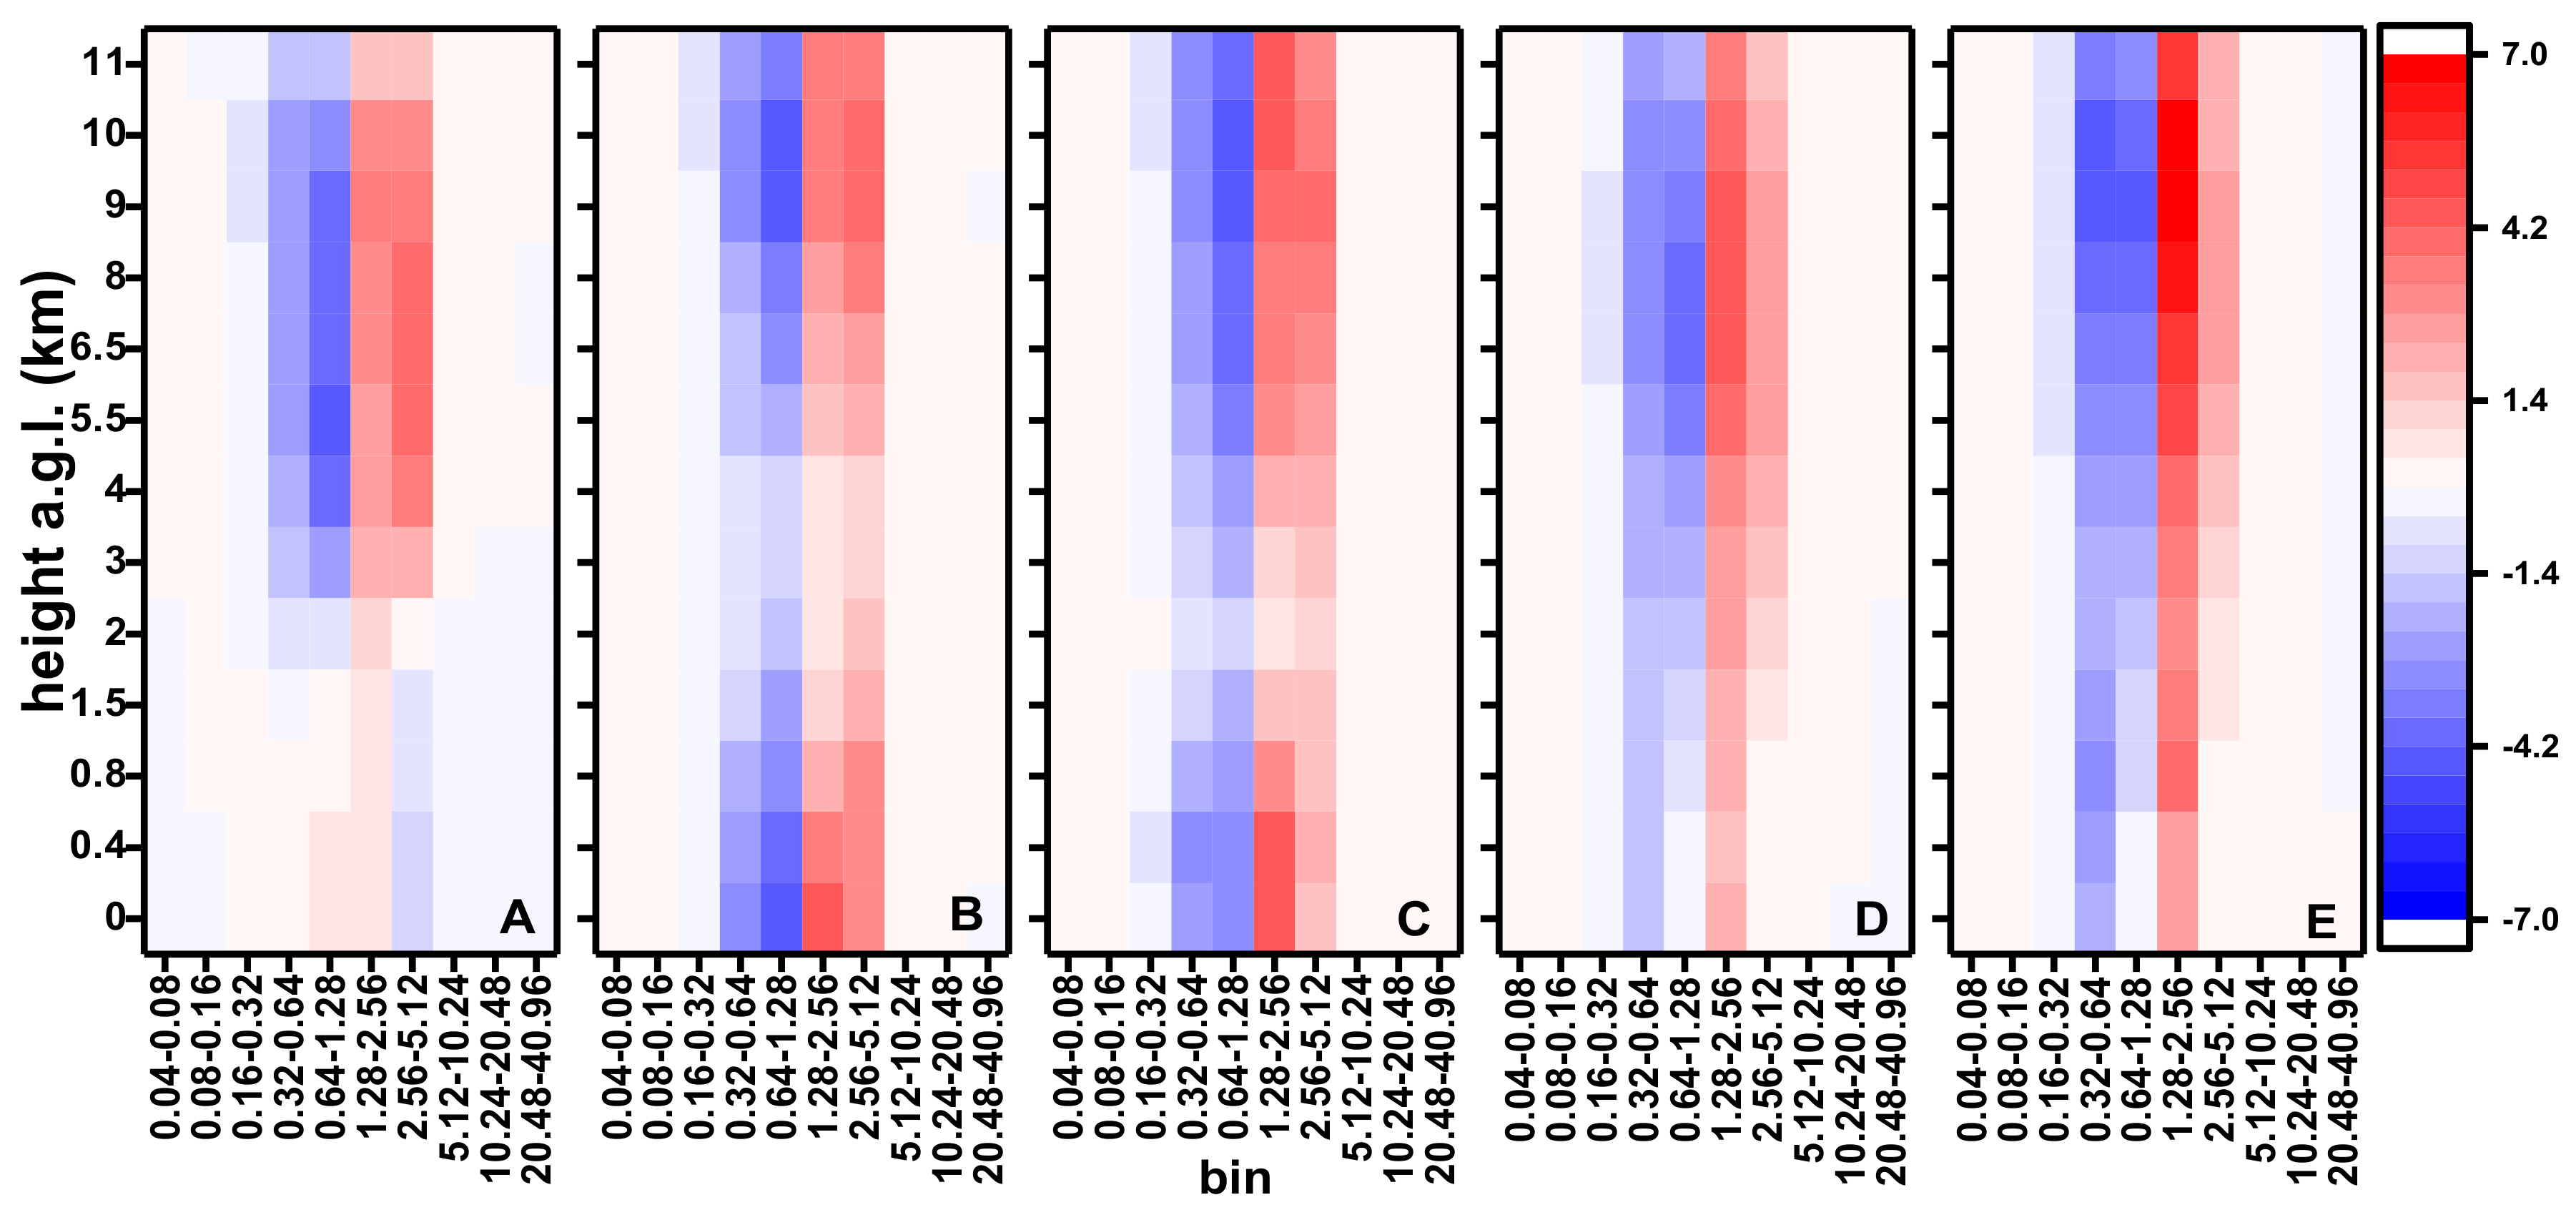
3.3.2. Vertical Contributions of Dust Aerosols with Different Particle Sizes

Figure 5 shows the concentration difference of dust aerosols in each size bin at sites A, B, C, D and E in East Asia simulated in experiments A1 and A2. In general, the difference of dust aerosol concentrations between A1 and A2in each size bin at each site was larger than 0, indicating that the plateau desertification increased the concentration of dust aerosols in each size bin. At site A, the larger difference of dust aerosol concentrations corresponded to the size bins of 0.16–0.32 μm, 0.32–0.64 μm, 0.64–1.28 μm, 1.28–2.56 μm and 2.56–5.12 μm from the surface to the height of 10 km, and the high-value difference concentrated in the size bins of 0.64–1.28 μm and 1.28–2.56 μm from the surface to the height of 3 km. At site B, the larger difference corresponded to the size bins of 0.32–0.64 μm, 0.64–1.28 μm, 1.28–2.56 μm and 2.56–5.12 μm from the surface to the height of 11 km. There were high-value centers: the size bin of 1.28–2.56 μm at the height of 0.4–2 km and the size bins of 0.64–1.28 μm and 1.28–2.56 μm at the height of 4–8 km. At site C, the larger difference corresponded to the size bins of 0.32–0.64 μm, 0.64–1.28 μm, 1.28–2.56 μm and 2.56–5.12 μm at the height of 3–11 km, while the high values concentrated in the size bins of 0.64–1.28 μm and 1.28–2.56 μm at the height of 5–8 km. The difference of dust concentrations at site D and E was similar to that at site C, and the difference became more and more concentrated. The plateau desertification raised the transport height of dust aerosols in East Asia. The main contributing size bins in the source area of plateau desertification were 0.64–1.28 μm, 1.28–2.56μm, 0.32–0.64 μm, 2.56–5.12 μm and 0.16–0.32 μm in that order, and the long-distance transport was mainly contributed by the dust aerosols in size bins of 0.64–1.28 μm and 1.28–2.56 μm. At site A in the source area, the high-value center of the concentration difference between dust concentrations of 0.64–1.28 μm and 1.28–2.56 μm was near the surface, and it was lifted to 5–8 km while being transported eastward. It was further confirmed that the particles in different size bins mainly affect the low level and surface in the near-source area, i.e. the plateau and its surrounding areas, while they mainly affect the high level in the areas away from the source.
To more directly reflect the contribution of plateau desertification to dust aerosols in different size bins in East Asia, and to compare the proportion variations of dust aerosols in different size bins, Figure 6 gives the proportion difference of the dust aerosols in different size bins at sites A, B, C, D and E in East Asia as simulated in experiments A1 and A2. At the height of 1.5 km, the proportions of dust particles in size bins of 0.64–1.28 μm and 1.28–2.56 μm increased, while those in size bins of 2.56–5.12 μm and 5.12–10.24 μm decreased. Above 1.5 km, the proportions of dust particles in size bins of 0.16–0.32 μm, 0.32–0.64 μm and 0.64–1.28 μm decreased, while those of 1.28–2.56 μm, 2.56–5.12 μm and 5.12–10.24 μm increased. The large difference of proportions concentrated at the height of 4–10 km. At sites B and C, the proportions of dust particles in size bins of 0.16–0.32 μm, 0.32–0.64 μm and 0.64–1.28 μm decreased, while those of 1.28–2.56 μm and 2.56–5.12 μm increased. The large difference concentrated in the surface layer and at the low level and the height of 9–11 km. At sites D and E, the large difference concentrated in the height of 5–10 km. The proportion difference between dust particles with a diameter smaller and greater than 1.28 μm was negative and positive, respectively. It indicates that the plateau desertification contributes more to dust aerosols with a diameter more than1.28 μm than those with a diameter smaller than1.28 μm in East Asia.
The size distribution of dust particles along transport may result from a combination of the gravitational removal of larger particles and the re-entrainment of smaller particles, because the removal rate of dust aerosols during transport is size dependent [39].The main contributing size bins of dust aerosols in the source area of plateau desertification were0.64–1.28 μm, 1.28–2.56 μm, 0.32–0.64 μm, 2.56–5.12 μm and 0.16–0.32 μm in that order, and the long-distance transport was mainly contributed by the dust aerosols in size bins of 0.64–1.28 μm and 1.28–2.56 μm. The high-value center of the concentration difference between dust concentrations of 0.64–1.28 μm and 1.28–2.56 μm was near the surface in source region, and it was lifted to 5–8 km while being transported eastward. It was further confirmed that the particles in different size bins mainly affected the low level and surface in the near-source area, i.e. the plateau and its surrounding areas, while they mainly affected the high level in the areas away from the source. The dust aerosol on the plateau can be easily ascended to westerlies, which could become the world’s highest efficiency dust-distance transport source. The plateau desertification not only increases the concentration of dust aerosols in each size bin, but also raises the transport height of dust aerosols in East Asia. The regional transport of dust aerosols from the Qinghai-Tibet plateau modifies the size distribution of aerosols in East Asia, which could affect the scattering and absorption capacities of aerosols, for the radiation balance during regional transport. Moreover, dust aerosols as cloud-condensation nuclei and ice nuclei alter cloud microphysical structure and the rainfall, depending on the size distribution of dust particles.

4. Conclusions

Based on the simulation of dust aerosols in East Asia during 2002–03 by using the global atmospheric circulation model CAM3.1, the vertical distribution characteristics of dust aerosols in different size bins in East Asia were analyzed. Moreover, the potential impact of dust aerosols with different particle sizes on East Asia was analyzed by the sensitivity simulation test of changing the underlying surface on the plateau. The main conclusions are as follows.
First, the concentrations of surface dust aerosol particles in the size bins of 0.04–0.08 μm, 0.08–0.16 μm, 10.24–20.48 μm and 20.48–40.96 μm were the lowest (less than 0.5 μg/kg) in East Asia, and the corresponding proportions were below 0.01. They were followed by the size bins of 0.16–0.32 μm and 5.12–10.24 μm. The concentrations of surface dust aerosol particles with a diameter of 0.32–0.64 μm and 2.56–5.12 μm were the second highest, while those of 0.64–1.28 μm and 1.28–2.56 μm were the highest.
Second, in East Asia, the high-concentration center of the dust aerosols in the source area was on the surface, and the center was gradually uplifted while dust aerosols were transported eastward, maintaining at the height of 4 km when reaching 120° E. The dust aerosol particles in the atmosphere were mainly distributed in diameters ranging from 0.32 to 2.56 μm. The dust particles with diameters smaller than 1.28 μm could be transported higher and farther by the atmospheric movement, while the dust particles with diameters greater than 1.28 μm were more likely to be raised and settle. Meanwhile, the concentration was higher in the source area and near the surface, and decreased faster in the transport.
Last, the plateau desertification not only increased the concentration of dust aerosols in each size bin, but also raised the transport height of dust aerosols in East Asia. Dust particles in different size bins mainly affected the low level and the surface in the near-source area, i.e., the plateau and its surrounding areas, while they mainly affected the high level in areas far away from the source. In the source area, the main contributing size bins were 0.64–1.28 μm, 1.28–2.56 μm, 0.32–0.64 μm, 2.56–5.12μm and 0.16–0.32 μm in that order. The long-distance transport was mainly contributed by the size bins of 0.64–1.28 μm and 1.28–2.56 μm. The plateau desertification contributed more to dust aerosols with diameters greater than1.28 μm than those smaller than1.28 μm in East Asia.

Author Contributions

Data curation, J.X. and Y.B.; formal analysis, J.X.; funding acquisition, T.Z.; investigation, J.X. and Y.H.; methodology, J.X., T.Z. and Y.H.; project administration, T.Z. and Y.H.; resources, Y.L.; software, Y.L.; supervision, Y.B.; validation, J.X. and Y.B.; writing—original draft, J.X.; writing—review and editing, T.Z. All authors have read and agreed to the published version of the manuscript.

Funding

This research was funded by the National Key Research and Development Program of China (2016YFC0203304) and the National Natural Science Foundation of China (41830965, 41705034).

Conflicts of Interest

The authors declare no conflict of interest.

References

  1. Charlson, R.J.; Heintzenberg, J. Aerosol Forcing of Climate; John Wiley & Sons: Chichester, UK, 1995. [Google Scholar]
  2. Houghton, J.T.; Ding, Y.; Griggs, D.J.; Noguer, M.; Linder, P.J.v.d.; Dai, X.; Mashell, K.; Johnson, C.A. Climate Change 2001: The Scientific Basis; Cambridge University Press: Cambridge, UK, 2001. [Google Scholar]
  3. Zender, C.S.; Miller, R.L.R.L.; Tegen, I. Quantifying mineral dust mass budgets: Terminology, constraints, and current estimates. Eos Trans. Am. Geophys. Union 2004, 85, 509–512. [Google Scholar] [CrossRef]
  4. Tegen, I.; Lacis, A.A.; Fung, I. The influence on climate forcing of mineral aerosols from disturbed soils. Nature 1996, 380, 419–422. [Google Scholar] [CrossRef]
  5. Creamean, J.M.; Suski, K.J.; Rosenfeld, D.; Cazorla, A.; DeMott, P.J.; Sullivan, R.C.; White, A.B.; Ralph, F.M.; Minnis, P.; Comstock, J.M.; et al. Dust and biological aerosols from the Sahara and Asia influence precipitation in the Western US. Science 2013, 339, 1572–1578. [Google Scholar] [CrossRef] [Green Version]
  6. Carslaw, K.S.; Boucher, O.; Spracklen, D.V.; Mann, G.W.; Rae, J.G.L.; Woodward, S.; Kulmala, M. A review of natural aerosol interactions and feedbacks within the earth system. Atmos. Chem. Phys. 2010, 10, 1701–1737. [Google Scholar] [CrossRef] [Green Version]
  7. Heikenfeld, M.; White, B.; Labbouz, L.; Stier, P. Aerosol effects on deep convection: The propagation of aerosol perturbations through convective cloud microphysics. Atmos. Chem. Phys. 2019, 19, 2601–2627. [Google Scholar] [CrossRef] [Green Version]
  8. Samset, B.H.; Myhre, G.; Schulz, M.; Balkanski, Y.; Bauer, S.; Berntsen, T.K.; Bian, H.; Bellouin, N.; Diehl, T.; Easter, R.C.; et al. Black carbon vertical profiles strongly affect its radiative forcing uncertainty. Atmos. Chem. Phys. 2013, 13, 2423–2434. [Google Scholar] [CrossRef] [Green Version]
  9. Marinescu, P.J.; Heever, S.C.v.d.; Saleeby, S.M.; Kreidenweis, S.M.; DeMott, P.J. The Microphysical Roles of Lower-Tropospheric versus Midtropospheric Aerosol Particles in Mature-Stage MCS Precipitation. J. Atmos. Sci. 2017, 74, 3657–3678. [Google Scholar] [CrossRef]
  10. Zheng, D.; Yao, T.D. Uplifting of Tibetan Plateau with its environmental effects. Adv. Earth Sci. 2006, 21, 451–458. [Google Scholar]
  11. Xu, X.D.; Lu, C.S.; Shi, X.H.; Gao, S.T. World water tower: An atmospheric perspective. Geophys. Res. Lett. 2008, 35, 525–530. [Google Scholar] [CrossRef]
  12. Wu, G.X.; Liu, Y.M.; He, B.; Bao, Q.; Duan, A.M.; Jin, F.F. Thermal controls on the Asian summer monsoon. Sci. Rep. 2012, 2, 404. [Google Scholar] [CrossRef] [Green Version]
  13. Xie, S.B.; Qu, J.J.; Zu, R.P.; Zhang, K.C.; Han, Q.J. New discoveries on the effects of desertification on the ground temperature of permafrost and its significance to the Qinghai-Tibet Plareau. Chin. Sci. Bull. 2012, 57, 838–842. [Google Scholar] [CrossRef] [Green Version]
  14. Li, S.; Gao, S.Y.; Yang, P.; Chen, H.S. Some problems of freeze-thaw desertification in the Tibetan Plateau: A case study on the desertification regions of the Western and Northern Platean. J. Glaciol. Geocryol. 2005, 4, 476–485. [Google Scholar]
  15. Liu, Z.; Liu, D.; Huang, J.; Vaughan, M.; Uno, I.; Sugimoto, N.; Kittaka, C.; Trepte, C.; Wang, Z.; Hostetler, C.; et al. Airborne dust distributions over the Tibetan Plateau and surrounding areas derived from the first year of CALIPSO lidar observations. Atmos. Chem. Phys. 2008, 8, 5045–5060. [Google Scholar] [CrossRef] [Green Version]
  16. Huang, J.; Minnis, P.; Yi, Y.; Tang, Q.; Wang, X.; Hu, Y.; Liu, Z.; Ayers, K.; Trepte, C.; Winker, D. Summer dust aerosols detected from CALIPSO over the Tibetan Plateau. Geophys. Res. Lett. 2007, 34, 529–538. [Google Scholar] [CrossRef] [Green Version]
  17. Winker, D.M.; Vaughan, M.A.; Omar, A.; Hu, Y.; Powell, K.A.; Liu, Z.; Hunt, W.H.; Young, S.A. Overview of the CALIPSO Mission and CALIOP Data Processing Algorithms. J. Atmos. Ocean. Technol. 2009, 26, 2310–2323. [Google Scholar] [CrossRef]
  18. Eckermann, S. Hybrid σ–P Coordinate Choices for a Global Model. Mon. Weather Rev. 2009, 137, 224–245. [Google Scholar] [CrossRef]
  19. Zhang, X.Y.; Gong, S.L.; Shen, Z.X.; Mei, F.M.; Xi, X.X.; Liu, L.C.; Zhou, Z.J.; Wang, D.; Wang, Y.Q.; Cheng, Y. Characterization of soil dust aerosol in China and its transport /distribution during 2001 ACE-Asia: 2. Model Simulation and Validation. J. Geophys. Res. 2003, 108, 4262. [Google Scholar] [CrossRef]
  20. Gong, S.L.; Barrie, L.A.; Blanchet, J.P.; Von Salzen, K.; Lohmann, U.; Lesins, G.; Spacek, L.; Zhang, L.M.; Girard, E.; Lin, H. Canadian Aerosol Module: A size-segregated simulation of atmospheric aerosol processes for climate and air quality models: 1.Module development. J. Geophys. Res. 2003, 108, 4007. [Google Scholar] [CrossRef] [Green Version]
  21. Gong, S.L.; Barrie, L.A.; Lazare, M. Canadian Aerosol Module (CAM): A size-segregated simulation of atmospheric aerosol processes for climate and air quality models: 2. Globalsea-salt aerosol and its budgets. J. Geophys. Res. 2002, 107, 4779. [Google Scholar] [CrossRef]
  22. Alfaro, S.C.; Gomes, L. Modeling mineral aerosol production by winderosion: Emission intensities and aerosol size distribution in source areas. J. Geophys. Res. 2001, 106, 18075–18084. [Google Scholar] [CrossRef]
  23. Marticorena, B.; Bergametti, G. Modeling the atmospheric dust cycle:1. Design of a soil-derived dust emission scheme. J. Geophys. Res. 1995, 100, 16415–16430. [Google Scholar] [CrossRef] [Green Version]
  24. Marticorena, B.; Bergametti, G.; Aumont, B.; Callot, Y.; N’Doumé, C.; Legrand, M. Modeling the atmosphericdust cycle: 2. Simulation of Saharan dust sources. J. Geophys. Res. 1997, 102, 4387–4404. [Google Scholar] [CrossRef]
  25. Robert, A.; Yee, T.L.; Ritchie, H. A semi-Lagrangian and semiimplicit numerical integration scheme for multilevel atmospheric models.Mon. Weather Rev. 1985, 133, 388–394. [Google Scholar] [CrossRef]
  26. Prospero, J.M.; Ginoux, P.; Torres, O.; Nicholson, S.E.; Gill, T.E. Environmental characterization of global sources of atmospheric soil dust identified with the Nimbus 7 Total Ozone Mapping Spectrometer (TOMS) absorbing aerosol product. Rev. Geophys. 2002, 40, 1002. [Google Scholar] [CrossRef]
  27. Ding, Y.H. Monsoons over China. Atmos. Sci. Libr. 1994, 2, 432. [Google Scholar] [CrossRef]
  28. Duan, A.; Wang, M.; Lei, Y.; Cui, Y. Trends in summer rainfall over China associated with the Tibetan Plateau Sensible Heat source during 1980–2008. J. Clim. 2013, 26, 261–275. [Google Scholar] [CrossRef] [Green Version]
  29. Li, C.H.; He, C.; Wan, Q.L. The thermal effect of the Tibetan Plateau on the summer climate of the south China sea surrounding areas. J. Trop. Meteorol. 2019, 35, 268–280. [Google Scholar]
  30. Zhao, T.L.; Gong, S.L.; Zhang, X.Y.; Blanchet, J.P.; McKendry, I.G.; Zhou, Z.J. A simulated climatology of Asian dust aerosol and its trans-pacific transport. Part Ⅰ: Mean climate and validation. J. Clim. 2006, 19, 88–103. [Google Scholar] [CrossRef] [Green Version]
  31. Lau, K.M.; Kim, K.M. Observational relationships between aerosol and Asian monsoon rainfall, and circulation. Geophys. Res. Lett. 2006, 33, L21810. [Google Scholar] [CrossRef]
  32. Werner, M.; Tegen, I.; Harrison, S.P.; Kohfeld, K.E.; Prentice, I.C.; Balkanski, Y.; Rodhe, H.; Roelandt, C. Seasonal and inter annual variability of the mineral dust cycle under present and glacial climate conditions. J. Geophys. Res. 2002, 107, 4744. [Google Scholar] [CrossRef] [Green Version]
  33. Ginoux, P.; Chin, M.; Tegen, I.; Prospero, J.M.; Holben, B.; Dubovik, O.; Lin, S.J. Sources and distributions of dust aerosols simulated with the GOCART model. J. Geophys. Res. 2001, 106, 20255–20273. [Google Scholar] [CrossRef]
  34. Luo, C.; Mahowald, N.M.; Corral, J.d. Sensitivity study of meteorological parameters on mineral aerosol mobilization, transport, and distribution. J. Geophys. Res. 2003, 108, 4447. [Google Scholar] [CrossRef] [Green Version]
  35. Miller, R.L.; Tegen, I.; Perlwitz, J. Surface radiative forcing by soil dust aerosols and the hydrologic cycle. J. Geophys. Res. 2004, 109, 4203. [Google Scholar] [CrossRef]
  36. Tanaka, T.Y.; Chiba, M. A numerical study of the contributions of dust source region to the global dust budget. Glob. Planet. Chang. 2006, 52, 88–104. [Google Scholar] [CrossRef]
  37. Colette, A.; Menut, L.; Haeffelin, M.; Morille, Y. Impact of the transport of aerosols from the freetroposphere towards the boundary layer on the air quality in the Paris area. Atmospheric Environ. 2008, 42, 390–402. [Google Scholar] [CrossRef]
  38. HTAP. Hemispheric Transport of Air Pollution 2010; United Nations: New York, NY, USA; Geneva, Switzerland, 2010. [Google Scholar]
  39. Liu, D.; Taylor, J.W.; Crosier, J.; Marsden, N.; Bower, K.N.; Lloyd, G.; Ryder, C.L.; Brooke, J.K.; Cotton, R.; Marenco, F.; et al. Aircraft and ground measurements of dust aerosols over the west African coast in summer 2015 during ICE-D and AER-D. Atmos. Chem. Phys. 2017, 18, 1–32. [Google Scholar] [CrossRef] [Green Version]
Figure 1. The distribution of desert proportion of the underlying surface for the CAM3.1 dust-emission modeling.
Sustainability 12 03231 g001
Figure 2. Distribution of surface dust aerosol concentrations (shadow, unit: μg kg–1) in the size bins of (a) 0.04–0.08 μm, (b) 0.08–0.16 μm, (c) 0.16–0.32 μm, (d) 0.32–0.64 μm, (e) 0.64–1.28 μm, (f) 1.28–2.56 μm, (g) 2.56–5.12 μm, (h) 5.12–10.24 μm, (i) 10.24–20.48 μm, (j) 20.48–40.96 μm, and their proportions to the total concentration (isoline) in East Asia.
Sustainability 12 03231 g002
Figure 3. Vertical profiles of annual mean concentration of dust aerosols in various size bins at five sites of A, B, C, D and E along 36° N.
Sustainability 12 03231 g003
Figure 4. Difference of dust aerosol concentrations (unit:μgkg–1)between experiments A1 and A2 in East Asia at (a) surface, (b) 1500 m and (c) 6000 m.
Sustainability 12 03231 g004
Figure 5. The difference of dust aerosol concentrations (unit: μg kg–1) in different size bins at sites A, B, C, D and E in East Asia, as simulated in experiments A1 and A2.
Sustainability 12 03231 g005
Figure 6. The proportion difference (unit: %) of dust aerosol concentrations in different size bins at sites A, B, C, D and E in East Asia, as simulated in experiments A1 and A2.
Sustainability 12 03231 g006
Table 1. All 12 size bins and corresponding aerosol sizes in the Community Atmosphere Model (CAM3.1).
Size Bin NumberDiameter Ranges, μm
010.01–0.02
020.02–0.04
030.04–0.08
040.08–0.16
050.16–0.32
060.32–0.64
070.64–1.28
081.28–2.56
092.56–5.12
105.12–10.24
1110.24–20.48
1220.48–40.96
Table 2. Comparisons of global dust aerosol emissions simulated by different models.
Dust Aerosol Emission /MtResources
North AfricaArabian PeninsulaCentral AsiaEast AsiaAustralianGlobal
1095(71%)202(7.4%)69(4.5%)79(5.1%)57(3.7%)1538This study
693(65%)101(9.5%)96(9.0%) 52(4.9%)1060Werner et al., 2002 [32]
980(66%)415(28%) 37(2.5%)1490Zender et al., 2004 [3]
1430(69%)496(24%) 61(2.9%)2073Ginoux et al., 2001 [33]
1114(67%)119(7.2%) 54(3.2%)132(8.0%)1654Luo et al., 2003 [34]
517(51%)43(4.2%)163(16%)50(4.9%)148(15%)1019Miller et al., 2004 [35]
1087(58%)221(11.8%)140(7.5%)214(11.4%)106(5.7%)1887Tanaka et al., 2006 [36]
Note: the global proportion is in brackets.

