Article

Cover Crop Impact on Soil Organic Carbon, Nitrogen Dynamics and Microbial Diversity in a Mediterranean Semiarid Vineyard

1
Dipartimento di Scienze Agrarie, Alimentari e Forestali, University of Palermo, Viale delle Scienze, 90128 Palermo, Italy
2
Dipartimento di Scienze e Tecnologie Biologiche Chimiche e Farmaceutiche, STEBICEF, University of Palermo, Viale delle Scienze, 90128 Palermo, Italy
*
Author to whom correspondence should be addressed.
Sustainability 2020, 12(8), 3256; https://0-doi-org.brum.beds.ac.uk/10.3390/su12083256
Submission received: 1 April 2020 / Revised: 11 April 2020 / Accepted: 13 April 2020 / Published: 17 April 2020
(This article belongs to the Special Issue Sustainable Soil and Water Conservation)

Abstract

:
Cover crop (CC) management in vineyards increases sustainability by improving soil chemical and biological fertility, but knowledge on its effects in semiarid soils is lacking. This study evaluated the effect of leguminous CC management on soil organic carbon (SOC) sequestration, soil nitrate content and microbial diversity in a semiarid vineyard, in comparison to conventional tillage (CT). SOC and nitrate were monitored during vine-growing season; soil respiration, determined by incubation experiments, microbial biomass and diversity was analyzed after CC burial. The microbial diversity was evaluated by bacterial and fungal automated ribosomal intergenic spacer analysis (ARISA) and high-throughput sequencing of 16SrDNA. CC increased nitrate content and, although it had no relevant effect on SOC, almost doubled its active microbial component, which contributes to SOC stabilization. An unexpected stability of the microbial communities under different soil managements was assessed, fungal diversity being slightly enhanced under CT while bacterial diversity increased under CC. The complete nitrifying genus Nitrospira and plant growth-promoting genera were increased under CC, while desiccation-tolerant genera were abundant in CT. Findings showed that temporary CC applied in semiarid vineyards does not optimize the provided ecosystem services, hence a proper management protocol for dry environments should be set up.

Graphical Abstract

1. Introduction

Effective measures are required to help moving towards evidence-based, sustainable agriculture that can mitigate the effects of climate change and benefit people, nature and their joint futures [1].
Cover cropping is considered one of the most effective solutions for implementing the multiple ecosystem services in orchards; it has been widely promoted by agricultural policy in the European Union and was included in the regional development plan as a “Best Environmental Management Practice” [2]. In vineyards, cover crops have been proven to be effective in protecting the soil from erosion [3,4,5] and nutrient loss [6], increasing soil fertility [2,7] and structure [8], regulating vine growth and yield quality [9,10] and improving soil microbial functional diversity [11]. Moreover, cover crops have been suggested to be strategic for reducing global greenhouse gases (GHGs) emissions from the agricultural sector while increasing soil organic C stock [12].
Although cover crops in vineyards have been widely studied in different regions, the effects of cover crop management vs. conventional tillage on the real ecosystem services and their quantification are still contrasting. The explanation of different results might be due to the variations in soil and climatic characteristics, type of vegetation and different local management (e.g., number of tillage and depth, irrigation). For instance, taking into consideration the influence of cover crop on soil organic carbon (SOC) dynamics, several authors observed a SOC increase especially in the upper soil layer [13,14]; on the contrary other authors observed no significant effect on SOC stock following cover crop management [15,16]. These discrepancies in carbon sequestration may be ascribed to different SOC decomposition rates as a consequence of microbial diversity, environmental characteristics and cover crop management [17]. When legumes are used as cover crops in vineyards, the yearly nitrogen requirement for grapevine needs is generally fixed [18]. Due to their low C/N ratio, generally around 20, legumes are quickly (within 2 to 3 weeks) decomposed by soil microorganisms, thus releasing available N for plants.
Cover crop management practices are reported as important drivers of both the composition of the total bacterial community and the abundance of N-cycling microbial guild [19], that in turn affect the nitrification process. The latter consists of oxidizing ammonium to nitrate, which is the interconnection between N fixation and N loss. Nitrification is generally considered negative for the environment because it causes eutrophication by nitrates, leads to the production of the greenhouse gas nitrous oxide (N2O) and reduces fertilizer efficiency as nitrates are being leached away and are no longer available for plants.
Although it is one of the most recommended practices to improve vineyard sustainability, cover cropping is not widely applied [20], especially in semiarid environments. The main obstacle for the spread of this practice in semiarid environments is the fear of the competition for water and nutrients between cover crops and vines, and the possible consequent grape yield reduction [21]. The risk of competition has especially limited the use of permanent cover crops in the Mediterranean environment. For the same reasons, winegrowers of Southern Europe prefer to manage vineyards with temporary cover crop, mostly legume species in alternate inter-rows and bury them in the early spring [22]. Although such a kind of management implies a short period of time during which cover crop is cultivated, it can affect soil microbial community and in turn soil organic matter decomposition. Finney et al. [23] reported that cover crops generally promote microbial biomass and activity but such a promotion is dependent on specific cover crop species and ultimately influences the soil biological activity. Recently, Strickland et al. [24], in a short-term experiment, found that cover crops increased microbial biomass and bioavailable C by 64% and 37%, respectively, whereas soil NO3 decreased by 30%, indicating a shift toward less mobile N forms and the potential of greater nutrient retention under cover cropping regimes. On the other hand, in order to assess the dynamics of nitrates in soils with legumes it is important to reduce the input of inorganic N fertilizers that in turn may speed up soil organic matter mineralization [7].
The aim of this study was to evaluate the effect of cover crop soil management with leguminous species on soil organic carbon sequestration, soil nitrate content and soil microbial diversity in a vineyard in a semiarid environment. The final scope of this study is to contribute to establish good agricultural practices in the most vulnerable regions of Southern Europe that are threatened by desertification and land degradation.

2. Materials and Methods
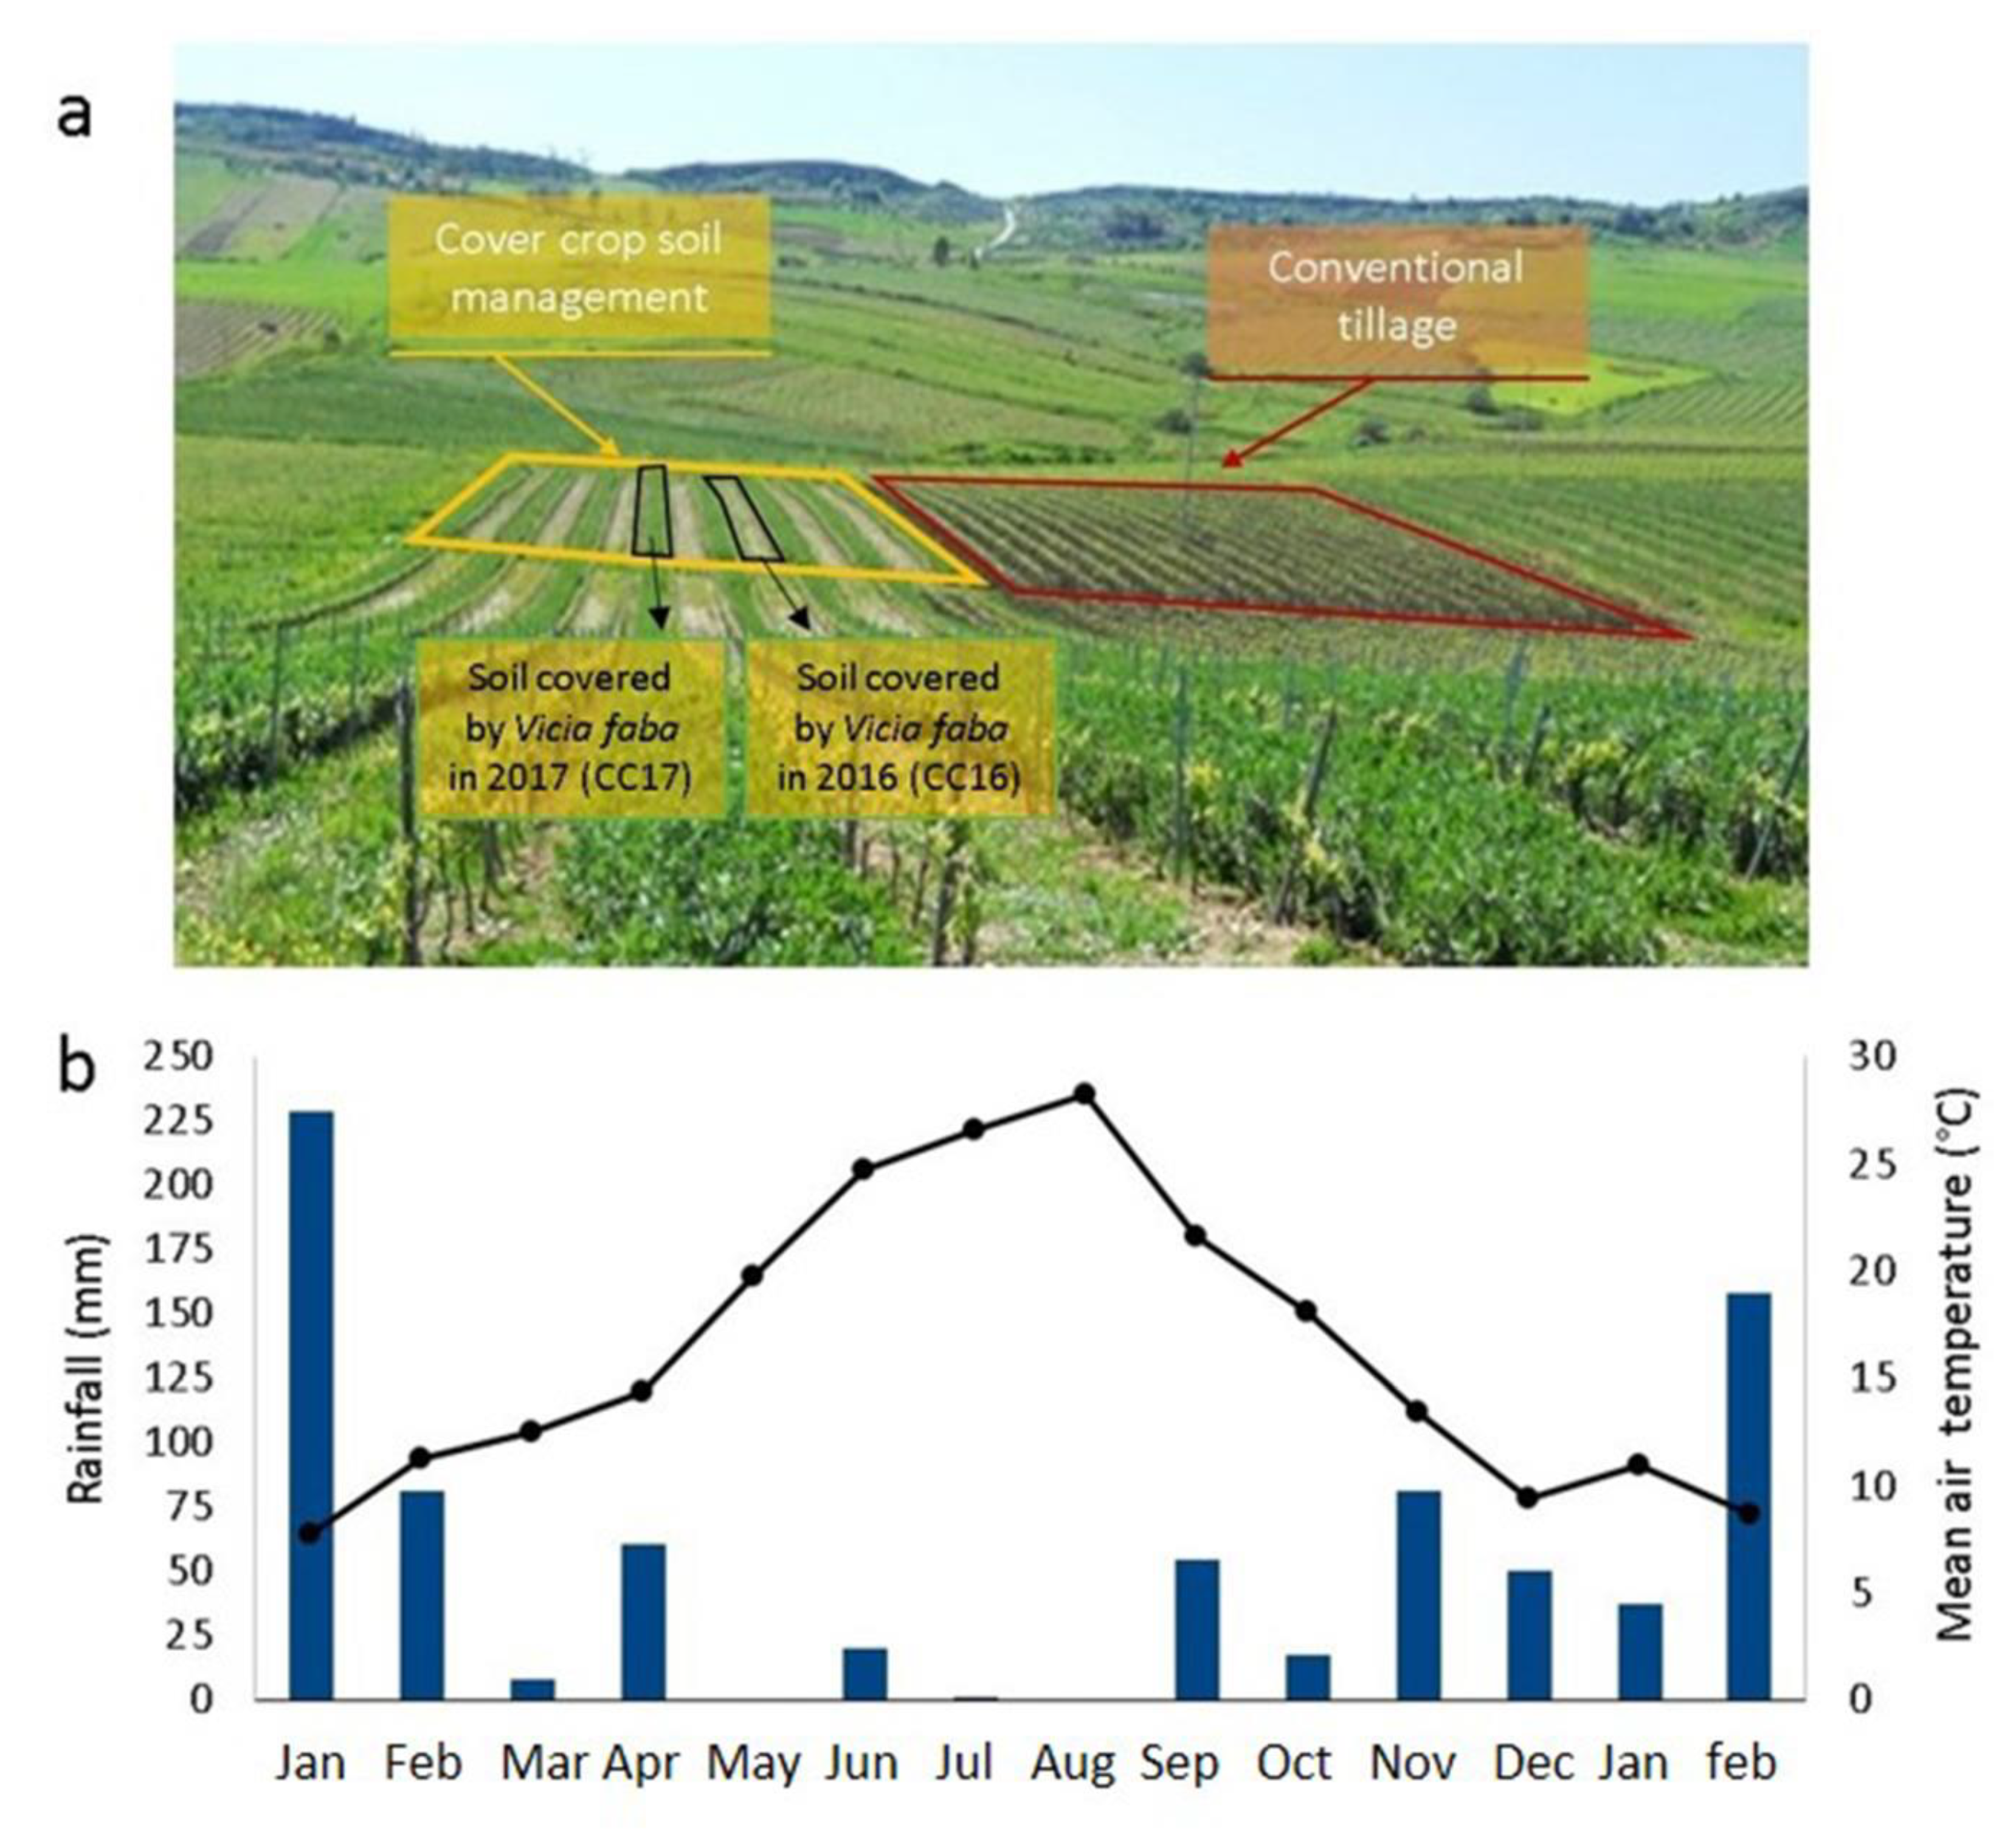
2.1. Study Area

The experiment was carried out on a flat vineyard area in the west of Sicily, Italy (37°40′ N; 13°02′ E) (Figure 1). The site has a typical Mediterranean climate with a dry hot summer; the mean annual temperature is 18 °C and the mean average rainfall is 516 mm (data from a meteorological weather station installed in Contessa Entellina, 5 km from vineyard). The soil, classified as Calcic-gleyic-vertisol [25], is composed of 40% clay, 34% silt and 26% sand. Within the study area, two bordering vineyards have been identified. The selected vineyards are both cv. Nero d’Avola (Vitis vinifera L.) grafted on 140 R rootstock, with a plant density of 3000 plants per ha−1 (Figure 1). Since 2009, one vineyard is conventional tilled (CT) and another one is cover cropped (CC). In the CT plot, soil is bare for the greatest part of the year since it is frequently ploughed (5–6 times per year) to control weeds and to reduce soil water evaporation during the summer season. In the CC plot, soil is covered by faba bean (Vicia faba), seeded in October and buried into the soil in April with a rotary hoeing. The cover crop covers the inter-row soil every second year, which is a common farmer practice in those areas characterized by dry summers. After biomass burying, soil is managed as CT management, with two or three tillages during the summer season depending on meteorological conditions.

2.2. Soil Analyses

Soil samples were collected in 2017 in the three treatments: conventional tillage (CT); soil of the inter-row covered by Vicia faba in the previous year (CC16) and soil of the inter-row covered by Vicia faba in 2017 (CC17) (Figure 1). Soil samples were collected once a month, from March to August 2017, with three replications at 0–30 cm soil depth. Samples were collected in the CT plot and in the inter-row covered by Vicia faba in 2016 (CC16) and in 2017 (CC17). The soil was air-dried and sieved at 2 mm. Soil organic carbon was determined by the Walkley and Black method [26]. Nitrate content was determined after 1:5 aqueous extraction using a Dionex ion chromatograph. Extractable organic C was estimated by mechanical shaking of the soil sample in a 0.5 M K2SO4 solution for one hour, followed by centrifugation and filtration through a 0.45 μm cellulose acetate membrane. Extractable organic C was determined using the 680 °C combustion Pt-catalytic oxidation method and detecting the generated CO2 by an infrared gas analyzer (Vario TOC, Elementar).

2.3. Incubation Experiment

The potential of soil to mineralize SOC was determined using a short-term incubation experiment (28 days). Briefly, soil samples (10 g) were moistened up to 50% of their water holding capacity, pre-incubated for five days at room temperature and thereafter incubated in air-tight glass bottles at 25 °C in the dark. The emitted CO2 accumulated in the headspace of the bottles was quantified using a gas-chromatograph (Trace GC, Thermo Electron). CO2 measurements were performed 3, 7, 10, 14, 17, 21, 24 and 28 days after the start of incubation. The C mineralization rate was expressed as mg CO2-C kg−1 dry soil day−1 and was fitted to the following first-order decay function:
Mineralized C = C0 e−kt
where k is the decay rate constant (d−1), C0 (mg CO2-C kg−1) is the biological available C at time zero (i.e., the intercept value) and t is the sampling time. The amount of total C mineralized during incubation was calculated through the linear interpolation of two subsequent measured rates and the numerical integration over time.

2.4. DNA Extraction

DNA extraction was performed from 0.5 g of frozen soil samples using the FastDNA Spin kit for soil (MP Biomedicals, LLC, Solon, OH, USA) according to the manufacturer’s instructions except in the last step, which was performed as described in Catania et al. [27]. DNA concentration and quality were determined using a NanoDrop ND-1000 spectrophotometer (NanoDrop Technologies). The samples were stored at −20 °C until further processing.

2.5. Denaturing Gradient Gel Electrophoresis Analysis

DNA extracted from soil samples was amplified using the primers 341f-GC and 534 r [28]. All reactions were carried out in a final volume of 30 µL containing a 1× polymerase chain reaction (PCR) buffer Phire Hot Start II DNA Polymerase (Thermo Scientific, Waltham, MA, USA), 0.8 µL of Phire Hot Start II DNA Polymerase (Thermo Scientific), 0.3 mM dNTP, 0.5 µM of each primer, 100 ng of extracted genomic DNA and 3% dimethyl sulfoxide (DMSO). The polymerase chain reaction was performed as described in Catania et al. [29]; PCR products were analyzed as described in Catania et al. [30] and then subjected to Denaturing Gradient Gel Electrophoresis (DGGE). Gel staining, gel capturing and the DGGE profiles analysis were performed as described in Djahnit et al. [31].

2.6. PCR-Amplification of Bacterial and Fungal Ribosomal Intergenic Spacer

The microbial communities were investigated using the bacterial and fungal automated ribosomal intergenic spacer (ITS) analysis (B-ARISA and F-ARISA, respectively), using the bacterial primers ITSF/ITSReub [32] and the fungal primers 2234C/3126T [33], respectively.
The PCR fragments were labeled as described in Schuelke [34]. For each reaction three primers were used: a sequence-specific forward primer with an M13 tail at its 5′ end (TGT AAA ACG ACGGCC AGT); a sequence-specific reverse primer not modified and the universal fluorescent-labeled M13 primer (FAM-TGT AAA ACG ACG GCC AGT-3′). PCR mixtures (30 μL) contained a buffer Phire Hot Start 1X (Thermo Scientific), dNTP (0.2 mM), a sequence-specific forward primer with an M13 tail (0.8 µM), a sequence-specific reverse primer (0.3 µM), the universal fluorescent-labeled M13 primer (0.3 µM), BSA 0.1% (Biolabs), Phire Hot Start II DNA Polymerase (Thermo Scientific) (0.4 µL) and 20 ng of genomic DNA extracted by soil samples. The ITS prokaryotic ribosomal region was amplified as follows: 98 °C for 30 s, followed by 35 cycles consisting of 98 °C for 15 s, 50 °C for 15 s, 72 °C for 30 s and 72 °C for 1 min. The ITS eukaryotic ribosomal region was amplified in the same conditions except in the annealing step, where the temperature was 58 °C; PCR products (5 µL) were loaded on a 2% agarose gel and separated by electrophoresis. Gels were stained with 1% ethidium bromide.

2.7. Automated Ribosomal Intergenic Spacer Analysis (ARISA)

The PCR product (0.5 µL, about 20 ng DNA) was mixed with 9 µL of Hi-Di formamide (Applied Biosystems, Foster City, CA, USA) and 0.5 µL of internal size Standard (GeneScan 1200 LIZ dye Size Standard). The mixture was denatured at 95 °C for 5 min, cooled to 0 °C for 4 min and separated on a capillary electrophoresis Bioanalyzer ABIPrism 3100 Genetic Analyzer (Applied Biosystems, Foster City, CA, USA); it was then equipped with 16 50-cm capillaries filled with POP 7 polymer separation matrix (Applied Biosystems, Foster City, CA, USA). Run conditions were as follows: 8.5 kV and 60 °C, and the total run time was 6.700 s. Electropherograms were analyzed using the Gene Mapper 4.0 software, using the normalization inside the experiment, and the fluorescence threshold was set at 40 relative fluorescence units (RFU). The tables for presence/absence and fluorescence associated with each peak, ranging from 50 to 1200 base pairs in length, were exported into spreadsheets for subsequent analysis. A bin size of 5 bp was employed to minimize the inaccuracies in the ARISA profiles [35].

2.8. Next Generation Sequencing of Ribosomal DNA and Bioinformatic Analysis

The 16S rRNA gene targeting the V3–V4 region of bacteria and archaea was sequenced using Miseq Illumina with 300 bp paired-end reads [36].
The fastq files were checked for quality control using FASTQC [37]. The metagenomics data were analyzed using the GAIA v. 2.0 platform. Bad-quality reads were removed using BBDuk by setting a minimum length of 35 bp and a minimum Phred-quality score of 25 [38]. Afterwards, reads were mapped with BWA [39], against databases created from NCBI sequences [40]. Reads were then classified into the most specific taxonomic level using a lowest common ancestor (LCA) algorithm. Identity thresholds were applied to classify reads into species (97%), genus (93%), family (91%), order (89%), class (85%), phylum (78%) and domain (75%) levels. Alpha and beta diversities were calculated using the R package phyloseq [41].
The Metagenome sequence data are available at NCBI Accessions SRR11218221 (CC17) and SRR11218222 (CT).

2.9. Statistical Analysis

Treatment effects (CT, CC16 and CC17) on measured variables were tested using ANOVA (univariate linear model), and comparisons between treatment means were made using the least significant difference (LSD) multiple range test calculated at p < 0.05. The Tukey’s HSD tests at p ≤ 0.05 were performed when the main sources of variation were significant at ANOVA analysis.
Statistical procedures were carried out with the software program SPSS statistical package [42].

3. Results

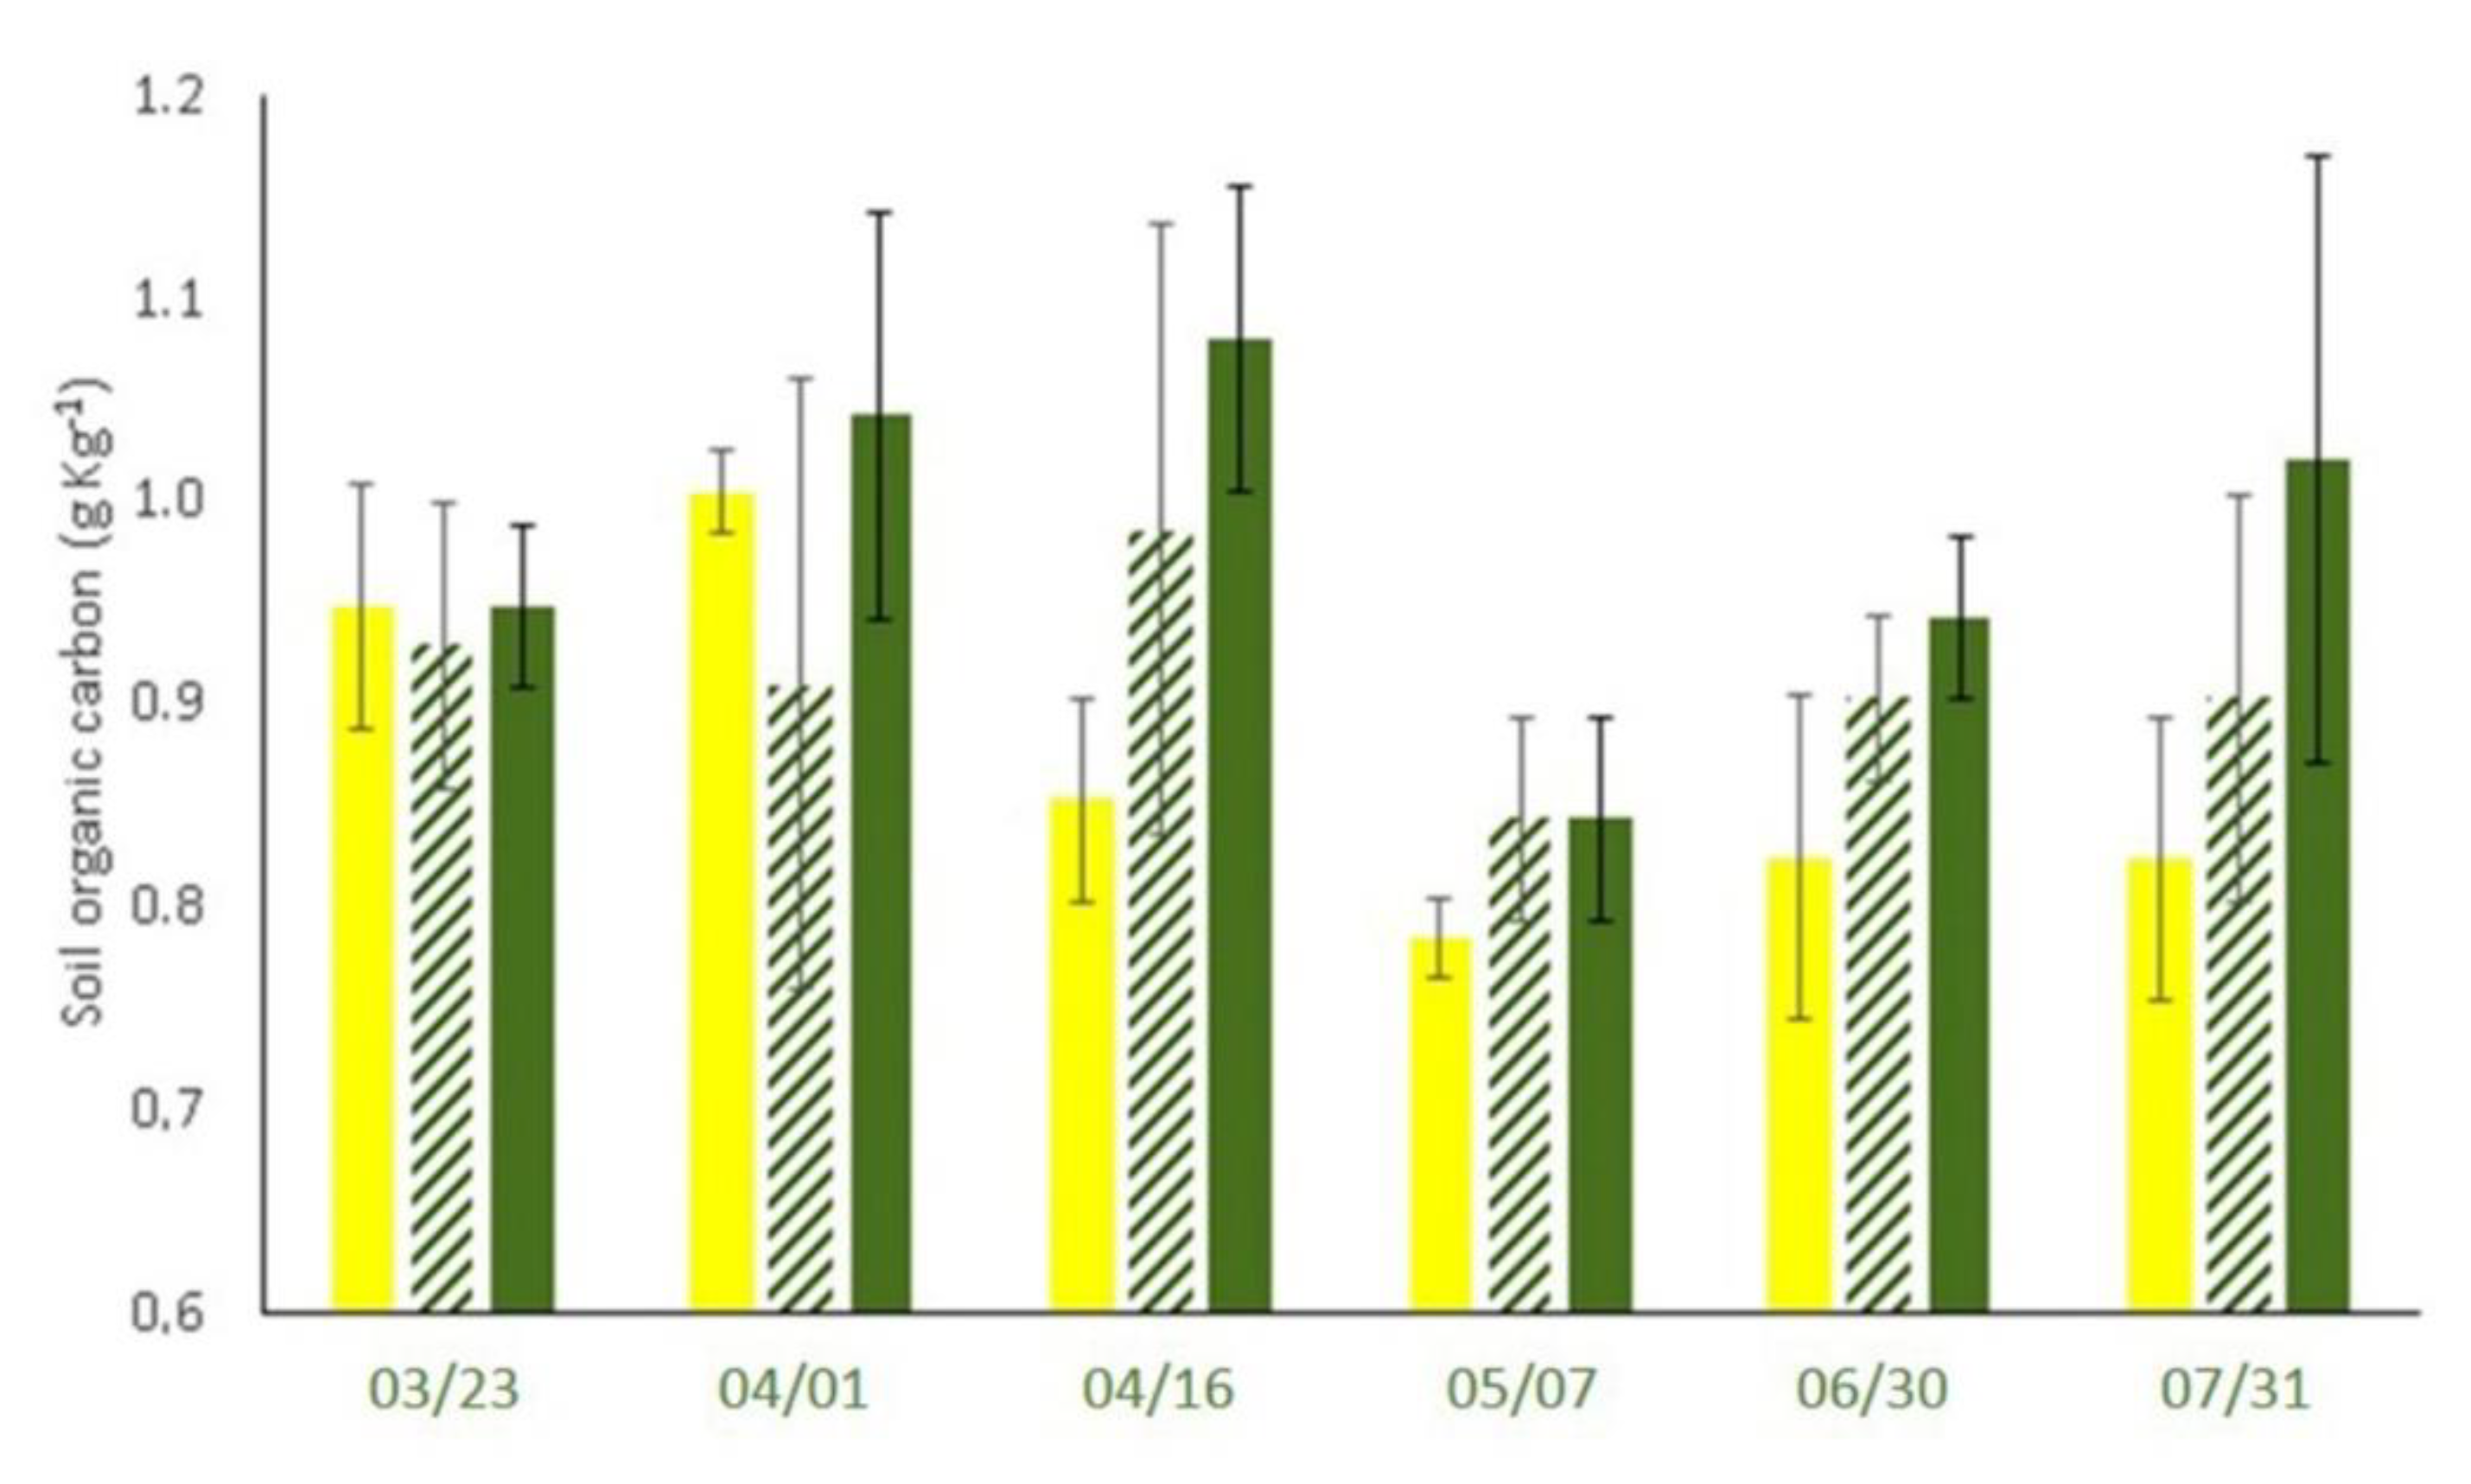
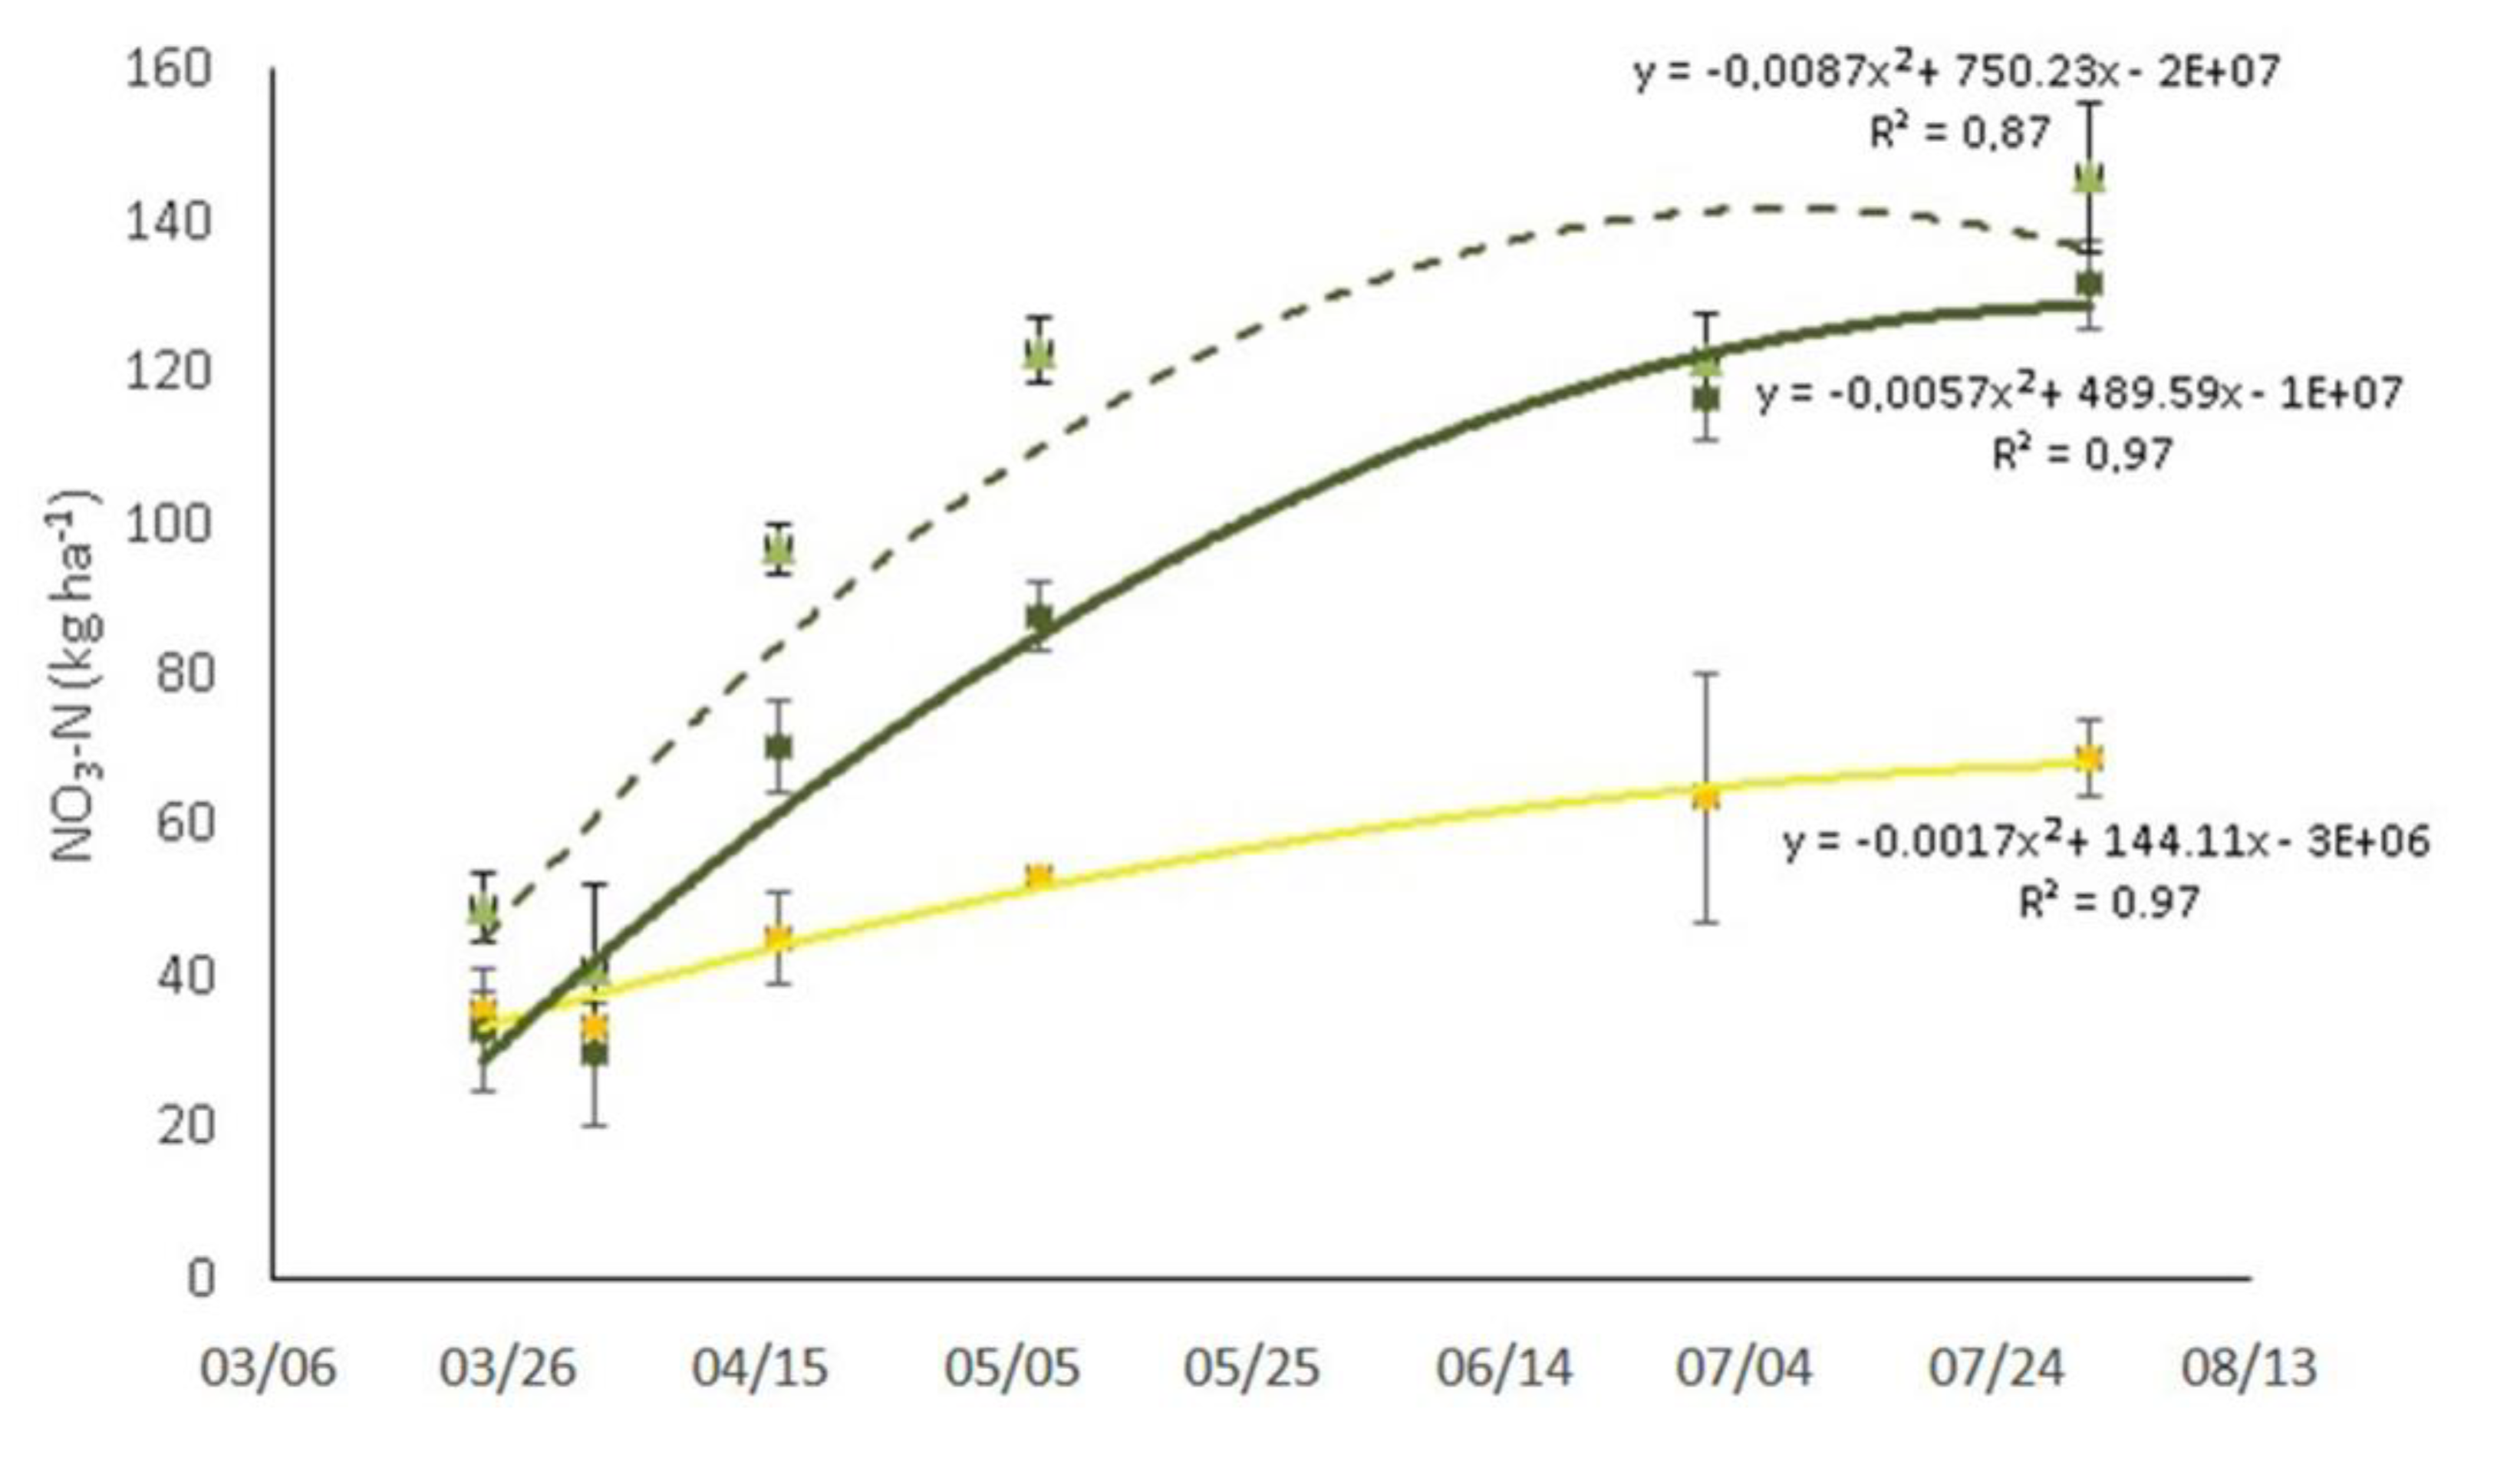
3.1. Soil Organic Carbon and Nitrate Content

Soil organic carbon did not significantly increase after 8 years of cover crop soil management, although the SOC values, on average, were slightly higher in CC (9.5 ± 0.7 g kg−1, average of CC16 and CC17) than CT (8.7 ± 0.8 g kg−1). Considering the value of SOC content under CT constant during the last 8 years, because the selected flat vineyard is not affected by C erosion losses, the SOC sequestration rate as a consequence of CC application was 0.1 g kg−1 y−1. The SOC content fluctuated over the year, with lower values in May and June, both for CC and CT management (Figure 2). Comparing the two inter-rows under the cover crop plot, CC17 showed higher average values of SOC in comparison to CC16, although not statistically significant.
Nitrate soil content increased from March to the end of July in soil under both CT and CC management. The nitrate content was significantly higher in CC than in CT (Figure 3); in particular, the highest values were recorded under CC16 from March to July but at the end of July the CC values were closer to each other.

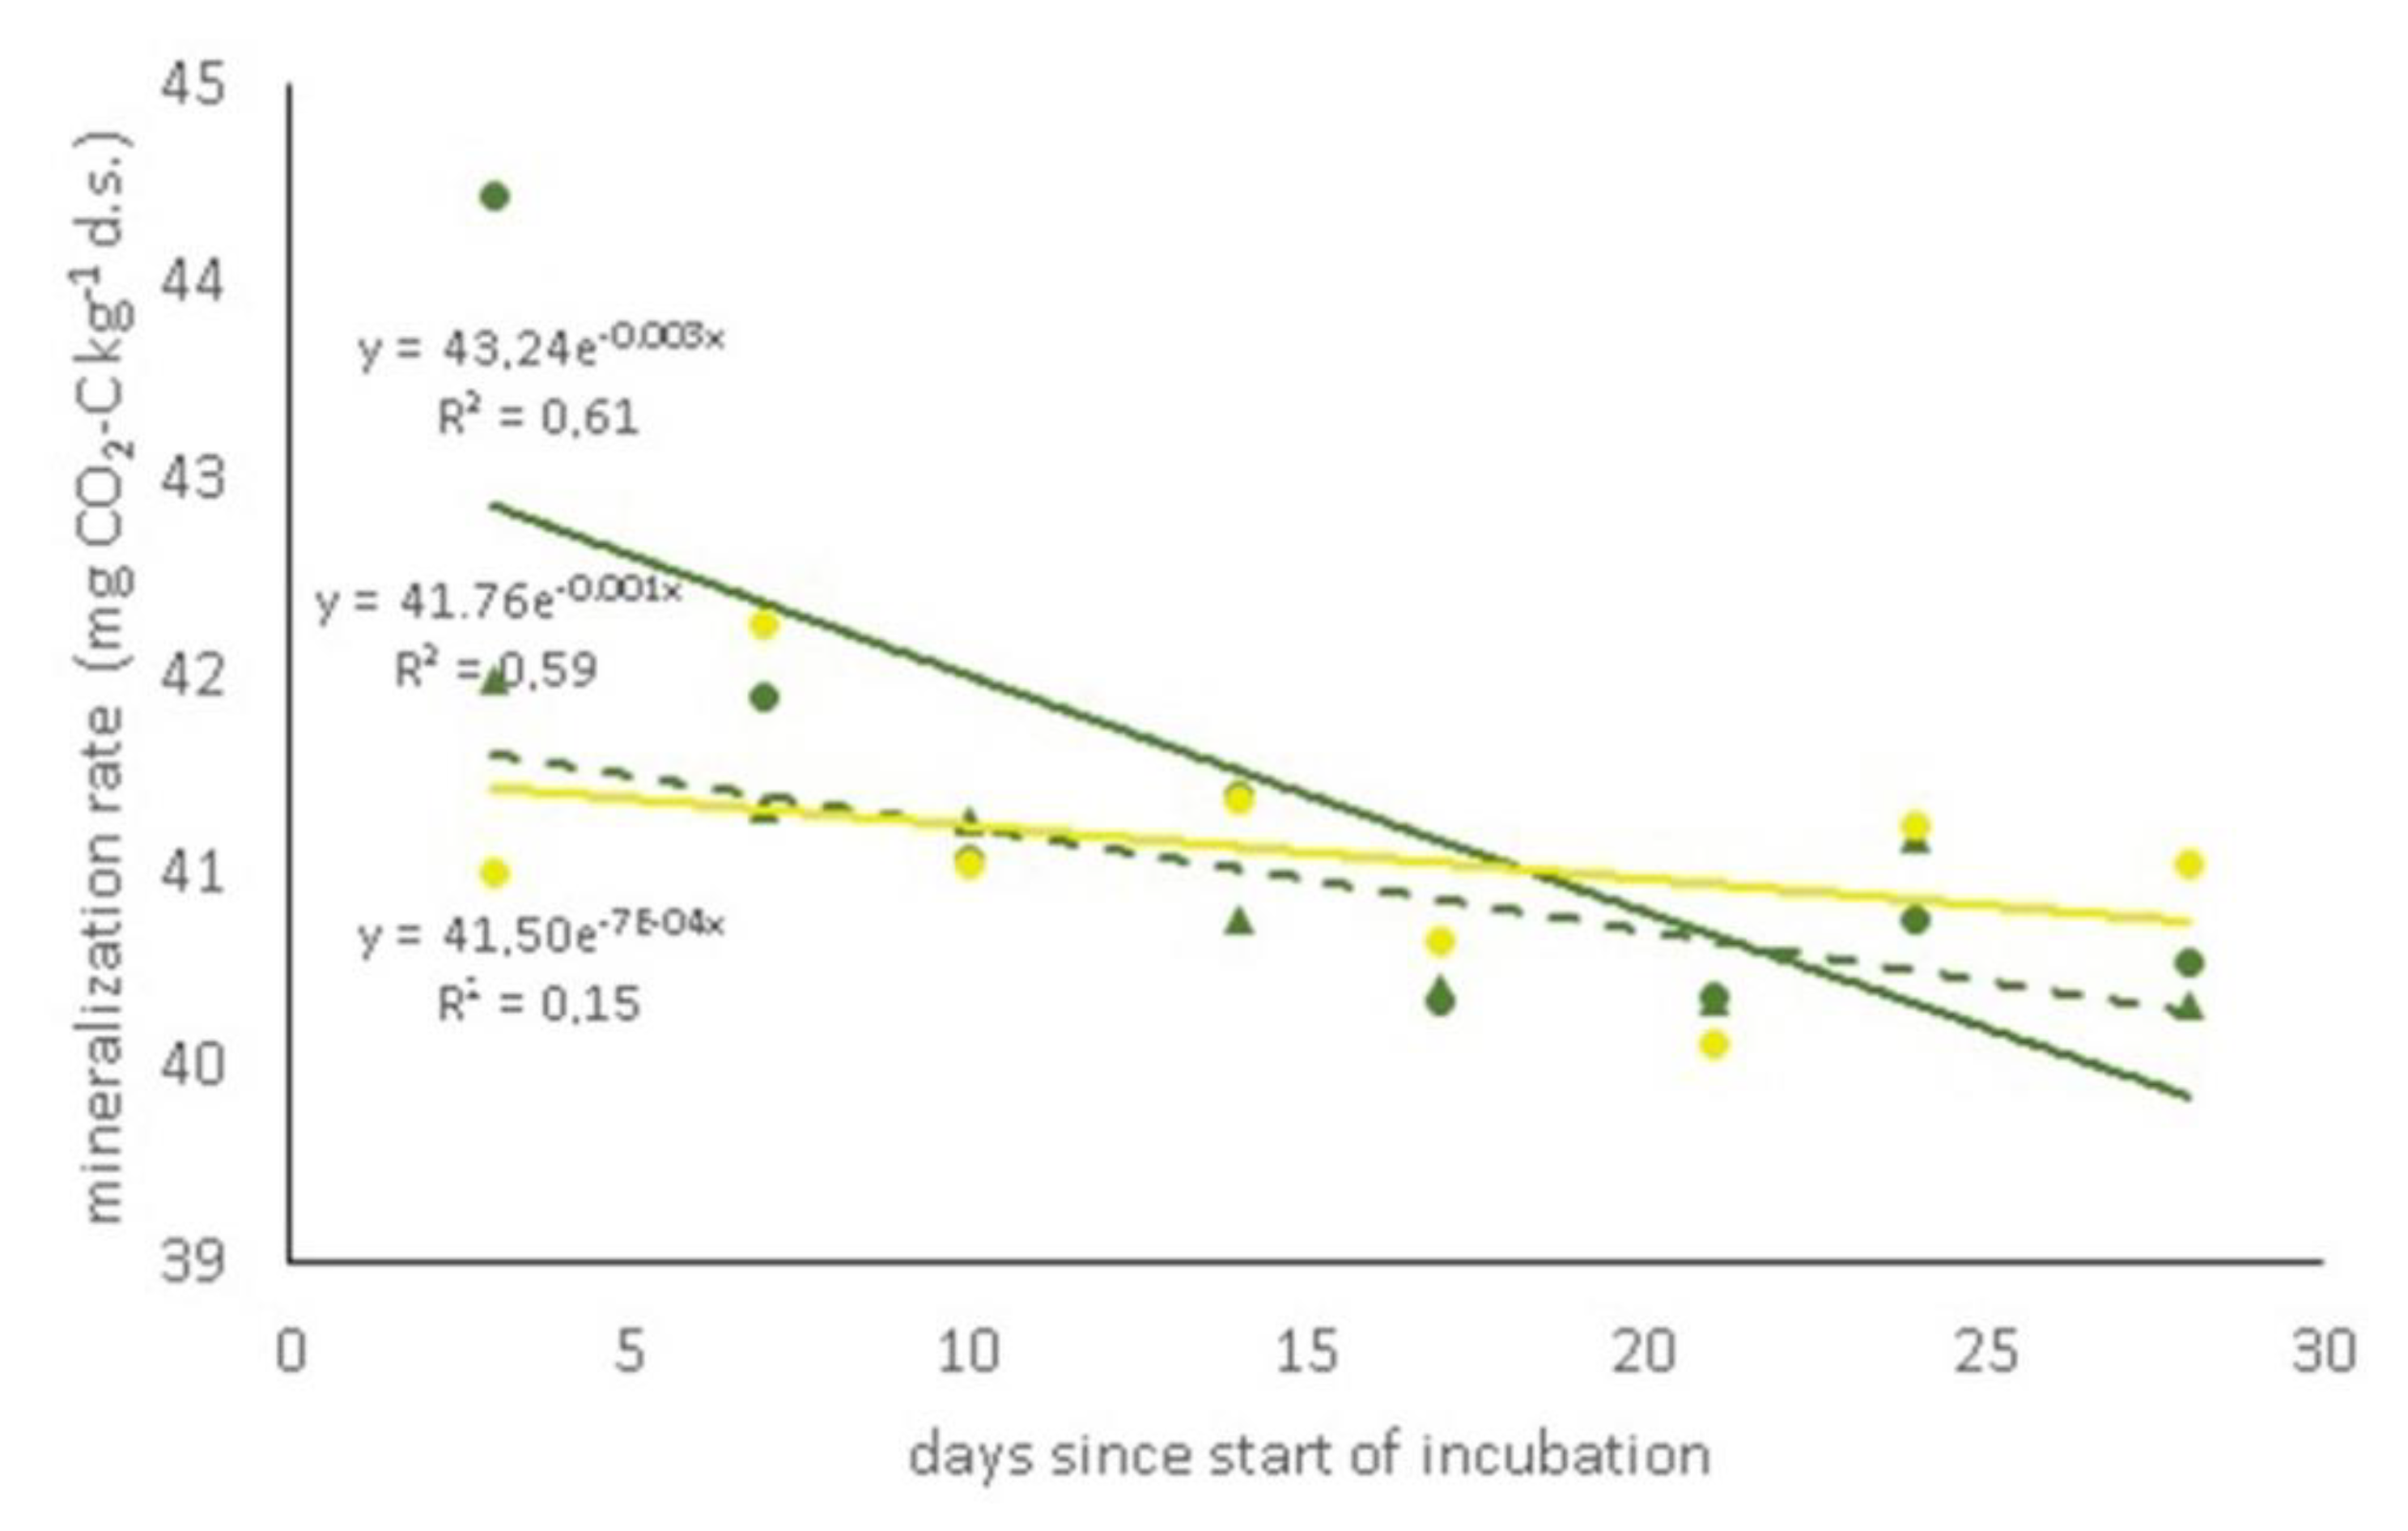
3.2. Microbial Biomass and Soil Respiration

Soil microbial biomass is a relatively small component of the soil organic matter (SOM), representing only 1%–5% of total soil C [17], and total DNA extracted from soil is considered a proxy of soil microbial biomass in agricultural soils [43].
The concentration of total DNA extracted from CC soils in July 2017 was higher by about 2-fold than the DNA concentration from CT soil (Table 1), suggesting the beneficial effect of the cover crop management in increasing the microbial biomass. Such a positive effect is more consistent if analyzed in view of the absence of significant differences between CC and CT soils, since it indicates an improvement of soil organic matter quality in CC soil [17,44] that is enriched in its microbial component.
The C mineralization rate exponentially decreased in CC16 and CC17, whereas it remained constant in CT during the incubation period (Figure 4 and Table 1). Such a stimulation, confirmed by higher biological available C and total C mineralized and lower mean residence time (MRT), was evident in CC17 since the soil under this management was covered by Vicia faba during the sampling year (Table 1).

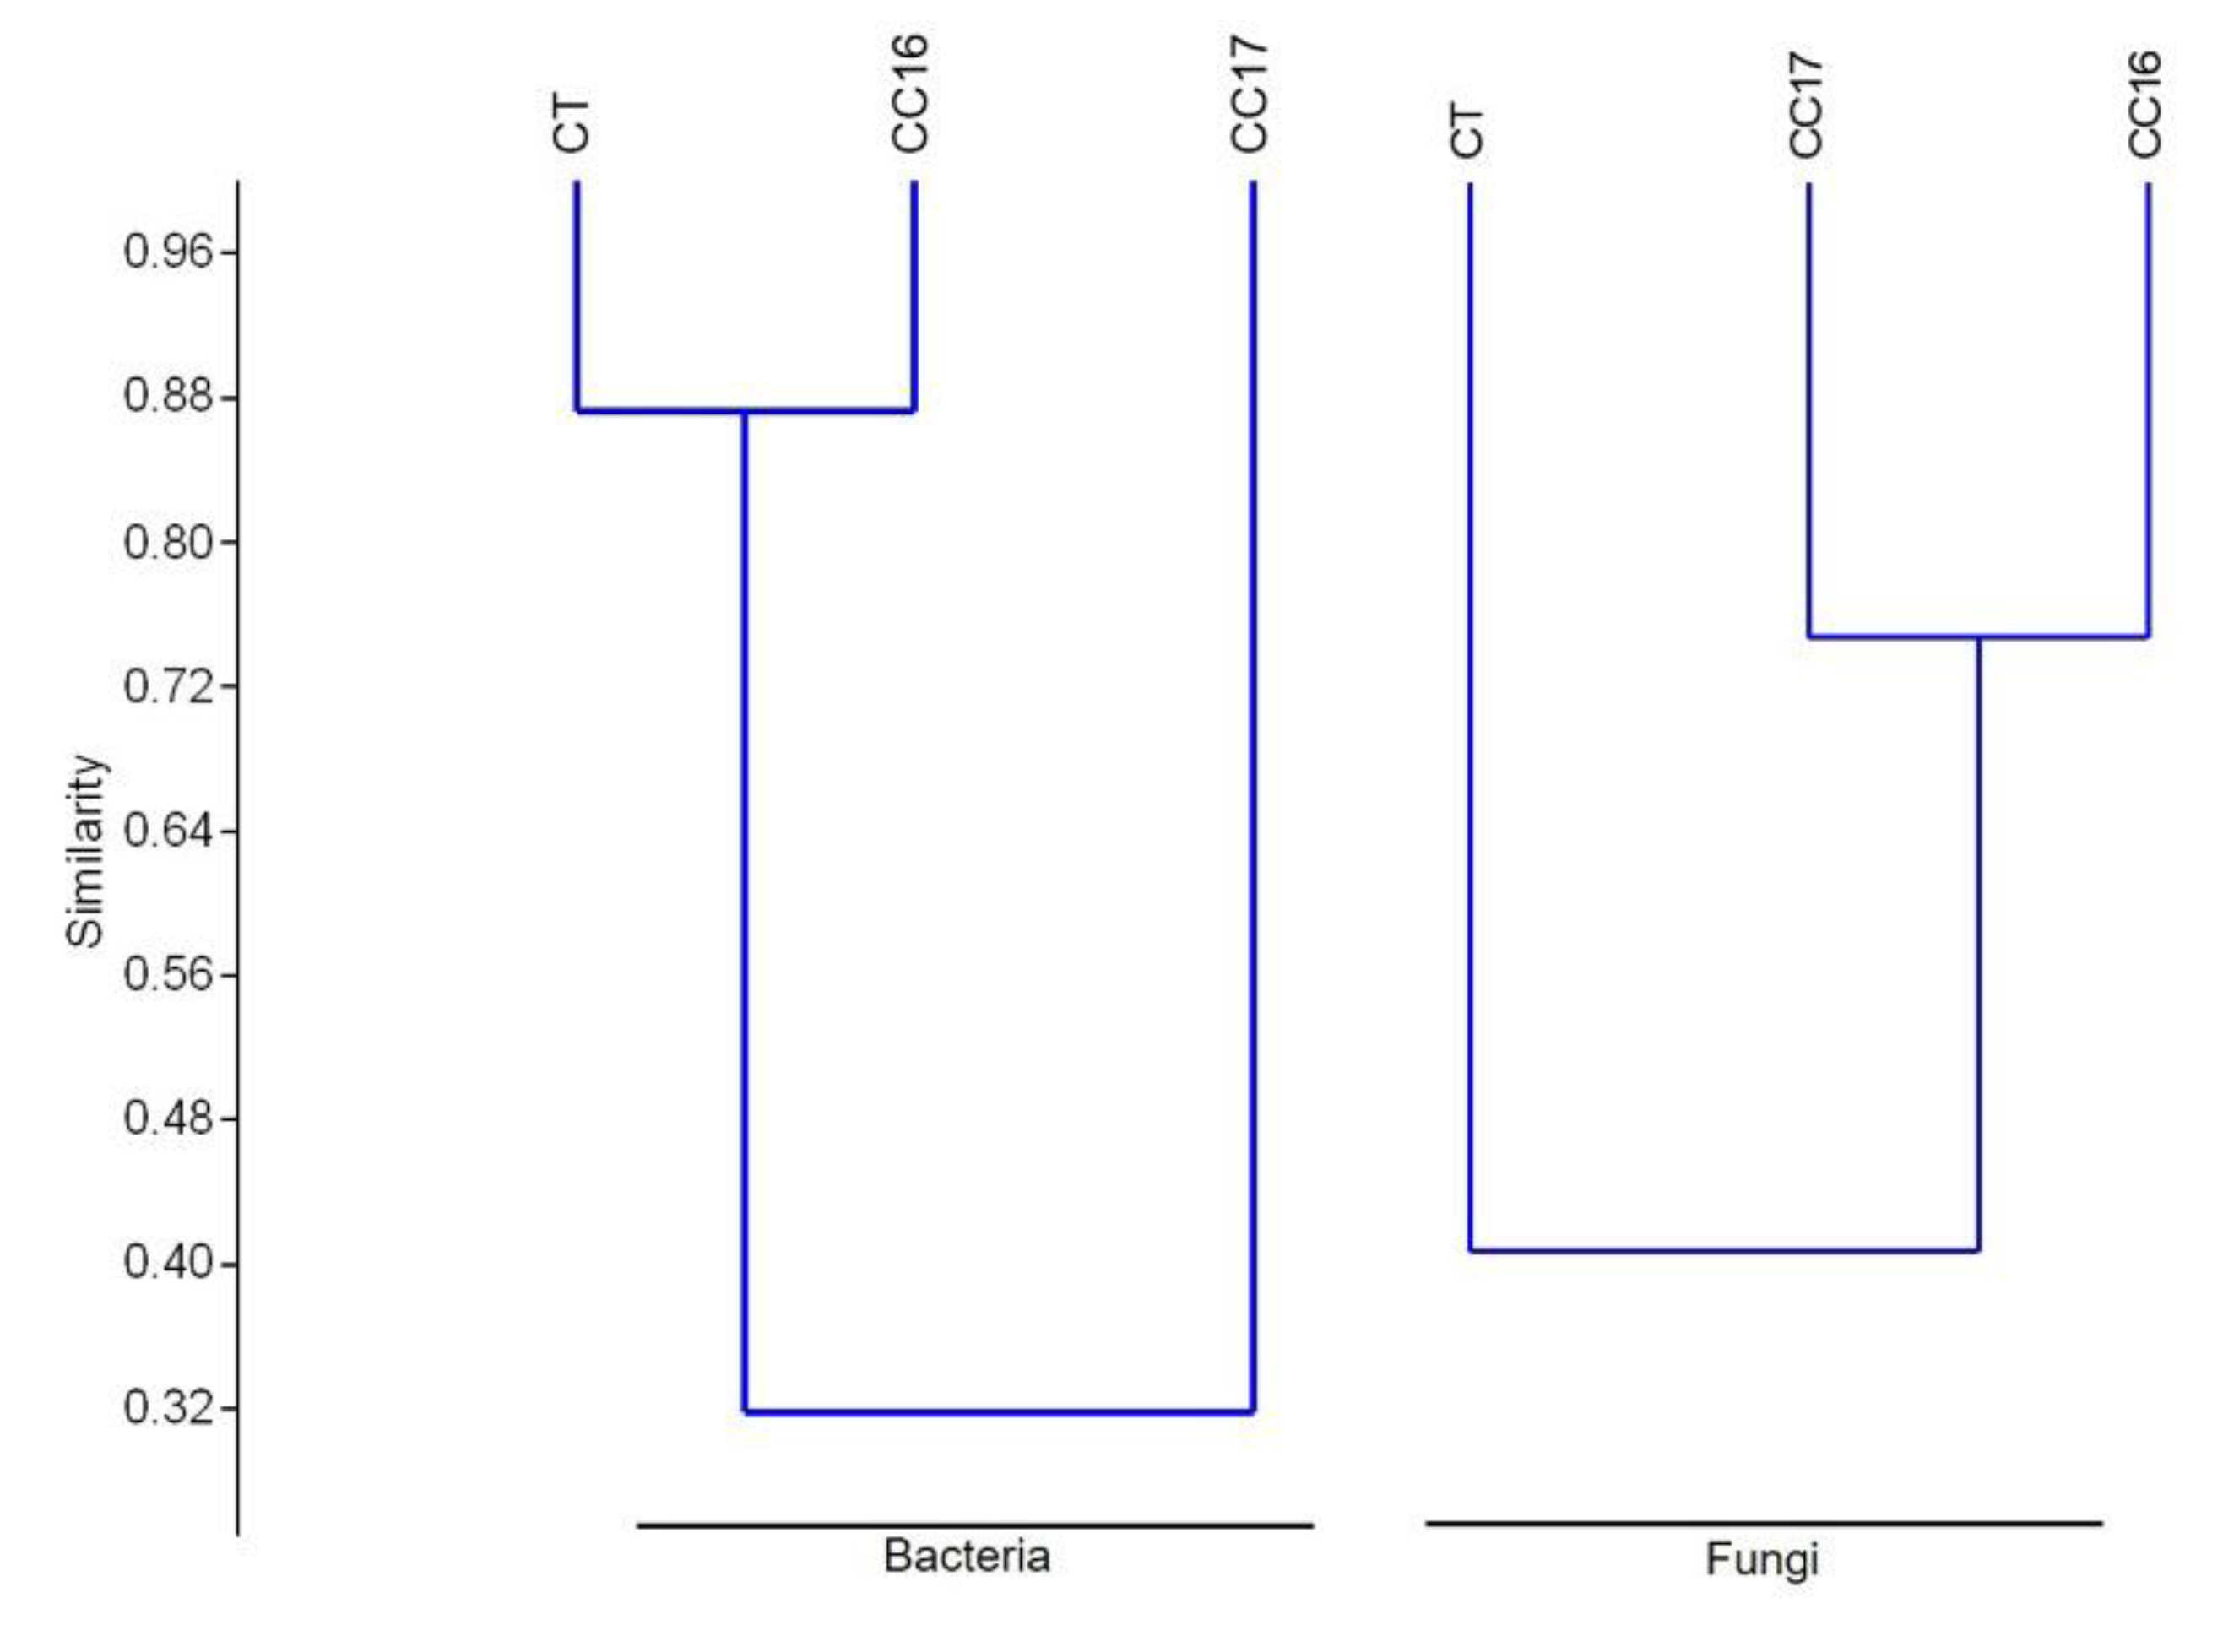
3.3. Soil Microbial Diversity

The 16S rDNA polymerase chain reaction-denaturing gradient gel electrophoresis (PCR-DGGE) was performed to compare the bacterial diversity in CC and CT soils. DGGE profiles were similar across samples with 33 discernible bands in each lane (data not shown). Such a finding was read as either indicating that the bacterial composition is not affected by different soil management or that DGGE is unable to detect differences in the bacterial structure of soils under the different treatments. Therefore, the automated ribosomal intergenic spacer analysis (ARISA) was performed to analyze the diversity of bacterial and fungal communities (Table 2). ARISA showed that prokaryotes diversity was lower than fungal diversity in all soils and that diversity indices were inversely influenced by soil management.
Fungal diversity indices, in fact, were higher in CT and tended to be reduced by the presence of cover crops; conversely higher bacterial diversity was detected in CC soil compared to CT. A cluster analysis based on the F-ARISA profiles separated the fungal communities of the CC16 and CC17 soils from that of the CT soil. Conversely, with regard to bacteria (B-ARISA), the CC16 and CT communities grouped together while the CC17 was clustered apart (Figure 5).

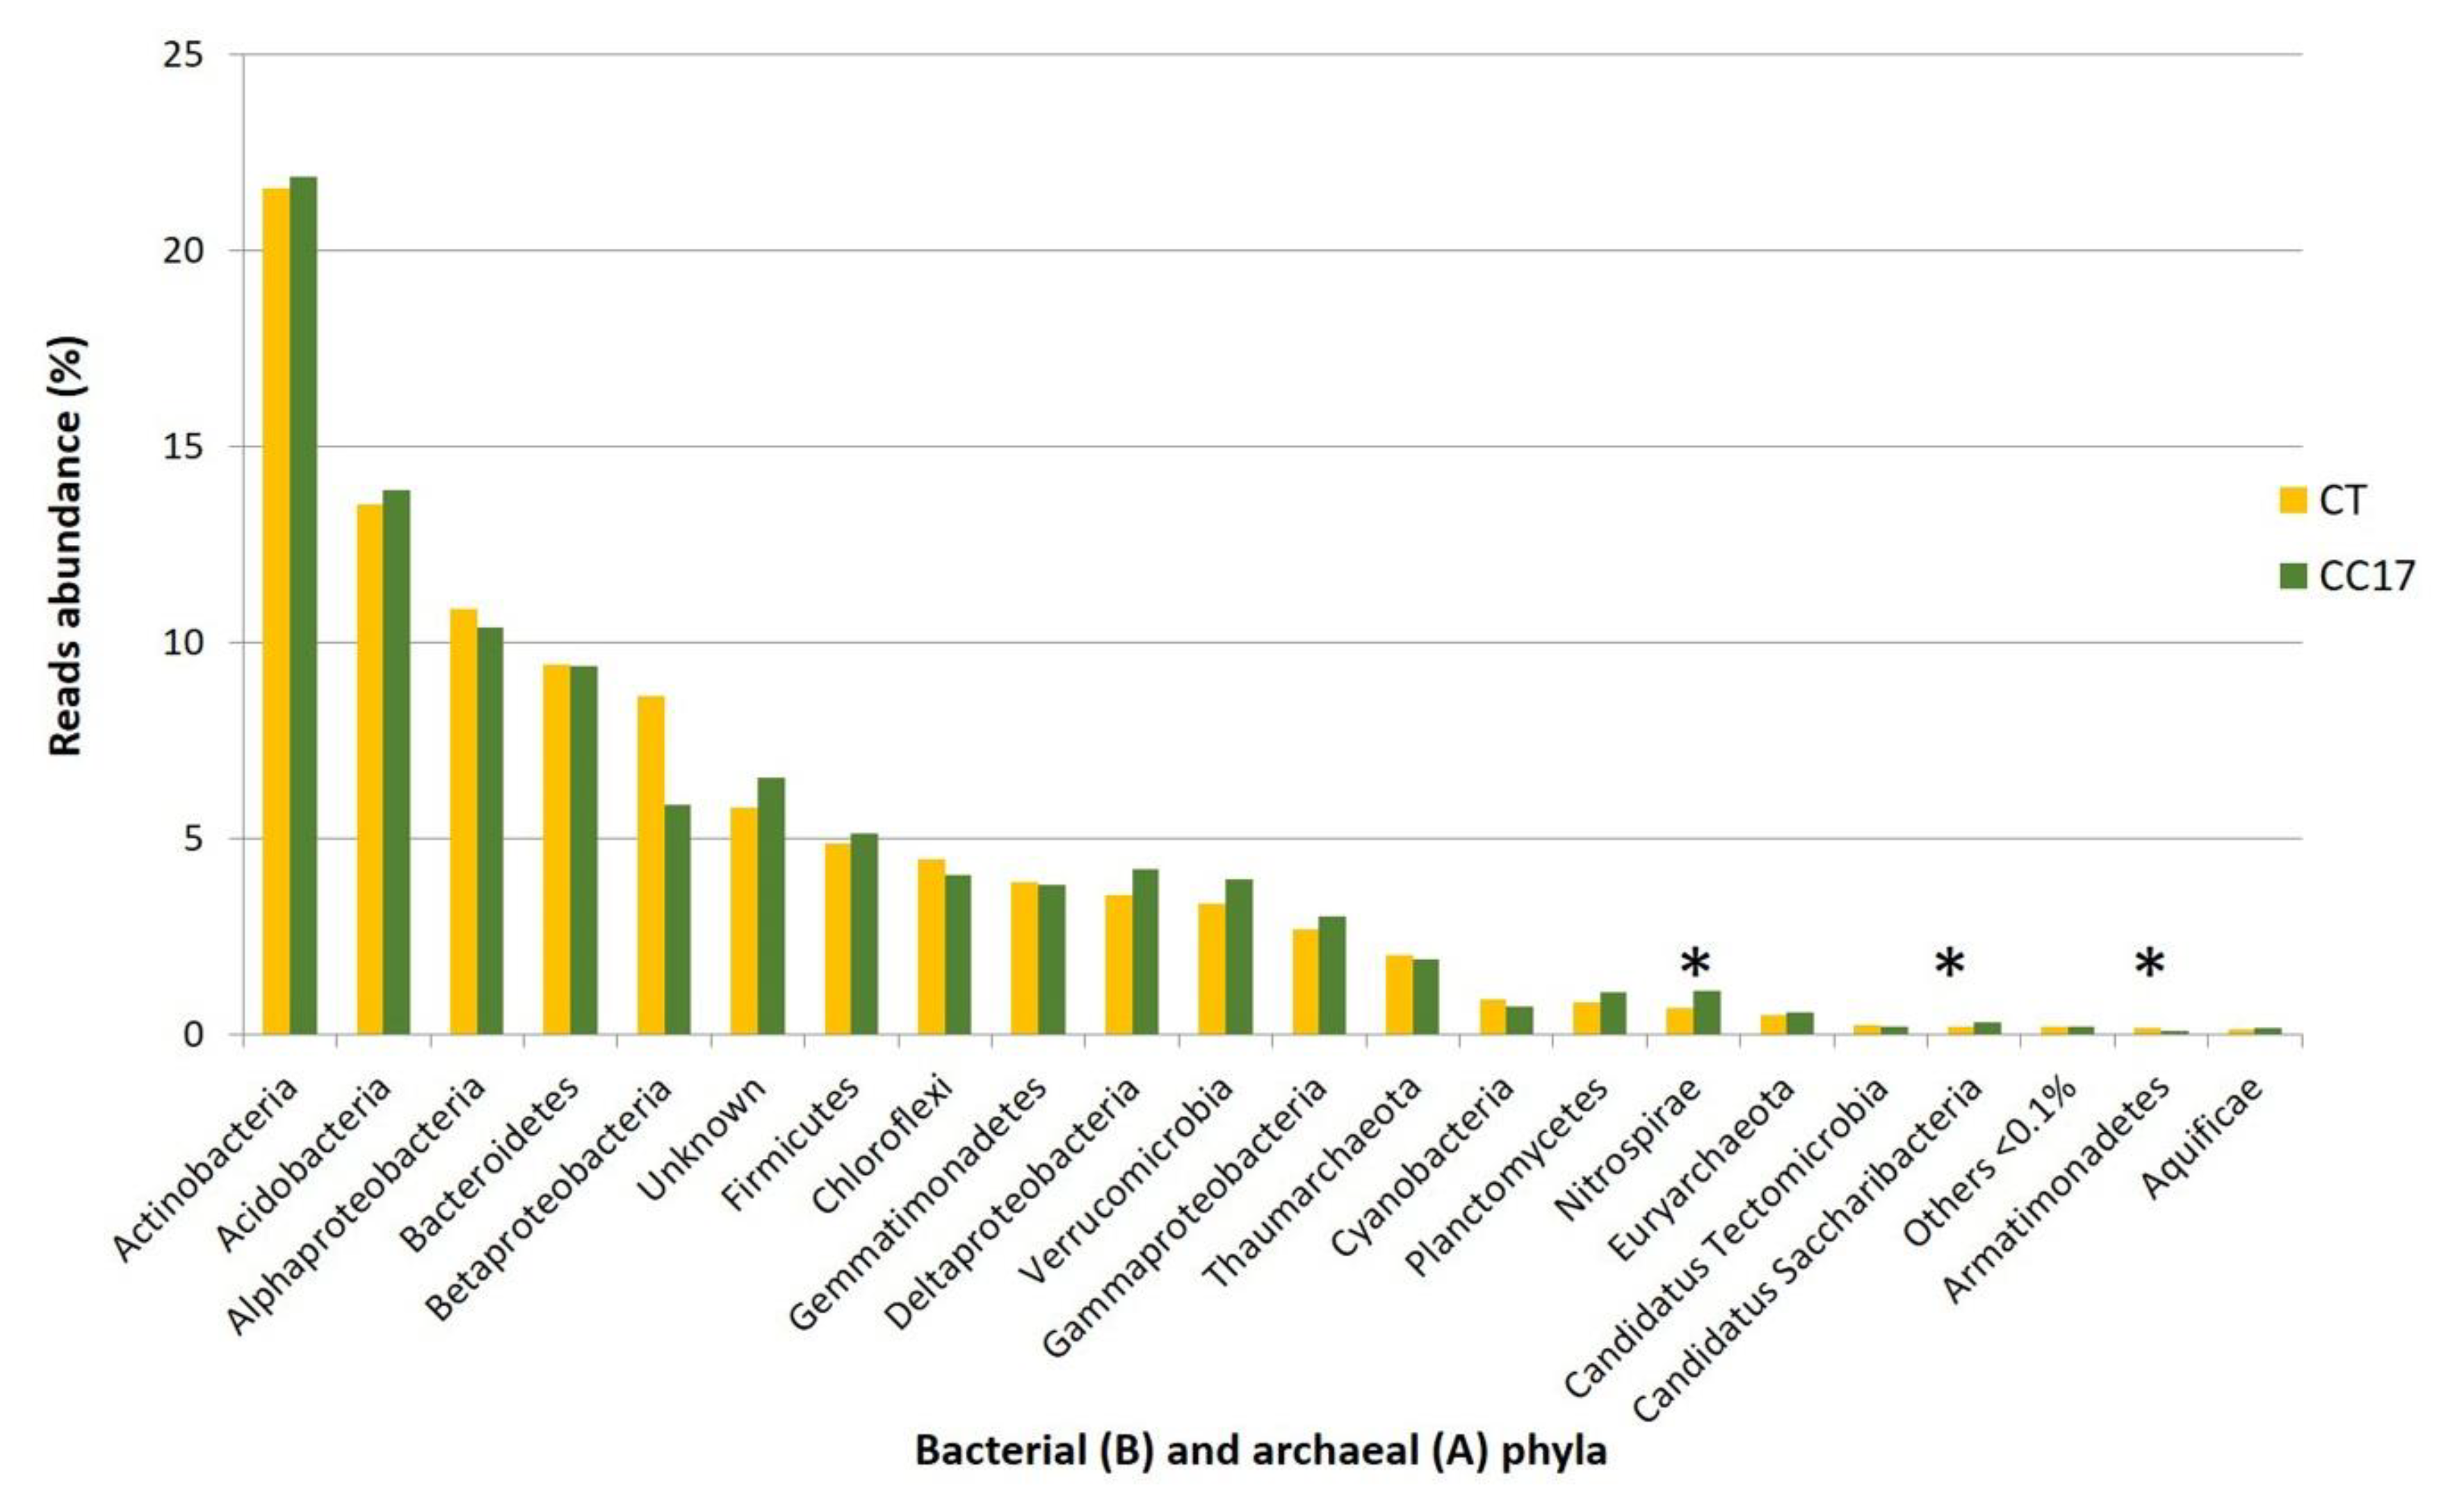
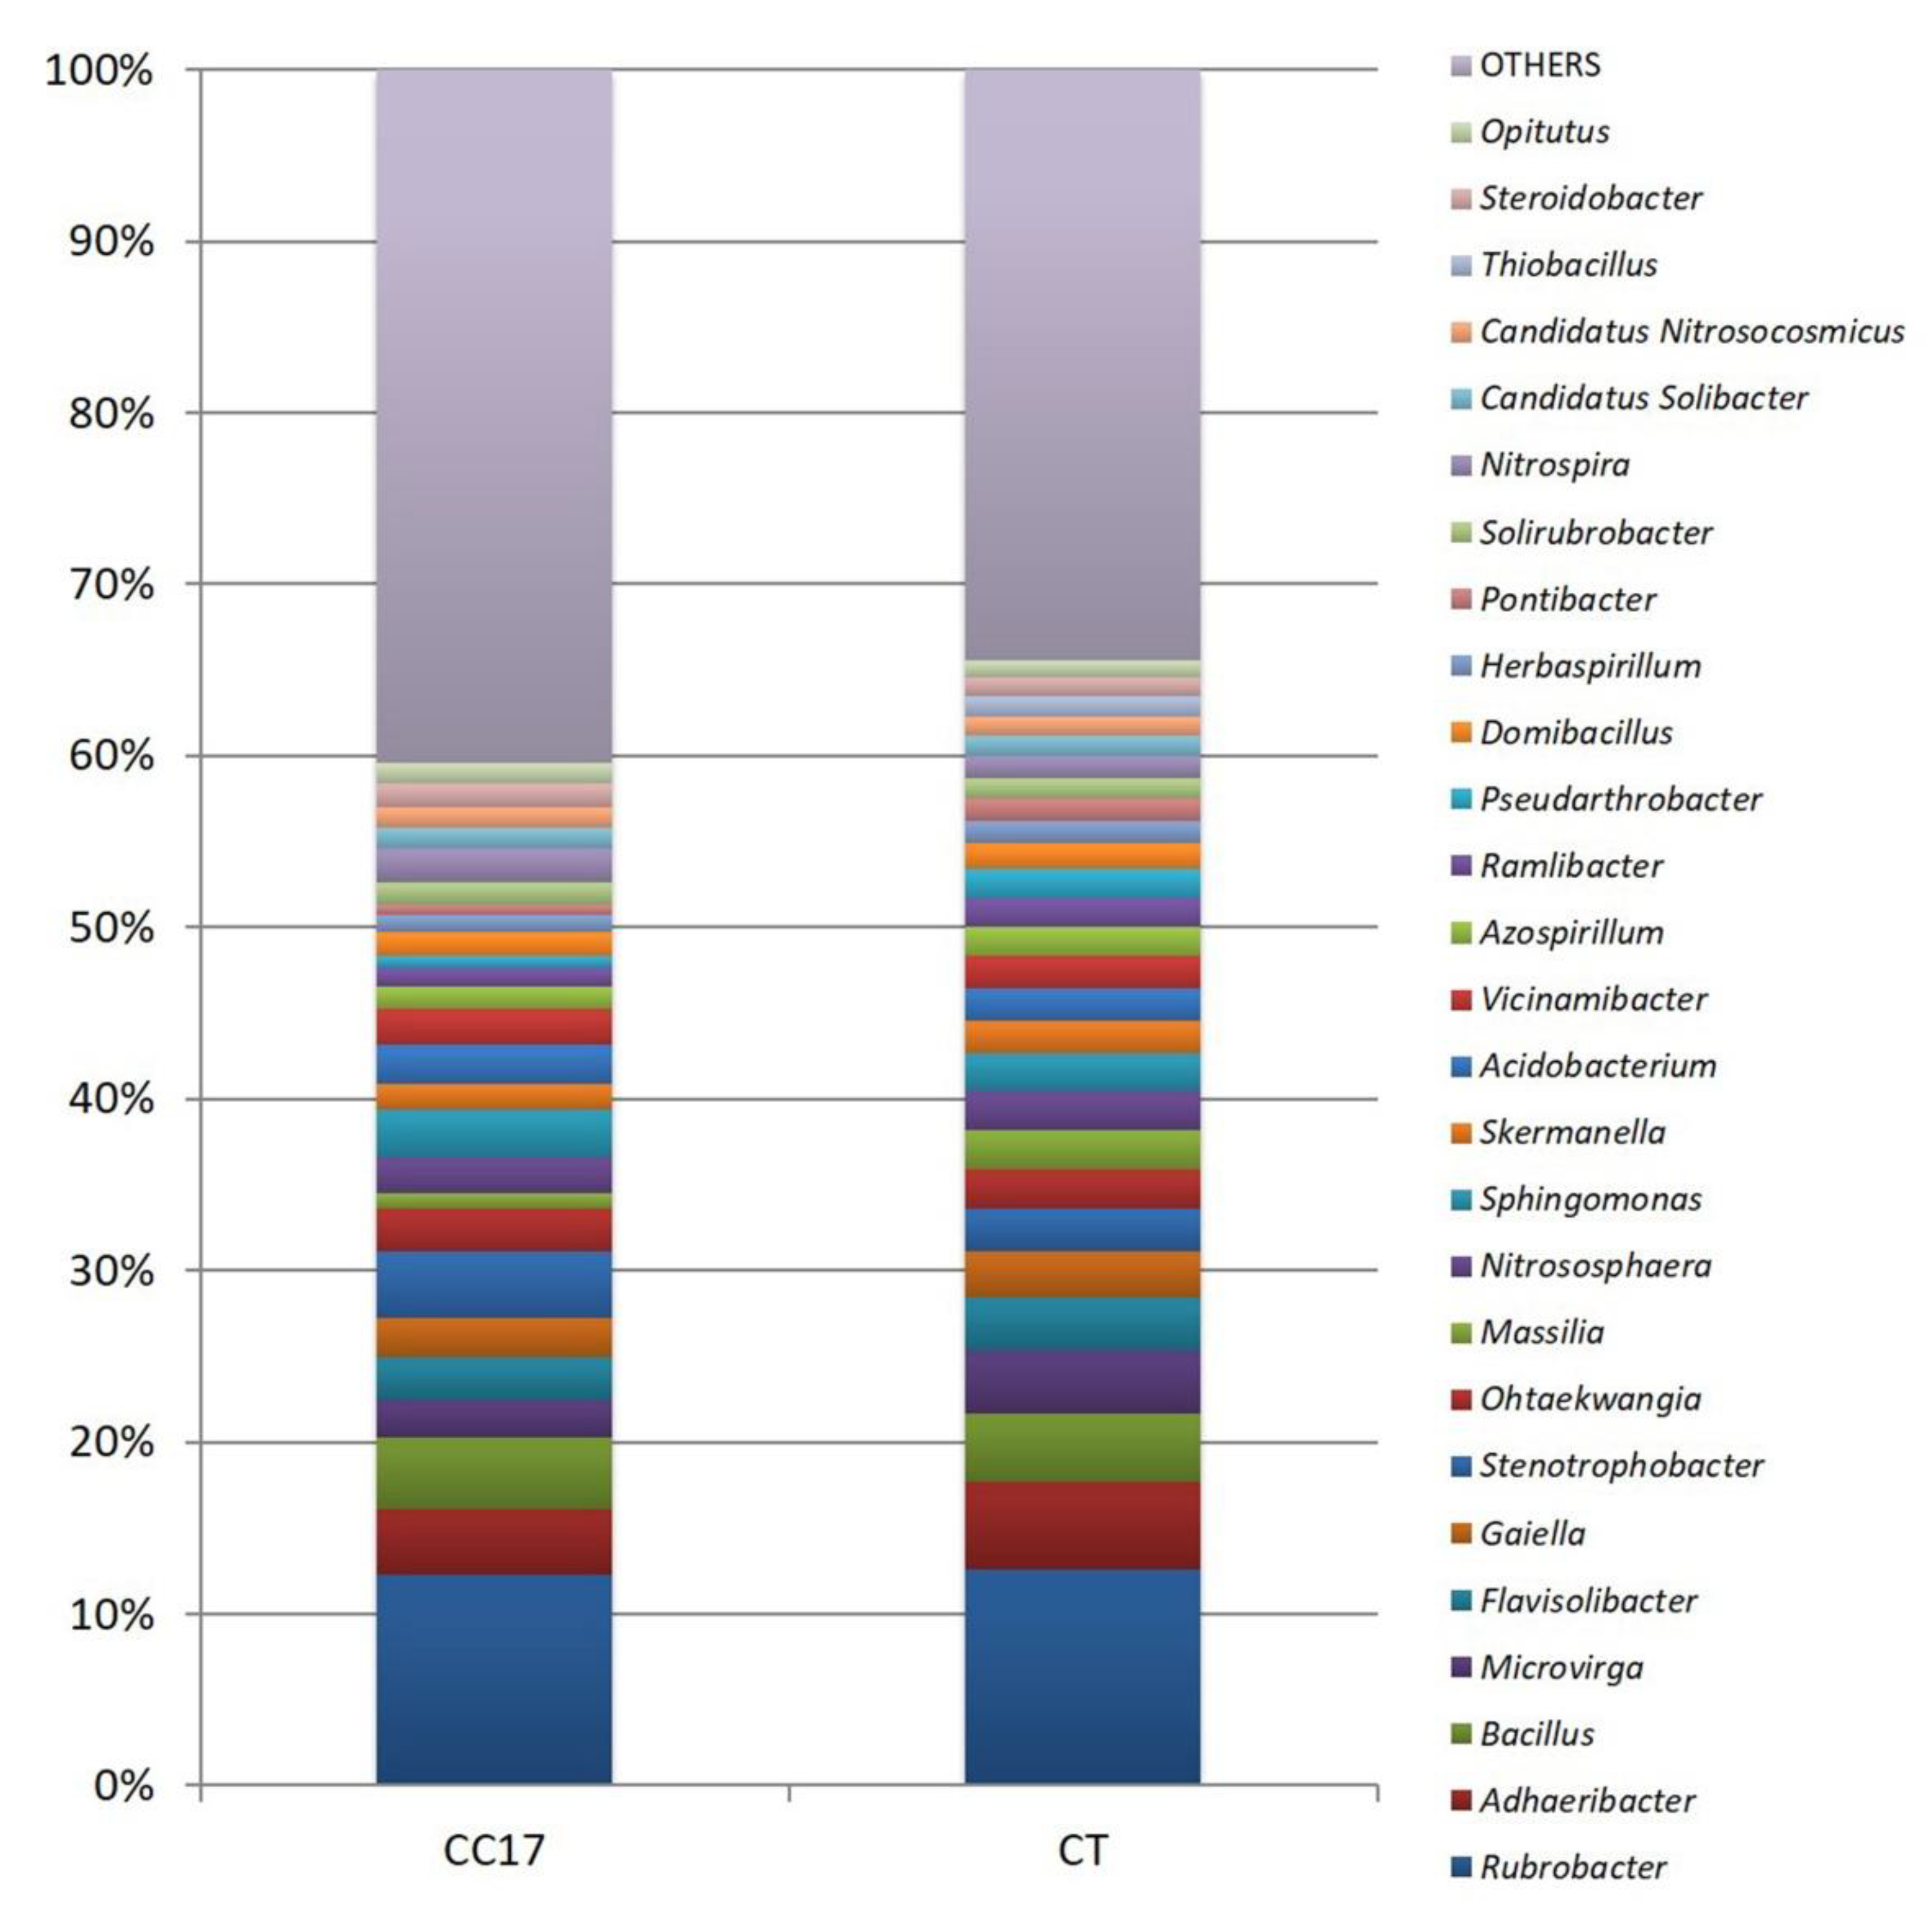
3.4. Diversity and Phylogenetic Composition of CC and CT Soil Bacterial Communities

The two soil treatments that showed a higher distance between their bacterial communities in the B-ARISA, CT and CC17, were analyzed to a finer level by the high throughput sequencing of the bacterial 16SrRNA gene. High throughput sequencing of the 16S rRNA gene was performed on CT and CC17 soil DNA, obtaining 92,148 and 54,387 raw sequences, respectively, which were reduced to 80,968 and 44,034 after filtering. The rarefaction curves of the two libraries reach a plateau, showing that both soil communities are well represented in the libraries, with a coverage of more than 99% (Supplementary Figure S1). The alpha diversity calculated up to the genus level was generally slightly higher in the CC soil, confirming the general assumption that cover crops increase soil microbial diversity [45,46]. Two of the main diversity indices, namely Shannon and Fisher calculated on ARISA profiles and 16S rRNA gene sequencing, were coherently (although slightly) higher for the CC bacterial assemblage than for the CT one (Table 3). Beta diversity between the two soil bacterial communities was as low: 0.032 at Phylum level and raised to 0.068 at the Genus level (data not shown).
More than 96% of the sequences were assigned to the Bacteria domain and only 2.5% to the Archaea, whereas 1.27% and 0.96% of the sequences resulted unknown for CC and CT soils, respectively.
At the phylum level, both CC17 and CT soils were dominated by Actinobacteria (CC17 21.59%; CT 21.90%), Acidobacteria (CC17 13.54%; CT 13.88%), Alphaproteobacteria (Proteobacteria were subdivided into subphyla, CC17 10.88%; CT 10.4%), Bacteroidetes (CC17 9.44%; CT 9.42%) and Betaproteobacteria (CC17 8.7%; CT 5.88%), whose total abundance encompassed 64% and 61.5% of the whole sequences for CC17 and CT, respectively. Other less represented phyla (<5%) were Firmicutes, Chloroflexi, Gemmatimonadetes, Deltaproteobacteria, Verrucomicrobia, Gammaproteobacteria and Thaumarchaeota (Archaea). About 6% of the sequences resulted unknown (Figure 6). Interestingly, NGS revealed some differences among the less abundant phyla, namely Nitrospirae, Candidatus Saccharibacteria and Armatimonadetes (Figure 6).
We arbitrarily established to consider as differentially abundant those taxa showing a CC/CT or CT/CC ratio of >1.5. Nitrospirae was 1.63-fold more abundant in the CC soil; this phylum contains only one class, Nitrospira, which itself contains one order (Nitrospirales) and one family (Nitrospiraceae). It includes multiple genera, such as Nitrospira, which plays a role in the nitrogen cycle as it was demonstrated to be capable of performing complete nitrification [47].
Cover crops have a stimulating effect also on the Candidatus Saccharibacteria phylum (CC/CT: 1.55), formerly known as Candidate Division TM7. Saccharibacteria are widespread in nature, from soil, sediment and wastewater habitats to animals [48]. Their ability to degrade polysaccharides via extracellular enzymes has been deduced from genomic analyses and they appear to respond quickly to plant polysaccharide addition in water [49], but this is the first report showing stimulation of this taxon by cover crops in agricultural soils.
Armatimonadetes, conversely, were more abundant in the CT plot (CT/CC = 1.64). This phylum is known as capable of consumption of ammonium in bioreactors [50] but no direct effect on the nitrogen cycle in soils has been reported so far.
At the order level, considering only those orders with an abundance of >0.1%, cover crops have a stimulating effect mainly on Flavobacteriales (CC17/CT ratio: 11) and less pronounced on Xanthomonadales, Desulfuromonadales, Frankiales, Kallotenuales, Nitrospirales and Chthoniobacterales, with a CC17/CT ratio between 1.89 and 1.52.
More than 53% of the reads could not be assigned to known genera. Among the identified genera, Rubrobacter was dominant in both soils (CC17 5.68% and CT 5.83%), followed by Adhaeribacter, Bacillus, Microvirga, Flavisolibacter, Gaiella and Stenotrophobacter in the CT soil and by Bacillus, Stenotrophobacter, Adhaeribacter, Sphingomonas, Ohtaekwangia and Flavisolibacter in the CC17 soil (Figure 7). Rubrobacter belongs to the order Rubrobacteriales in the phylum Actinobacteria (Acidimicrobidae, Rubrobacteridae). This order is highly represented in extremely hot and/or acidic ecosystems or habitats with severe radiation/desiccation conditions, such as deserts and other arid regions [51] but not in rainier areas of the same region [52].
Considering only genera showing relative abundance greater than 0.5%, the genera Stenotrophobacter, Nitrospira and Streptomyces were more abundant in CC17 (CC17/CT ratio > 1.5), while the genera Microvirga, Massilia, Ramlibacter, Pseudarthrobacter, Pontibacter and Thiobacillus were more abundant in the CT plot (Table 4). Among the genera more abundant in CC17, the genus Stenotrophobacter belongs to an as yet enigmatic bacterial phylum known as the Acidobacteria, which is characterized by an oligotrophic lifestyle; this genus was only described in 2015 for isolates from arid soils in Namibia [53] and its role in soil is as not yet known. Higher abundance of the nitrifiers Nitrospira in CC soil accounted for the difference also detected at the phylum level (Nitrospirae). Members of this genus perform nitrification through complete ammonia oxidation [47].
The genus Streptomyces (phylum Actinobacteria) includes most plant growth-promoting species (PGPR) and its increased abundance under cover crops is an explanation of the positive effect that cover crops have on soil health. [45,54].

4. Discussion

Encouraging sustainability in viticulture requires increasing knowledge of all the issues related to soil management in response to provided vineyard ecosystem services.
Although several studies indicated the positive effect of cover crops management in vineyards, the present study contributes to provide additional information on the role of leguminous cover crops in a semiarid environment. The strategies to maintain a sustainable wine production are site-specific and should not be equally applied for all viticulture areas; the right choice of techniques of management needs to be adjusted according to the environmental characteristics. Contrarily to other studies, findings of this work showed that temporary cover crop management does not have a relevant effect on SOC increase in the short term.
After 8 years of cover crop application in the vineyard, carbon sequestration rate was minimal (0.1 g kg−1 y−1), indicating that in semi-arid environments more efforts should be made to tune a proper management protocol. The negligible effect of cover crop soil management on SOC confirmed the results of previous experiments in semiarid environments, where a moderate SOC increase was recorded in CC management after a few years of application and an achievement of a steady state level [55]. The latter authors, moreover, analyzing one hundred vineyards in semiarid climates, found, after 5 years of CC adoption, a carbon sequestration rate ranging from 0 in soil with SOC content higher than 6.6 g kg−1 to 0.2 g kg−1 y−1 in soil with lower SOC level. Therefore, the limited effectiveness of cover crop management in increasing SOC can be attributed to the high initial level of SOC and to the C biomass input of temporary cover crop. Moreover, the vineyards being in a flat area, there is no effect of cover crops in preserving eroded carbon and therefore the SOC differences between CC and CT are minimal [56]. Hence, more attention should be addressed to the management of cover crops, including species, time and area of coverage and type of burying. The low ecosystem service provided by cover crop on carbon stock increase and the consequent reduction of atmospheric CO2 concentration in such an environment could be attributed to the low amount of biomass input due to the alternate inter-row and temporary cover crop management. Conversely, our findings showed a relevant increase of nitrate content under CC16 and CC17, which was helpful for reducing the mineral nitrogen fertilization input, thus increasing the sustainability of the vineyard system. It could be hypothesized that during cover crop season, under CC17, the soil nitrate fraction is reduced by plant and microbe assimilation and released in higher amounts during the following season. Knowledge on soil nitrate availability after cover crop burying could be important for improving vine nitrogen fertilization efficiency, thus protecting the health of the vineyard’s soil and of the environment.
In this study we addressed the role of soil microorganisms as the main players of key soil functions that can accelerate or mitigate the impact of agriculture on climate change [57]. Considering the influence of soil management on soil microbial communities, increasing evidence has demonstrated that agricultural practices, such as fertilization, tillage, crop rotation and cover crops alter soil microbial communities [58], which in their turn influence the agroecosystem functions. The introduction of cover crops, and hence the supply of extra fresh substrate, stimulated microbial growth with a concomitant increase in substrate mineralization. Such a stimulation was confirmed by higher biological available C and total C mineralized, as well as lower MRT in CC17, since the soil under this management was covered by Vicia faba during the sampling year. Our findings indicate that although the expected increase of SOC in CC soils [59,60] is not significant, cover crops management may change the soil organic matter quality, rather than its quantity, by increasing its living component and the fraction available for soil microorganisms. The accumulation of C in soil is dependent on a balance between fresh C inputs and SOC respiration. Soil microorganisms, while processing plant inputs, also increase SOC respiration, but they are able to synthesize a chemically diverse and more stable SOM [61].
This work contributes to extending the knowledge on the effects of buried legume cover crops in relation to the soil microbiota in semiarid vineyards. While DGGE failed to catch any difference between the soil microbial communities as an effect of different soil managements, the alternative fingerprinting approach with ARISA was able to detect the effects of cover crops on bacterial and fungal diversity, revealing opposite trends: fungal diversity is enhanced under conventional tillage while bacterial diversity is increased by cover crops. Cover crops and reduced tillage are generally favorable to mycorrhizal fungi that become dominant in the fungal assemblage, reducing the fungal diversity; conversely, frequent tillage and bare soil reduce and disrupt the mycorrhizal mycelial networks and reduce colonization of roots and soil [45], thus resulting in a reduced fungal dominance and higher diversity. The frequent tillage in CT shapes the fungal assemblage, which results differently from both CC fungal assemblages either with or without cover in the year of sampling. On the other hand, higher bacterial diversity was found in the CC soil compared to CT, and this was probably due to the greater resource diversity and more consistent nutrient supply by plants [62].
The CC16 bacterial community structure (from the inter-row without cover crop in the year of sampling) rapidly converged towards the structure of the CT community because of the absence of cover plants, indicating that bacterial communities are more influenced by CC than by tillage. In fact, the CC16 bacterial assemblage was closer to that of the CT than to the CC17, indicating that the effect of cover crop in CC16 was almost lost during one year of bare soil. Concerning bacterial diversity, we found an unexpected stability of the bacterial assemblages under different soil managements, with most diversity indices only slightly higher in CC. Beta diversity between CC and CT soils, assessed both by ARISA and on a finer level by high-throughput sequencing of bacterial 16S rRNA gene, was almost negligible. The most represented phyla were not differently abundant in the two soil plots.
Under temporary cover crop management, which is the alternative management applied by vine growers of semiarid Mediterranean areas, soil is tilled after spring and the inter-row without plant cover remains bare for the whole year. The presence of a cover crop for only a short period of the year has a reduced influence on bacterial communities and tillage, which is carried out to bury the cover crop, probably masks the beneficial effects of cover crops on microbial diversity.
The most abundant genus in both soil management, Rubrobacter, is indicative of the experimental area, which is characterized by a semiarid climate according to the De Martonne aridity index and is expected to become drier in the near future [5]. The genus Rubrobacter could be considered a marker of arid soils and its detection could be used as a warning of desertification processes.
Beyond diversity, relative abundances of specific taxa are considered useful parameters for predicting soil functions. The stimulating effect of CC on Nitrospira and on plant growth-promoting bacteria (Streptomyces) should not be overlooked. The genus Streptomyces (phylum Actinobacteria) includes most plant growth-promoting species (PGPR) and its increased abundance under cover crops is an explanation of the positive effect that cover crops have on soil health by stimulating the growth of disease-suppressive bacteria and PGPR [45,54]. Among the microbial functions that appear influenced by cover crops, nitrification deserves attention as we found comammox bacteria stimulated by cover crops in respect to canonical nitrifiers. On the other hand, the genus Massilia (alphaproteobacteria), a nitrate reducer often associated with organic farming [63], was more abundant in the CT soil. Nitrification in soil is generally carried out by microorganisms in a two-step process, first by ammonia-oxidizing bacteria (AOB) and ammonia-oxidizing archaea (AOA), followed by nitrite-oxidizing bacteria (NOB). Conversely, the recently discovered comammox Nitrospira are able to carry out complete ammonia oxidation [64]. Little is known about factors driving niche specialization between comammox and canonical ammonia oxidizers. Nitrospira seems better adapted to microarophylic conditions, and has a higher growth yield. Unlike canonical ammonia oxidizers, Nitrospira do not produce N2O via nitrifier denitrification, and this is of global interest considering that N2O is a greenhouse gas with a 300 times higher global warming potential than CO2 [65]. Our results suggest that these newly described nitrifiers are stimulated by the presence of legume cover crops [66] as well as by N fertilization as was already reported by [67], and their higher abundance could have a positive effect in reducing GHG emissions from agricultural soils.
Among the genera whose abundance is instead quantitatively more abundant under conventional tillage management, Pseudarthrobacter (Actinobacteria) is already known to be more abundant in bulk than in rhizosphere soils [46] but, more interestingly, the desiccation- and salt-tolerant genera Ramlibacter (Betaproteobacteria) [68] and Pontibacter (Bacteroidetes) [69,70] indicate more stressful conditions of tilled soil in respect to soil under temporary cover crop.
The genus Thiobacillus (Betaproteobacteria nitrosomonadales) is the most differentially abundant genus in the traditionally cultivated soil, as it was 24-fold more abundant in respect to the cover crop soil. The most studied species of this genus, Thiobacillus denitrificans, is an autotrophic denitrifier that utilizes reduced sulfur compounds as electron donors and grows chemoautotrophically, carrying out the dissimilatory transformation of nitrate or nitrite to N2 concomitant with energy conservation. This species is frequently isolated from all habitats including pond water and soils [71]. Its higher abundance in bulk soil could be related to the S treatments against plant pathogens that fall directly on a bulk soil.
Our findings showed that temporary cover crop management with leguminous species applied in semiarid vineyards is confirmed as a strategic tool to reduce nitrogen chemical fertilization and soil tillage, but it does not increase the expected carbon sequestration rate though it increases the soil microbial carbon pool and (only slightly) the soil microbial diversity. It is concluded that the positive effects of the CC management currently applied in most semiarid vineyards on ecosystem services are not maximized. Therefore, developing a proper management protocol for degraded and vulnerable vineyard soils is strongly required in order to align the agriculture of semiarid areas in Southern Europe with the objectives to preserve soil and achieve land degradation neutrality by 2030 [72].

Supplementary Materials

The following are available online at https://0-www-mdpi-com.brum.beds.ac.uk/2071-1050/12/8/3256/s1, Figure S1: Rarefaction curves indicating the quality of the two 16SrRNA gene libraries. The number of species increases with increasing of the number of reads; both the CT and the CC17 libraries reach a plateau, indicating that they are representative (99%) of the two bacterial communities.

Author Contributions

Conceptualization, A.N. and P.Q.; methodology, A.N., V.C.; software, V.C., M.T., P.Q.; validation, A.N., V.C. and P.Q.; formal analysis, A.N., V.C., P.Q., and M.T.; investigation, A.N., V.C., and M.T.; resources, A.N. and P.Q.; data curation, A.N., V.C., P.Q., and M.T.; writing—original draft preparation, A.N., V.C., P.Q., and M.T.; writing—review and editing, A.N., V.C., P.Q., M.T.; visualization, L.G., V.C., and P.Q.; supervision, M.S., L.G., V.A.L. And P.Q.; project administration, A.N., and P.Q.; funding acquisition, P.Q. All authors have read and agreed to the published version of the manuscript.

Funding

This research was partially funded by the “Fondo di Finanziamento Ricerca di Ateneo” FFR-D15.

Conflicts of Interest

The authors declare no conflict of interest. The funders had no role in the design of the study; in the collection, analyses, or interpretation of data; in the writing of the manuscript, or in the decision to publish the results.

References

  1. Pe’er, G.; Bonn, A.; Bruelheide, H.; Dieker, P.; Eisenhauer, N.; Feindt, P.H.; Hagedorn, G.; Hansjürgens, B.; Herzon, I.; Lomba, Â.; et al. Action needed for the EU Common Agricultural Policy to address sustainability challenges. People Nat. 2019. [Google Scholar] [CrossRef]
  2. Garcia, L.; Celette, F.; Gary, C.; Ripoche, A.; Valdés-Gómez, H.; Metay, A. Management of service crops for the provision of ecosystem services in vineyards: A review. Agric. Ecosyst. Environ. 2018, 251, 158–170. [Google Scholar] [CrossRef] [Green Version]
  3. Novara, A.; Cerdà, A.; Gristina, L. Sustainable vineyard floor management: An equilibrium between water consumption and soil conservation. Curr. Opin. Environ. Sci. Health 2018, 5, 33–37. [Google Scholar] [CrossRef]
  4. López-Vicente, M.; García-Ruiz, R.; Guzmán, G.; Vicente-Vicente, J.L.; Van Wesemael, B.; Gómez, J.A. Temporal stability and patterns of runoff and runon with different cover crops in an olive orchard (SW Andalusia, Spain). Catena 2016, 147, 125–137. [Google Scholar] [CrossRef] [Green Version]
  5. Baiamonte, G.; Minacapilli, M.; Novara, A.; Gristina, L. Time scale effects and interactions of rainfall erosivity and cover management factors on vineyard soil loss erosion in the semi-arid area of southern Sicily. Water 2019, 11, 978. [Google Scholar] [CrossRef] [Green Version]
  6. García-Díaz, A.; Bienes, R.; Sastre, B.; Novara, A.; Gristina, L.; Cerdà, A. Nitrogen losses in vineyards under different types of soil groundcover. A field runoff simulator approach in central Spain Agriculture. Ecosyst. Environ. 2017, 236, 256–267. [Google Scholar] [CrossRef]
  7. Peregrina, F.; Pérez-Álvarez, E.P.; Colina, M.; García-Escudero, E. Cover crops and tillage influence soil organic matter and nitrogen availability in a semi-arid vineyard. Arch. Agron. Soil Sci. 2012, 58, 95–102. [Google Scholar] [CrossRef]
  8. García-González, I.; Hontoria, C.; Gabriel, J.L.; Alonso-Ayuso, M.; Quemada, M. Cover crops to mitigate soil degradation and enhance soil functionality in irrigated land. Geoderma 2018, 322, 81–88. [Google Scholar] [CrossRef]
  9. Ingels, C.A.; Scow, K.M.; Whisson, D.A.; Drenovsky, R.E. Effects of cover crops on grapevines, yield, juice composition, soil microbial ecology, and gopher activity. Am. J. Enol. Vitic. 2005, 56, 19–29. [Google Scholar]
  10. Muscas, E.; Cocco, A.; Mercenaro, L.; Cabras, M.; Lentini, A.; Porqueddu, C.; Nieddu, G. Effects of vineyard floor cover crops on grapevine vigor, yield, and fruit quality, and the development of the vine mealybug under a Mediterranean climate Agriculture. Ecosyst. Environ. 2017, 237, 203–212. [Google Scholar] [CrossRef]
  11. Capó-Bauçà, S.; Marqués, A.; Llopis-Vidal, N.; Bota, J.; Baraza, E. Long-term establishment of natural green cover provides agroecosystem services by improving soil quality in a Mediterranean vineyard. Ecol. Eng. 2019, 127, 285–291. [Google Scholar] [CrossRef]
  12. Sanz-Cobena, A.; García-Marco, S.; Quemada, M.; Gabriel, J.L.; Almendros, P.; Vallejo, A. Do cover crops enhance N2O, CO2 or CH4 emissions from soil in Mediterranean arable systems? Sci. Total Environ. 2014, 466, 164–174. [Google Scholar] [CrossRef] [PubMed] [Green Version]
  13. Ramos, M.E.; Benitez, E.; Garcia, P.A.; Robles, A.B. Cover crops under different managements vs. frequent tillage in almond orchards in semiarid conditions: Effects on soil quality. Appl. Soil Ecol. 2010, 44, 6–14. [Google Scholar] [CrossRef]
  14. Ruiz-Colmenero, M.; Bienes, R.; Eldridge, D.J.; Marques, M.J. Vegetation cover reduces erosion and enhances soil organic carbon in a vineyard in the central Spain. Catena 2013, 104, 153–160. [Google Scholar] [CrossRef]
  15. Morlat, R.; Jacquet, A. Grapevine root system and soil characteristics in a vineyard maintained long-term with or without interrow sward. Am. J. Enol. Vitic. 2003, 54, 1–7. [Google Scholar]
  16. Celette, F.; Findeling, A.; Gary, C. Competition for nitrogen in an unfertilized intercropping system: The case of an association of grapevine and grass cover in a Mediterranean climate. Eur. J. Agron. 2009, 30, 41–51. [Google Scholar] [CrossRef]
  17. Laudicina, V.A.; Barbera, V.; Gristina, L.; Badalucco, L. Management practices to preserve soil organic matter in semiarid Mediterranean environments. In Soil Organic Matter: Ecology, Environmental Impact and Management; Björklund, P.A., Mello, F.V., Eds.; Nova Science Publishers: Hauppauge, NY, USA, 2012; pp. 39–61. [Google Scholar]
  18. Unkovich, M.J.; Pate, J. An appraisal of recent field measurements of symbiotic N2 fixation by annual legumes. Field Crops Res. 2000, 65, 211–228. [Google Scholar] [CrossRef]
  19. Romdhane, S.; Spor, A.; Busset, H.; Falchetto, L.; Martin, J.; Bizouard, F.; Bru, D.; Breuil, M.C.; Philippot, L.; Cordeau, S. Cover Crop Management Practices Rather than Composition of Cover Crop Mixtures Affect Bacterial Communities in No-Till Agroecosystems. Front. Microbiol. 2019, 10, 1618. [Google Scholar] [CrossRef]
  20. Lopes, C.M.; Monteiro, A.; Machado, J.P.; Fernandes, N.; Araújo, A. Cover cropping in a slopping non-irrigated vineyard: II—Effects on vegetative growth, yield, berry and wine quality of ‘Cabernet Sauvignon’ grapevines. Ciência Téc. Vitiv 2008, 23, 37–43. [Google Scholar]
  21. Delpuech, X.; Metay, A. Adapting cover crop soil coverage to soil depth to limit competition for water in a Mediterranean vineyard. Eur. J. Agron. 2018, 97, 60–69. [Google Scholar] [CrossRef]
  22. Novara, A.; Gristina, L.; Saladino, S.S.; Santoro, A.; Cerdà, A. Soil erosion assessment on tillage and alternative soil managements in a Sicilian vineyard. Soil Tillage Res. 2011, 117, 140–147. [Google Scholar] [CrossRef] [Green Version]
  23. Finney, D.M.; Buyer, J.S.; Kaye, J.P. Living cover crops have immediate impacts on soil microbial community structure and function. J. Soil Water Conserv. 2017, 724, 361–373. [Google Scholar] [CrossRef] [Green Version]
  24. Strickland, M.S.; Thomason, W.E.; Avera, B.; Franklin, J.; Minick, K.; Yamada, S.; Badgley, B.D. Short-Term Effects of Cover Crops on Soil Microbial Characteristics and Biogeochemical Processes across Actively Managed Farms. Agrosyst. Geosci. Environ. 2019, 2. [Google Scholar] [CrossRef] [Green Version]
  25. WRB 2006. IUSS Working Group World Reference Base for Soil Resources 2006; World Soil Resources Reports No. 103; FAO: Rome, Italy, 2006; ISBN 92-5-105511-4. [Google Scholar]
  26. Nelson, D.W.; Sommers, L.E. Total carbon, organic carbon, and organic matter. In Methods of Soil Analysis. Part 2. Chemical and Microbiological Properties, 2nd ed.; Page, A.L., Ed.; Agronomy Series No. 9, ASA; SSSA: Madison, WI, USA, 1996. [Google Scholar]
  27. Catania, V.; Santisi, S.; Signa, G.; Vizzini, S.; Mazzola, A.; Cappello, S.; Yakimov, M.M.; Quatrini, P. Intrinsic bioremediation potential of a chronically polluted marine coastal area. Mar. Pollut. Bull. 2015, 99, 138–149. [Google Scholar] [CrossRef]
  28. Muyzer, G.; De Waal, E.; Uittierlinden, A.G. Profiling of Complex Microbial Populations by Denaturing Gradient Gel Electrophoresis Analysis of Polymerase Chain Reaction-Amplified Genes Coding for 16S rRNA. Appl. Environ. Microbiol. 1993, 59, 695–700. [Google Scholar] [CrossRef] [Green Version]
  29. Catania, V.; Sarà, G.; Settanni, L.; Quatrini, P. Bacterial communities in sediment of a Mediterranean marine protected area. Can. J. Microbiol. 2016, 63, 303–311. [Google Scholar] [CrossRef]
  30. Catania, V.; Cappello, S.; Di Giorgi, V.; Santisi, S.; Di Maria, R.; Mazzola, A. Microbial communities of polluted sub-surface marine sediments. Mar. Pollut. Bull. 2018, 131, 396–406. [Google Scholar] [CrossRef]
  31. Djahnit, N.; Chernai, S.; Catania, V.; Hamdi, B.; China, B.; Cappello, S.; Quatrini, P. Isolation, characterization and determination of biotechnological potential of oil-degrading bacteria from Algerian centre coast. J. Appl. Microbiol. 2019, 126, 780–795. [Google Scholar] [CrossRef]
  32. Cardinale, M.; Brusetti, L.; Quatrini, P.; Borin, S.; Puglia, A.M.; Rizzi, A.; Zanardini, E.; Sorlini, C.; Corselli, C.; Daffonchio, D. Comparison of Different Primer Sets for Use in Automated Ribosomal Intergenic Spacer Analysis of Complex Bacterial Communities. Appl. Environ. Microbiol. 2004, 70, 6147–6156. [Google Scholar] [CrossRef] [Green Version]
  33. Ranjard, L.; Poly, F.; Lata, J.C.; Mougel, C.; Thioulouse, J.; Nazaret, S. Characterization of Bacterial and Fungal Soil Communities by Automated Ribosomal Intergenic Spacer Analysis Fingerprints: Biological and Methodological Variability. Appl. Environ. Microbiol. 2001, 67, 4479–4487. [Google Scholar] [CrossRef] [Green Version]
  34. Schuelke, M. An economic method for the fluorescent labeling of PCR fragments. Nat. Biotechnol. 2000, 182, 233–234. [Google Scholar] [CrossRef] [PubMed]
  35. Slabbert, E.; Kongor, R.Y.; Esler, K.J.; Jacobs, K. Microbial diversity and community structure in Fynbos soil. Mol. Ecol. 2010, 19, 1031–1041. [Google Scholar] [CrossRef] [PubMed]
  36. Takahashi, S.; Tomita, J.; Nishioka, K.; Hisada, T.; Nishijima, M. Development of a prokaryotic universal primer for simultaneous analysis of Bacteria and Archaea using next-generation sequencing. PLoS ONE 2014, 98, e105592. [Google Scholar] [CrossRef] [PubMed] [Green Version]
  37. Andrews, S. FastQC: A Quality Control Tool for High Throughput Sequence Data. 2010. Available online: http://www.bioinformatics.babraham.ac.uk/projects/fastqc (accessed on 13 November 2019).
  38. Bushnell, B. BBMap: A Fast. Accurate. Splice-aware Aligner No. LBNL-7065E; Lawrence Berkeley National Lab. (LBNL): Berkeley, CA, USA, 2014.
  39. Li, H.; Durbin, R. Fast and accurate short read alignment with Burrows–Wheeler transform. Bioinformatics 2009, 2514, 1754–1760. [Google Scholar] [CrossRef] [PubMed] [Green Version]
  40. Coordinators, N.R. Database resources of the National Center for Biotechnology Information NCBI Resource Coordinators. Nucleic Acids Res. 2016, 44, D7. [Google Scholar] [CrossRef] [Green Version]
  41. Mcmurdie, P.J.; Holmes, S.; Watson, M. phyloseq: An R Package for Reproducible Interactive Analysis and Graphics of Microbiome Census Data. PLoS ONE 2013, 84, e61217. [Google Scholar] [CrossRef] [PubMed] [Green Version]
  42. SPSS Inc. PASW Statistics for Windows; Version 18.0.; SPSS Inc.: Chicago, IL, USA, 2009. [Google Scholar]
  43. Marstorp, H.; Guan, X.; Gong, P. Relationship between dsDNA, chloroform labile C and ergosterol in soils of different organic matter contents and pH. Soil Biol. Biochem. 2000, 326, 879–882. [Google Scholar] [CrossRef]
  44. Anderson, T.H. Microbial Eco-Physiological Indicators to Asses Soil Quality. Agric. Ecosyst. Environ. 2003, 98, 285–293. [Google Scholar] [CrossRef]
  45. Vukicevich, E.; Lowery, T.; Bowen, P.; Úrbez-Torres, J.R.; Hart, M. Cover crops to increase soil microbial diversity and mitigate decline in perennial agriculture. A review. Agron. Sustain. Dev. 2016, 363, 48. [Google Scholar] [CrossRef] [Green Version]
  46. Schmidt, J.E.; Kent, A.D.; Brisson, V.L.; Gaudin, A.C. Agricultural management and plant selection interactively affect rhizosphere microbial community structure and nitrogen cycling. Microbiome 2019, 7, 146. [Google Scholar] [CrossRef] [Green Version]
  47. Daims, H.; Lebedeva, E.V.; Pjevac, P.; Han, P.; Herbold, C.; Albertsen, M.; Jehmlich, N.; Palatinszky, M.; Vierheilig, J.; Bulaev, A.; et al. Complete nitrification by Nitrospira bacteria. Nature 2015, 528, 504–509. [Google Scholar] [CrossRef] [PubMed]
  48. Ferrari, B.; Winsley, T.; Ji, M.; Neilan, B. Insights into the distribution and abundance of the ubiquitous candidatus Saccharibacteria phylum following tag pyrosequencing. Sci. Rep. 2014, 41, 1–9. [Google Scholar] [CrossRef] [PubMed] [Green Version]
  49. Taubert, M.; Stähly, J.; Kolb, S.; Küsel, K. Divergent microbial communities in groundwater and overlying soils exhibit functional redundancy for plant-polysaccharide degradation. PLoS ONE 2019, 143, e0212937. [Google Scholar] [CrossRef] [PubMed] [Green Version]
  50. Zhang, Z.; Liu, S. Insight into the overconsumption of ammonium by anammox consortia under anaerobic conditions. J. Appl. Microbial. 2014, 1176, 1830–1838. [Google Scholar] [CrossRef] [PubMed]
  51. Mohammadipanah, F.; Wink, J. Actinobacteria from Arid and Desert Habitats: Diversity and Biological Activity. Front. Microbiol. 2016, 6, 1541. [Google Scholar] [CrossRef] [PubMed] [Green Version]
  52. Holmes, A.J.; Bowyer, J.; Holley, M.P.; O’Donoghue, M.; Montgomery, M.; Gillings, M.R. Diverse.; yet-to-be-cultured members of the Rubrobacter subdivision of the Actinobacteria are widespread in Australian arid soils. FEMS Microbiol. Ecol. 2000, 332, 111–120. [Google Scholar] [CrossRef]
  53. Pascual, J.; Wüst, P.K.; Geppert, A.; Foesel, B.U.; Huber, K.J.; Overmann, J. Novel isolates double the number of chemotrophic species and allow the first description of higher taxa in Acidobacteria subdivision 4. Syst. Appl. Microbiol. 2015, 388, 534–544. [Google Scholar] [CrossRef] [PubMed]
  54. De Jesus Sousa, J.A.; Olivares, F.L. Plant growth promotion by streptomycetes: Ecophysiology, mechanisms and applications. Chem. Biol. Technol. Agric. 2016, 31, 24. [Google Scholar] [CrossRef] [Green Version]
  55. García-Díaz, A.; Allas, R.B.; Gristina, L.; Cerdà, A.; Pereira, P.; Novara, A. Carbon input threshold for soil carbon budget optimization in eroding vineyards. Geoderma 2016, 271, 144–149. [Google Scholar] [CrossRef] [Green Version]
  56. Novara, A.; Minacapilli, M.; Santoro, A.; Rodrigo-Comino, J.; Carrubba, A.; Sarno, M.; Venezia, G.; Gristina, L. Real cover crops contribution to soil organic carbon sequestration in sloping vineyard. Sci. Total Environ. 2019, 652, 300–306. [Google Scholar] [CrossRef]
  57. Cavicchioli, R.; Ripple, W.J.; Timmis, K.N.; Azam, F.; Bakken, L.R.; Baylis, M.; Behrenfeld, M.J.; Boetius, A.; Boyd, P.W.; Classen, A.T.; et al. Scientists’ warning to humanity: Microorganisms and climate change. Nat. Rev. Microbiol. 2019, 17, 569–586. [Google Scholar] [CrossRef] [PubMed] [Green Version]
  58. Fernandez, A.L.; Sheaffer, C.C.; Wyse, D.L.; Staley, C.; Gould, T.J.; Sadowsky, M.J. Associations between soil bacterial community structure and nutrient cycling functions in long-term organic farm soils following cover crop and organic fertilizer amendment. Sci. Total. Environ. 2016, 566, 949–959. [Google Scholar] [CrossRef] [PubMed] [Green Version]
  59. Carrera, L.M.; Buyer, J.S.; Vinyard, B.; Abdul-Baki, A.A.; Sikora, L.J.; Teasdale, J.R. Effects of cover crops. compost. and manure amendments on soil microbial community structure in tomato production systems. Appl. Soil Ecol. 2007, 37, 247–255. [Google Scholar] [CrossRef]
  60. Buyer, J.S.; Teasdale, J.R.; Roberts, D.P.; Zasada, I.A.; Maul, J.E. Factors affecting soil microbial community structure in tomato cropping systems. Soil Biol. Biochem. 2010, 42, 831–841. [Google Scholar] [CrossRef]
  61. Kallenbach, C.; Frey, S.; Grandy, A. Direct evidence for microbial-derived soil organic matter formation and its ecophysiological controls. Nat. Commun. 2016, 7, 13630. [Google Scholar] [CrossRef]
  62. Schmidt, R.; Gravuer, K.; Bossange, A.V.; Mitchell, J.; Scow, K. Long-term use of cover crops and no-till shift soil microbial community life strategies in agricultural soil. PLoS ONE 2018. [Google Scholar] [CrossRef]
  63. Bonanomi, G.; De Filippis, F.; Cesarano, G.; La Storia, A.; Ercolini, D.; Scala, F. Organic farming induces changes in soil microbiota that affect agro-ecosystem functions. Soil Biol. Biochem. 2016, 103, 327–336. [Google Scholar] [CrossRef]
  64. Beeckman, F.; Motte, H.; Beeckman, T. Nitrification in agricultural soils: Impact, actors and mitigation. Curr. Opin. Biotechnol. 2018, 50, 166–173. [Google Scholar] [CrossRef]
  65. IPCC. Working Group I Contribution to the IPCC Fifth Assessment Report: Climate Change 2013: The Physical Science Basis; Summary for Policymakers; IPCC: Geneva, Switzerland, 2013. [Google Scholar]
  66. Zhou, Y.; Zhu, H.; Fu, S.; Yao, Q. Variation in soil microbial community structure associated with different legume species is greater than that associated with different grass species. Front. Microbial. 2017, 31, 1007. [Google Scholar] [CrossRef]
  67. Orellana, L.H.; Chee-Sanford, J.C.; Sanford, R.A.; Löffler, F.E.; Konstantinidis, K.T. Year-round shotgun metagenomes reveal stable microbial communities in agricultural soils and novel ammonia oxidizers responding to fertilization. Appl. Environ. Microbiol. 2018, 84, e01646-17. [Google Scholar] [CrossRef] [Green Version]
  68. Subhash, Y.; Tushar, L.; Sasikala, C.; Ramana, C.V. Erythrobacter odishensis sp. nov. and Pontibacter odishensis sp. nov. isolated from dry soil of a solar saltern. Int. J. Syst. Evol. Microbiol. 2013, 6312, 4524–4532. [Google Scholar] [CrossRef]
  69. De Luca, G.; Barakat, M.; Ortet, P.; Fochesato, S.; Jourlin-Castelli, C.; Ansaldi, M.; Bastien, O. The cyst-dividing bacterium Ramlibacter tataouinensis TTB310 genome reveals a well-stocked toolbox for adaptation to a desert environment. PLoS ONE 2011, 69, e23784. [Google Scholar] [CrossRef]
  70. Wolińska, A.; Kuźniar, A.; Zielenkiewicz, U.; Banach, A.; Błaszczyk, M. Indicators of arable soils fatigue–Bacterial families and genera: A metagenomic approach. Ecol. Indic. 2018, 93, 490–500. [Google Scholar] [CrossRef]
  71. Shao, M.F.; Zhang, T.; Fang, H.H.P. Sulfur-driven autotrophic denitrification: Diversity; biochemistry; and engineering applications. Appl. Microbiol. Biotechnol. 2010, 885, 1027–1042. [Google Scholar] [CrossRef]
  72. ECA. European Court of Auditors Special Report n°33/2018: Combating Desertification in the EU: A Growing Threat in Need of More Action; ECA: Luxembourg, 2018. [Google Scholar]
Figure 1. (a) Vineyards selected for the study; (b) monthly rainfall (blue histograms) and monthly average temperature (black dots) from January 2017 to February 2018.
Sustainability 12 03256 g001
Figure 2. Soil organic carbon (g kg−1) under cover crop 2017 (green histograms), cover crop 2016 (green stripes) and conventional tillage soil management (yellow histograms). Bars indicate standard error (n = 5).
Sustainability 12 03256 g002
Figure 3. Soil nitrate content (kg ha−1) under cover crop 2017 (green line), cover crop 2016 (green dotted line) and conventional tillage (yellow line) management. Bars indicate standard error (n = 3).
Sustainability 12 03256 g003
Figure 4. Soil CO2 flux during the incubation experiment in soil collected under conventional tillage (CT) (yellow line), cover crop 2016 (CC16) (green dotted line) and cover crop 2017 (CC17) (green line). Data were fitted to the following first-order decay function: mineralized C = Cr e− kt, where Cr is the readily mineral sable C at time zero, k is the decay rate constant and t is the time.
Sustainability 12 03256 g004
Figure 5. Cluster analysis of bacterial and fungal communities based on the ARISA profiles.
Sustainability 12 03256 g005
Figure 6. Relative abundance of bacterial and archaeal phyla in the CC and CT plot soils. Phyla showing abundances >0.1 are reported. Asterisks indicate CC/CT or CT/CC ratio > 1.5. “Others” includes all of the phyla below 0.1%.
Sustainability 12 03256 g006
Figure 7. Relative abundance of identified genera in the total bacterial communities of CC17 and CT soils. Only identified genera >0.5% are included. CC and CT assemblages include 53.9% and 53.7% of unknown sequences that are not included in the graph, respectively. OTHERS includes all of the other less abundant genera (<0.5%).
Sustainability 12 03256 g007
Table 1. Total microbial biomass (measured as µg DNA g−1 of soil dry weight), extractable organic carbon, biological available C, decay rate (k), mean residence time (MRT) and total C mineralized during the incubation period of soil sampled in July 2017 under conventional tillage (CT), cover crop 2016 (CC16) and cover crop 2017 (CC17) management. Values followed by the same letter indicate no significant difference among soil management types (CT, CC16 and CC17). # indicates that C mineralization data did not fit with the first-order decay function (Equation (1)).
CTCC16CC17
Total microbial biomass (µg DNAg−1 soil DW)6.59b12.72a11.87a
Extractable organic C (mg kg−1)21.22a17.99b20.32a
Biological available C (mg CO2-C kg−1) #41.76a43.23b
k#0.001b0.003a
MRT (1/k)#1000a333b
Total mineralized C (mg CO2-C kg−1)1028b1025b1034a
Table 2. Diversity indices of bacterial and fungal communities as calculated on automated ribosomal intergenic spacer analysis (ARISA) profiles.
IndexBacteria (B-ARISA)Fungi (F-ARISA)
CC16CC17CTCC16CC17CT
Taxa_S171411182229
Individuals445840693798459742874751
Dominance_D0.310.400.380.260.200.14
Simpson_1-D0.700.600.620.740.800.86
Shannon_H1.861.551.552.052.332.71
Evenness_e^H/S0.380.340.430.430.470.52
Brillouin1.841.541.542.042.322.69
Menhinick0.250.220.180.270.340.42
Margalef1.901.561.212.022.513.31
Equitability_J0.660.590.640.710.750.80
Fisher_alpha2.241.811.392.383.034.11
Berger-Parker0.530.620.600.480.420.35
Table 3. Alpha diversity indices calculated on the 16S rRNA gene sequence dataset.
Alpha DiversityPhylumClassOrderFamilyGenus
CC17CTCC17CTCC17CTCC17CTCC17CT
Observed252553539192138140263263
Chao1252553539192138140263263
Shannon2.192.162.932.893.023.012.902.912.732.69
Simpson0.850.840.920.910.880.880.800.810.700.71
Fisher2.562.405.955.5310.9710.2517.6416.4737.1533.80
Table 4. Comparison of the relative abundances of bacterial genera in the cover crop soil (CC17) and conventional soil (CT). Only genera above 0.5% in one of the two assemblages and showing a CC/CT or CT/CC ratio of ≥1.5 are reported.
Bacterial GeneraAbundance (Reads %)Abundance Ratio
CTCC17CC17/CTCT17/CC
Stenotrophobacter1.161.761.52
Nitrospira0.570.911.61
Streptomyces0.390.661.68
Microvirga1.710.99 1.72
Massilia1.070.40 2.69
Ramlibacter0.800.50 1.58
Pseudarthrobacter0.780.34 2.33
Pontibacter0.590.29 2.02
Thiobacillus0.540.02 23.77

