1. Introduction
Tourism has played a major role in the economic development of many regions around the world. Numerous areas with a real potential for tourism have made this industry the center of their development strategies, thus creating a major dependency on this activity for wealth generation and job creation [
1]. Indeed, tourism is one of the fastest growing economic activities at an international level [
2]. In some countries, the importance of tourism has even drawn level with that of other sectors that had previously been key to their development [
3]. Likewise, tourism plays an increasingly crucial role in the social development of various developing countries [
4]. According to recent forecasts, in the coming decades tourism will continue to register rapid growth at an international level [
5].
However, fluctuations in the levels of activity throughout the year have an impact on the positive effects associated with the development of this industry, as job stability and growth in economic income are undermined by these fluctuations [
6]. Seasonality is a phenomenon that affects many economic sectors, with the tourism industry being one of the most strongly impacted [
7]. Tourism seasonality can be defined as temporary variations in the number of visitors, expenditure, road traffic, and other forms of transport, as well as in employment and access to tourist attractions, etc. [
8]. This is a demand-side view of seasonality, although it can also be considered from a supply-side perspective [
9].
There is a vast amount of academic literature on tourism seasonality. However, despite the fact that it is a consequential and widely studied issue, it remains a poorly understood phenomenon [
10,
11]. Fluctuations in the levels of activity throughout the year can be considered one of the biggest challenges that companies in this sector must face, as they entail important negative effects on the economy, the environment, society, and the job market [
10,
12,
13,
14]. The intensity of seasonality influences the magnitude of the positive and negative impacts stemming from tourism. Therefore, the World Tourism Organization (WTO) considers seasonality as a fundamental concern in relation to the sustainability of tourism [
15]. The negative effects of seasonality are usually associated with peak seasons, as it is during these times that the overcrowding of a destination can have major impacts on the environment and society. Nonetheless, negative effects can also arise during off-seasons and, in this case, may influence the economy and the job market [
16].
From a purely economic perspective, seasonality poses major challenges in terms of the efficient use of resources [
17,
18]. The response of the tourism industry to seasonal variations in demand largely determines the productivity and efficiency of the sector in general, and hotels in particular [
19]. In this specific area, seasonality influences the revenue obtained, the expenditure, and the investment levels [
20]. The hotel sector’s response to fluctuations in demand focuses not only on optimizing occupancy and capacity levels [
21,
22], but also on input management [
23]. From an environmental point of view, extreme tourism seasonality increases the pressure on ecosystems due to the peaks in tourist arrivals [
10]. Therefore, a reduction in the intensity of tourism seasonality would help foster more homogeneous flows of tourists throughout the year. However, while the negative effects of tourism seasonality on the environment are well known, there are relatively few studies on the effects on companies affected by this seasonality. As such, there is a gap in the knowledge on the effect of tourism seasonality on the economic sustainability of companies.
Indeed, this paper focuses on the latter issue as it is aimed at analyzing the effects of seasonality on the efficiency with which hotel establishments operate. To that end, the sample of selected establishments is divided into two groups—those which remain open all year and those which only open in mid/high season—before carrying out a two-stage analysis: First, data envelopment analysis (DEA) is applied to assess the radial efficiency of each of the selected hotels; and second, directional distance functions (DDFs) are used to measure the degree of efficiency with which these hotels use each of the inputs that form part of their production process. Our major contribution to the literature [
24] is that the analysis accounts for the role played by each production factor (input) in the efficiency scores. Our study is also notable for the differences with respect to previous efficiency analyses focusing on seasonality in the hotel industry but using less specific efficiency techniques.
There are several reasons behind the choice of the Balearic Islands as the setting for this study. First, it is a well-established destination; indeed, it is one of the main tourist destinations in Europe, receiving 16.5 million tourists annually [
25]. In addition, the attractions and services it has to offer tourists are extensive and diverse, an important element for the development of this study. In 2016, there were a total of 2817 tourist accommodation establishments in this archipelago, which translates into 436,315 bed places [
26]. Added to this is the supply of regulated and unregulated tourist apartments. Finally, this archipelago suffers from the most intense tourism seasonality of all Spanish destinations [
12]. In 2018, in the month with the lowest number of tourists—January—this destination registered 204,552 visitors, while in July this figure reached 2,843,800 [
27].
The rest of this article is structured as follows: The
Section 2 reviews the key literature on the subject. The
Section 3 describes the production function of hotel companies and the data used for the empirical comparison. The
Section 4 summarizes the methodological aspects of the research. The
Section 5 presents and discusses the results obtained, taking into account both the hypotheses formulated in the
Section 3 and the previous literature, and the
Section 6 and
Section 7 summarizes the main conclusions of the study.
2. Economic and Environmental Implications of Tourism Seasonality
In this research, the concept of sustainability is approached from a broad perspective, because we focus on both environmental and economic aspects. It therefore seems appropriate to adopt the conceptual framework defined by The World Commission on Environment and Development (WCED), an institution that defines sustainable development as “development that meets the needs of the present without compromising the ability of future generations to meet their own needs” [
28] (p. 43). This vision of sustainability was incorporated into the political guidelines issued in the United Nations (UN) Conference on Environment and Development in Rio de Janeiro in 1992 and in subsequent summits organized by the United Nations [
29]. The environmental aspects of sustainability are easier to define, as they primarily concern the conservation of environmental resources [
30]. From an economic point of view, The World Tourism Organization [
31] identifies seven dimensions of sustainability, one of which is tourism seasonality. The other six dimensions are financial leakages, employment, tourism as a contributor to nature conservation, community and destination economic benefits, tourism and poverty alleviation, and competitiveness of tourism businesses [
15]. Those responsible for public policy design, as well as business managers, need analytical tools to diagnose the effects of seasonality on destinations and, in particular, on companies. This will enable them to design strategies that guarantee the sustainability of these destinations [
32,
33].
To properly contextualize the present analysis, it may be interesting to refer briefly to the set of economic and environmental impacts associated with seasonality. There are a variety of environmental effects stemming from tourism seasonality, all of which have a common characteristic: They are a result of higher concentrations of visitors at certain times of the year. Notable effects highlighted in the economic literature include the following: Greater pressure on natural resources such as water, an increase in the amounts of garbage and wastewater generated, the rising number of tourists interfering with local ecosystems, and the generation of noise, etc. [
10]. The negative environmental impact of an uneven distribution of tourist arrivals throughout the year is thus clear.
Many authors consider seasonal fluctuations as a key factor influencing business sustainability [
34,
35]. Brida et al. [
36] (p. 365) indicate that “Many economic activities are highly dependent on tourism and are at risk because the high seasonality of the tourist destination does not allow continuity in commercial and economic operations during the whole year”. This problem particularly affects destinations with a weak production structure, which are more vulnerable to fluctuations in demand [
37,
38]. On the other hand, the concentration of visitors at certain times of the year generates an inefficient use of facilities, resources, and infrastructures [
39,
40,
41]. In addition, the quality of the services offered may suffer during periods with high tourist inflows [
42], while during low-activity periods some companies might opt to close down, which harms the overall image of the destination [
43]. One of the most adverse effects of seasonality relates to the drop in corporate profits during periods of lower tourist inflows [
44]; this, in turn, may limit investment in the sector [
45]. However, not all tour operators perceive seasonality as a problem [
46]. On the other hand, the decline in activity has a direct impact on the local community; the residents who work in companies in the sector must make sure they have sufficient income to compensate for periods of low activity in which job continuity is not guaranteed [
47]. Similarly, poor quality job markets emerge in regions dependent on seasonal tourism. These are characterized by irregular operations, scarce opportunities for promotion, and sub-par working conditions. This also has an impact on the business sector, because a seasonal job market is less efficient when companies are seeking to hire high-quality staff [
48]. In sum, seasonal work tends to attract low-skilled workers [
49].
Despite the importance of the supply-side, there is far more tourism research from a demand-side perspective [
50]. Wanhill [
51] claims that studies focused on supply alone account for just 9% of the total. In this markedly unbalanced context, the analysis of the efficiency of tourism industry activities has received even less attention due to, among other things, the intangible nature of tourism [
52]. Only a few studies have analyzed hotel efficiency [
50], despite the fact that such studies might offer a better understanding of the effects of seasonality as well as providing guidance as to the most effective strategies to combat its negative effects [
53]. One case of applying such an approach is the analysis of the efficiency of hotel companies according to their opening period: Whether the hotel remains open the whole year or only a part of it. This paper focuses on just such an analysis. Said analysis is aimed at shedding light on the efficiency of resource use in hotel companies in a context of seasonality.
To that end, we adopt a supply-side approach and, as mentioned above, apply DEA. Even though it is a well-established method for evaluating efficiency in multiple economic activities, its use is relatively rare in empirical studies on tourism. Examples of studies that do use such an approach include the following:
Pulina et al. [
50] study the efficiency of hotels across all 20 regions in Italy, calculating both technical and scale efficiencies. They compare efficiency levels in hotels categorized by size and municipality. DEA efficiency scores are obtained by employing an input-oriented model in a variable returns to scale (VRS) framework. Goncalves [
54] examines the productivity of French ski resorts using the Luenberger productivity indicator (LPI) based on the DDF. The DDF projects an input and/or output vector from itself onto the technology frontier in a pre-assigned direction. Oliveira et al. [
55] analyze the efficiency of Portuguese hotels in the Algarve region. DEA is applied to compare the performance of the hotels. They conclude that the star rating is not a significant determinant of efficiency, but location and the existence of golf courses may have an effect. A major finding is that the hotels that do not have golf courses are more efficient. Brida et al. [
56] show the relative economic performance of the hospitality sector in regions of Italy during the period 2000-2004. An input-orientated DEA model is applied, while distances between time series and hierarchical clustering techniques are used to classify the economies in the sample. Parte-Esteban et al. [
57] use a two-stage procedure in order to examine the determinants of efficiency in the hospitality industry for a sample of Spanish hotels during the period 2001-2010. In a first stage, DEA is applied. In a second stage, a Tobit regression model enables the authors to test the relationships between the efficiency scores and the regional and corporate performance factors. Efficiency scores are found to be significantly influenced by regional and corporate factors in this study. Fernández and Becerra [
58] apply DEA to estimate the efficiency of 166 Spanish hotels divided into midscale and upscale chain groups. They then run a regression analysis to determine the dependence between the efficiency scores and the explanatory variables in order to identify which drivers of efficiency are significant in the Spanish hotel industry, and which specific factors should be targeted to eliminate the inefficiencies and enhance the competitiveness of ineffective hotels. Based on a sample of hotels in Croatia, Poldrugovac et al. [
59] use an output-oriented DEA model to determine whether there are differences in efficiency between hotels of different sizes and qualities. They review the variables previously used in research on the hotel industry and suggest that efficiency scores could be a source of information used to improve hotel performance and provide benchmarks for hotels that have not achieved the highest level of efficiency. Manasakis et al. [
60] employ DEA in order to study the relative efficiency of hotels operating under a brand compared to hotels operating independently, using a sample of hotels in Crete, Greece. They find that nationally-branded hotels are the most efficient in relative terms, but a hotel’s inefficiency is mostly due to the input/output configuration rather than their management teams’ performance in organizing the inputs in the production process.
Our analysis, however, goes a step beyond previous studies, offering not only a measure of radial efficiency, but also an analysis of efficiency in the use of specific factors of production [
61]. To that end, we use the DDFs proposed by Färe and Grosskopf [
62]. As far as we are aware, this is the first time DDFs have been used to analyze efficiency in the hotel sector. As confirmed below, the results obtained are fairly consistent with the theoretical hypothesis formulated here.
3. The Production Function of Hotel Companies and Data Used for the Research
- (a)
The production function of hotel companies.
The hospitality sector has changed substantially in recent decades. On the demand-side, tourists are becoming ever more demanding in terms of product diversification. This forces hotel companies to offer a more complete and personalized range of services (in addition to the classic accommodation and catering options, they often offer services relating to personal care, leisure, self-booking, self-check in, transfers to stations or airports, etc.). The growing competition in the global tourism market, on the one hand, and the technological revolution taking place in recent decades, on the other, are bringing about important changes in business strategies and in the way in which production factors are managed in the sector (business concentration, franchising, differentiation of supply, internationalization, service outsourcing, etc.). As a result, the production function of such companies has become more complex in the last few decades and ever-greater diversification can be observed in terms of both the inputs used and the outputs offered.
When attempting to assess the level of technical efficiency with which certain production units (decision-making units (DMUs)), such as hotels, operate, a rigorous characterization of their production function is required. The set of inputs used and outputs obtained in the production process must be precisely identified and measured in order to assess the level of achievement of the production programs. However, companies do not usually make their production plans public knowledge, nor do they provide information on the intensity with which they use the different inputs. Therefore, in order to carry out such an analysis, the researcher has to resort to publicly-available information, which is usually included in the companies’ financial statements. That said, financial statements provide aggregated information on production volumes or turnover but do not break it down by product. Furthermore, they do not specify the consumption of each input, but rather group it under certain generic headings, such as operating costs. In any case, the literature recognizes these limitations and these sources of information are typically used as a basis for characterizing the production function of any productive sector. Font et al. [
24] provide a very useful review of the selection of inputs and outputs that have been included in the most recent literature.
Bearing in mind these limitations and the abovementioned methodological approaches, the production function of hotel companies is defined in this study as a process in which three inputs are used: capital, labor, and intermediate inputs, yielding an aggregate output that includes the set of services provided by these types of companies (accommodation, catering, leisure, personal care, etc.). Due to the lack of specific information, we have to use a proxy for the labor factor; namely, the company’s staffing costs. Similarly, property, plant, and equipment (fixed capital) are used as a proxy for capital, and other operating expenses are used as a proxy for intermediate inputs. All this information is available in the financial statements that companies make available in the public registries. Although they focus on other productive sectors, there are many studies that employ these proxy variables to characterize the production function of a given sector.
Another preliminary question that needs to be clarified before proceeding with the efficiency evaluation is whether to adopt an input- or output-oriented analysis. In an input-oriented approach, a company is considered to have achieved maximum efficiency when it minimizes input consumption for a given output volume. Conversely, in an output-oriented approach, a DMU is considered to have achieved maximum efficiency when, for a given volume of inputs, outputs are maximized. In this case, and since the aim is to analyze the role played by the factors of production in the area of technical efficiency, an input-oriented approach is adopted in the first stage, under the assumption of variable returns to scale (VRS).
A priori, it seems reasonable to suppose that the production function is the same in the two types of establishment under study, because they offer the same services and use the same inputs, and differ only with respect to the periods of activity. In addition, hotels that are open all year can be expected to achieve higher levels of efficiency than those that are only open in high season, since the latter underuse part of the factors employed in the production process. In particular, they could be notably less efficient in the use of capital—both in terms of land and buildings as well as the capital employed in machinery, facilities, and all types of equipment—as this resource remains out of action for long periods. As such, this underuse means that the consumption of inputs per unit of output increases over a given period of time. Regarding the labor factor, as is well known, this is a flexible factor of production, which is employed according to the volume of activity. The use of this factor could therefore be fairly precisely tailored to seasonal activities, although generally speaking, for regulatory reasons (labor law) as well as for other technical reasons, it is very unlikely that there will ever be a complete and fully-flexible adaptation of labor to the needs of hotel production. As a result, in many cases the use of the labor factor in the hotel industry could also be less efficient when DMUs do not operate continuously. As far as the use of intermediate inputs is concerned, the argument that applies is similar to that for the use of the labor factor: In principle, the use of such inputs is quite flexible (perhaps even more so than the use of labor), although due to certain rigidities related to the forms of procurement, which are usually fairly standardized (security services, basic supplies, maintenance services, etc.), the use of these inputs could be less efficient when hotel operations are not continuous.
Thus, hotel establishments that only open temporarily can be expected to be less efficient than those that continue operating throughout the year; in addition, the efficiency levels with which these two types of hotels use the different factors of production are expected to differ. Indeed, these are the hypotheses that we test in the
Section 3 of this article.
- (b)
Data used for the research
For the purposes of this study, we chose hotels located on the islands of Mallorca, Menorca, Ibiza, and Formentera. Such and Zamora [
63] point out the appropriateness of the Balearic Islands as an area of analysis for studies focused on tourism, seasonality, and sustainability. This destination enjoys a Mediterranean climate, although the bulk of the tourist inflows are concentrated in summer [
64]. Environmentally sensitive areas such as the Balearic Islands face the challenge of managing growing tourist inflows concentrated in a short period of time. The geographical location of the archipelago gives it a great advantage over other competing destinations, as these islands are within a three-hour flight from many European countries [
14]. Tourism represents a large percentage of the economic activity of these islands—specifically, 85%—and thus is likely to be the main reason underlying a transformation process that has turned a rural economy into one of the richest areas in Spain [
65]. The Balearic Islands cover an area of 5040 square kilometers and have a coastline measuring 1428 kilometers. This archipelago is comprised of three large islands—Mallorca, Menorca, and Ibiza—and two small ones—Formentera and Cabrera—that are much less touristy than the larger islands.
This paper focuses on 1-, 2-, and 3-star establishments because, during the data-gathering phase, it was found that the majority of hotels with the highest classifications are actually part of national or international hotel chains. This makes it impossible to conduct a regional analysis of their financial statements, which in turn prevents us from linking this information with their opening periods (continuous or seasonal). The complete list of hotel accommodations was drawn up using the online booking portal Booking.com, and it was expanded with information provided by local registries that included establishments that do not offer their services through intermediaries. All the hotels with a presence on the islands have been analyzed, except for the 1- to 3-star establishments that belong to a hotel chain or a business group with activities that go beyond those of a hotel establishment. Similarly, we discarded establishments that do not issue a full report of their annual accounts and those which are owned by a private individual rather than a trading company. This process of discarding hotels was carried out by analyzing the SABI database, which contains economic and financial information on millions of companies, including companies that operate hotel establishments. The association between the name of the establishment and the company that manages it was done on a case-by-case basis by checking the websites of the establishments. In order to determine their opening periods, a survey was conducted in December 2018 and January/February 2019: The opening or closing periods of the hotels during the off-season were confirmed with the aid of the booking systems of each establishment. Additionally, we obtained the financial statements of all the selected companies for the years 2015, 2016, and 2017. The data cleaning process described above resulted in a total of 170 entities, of which 72 are establishments that open all year round and 98 are establishments that close temporarily.
The use of data corresponding to three consecutive years entails the assumption that there have been no significant changes in the technology of the sector during that time, which seems quite realistic given the short period of time selected. Each company’s financial statements provided the number of items used as proxies for each of the inputs used and the outputs obtained.
Table 1 shows the descriptive statistics of these inputs and outputs.
4. Materials and Methods
During the 1960s, studies that attempted to assess the performance of the hotel sector were based on analyses of ratios such as operating costs to turnover, or number of available beds to resident population [
66]. The development of new analytical techniques based on production frontiers, such as DEA, has enabled new studies on the hotel sector to include multiple inputs and outputs in their analyses. In the 1950s, Koopmans, Debreum, and Farrell laid the theoretical foundations for the calculation of efficiency [
67,
68,
69]. Farrell distinguished between technical, price, and overall efficiency, as well as explicitly allowing for the inclusion of multiple inputs and outputs.
DEA is a non-parametric linear programming technique that was introduced by Charnes et al. [
70]. Lovell [
71] indicates that, if producers are required to meet market demands and if they can adjust input usage, then an input-oriented model is applicable. As commented above, for our analysis we have chosen the input-oriented DEA model. The main advantage of DEA is that it does not require the specification of a functional form for the technology, as is the case with stochastic frontier analysis (SFA). However, due to its deterministic nature, the researcher must perform a prior analysis of the sample to detect and remove values that are considered outliers, which can affect the construction of the efficient frontier and, therefore, the relative levels of efficiency obtained for each observation included in the study. These levels are calculated by measuring the distance of the DMU from the efficient frontier estimated by DEA.
Some studies have used DEA to assess technical efficiency in the hotel sector [
72,
73] (See also the studies cited in the introduction). More recently, some studies have included the impact of the cost of the factors (allocative efficiency), providing a more in-depth economic interpretation of the results [
74]. SFA is also commonly used for calculating both technical and allocative efficiency [
75,
76]. This study goes one step further in this line of research by applying DDFs to carry out a specific analysis of the efficiency with which the different factors of production employed in this sector are used. Let us assume that we can observe a sample of k = 1,..., K hotels, both continuous and seasonal, which make use of a set of N inputs, represented by x = (x
1,…,x
N), to produce a set of M outputs, y = (y
1,…,y
M). It is also assumed that inputs and outputs are all non-negative. The technology used in the hotel sector to transform inputs into outputs can be defined as:
Furthermore, we assume that the technology satisfies the axioms initially proposed by Shephard (1970), including the possibility of inaction, no free lunch, free disposability of inputs, strong disposability of outputs, and convexity. Based on this characterization of the technology, Farrell’s input-oriented technical efficiency [
68] can be defined as:
The technical efficiency of DMU k’ can be assessed from the following program:
Subject to:
where
is the input-oriented technical efficiency of DMU
k’,
is the amount of the m
th output (m = 1,...,M) produced by DMU
k,
is the amount of the n
th input (n = 1,...,N) consumed by DMU
k, and λ
k is the weight assigned to DMU
k (k = 1,2,…,K). Furthermore, VRS are assumed through the restriction—Equation (3c).
Under the assumption of VRS, the production frontier is the broken line ABCD-extension shown in
Figure 1. B, C, and D are all technically efficient under the VRS assumption, while E is inefficient under VRS. Consider firm E where 6 units of the input are used to produce 7 units of the output. Its input-oriented projection onto the VRS frontier is F, where 4 units of the input yield 7 units of the output.
Input-oriented efficiency level of firm E under VRS is:
In addition, the DDFs simultaneously seek to expand output and contract inputs, projecting each observation onto the efficient frontier in a pre-assigned direction. This is illustrated in
Figure 2.
These functions can be defined as follows:
As in the previous case, the technology used is defined by Equation (1). Let us now define the DDF [
54] as:
where g = (−g
x, g
y) as the direction vector.
We also assume in this case that the axioms proposed by Shephard [
77] are satisfied. The distance function seeks the maximum expansion of the output vector in direction g
y , with the maximum contraction of inputs in direction g
x:
The DDF can also be employed to compute input-specific scores of technical efficiency, thus assessing performance at the input level. In order to do so, let us assume that we are interested in assessing the maximum feasible saving of input x
i while maintaining the remaining inputs x
−i and the output vector at their observed levels [
60].
The direction vector that represents these preferences is:
Lastly, the DDF is defined as follows:
From this perspective, efficiency calculations will be performed as many times as there are inputs included in the production function (once for each factor), in order to measure the level of efficiency achieved on a case-by-case basis.
5. Results
The relative radial efficiency levels of each DMU are estimated with the program represented in Equations (3) (a–d). Using the statistical software R (DJL package), we have estimated measures of radial efficiency under VRS, so scale effects have been removed. As outliers can substantially distort the estimated efficiency measures with DEA, the literature suggests a number of different methods for detecting and removing them [
78,
79,
80]. In our case, we have applied the technique developed by Simar [
81], namely the
order-m partial frontier, to detect super-efficient observations. It should be noted that no such observations have been detected, underscoring the robustness of the sample and the analysis itself.
The results obtained with these programs are summarized in
Table 2.
The average efficiency level of the Balearic Islands hotel establishments in the sample is 0.7387. This means that these establishments could, on average, achieve a proportional reduction in input consumption of 26.13% while maintaining the same level of output. Looking at the two groups of establishments that have been defined, hotels that operate continuously throughout the year achieve an average efficiency level of 0.7811, while those that close down in low season achieve an average efficiency of only 0.7075. That is, the efficiency level of the first group surpasses that of the latter by 7.36 percentage points. This result is consistent with the hypotheses formulated in
Section 3 (a), concerning the production function. Moreover, it lends support to the idea that the hotels that are open all year better manage their consumption of inputs than those that close down for part of the year. The Kolmogorov–Smirnov Test confirms that the distribution of technical efficiency in “Open” and “Not open” establishments is statistically different at standard confidence levels.
Figure 3 shows the kernel density estimates of the probability density function for the groups “Not Open”, “Open”, and “All”. The figure supports the results shown in
Table 2 as well as the results obtained in the Kolmogorov–Smirnov tests.
Regarding the specific management of each input, the following table shows the efficiency measures for each of the factors and for each group of hotel establishments defined, with their DDFs having been estimated using Equations (5)–(8).
Table 3 presents the levels of efficiency in the use of each production factor while keeping the level of output constant and without increasing the consumption of other inputs.
Let us briefly explain this table: The value 0.6125, corresponding to the level of efficiency in the use of the labor factor of hotels that open all year, indicates that, on average, these types of establishments could reduce their consumption of the labor factor by 38.75% while keeping the level of output constant and without increasing the consumption of other inputs.
The results obtained reveal that, for the sample as a whole, the inputs that are most efficiently managed by the hotels are the intermediate inputs, with an average value of 0.6065, followed by the labor factor (0.5812) and then capital (0.2553) (see
Table 3). A positive relationship is thus observed between the degree of flexibility with which a factor of production can be employed and the level of efficiency with which it is used. In addition, regarding the type of establishment, for each of the production factors individually considered, establishments which remain open all year round are always more efficient than those which close down for part of the year. The two groups of establishments do not differ notably in the use of the labor factor and intermediate inputs. However, more noticeable differences are observed in the use of capital: In addition to the fact that a very low level of efficiency is achieved for the sample as a whole, the efficiency levels for hotels that only open part of the year are almost half those of hotels that open all year (0.1922 and 0.3450, respectively). The low level of efficiency achieved in the use of capital could be related both to the highs and lows of hotel occupancy throughout the year, as well as to the number of months in which an establishment could be closed; that underutilization of capital will of course be greater in establishments that close for part of the year.
In summary, the results obtained for each input are also consistent with the hypotheses formulated in the
Section 3 (a), which suggest that establishments that remain open all year round manage all of their inputs more efficiently than those that only open part of the year.
Table 4 shows the results of the Kolmogorov–Smirnov test applied to each of the factors, as well as the radial efficiency results obtained previously. These indicate that the distributions are statistically different in all cases.
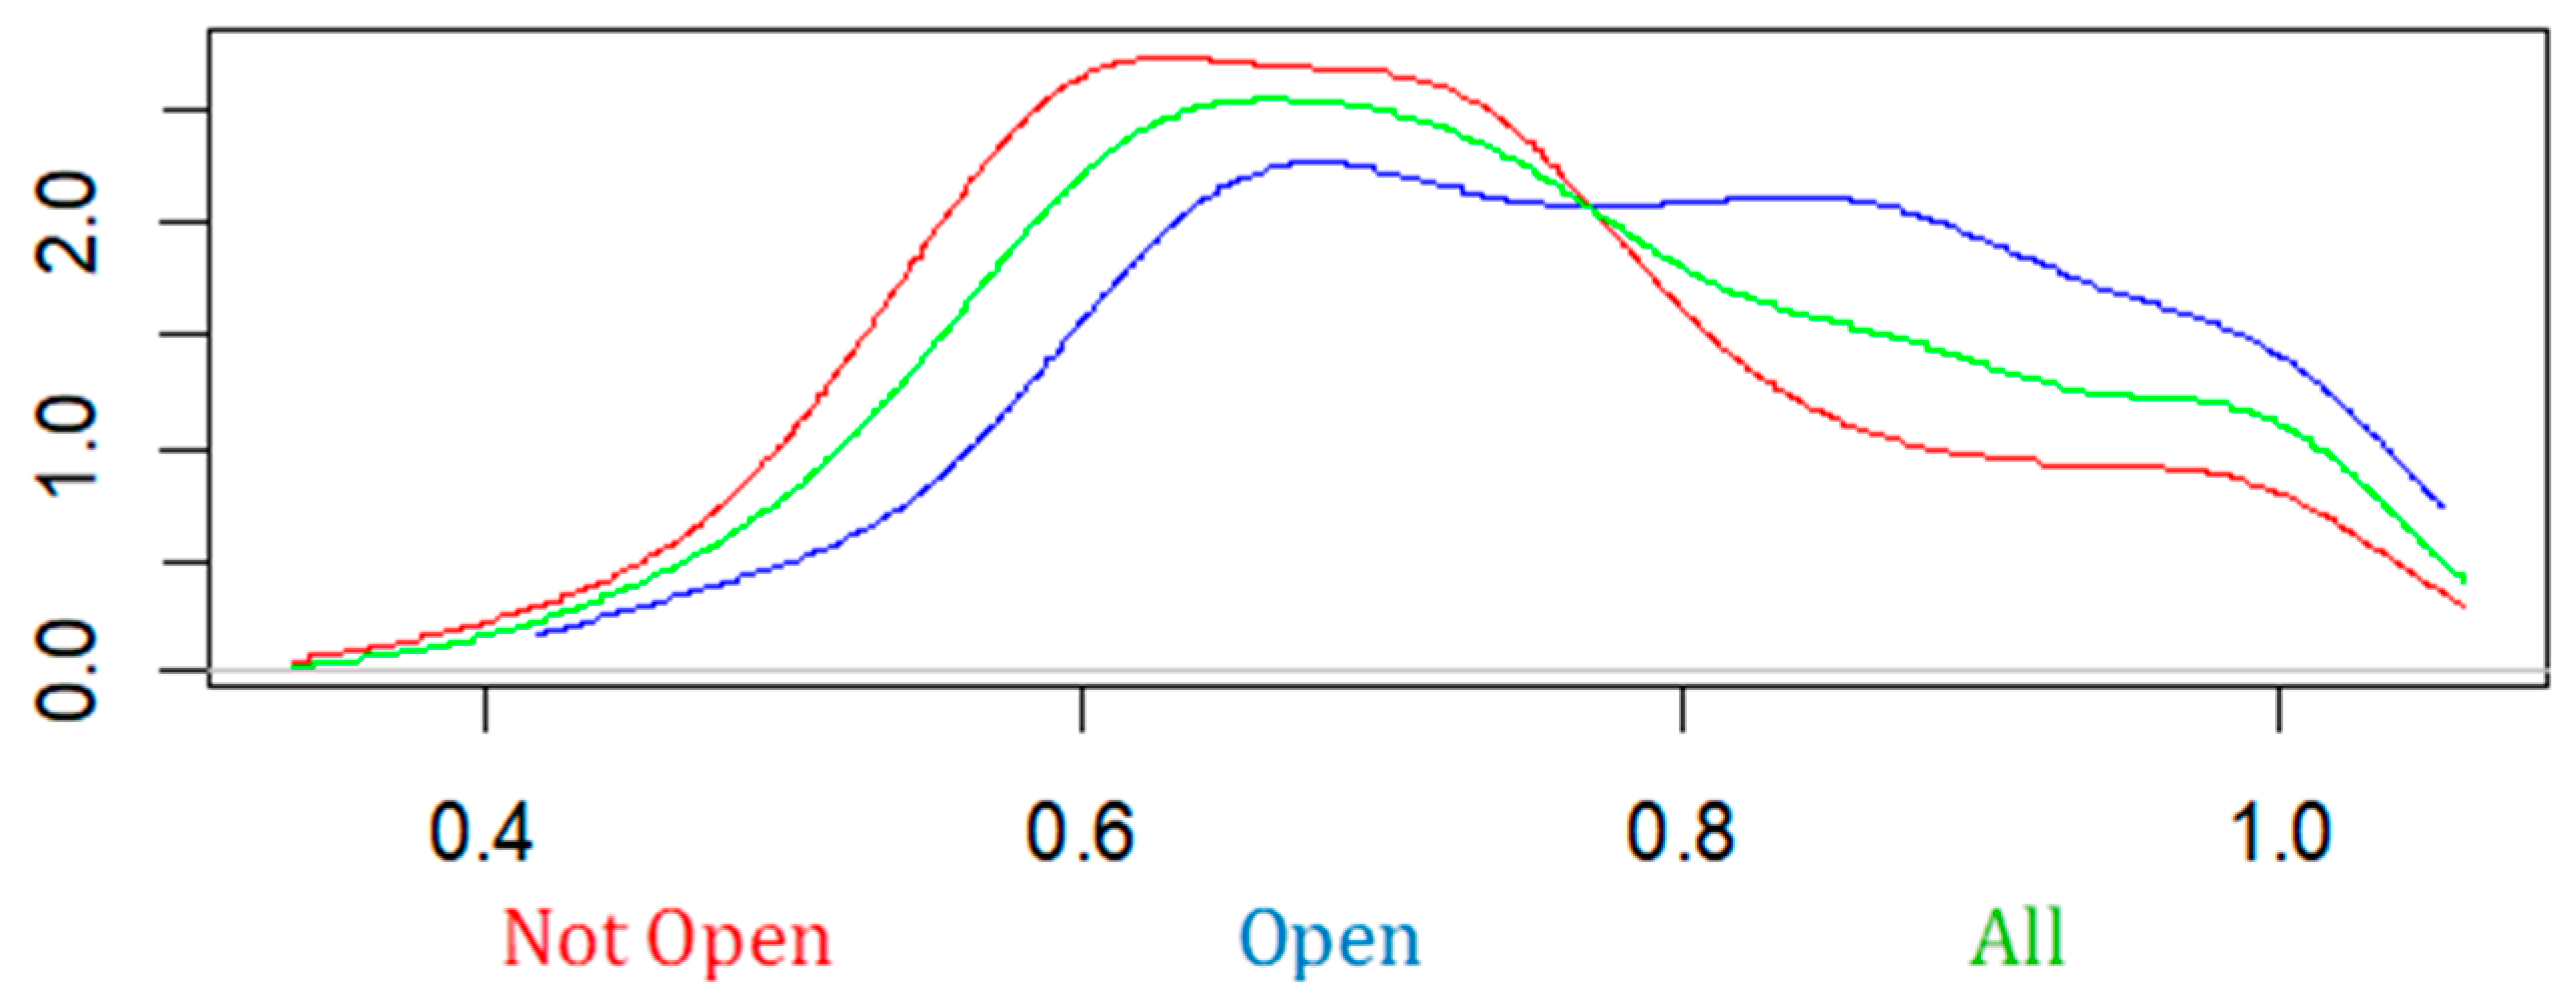
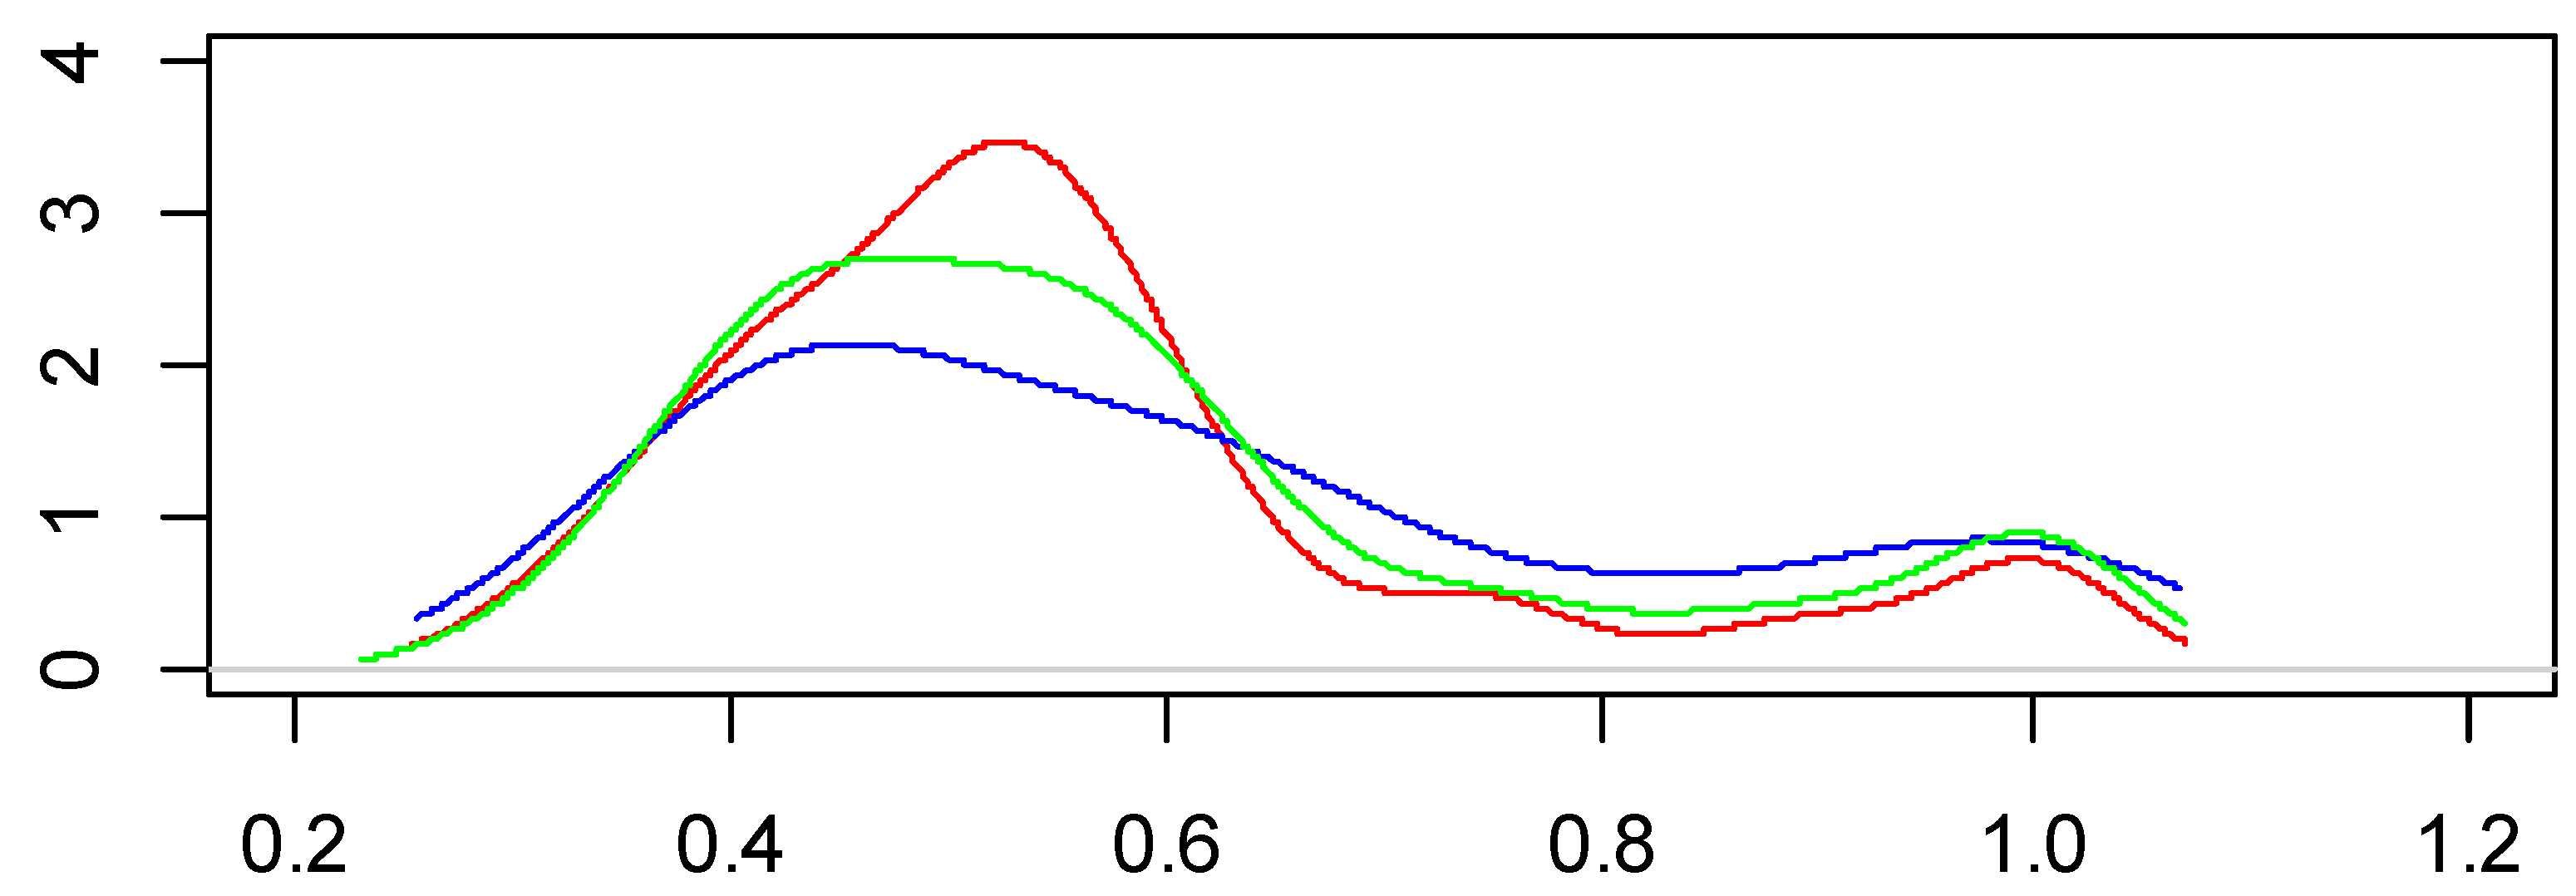
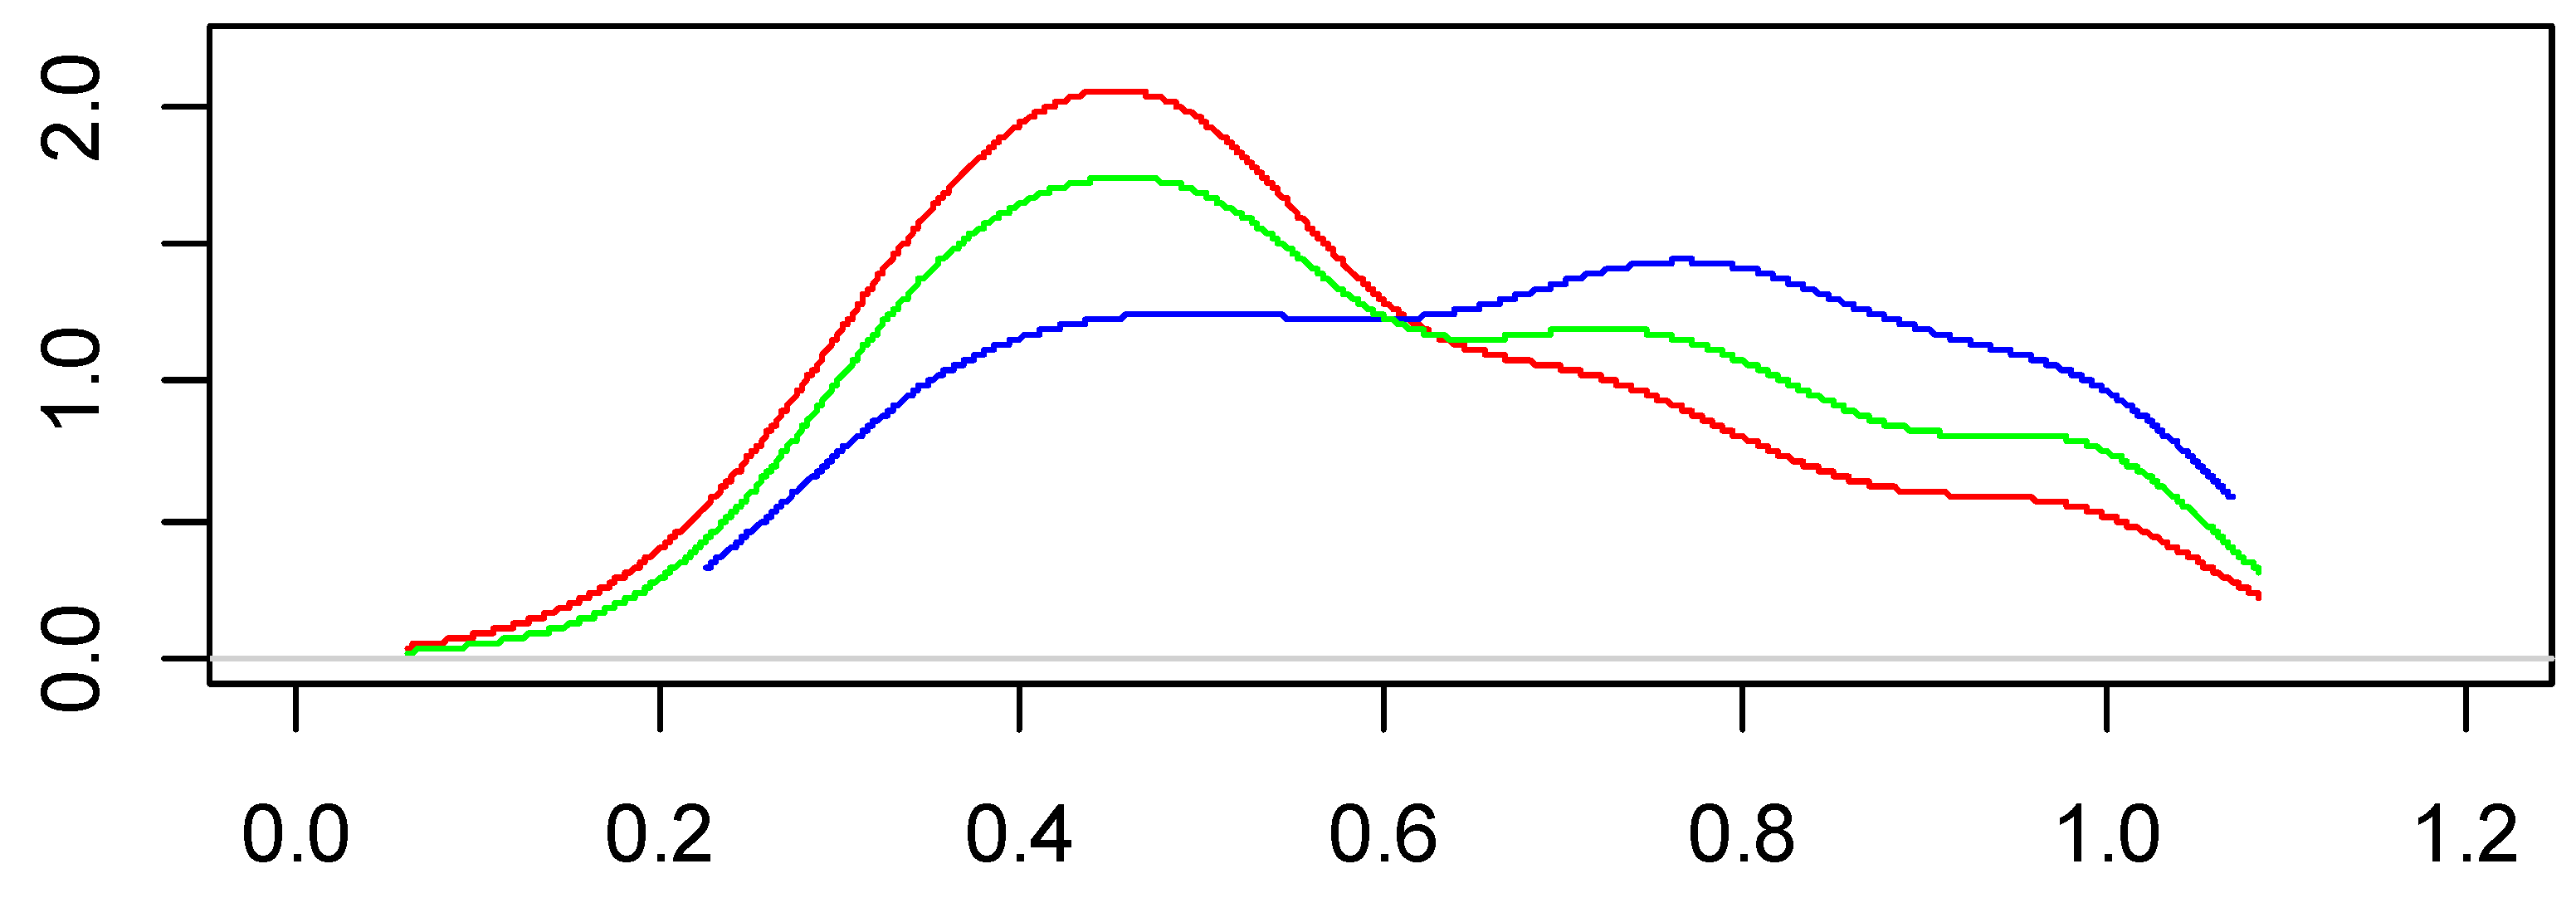
Figure 4,
Figure 5 and
Figure 6 show the kernel probability density functions for each input and each group (“Not Open”, “Open”, and “All”). The results support the existence of notable differences in performance between the groups. Capital input shows the largest differences. Labor and intermediate inputs reveal a well-defined mode around the DDF means shown in
Table 3. The same cannot be said of the capital input, which shows a lower mode around 0.1, whereas the DDF results lie around 0.25.
6. Discussion
Tourism seasonality represents a major challenge from an economic, environmental, labor, and social perspective. Hotel establishments, an essential part of the tourism industry, are not immune to this phenomenon, although the impacts in this area are mainly observed in the economic domain and in the workplace. From an economic point of view, the seasonality of the hotel sector can generate a variety of irregularities. One of the most notable of these is the inefficiency with which resources are used, as they are not used continuously throughout the year. Even though efficiency analyses represent a fundamental issue in tourism economics, they have not received the attention they deserve in the academic literature. Indeed, unlike in other productive sectors, efficiency research in the tourism industry remains underdeveloped. The present study aims to contribute to the progress in this line of research, to which end it presents an analysis of the efficiency of the Balearic hotel sector, distinguishing between those establishments that stay open all year round and those that only open part of the year.
A two-stage efficiency analysis is carried out: First, a conventional input-oriented radial efficiency analysis, using DEA; and second, an estimation of efficiency specific to each of the inputs employed in the production process, through the use of directional distance functions. As far as we are aware, this is the first time that efficiency has been measured for specific production factors in the hotel sector.
Regarding the main research objective of this paper, the questions we sought to answer were: What effect does seasonality have on the efficiency with which hotel establishments operate and how efficiently do these hotels use each of the inputs that form part of their production process?
As noted, we have found that those hotel establishments that can continue operating throughout the year show higher levels of efficiency. Therefore, attempts to reduce seasonality will contribute to improving the economic sustainability of such establishments. This requires a steadier flow of tourist visits throughout the year, capable of generating activity at times when hotels traditionally close. Such a tourism model would also contribute to reducing environmental pressure at peak times. Therefore, in this case, improvements in terms of economic sustainability also entail improvements in environmental sustainability.
Our results show that the inputs that are most efficiently managed by the hotels are the intermediate inputs, followed by labor and then capital. Intermediate inputs are used to generate the final outputs in the service process, and the use of DDFs reveals the differences between these and the other inputs. Intermediate inputs can be an effective tool to increase efficiency, because their flexibility of use means they can be more easily adjusted. On the basis of these results, managers might be advised to substitute labor and capital usage with intensive use of intermediate inputs. Previous studies on tourism seasonality do not address this type of substitution or approach, but it has been observed in studies from other industries [
82,
83].


