Identification of Regime Shifts and Their Potential Drivers in the Shallow Eutrophic Lake Yilong, Southwest China


1
School of Information Science and Technology, Yunnan Normal University, Kunming 650500, China
2
Yunnan Key Laboratory of Pollution Process and Management of Plateau Lake-Watershed, Yunnan Research Academy of Eco-environmental Sciences, Kunming 650034, China
3
Yunnan Institute of Surveying and Mapping of Geology and Mineral Resources, Kunming 650218, China
4
Nanjing Innowater Environmental Technology Co. Ltd., Nanjing 210012, China
5
Institute for Ecological Research and Pollution Control of Plateau Lakes, School of Ecology and Environmental Sciences, Yunnan University, Kunming 650500, China
*
Authors to whom correspondence should be addressed.
Sustainability 2020, 12(9), 3704; https://0-doi-org.brum.beds.ac.uk/10.3390/su12093704
Submission received: 5 March 2020
/
Revised: 24 April 2020
/
Accepted: 27 April 2020
/
Published: 3 May 2020
(This article belongs to the Section Environmental Sustainability and Applications)
Abstract
:Regime shifts in shallow lakes can lead to great changes in ecosystem structures and functions, making ecosystem management more complicated. Lake Yilong, located in Yunnan Province, is one of the most eutrophic lakes in China. Although there is a high possibility that this lake has undergone regime shift one or more times, the presence of regime shifts and their drivers remain unknown. Here, we employed the sequential t-test analysis of regime shifts to detect the regime shifts based on the long-term (1989–2018) dataset of the lake. We further determined their potential drivers, and explored the nutrient thresholds of regime shifts and hysteresis. The results showed that during the testing period, three regime shifts occurred in 1996 (restorative type), 2009 (catastrophic type) and 2014 (restorative type). The potential key drivers for the first two regime shifts (1996 and 2009) were both related to aquaculture. The abolition of cage fish culture may have led to the restorative regime shift in 1996, and the stocking of crabs and excessive premature releasing of fry possibly caused the catastrophic regime shift in 2009. However, the third regime shift, which occurred in 2014, was possibly related to the drought and succedent hydration. These results indicate that adjustments of aquaculture strategy and hydrological conditions are critical for the lake ecosystem’s recovery. Moreover, the total phosphorus thresholds were identified to be lower than 0.046 mg/L (restorative type) and higher than 0.105 mg/L (catastrophic type), respectively. In addition, an obvious hysteresis was observed after 2014, suggesting that nutrient reduction is important for this lake’s management in the future.
1. Introduction
A regime shift is a change from one equilibrium state to another, driven either by large external shocks or by gradually crossing a critical threshold [1,2]. For a lake ecosystem, regime shifts lead to sudden and nonlinear changes in the ecosystem structures and processes [3]. Typically, the regime shift in a shallow lake ecosystem refers to the transition between a turbid state dominated by algae and a clear state with macrophyte dominance [4,5], and the state of co-existence of clear and turbid water may also exist [6].
While a catastrophic shift from a clear to a turbid state is commonly seen in many eutrophic lakes [7,8], the reversal of change is a restorative process and the achievement of a clear state is the ultimate goal of aquatic ecosystem management [9,10]. Because of huge changes in lake ecosystem structures and functions along with a regime shift [11], the response of algae biomass or aquatic macrophytes to changes in nutrient concentrations can be hysteretic [12,13]. The driver-response relationships, e.g., the relationships between charophyte vegetation coverage and nutrient concentration [1], provide the scientific basis for ecosystem management [14]. Therefore, it is of vital importance to identify regime shifts and their drivers to enhance our understanding of the regime shift mechanism and to improve the efficiency of ecosystem management [15,16,17].
Lake Yilong is one of the most eutrophic lakes in China. Although there is a high possibility that this lake has undergone regime shifts one or more times [18,19,20], the lack of knowledge on regime shifts and their drivers has severely impeded decision-making regarding lake ecosystem management. In this lake, the nutrients have exhibited enrichment since the 1960s; the water quality and the aquatic community varied a lot in the last few decades [18,19,20,21], and fish culture is an important income source for the local residents. In addition to nutrient input from the watershed, exotic fish introduction or changes of fish culture strategy may also have an impact on water quality, the food web and even cause regime shift, as has been revealed in other lakes [22,23,24,25,26]. However, our current knowledge of this is still limited in Lake Yilong.
A proper method is essential to identifying regime shifts. Among regime shift detection methods [13,27], the sequential t-test analysis of regime shifts (STARS) is one of the most commonly used because it is easy to understand and conduct with standard steps [28,29]. This method has been applied to detect the presence of regime shifts in many fields [30,31], particularly in the determination of regime shifts in aquatic ecosystems [32,33,34]. In this study, we employed STARS combined with piecewise regression to analyze a time-series of water quality indicators in Lake Yilong. Then, we identified the potential corresponding drivers of regime shifts. Finally, we tried to explore the nutrient thresholds of regime shifts and hysteresis, and to give preliminary suggestions for restoration of the lake.
2. Materials and Methods
2.1. Study Area and Data Acquisition
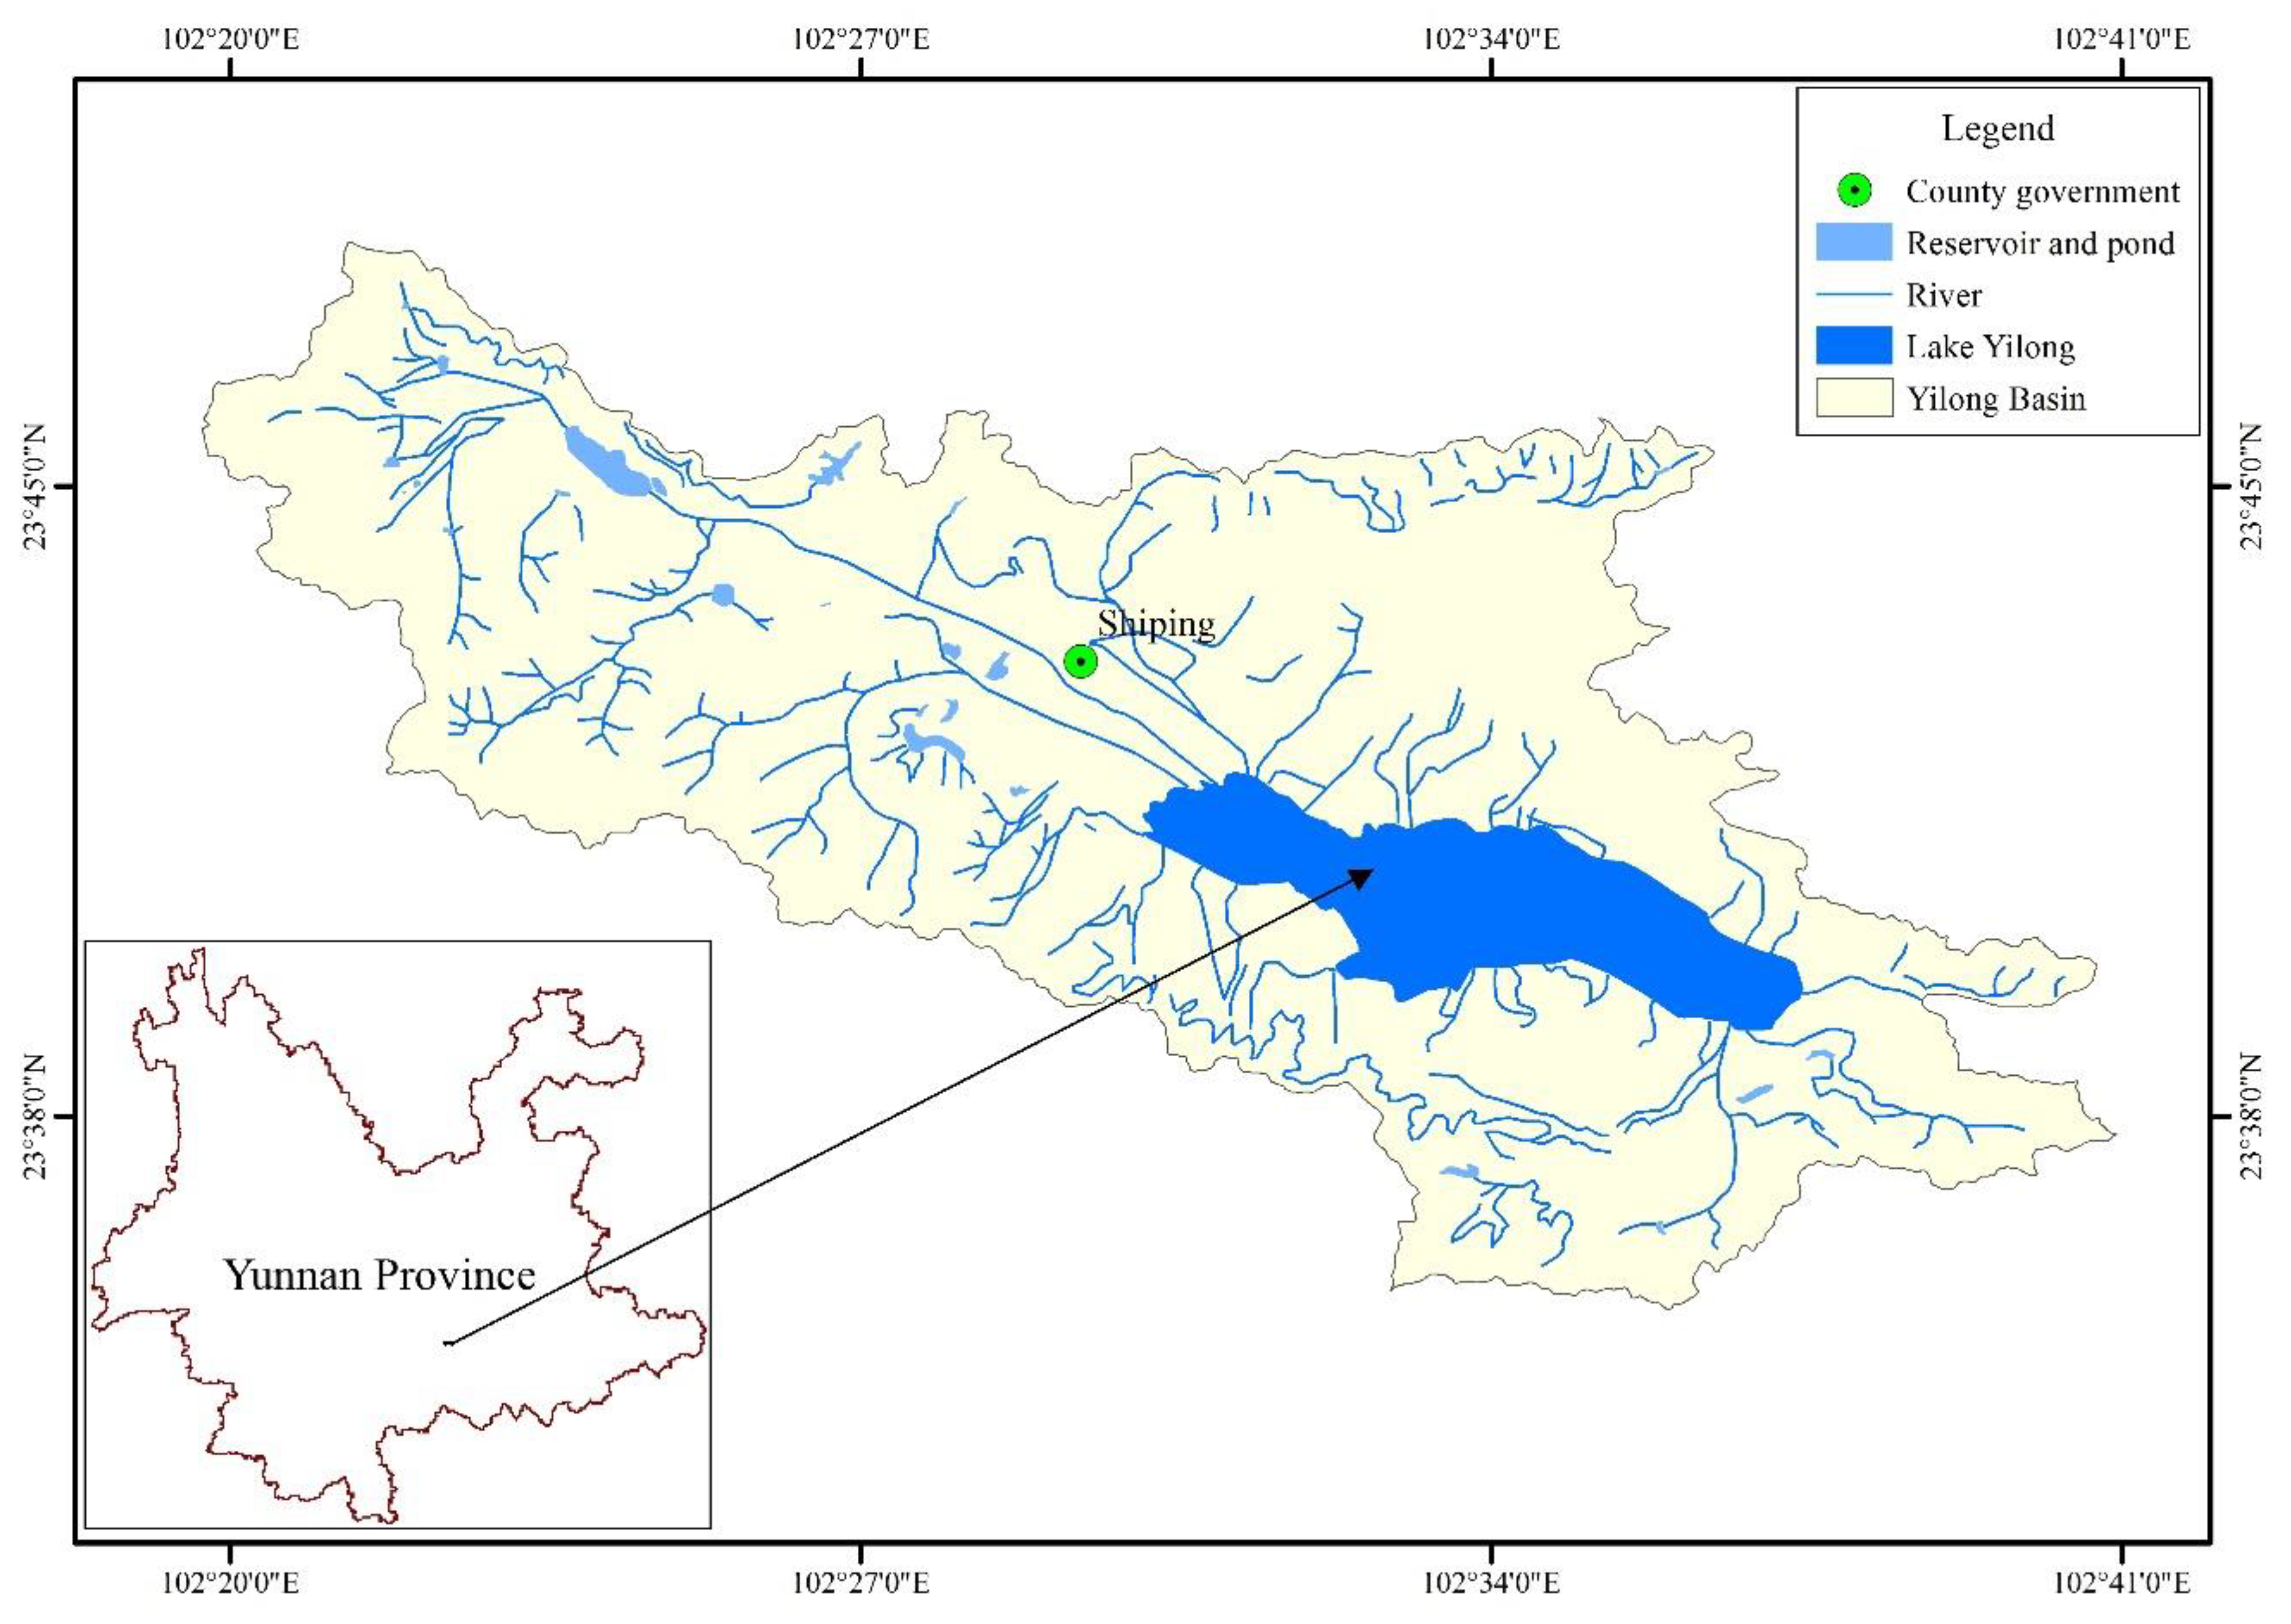
Lake Yilong (23°28′~23°42′ N, 102°28′~102°38′ E) is located in Shiping County, Yunnan Province (Figure 1), with an average elevation of 1414 m a.s.l. The lake area and watershed area are 28.4 km2 and 360.4 km2, respectively; the maximum and average depths are approximately 5.7 m and 3.9 m, respectively; and the water residence time is approximately equal to 1.94 years (Table 1). The area belongs to the north subtropical drying monsoon and mid-tropical humid monsoon climate with distinct dry and wet seasons, with high precipitation in summer. In the region, the annual average precipitation is about 928.3 mm, the average value of annual sunshine hours is 2300 h and the average air temperature is around 18 °C [20]. The lake never freezes. Moreover, the average wind speed is 1.9 m/s and the main wind direction is northwest. Due to the shallow depth and the wind perturbation, the waterbody is polymictic. In addition, more than 133,000 residents live in the watershed and the main industry is agriculture.
Long-term monthly data was collected by the Shiping County Environmental Monitoring Center, which operates a routine monitoring program of water quality. The averages of three sampling sites at depths of 0.5 m of four water quality indicators were used for analysis. The indicators were water transparency (Secchi disk depth, SD), total phosphorus (TP), total nitrogen (TN) and chlorophyll a (Chl.a). The monitoring period for SD and TP was from 1989 to 2018, while the period for TN and Chl.a was from 1991 to 2018; each annual datum was presented as the mean value of three hydrological periods (two rounds of sampling per period) before 2003, nine months (ten rounds of sampling) in 2003 or twelve months (one round of sampling per month) since 2004. The aquatic macrophytes coverage (AMC, estimated visually from a boat) in 2017 was measured in this study, whereas the AMCs of the other four years (i.e., 1992, 1997, 2008 and 2010) were obtained from the literature [35]. Additionally, the calculations of total turbidity (TurbTot) were accorded to Portielje and Van der Molen [36].
2.2. Determination of Regime Shift Presence
To determine regime shifts using response variables, and to explore the potential drivers, the first step was to establish the conceptual stressor-response relationships in Lake Yilong. Previous studies showed that external nutrient loads are definitely the fundamental drivers (stressors) across the years, while other human activities (e.g., fish/aquaculture) and hydrological factors also had great effects at different periods [20,35]. With increasing loads from the watershed, the concentrations of TN and TP increased and subsequently caused a high level of algal biomass; the corresponding negative effects were high turbidity, low SD and the vanishing of submerged macrophytes. Eutrophication was exacerbated by aquaculture practices involving herbivorous fish, which reduced macrophyte cover and increased nutrient cycling [18]. Thus, the turbidity indicators (SD and TurbTot), the phytoplankton (algal) biomass (represented by Chl.a concentration) and the AMC were considered as response variables.
STARS was first proposed by Rodionov [28] to test climate regime shifts, and was then used as a common method of regime shift detection in aquatic ecosystems. According to previous research [32,37], the application of STARS to determine the presence of regime shifts in this study can be summarized into the following two steps.
Step 1: The identification of a potential change point. For a certain water quality indicator, suppose the time series is (x1, x2, …, xN), where N is the length of the time series. We chose l as the cut-off length of the regimes to be tested. Then each point (xc) which belongs to can be tested based on the t-statistic Equation (1),
where and are the means of the sequence before and after xL+1 where the length of l and σl is the average standard variance of the sequence in l year period, and t is the value of the t-distribution with 2l-2 degrees of freedom at the given probability level p. After choosing a significant level p, calculate the mean of the initial l values of the variables X as an estimate for regime R1. For each new value starting year i = l + 1, if the new value xc exceeds the , then this year should be considered as a potential change point. Otherwise, the point xc is not a change point for the regime shift. In this case, recalculate the average to include the new value xi and l-1 previous values for variables X and wait for the next value to come.
Step 2: The determination of the presence of a regime shift is based on the regime shift index (RSI). For each potential change point xc, the RSI represents a cumulative sum of the normalized anomalies, expressed in Equation (2),
where 0 ≤ m < l. If the retains the same sign for all the m values, then the potential change point xc is determined as a change point for regime shift and the RSI is assigned as the absolute value of . Otherwise, the potential change point xc is not a change point for the regime shift and the RSI is assigned as zero. Once a new regime is determined, it is considered the base regime. The test for the next regime shift starts at c + 1 to ensure that even if the new equilibrium state lasts less than one year, it could be detected successfully.
Note that two parameters, the cut-off length l and the significant level p, would impact the determination results. Considering the relatively long-term series of SD and referring to the discussion by Rodionov [28], we chose the cut-off length for SD to be 7, and for Chl.a to be 5. We chose the significant level to be 0.05 for the two indicators.
3. Results and Discussion
3.1. Presence of the Regime Shifts
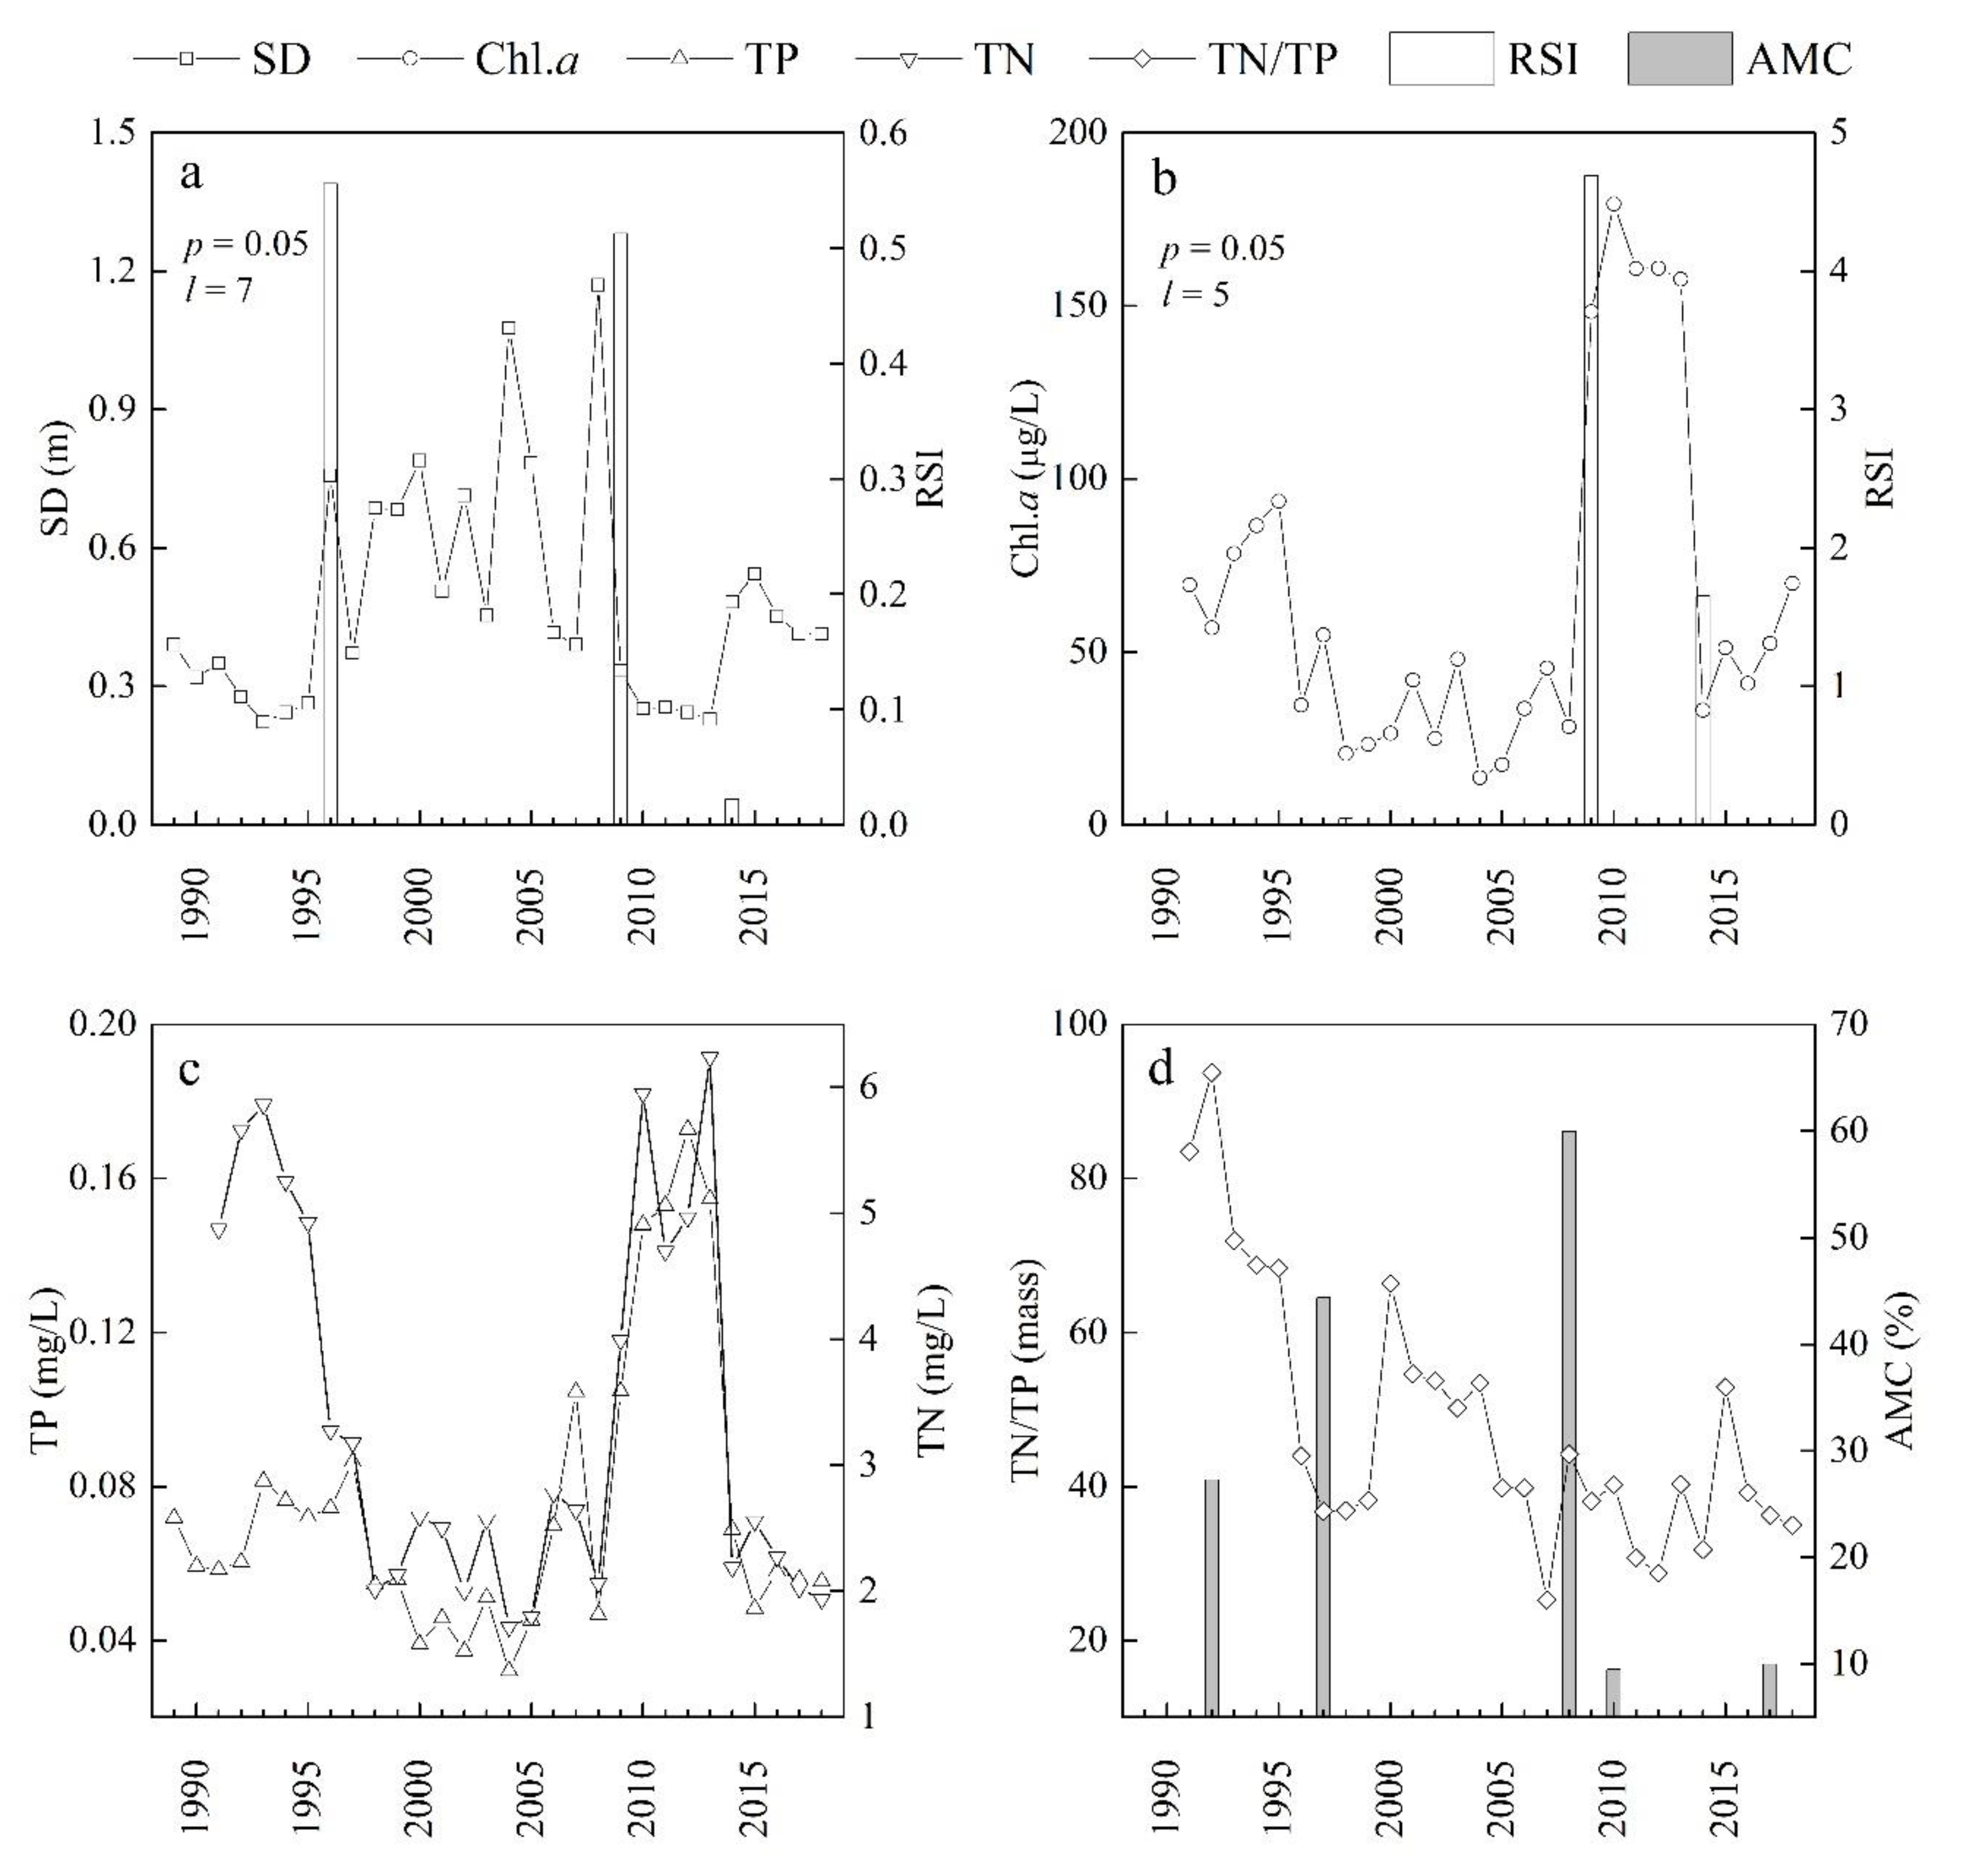
The RSI results, together with time series of the two indicators, are shown in Figure 2a,b. Generally, the RSI results of both SD and Chl.a have three significant change points. The first one was in 1996 (SD) or 1998 (Chl.a), the second one was in 2009 (SD and Chl.a) and the third one was in 2014 (SD and Chl.a). Because of the low RSI value of Chl.a in 1998, we classified the whole period of time series into four stages: Stage I (before 1996), Stage II (1996–2008), Stage III (2009–2013) and Stage IV (2014–2018). Obviously, the water quality was much better in Stage II and Stage IV than that in Stage I or Stage III, with larger SD and lower concentrations of TP, TN and Chl.a (Figure 2). The classification was also supported by the monitoring data of AMC in Lake Yilong. It indicated that the AMC in the lake in 1992, 1997, 2008, 2010 and 2017 were approximately 27.3, 44.4 and 60%, less than 10% and 10%, respectively (Figure 2c), showing the recovery of AMC from Stage I to Stage II and the decline of AMC from Stage II to Stage III. Therefore, we could generally identify the regime shift in 1996 (Stage I to Stage II) as a restorative type (from turbid state to clear state), the regime shift in 2009 (Stage II to Stage III) as a catastrophic type (from clear state to turbid state), and the regime shift in 2014 (Stage III to Stage IV) as a restorative type. In this study, the STARS method identified the regime shifts in Lake Yilong without an a priori hypothesis, so it is an effective data-driven algorithm for automatic computations.
For different indicators, the choice of l could be different. In the cases of p = 0.05 and l = 7, the RSI results of SD indicated that regime shifts occurred in the lake in 1996, 2009 and 2014. But the RSI results of Chl.a indicated the occurrence of regime shift in 1998, 2009 and 2014 when p = 0.05 and l = 5. These results are consistent with our classification of the regime shift type. During a restorative type regime shift, the structural change in the ecosystem takes longer, especially in the case of the large-scale restoration of aquatic macrophytes, for instance, during the period from Stage III to Stage IV in the present study. In contrast, during a catastrophic type regime shift, algae outbreaks can occur in a short time, further deteriorating the conditions for large-scale macrophyte restoration and strengthening the algae-type steady state [38]. The RSI value can reflect the intensity of the regime shift. The RSI value of Chl.a was much higher in 2009 than in 1998 and 2014. This result indicates that the intensity of change in biological structure in 2009 was higher than that in 1998 and 2014. Meanwhile, the RSI value of SD was the lowest in 2014, indicating the intensity of change in physical environment was the lowest in 2014.
3.2. Driving Forces for the Regime Shifts
The above analysis is mainly based on the sequential t-test analysis of response variables. It cannot represent the stressor-response relationships and thus cannot provide more evidence for future lake restoration decision making. Therefore, it is essential to explore what are the driving factors and how they cause the response variable changes. Factors driving regime shift in shallow lakes can be divided into two categories. First, regime shift occurs under strong external interference [6,39]. The most common driver is nutrient inputs. Second, regime shift also occurs without human interference or strong disturbances [40,41]. In the cases where regime shift occurs without strong human or external interference, the affected lakes are subjected to strong hydrological factors (e.g., flooding lakes dry up while boreal lakes may completely freeze, leading to fish kills that reset the structure of the lake ecosystem). In these cases, strong human or external interferences are indeed absent, but the drying and freezing under special hydrological and meteorological conditions constitute natural disturbances. Scheffer and Jeppesen [5] argued that the periodic regime shifts of shallow lake ecosystems might be caused by the adverse impact of macrophytes on the sediment and water quality, but they are most likely special cases due to special conditions of the lake (e.g., small area, high AMC, instability). Thus, except for special cases under the second category, ecological regime shifts occur in shallow lakes due to strong human interference or special hydrological and meteorological conditions when the nutrient conditions are met and the lake ecosystem is in a fragile and unstable state.
From July 2008 to June 2009, we monitored the flow and water quality of the main rivers of Lake Yilong, and simulated the inflows, TN and TP loads by SWAT model. The results showed that the loads of TN and TP in the lake were 12.9 t/(km2·a) and 1.52 t/(km2·a), respectively [35]. The concentrations of TN and TP in the lake were high and enough to support algal growth, which suggests that the nutrient conditions for a regime shift were fully met. In terms of the meteorological and hydrological conditions, since 1976, when the Qingyuwan Tunnel was built, the water level of Lake Yilong has been regulated artificially, but the lake dried up in 1981 and almost dried up in 2013 [20,42]. From 1989 to 2008, except for a gradual warming trend and a decreasing trend of wind speed, there were no extreme (inter-annual) changes in precipitation, as well as the lake area; though the annual precipitation decreased significantly from 2008 to 2009, the changes of the lake area and water depth were small [20]. Therefore, the regime shifts in 1996 and 2009 were not directly caused by special meteorological or hydrological conditions.
The above analysis suggests that the ecosystem regime shifts in Lake Yilong in 1996 and 2009 occurred under certain strong external disturbances, i.e., unexpected events, the prerequisites of which were long and excessive inputs of exogenous pollutants that caused the water body to be in an extremely fragile and unstable state. By tracking abnormal events that had not been previously recorded, we were able to speculate on the factors driving the two regime shifts. Since cage fish farming occurred between 1985 and 1997, we only estimated the TN and TP loads of cage fish for this period. For example, fish production in the cages of Lake Yilong was 39.5 kg/m2 and the total farmed area was almost 4000 m2 in 1992 according to the literatures [43,44]. The load of cage fish is 135.8 kg of TN and 19.4 kg of TP per ton of fish production according to Zhou et al [45]. Calculated from these, the TN and TP loads from cage fish were 21.5 and 3.07 t/y respectively in 1992 in Lake Yilong. In 1995, the practice was banned, and in 1998, it was completely abolished [43,44]. Intensive cage fish culture can exert an adverse impact on the aquatic ecosystem, i.e., it can increase the nutrient and organic matter loads, the suspended solids and the algal biomass [46,47], and subsequently decrease the SD [48]. Then, the lower SD combined with the anoxic sediment and other harmful habitat conditions [47,49] can reduce the submerged macrophytes. The abolition of cage fish culture in Lake Yilong coincided with the 1996 (and 1998) regime shifts, which can eliminate a series of adverse effects as mentioned above.
According to the one year field observations (from July 2008 to June 2009), the total TN and TP loads into Lake Yilong through rivers were 364.8 and 31.97 t, respectively; from January to June 2009, the TN and TP loads accounted for 27.5% and 35.6% of the annual total loads, respectively [35]. These results indicate that the exogenous nutrient load was not significantly increased in the early months of 2009, so the regime shift did not result from the increased exogenous nutrient load. The Chinese mitten crab (Eriocheir sinensis) was stocked in 2003 and was extended to a large area of 66.67 ha in 2006 in Lake Yilong [43], which has been shown to increase the pelagic nutrients (from benthic) and phytoplankton biomass [50] and have a negative impact on SD and submerged macrophytes [51]. Moreover, juvenile grass carp (Ctenopharyngodon idella, the juvenile one is omnivorous) fish were put into the lake by local authorities every year (1.833 t of juveniles were released on 21 and 28 April 2008). The release of the fry (ahead of schedule) from 10 January to 20 February 2009 (total amount of 30.353 t) could also have strongly triggered a regime shift by changing the habitat conditions and the community compositions via herbivory and/or top-down impacts [52,53]. The monthly concentrations of TN, TP and Chl.a increased and the monthly SD decreased in the lake from July 2008 to June 2009 [18]. Thus, it can be inferred that the main cause of the catastrophic regime shift of the lake ecosystem in 2009 was that too many grass carp fry were released too early, which may have exacerbated the eutrophication effects of previous crab stocking.
Van Geest et al [54] found that low water level is an important external driver for shifts between the two contrasting states, and a dry period could cause establishment of submerged macrophytes in the next year. In Lake Yilong, the drought during 2009–2013 reduced water levels by ~2.3 m. With the loss of ~0.67 billion m3 of water, the lake almost dried up in 2013 [20]. Subsequently, the local government implemented a rehydration project to replenish the lake by 45,000 m3 per day from January to February and by 74,000 m3 per day from June to December in 2014. The drought possibly caused the death of most fish and reset the structure of the lake ecosystem, while the subsequent hydration during early 2014 created a suitable habitat for the growth of aquatic macrophytes in Lake Yilong. Thus, the restorative shift in 2014 may be the result of the drought and succedent hydration.
3.3. Nutrient Thresholds for the Regime Shifts and the Hysteresis
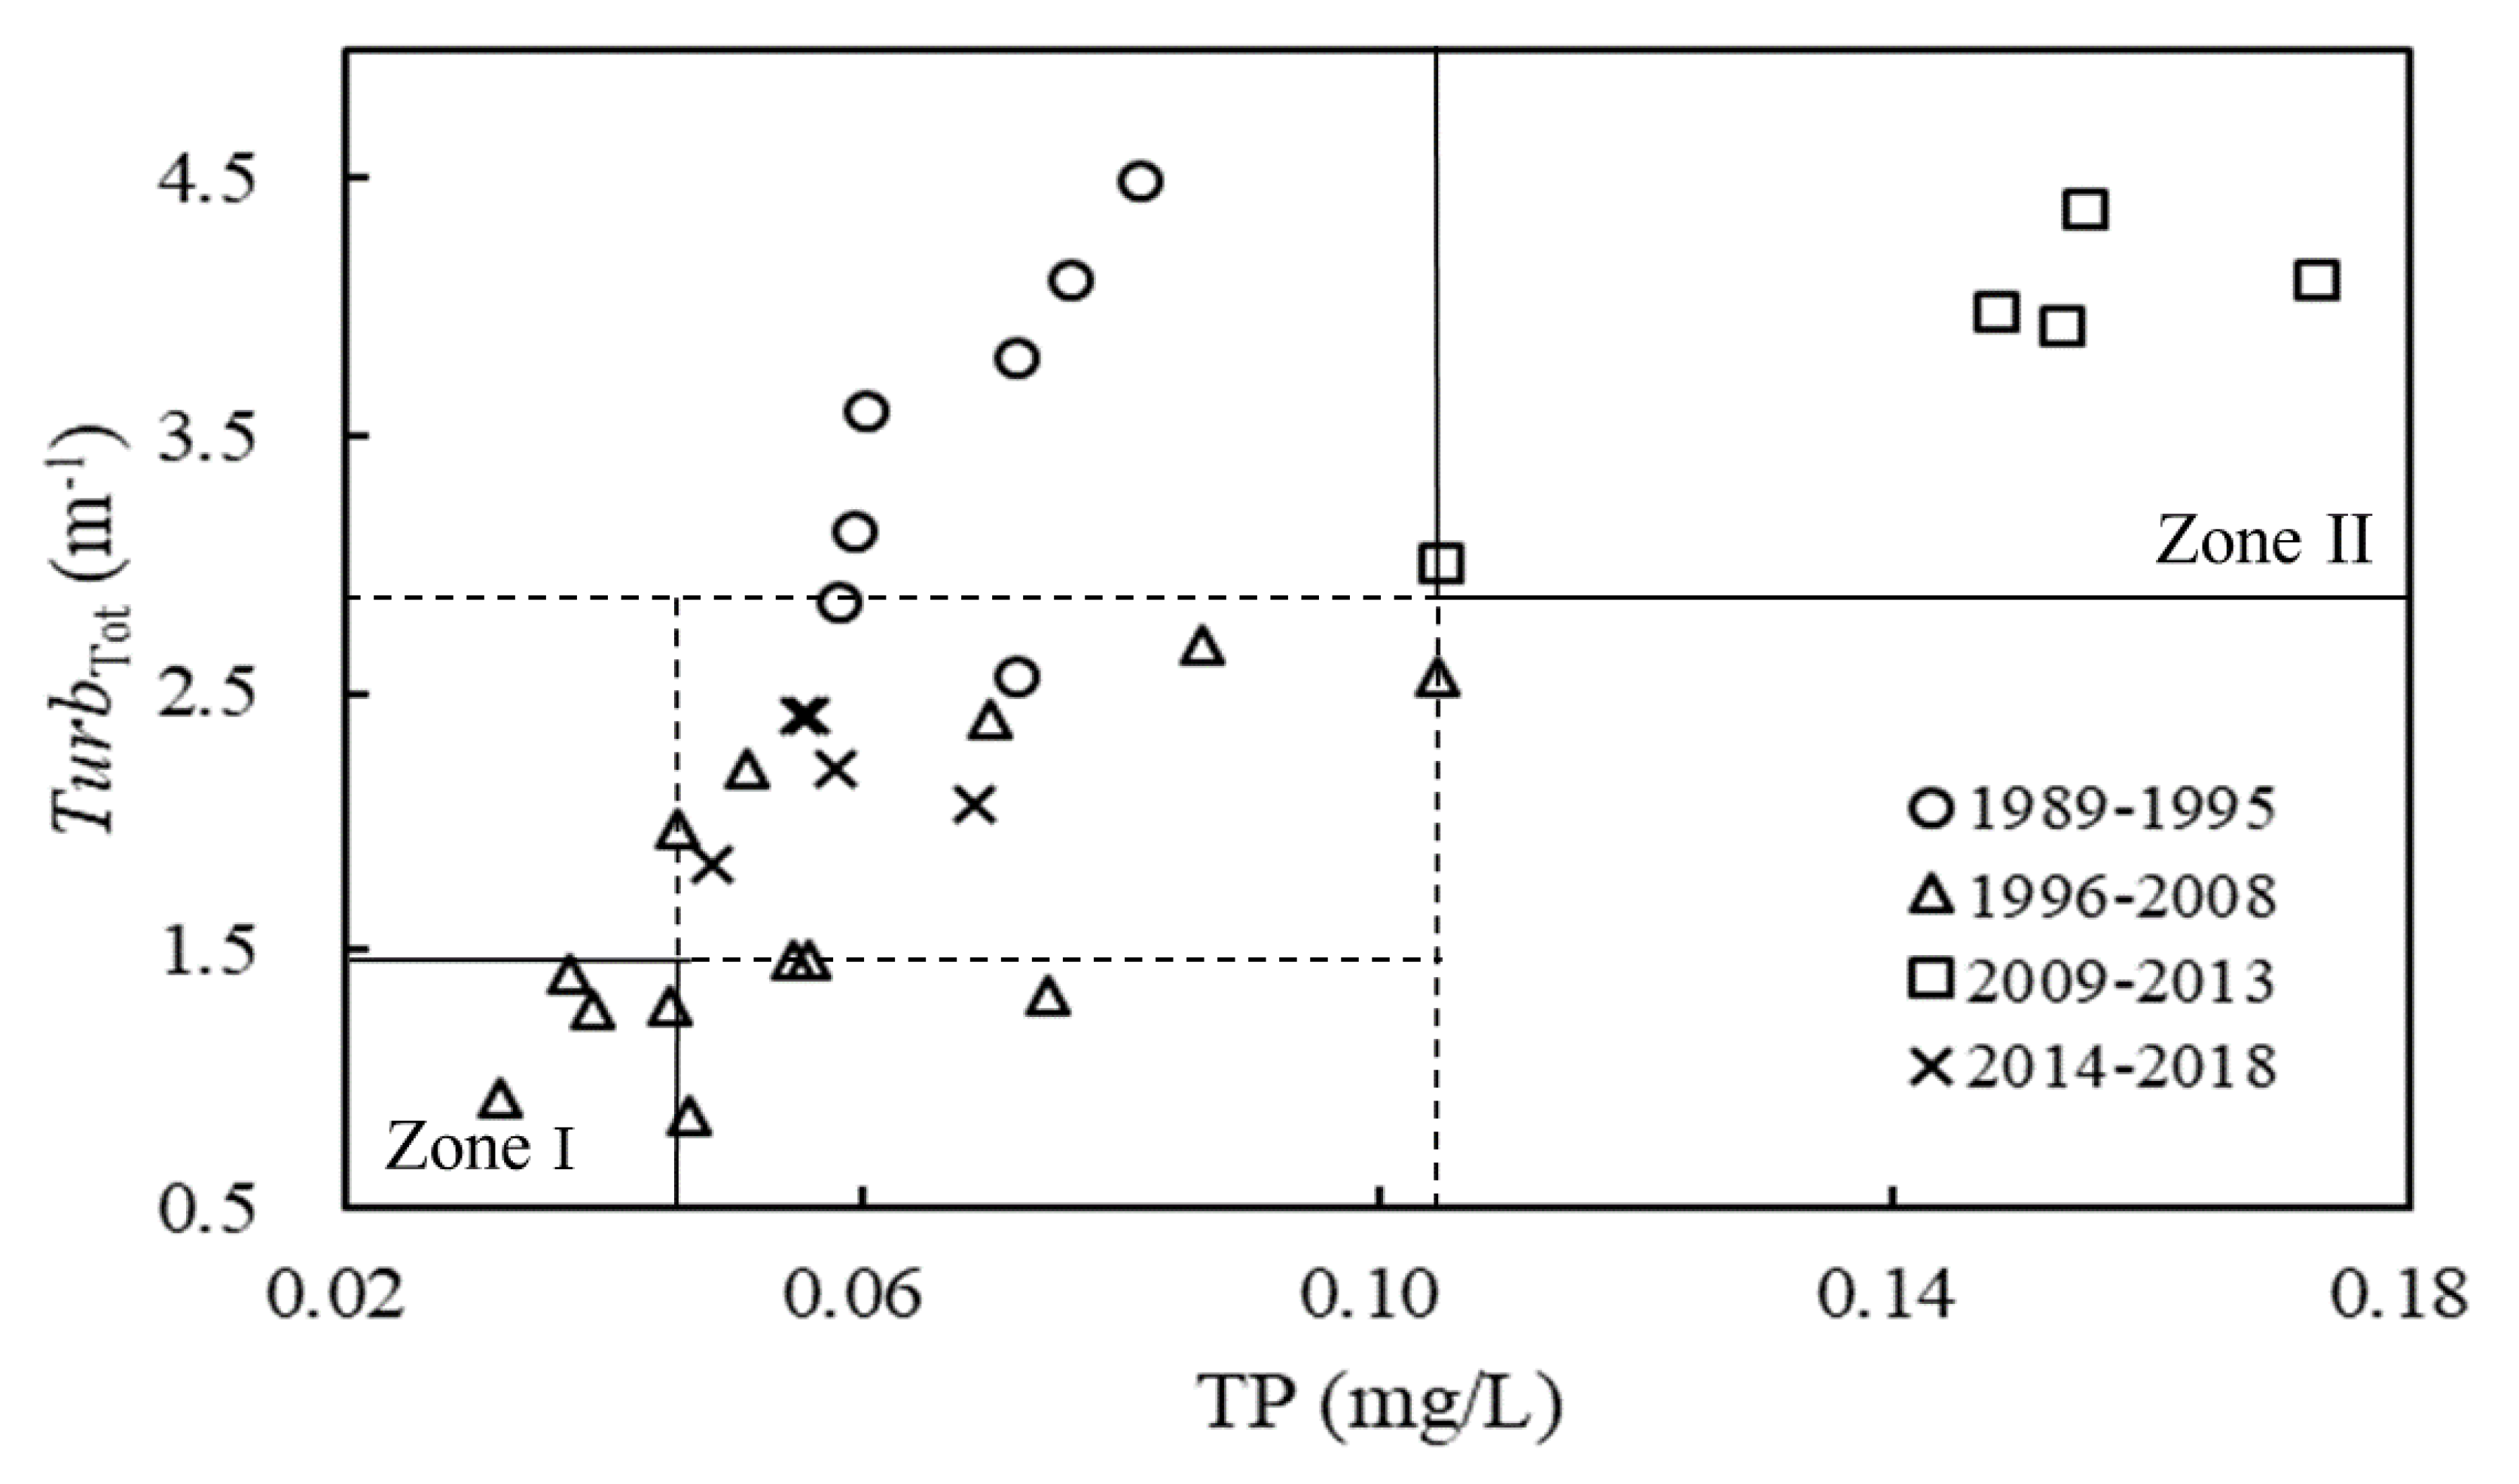
Nitrogen and phosphorus are the two most important nutrients affecting shallow lake ecosystems [55,56,57], and are also key indicators related to eutrophication in China. The present surface water quality standard of China (GB3838-2002) specifies the concentrations of TN and TP, but the Chl.a indicator is absent. Therefore, determining the threshold values of TN and TP under different steady states is significant for water quality management. We found that the Chl.a concentration was significantly correlated with the concentrations of TN and TP, where the correlation between Chl.a and TP (R2 = 0.802, p < 0.001) was higher than that between Chl.a and TN (R2 = 0.606, p < 0.001). Moreover, the average TN/TP ratio was about 48.05 ± 17.16 (range 25.26–94.33, by mass, Table 1). It is much higher than the Redfield’s ratio [58], indicating a likelihood of TP limitation [59]. Thus, the threshold value of TP can be calculated under the different steady states described above. The relationship between TurbTot and TP in Lake Yilong is shown in Figure 3. When TP was lower than 0.046 mg/L, the lake maintained a clear state, and when TP was higher than 0.105 mg/L, the lake maintained a turbid state. Wang et al [60] found that the range of TP thresholds for shallow lakes (from temperate to subtropical zones) to undergo a forward shift from the clear state to the turbid state was 0.08–0.12 mg/L, and that of TP for a backward shift was 0.04–0.06 mg/L. Similarly, the TP thresholds were 0.12 mg/L for a forward shift and less than 0.05 mg/L for a backward shift in the shallow Lake Bao’an in China [60], and were more than 0.10 mg/L for a forward shift and 0.04–0.06 mg/L for a backward shift in the shallow Lake Veluwe in the Netherlands [6]. These are essentially consistent with the results in this study.
Hysteresis is a process whereby lake ecosystems have a tendency to remain in a steady state (equilibrium) caused by several internal stabilizing factors, despite change in external factors [6]. It commonly occurs in recovery from eutrophication in shallow lakes [61]. In the present study, there were two trigger points of eutrophication mitigation; one was in 1996 when the lake shifted from Stage I to Stage II, and another one was in 2014, when it shifted from Stage III to Stage IV (Figure 2). From Stage III to Stage IV, the average TP decreased from 0.147 ± 0.025 mg/L during 2009–2013 to 0.057 ± 0.007 mg/L during 2014–2018, which was approximately equal to 0.057 ± 0.021 mg/L at Stage II (t-test, p > 0.05). From 1998 to 2015, the population in the watershed increased from 10,100 to 18,300, and we can conjecture that the external load was also increased; however, in contrast to Stage II, local government implemented a rehydration project to replenish Lake Yilong in 2014, so the drivers for responses of TN and TP in the lake may be rehydration and external nutrient loading. But the Chl.a and SD were 49.5 ± 13.8 μg/L, 0.46 ± 0.054 m respectively at Stage IV, which was higher than those at Stage II (Chl.a and SD were 31.8 ± 12.6 μg/L, 0.68 ± 0.25 m respectively). At the same time, the AMC remained at a stable state from 2010 to 2017 (Figure 2d). These results implied that there was a hysteresis existing in the lake during 2014–2018. Ibelings et al [6] conjectured that high nitrogen concentration may have contributed to hysteresis in the recovery of Lake Veluwe. In the present study, the trends of changes in TP and TN were nearly consistent (Figure 2c), suggesting that there were other potential factors stabilizing low macrophyte biomass (e.g., escaped grass carp) but not nutrients (TN). Unfortunately, it is difficult to analyze the mechanism of this hysteresis because of few data of aquatic communities. Because of inadequate data of the previous clear state pre-1989, hysteresis was not tested for the transition from Stages I to II.
According to the analysis above, adjusting the aquaculture (fish culture) strategy and water level are critical for the lake’s recovery from a turbid state. It is also important to continuously reduce nutrient loads in the future, because of existing hysteresis. Moreover, the quantitative impacts of fish culture on the lake ecosystem are unknown based on the observation dataset solely. Additionally, considering the high concentration of nutrients and the target of water quality management, it is also important to evaluate the effects of fish culture adjustment and hydrological regulation on the lake ecosystem, and comprehensive monitoring, including of aquatic communities, needs to be conducted in the future. Additionally, a process based on modelling of the lake ecosystem may be necessary to provide detailed information for better ecosystem management.
4. Conclusions
The results of RSI showed that during the period from 1989 to 2018, three regime shifts occurred in Lake Yilong, i.e., a restorative type in 1996 (1998) and 2014 from turbid state to clear state, and a catastrophic type in 2009 from clear state to turbid state. While the abolition of cage fish culture led to the restorative shift in 1996, inappropriate aquaculture (crab stocking and excessive premature fry release) possibly caused the catastrophic regime shift in 2009, and the drought and succedent hydration may have induced the restorative shift in 2014. The TP thresholds for the restorative and catastrophic type shifts were identified to be lower than 0.046 mg/L and higher than 0.105 mg/L in the lake, respectively, and an obvious hysteresis was observed in recent years. Therefore, we argue that aquaculture (fish culture) strategy adjustment and hydrological condition (e.g., water level) regulation are key to the lake ecosystem’s recovery, and recommend that hysteresis should be noticed in the future.
Author Contributions
Conceptualization, L.Z. and Q.Z.; Formal analysis, L.Z., M.W. and Z.L.; Funding acquisition, Q.Z.; Investigation, L.Z., M.W. and Q.Z.; Methodology, L.Z. and Z.L.; Writing—original draft, L.Z. and Z.L.; Writing—review & editing, L.Z., M.W. and Q.Z. All authors have read and agreed to the published version of the manuscript.
Funding
This work was supported by the National Key Research and Development Program of China (No. 2017YFA0605202).
Acknowledgments
We thank the Shiping County Environmental Monitoring Center that provided the historical data. We are grateful to the three anonymous reviewers for their constructive comments and linguistic assistance.
Conflicts of Interest
The authors declare no conflict of interest.
References
- Scheffer, M.; Carpenter, S.; Foley, J.A.; Folke, C.; Walker, B. Catastrophic shifts in ecosystems. Nature 2001, 413, 591–596. [Google Scholar] [CrossRef]
- Wilkinson, G.M.; Carpenter, S.R.; Cole, J.J.; Pace, M.L.; Batt, R.D.; Buelo, C.D.; Kurtzweil, J.T. Early warning signals precede cyanobacterial blooms in multiple whole-lake experiments. Ecol. Monogr. 2018, 88, 188–203. [Google Scholar] [CrossRef]
- Scheffer, M.; Carpenter, S.R. Catastrophic regime shifts in ecosystems: Linking theory to observation. Trends Ecol. Evol. 2003, 18, 648–656. [Google Scholar] [CrossRef]
- Hargeby, A.; Blindow, I.; Andersson, G. Long-term patterns of shifts between clear and turbid states in Lake Krankesjön and Lake Tåkern. Ecosystems 2007, 10, 29–36. [Google Scholar] [CrossRef]
- Scheffer, M.; Jeppesen, E. Regime shifts in shallow lakes. Ecosystems 2007, 10, 1–3. [Google Scholar] [CrossRef] [Green Version]
- Ibelings, B.W.; Portielje, R.; Lammens, E.H.R.R.; Noordhuis, R.; van den Berg, M.S.; Joosse, W.; Meijer, M.L. Resilience of alternative stable states during the recovery of shallow lakes from eutrophication: Lake Veluwe as a case study. Ecosystems 2007, 10, 4–16. [Google Scholar] [CrossRef] [Green Version]
- Brothers, S.M.; Hilt, S.; Attermeyer, K.; Grossart, H.P.; Kosten, S.; Lischke, B.; Mehner, T.; Meyer, N.; Scharnweber, K.; Köhler, J. A regime shift from macrophyte to phytoplankton dominance enhances carbon burial in a shallow, eutrophic lake. Ecosphere 2013, 4, art137. [Google Scholar] [CrossRef]
- Cao, X.; Wang, J.; Liao, J.; Sun, J.; Huang, Y. The threshold responses of phytoplankton community to nutrient gradient in a shallow eutrophic Chinese lake. Ecol. Indic. 2016, 61, 258–267. [Google Scholar] [CrossRef]
- Janssen, A.B.G.; de Jager, V.C.L.; Janse, J.H.; Kong, X.; Liu, S.; Ye, Q.; Mooij, W.M. Spatial identification of critical nutrient loads of large shallow lakes: Implications for Lake Taihu (China). Water Res. 2017, 119, 276–287. [Google Scholar] [CrossRef]
- Smith, V.H.; Schindler, D.W. Eutrophication science: Where do we go from here? Trends Ecol. Evol. 2009, 24, 201–207. [Google Scholar] [CrossRef]
- Hilt, S.; Brothers, S.; Jeppesen, E.; Veraart, A.J.; Kosten, S. Translating regime shifts in shallow lakes into changes in ecosystem functions and services. BioScience 2017, 67, 928–936. [Google Scholar] [CrossRef]
- Hunsicker, M.E.; Kappel, C.V.; Selkoe, K.A.; Halpern, B.S.; Scarborough, C.; Mease, L.; Amrhein, A. Characterizing driver–response relationships in marine pelagic ecosystems for improved ocean management. Ecol. Appl. 2016, 26, 651–663. [Google Scholar] [CrossRef]
- Andersen, T.; Carstensen, J.; Hernández-García, E.; Duarte, C.M. Ecological thresholds and regime shifts: Approaches to identification. Trends Ecol. Evol. 2009, 24, 49–57. [Google Scholar] [CrossRef] [PubMed] [Green Version]
- Larned, S.T.; Schallenberg, M. Stressor-response relationships and the prospective management of aquatic ecosystems. N. Z. J. Mar. Freshw. Res. 2019, 53, 489–512. [Google Scholar] [CrossRef]
- Gal, G.; Anderson, W. A novel approach to detecting a regime shift in a lake ecosystem. Methods Ecol. Evol. 2010, 1, 45–52. [Google Scholar] [CrossRef]
- Crépin, A.-S.; Biggs, R.; Polasky, S.; Troell, M.; de Zeeuw, A. Regime shifts and management. Ecol. Econ. 2012, 84, 15–22. [Google Scholar] [CrossRef]
- Levin Phillip, S.; Möllmann, C. Marine ecosystem regime shifts: Challenges and opportunities for ecosystem-based management. Philos. Trans. R. Soc. B Biol. Sci. 2015, 370, 20130275. [Google Scholar] [CrossRef] [Green Version]
- Wei, X.; Tang, G.-m. Changes of nutrients and aquatic ecosystem of Yilong Lake in recent twenty decades. Environ. Sci. Surv. 2014, 33, 9–14. [Google Scholar] [CrossRef]
- Liu, W.; Ning, P.; Sun, X.; Ma, Q. The evolution tendency of water quality and aquatic system in Lake Yilong. Environ. Sci. Technol. 2018, 41, 281–287. [Google Scholar] [CrossRef]
- Hu, K.; Chen, G.; Gregory-Eaves, I.; Huang, L.; Chen, X.; Liu, Y.; Leavitt, P.R. Hydrological fluctuations modulate phototrophic responses to nutrient fertilization in a large and shallow lake of Southwest China. Aquat. Sci. 2019, 81, 37. [Google Scholar] [CrossRef]
- Zhao, L.; Li, Y.; Zou, R.; He, B.; Zhu, X.; Liu, Y.; Wang, J.; Zhu, Y. A three-dimensional water quality modeling approach for exploring the eutrophication responses to load reduction scenarios in Lake Yilong (China). Environ. Pollut. 2013, 177, 13–21. [Google Scholar] [CrossRef] [PubMed]
- Anttila, S.; Ketola, M.; Kuoppamäki, K.; Kairesalo, T. Identification of a biomanipulation-driven regime shift in Lake Vesijärvi: Implications for lake management. Freshw. Biol. 2013, 58, 1494–1502. [Google Scholar] [CrossRef]
- Ramstack Hobbs, J.M.; Hobbs, W.O.; Edlund, M.B.; Zimmer, K.D.; Theissen, K.M.; Hoidal, N.; Domine, L.M.; Hanson, M.A.; Herwig, B.R.; Cotner, J.B. The legacy of large regime shifts in shallow lakes. Ecol. Appl. 2016, 26, 2662–2676. [Google Scholar] [CrossRef] [PubMed]
- van Leeuwen, E.; Lacerot, G.; van Nes, E.H.; Hemerik, L.; Scheffer, M. Reduced top–down control of phytoplankton in warmer climates can be explained by continuous fish reproduction. Ecol. Model. 2007, 206, 205–212. [Google Scholar] [CrossRef]
- Schallenberg, M.; Sorrell, B. Regime shifts between clear and turbid water in New Zealand lakes: Environmental correlates and implications for management and restoration. N. Z. J. Mar. Freshw. Res. 2009, 43, 701–712. [Google Scholar] [CrossRef] [Green Version]
- Makarewicz, J.C.; Lewis, T.W.; Makarewicz, J.A. Invasive species induced food web disruption, alternative regimes, and cyanobacteria dominance in a pelagic food web: A case history. Inland Waters 2016, 6, 35–53. [Google Scholar] [CrossRef]
- Ratajczak, Z.; Carpenter, S.R.; Ives, A.R.; Kucharik, C.J.; Ramiadantsoa, T.; Stegner, M.A.; Williams, J.W.; Zhang, J.; Turner, M.G. Abrupt change in ecological systems: Inference and diagnosis. Trends Ecol. Evol. 2018, 33, 513–526. [Google Scholar] [CrossRef]
- Rodionov, S.N. A sequential algorithm for testing climate regime shifts. Geophys. Res. Lett. 2004, 31, L09204. [Google Scholar] [CrossRef] [Green Version]
- Rodionov, S. A sequential method of detecting abrupt changes in the correlation coefficient and its application to Bering Sea climate. Climate 2015, 3, 474–491. [Google Scholar] [CrossRef] [Green Version]
- Reid, P.C.; Hari, R.E.; Beaugrand, G.; Livingstone, D.M.; Marty, C.; Straile, D.; Barichivich, J.; Goberville, E.; Adrian, R.; Aono, Y.; et al. Global impacts of the 1980s regime shift. Glob. Chang. Biol. 2016, 22, 682–703. [Google Scholar] [CrossRef] [Green Version]
- Zhou, J.; Liang, Z.; Liu, Y.; Guo, H.; He, D.; Zhao, L. Six-decade temporal change and seasonal decomposition of climate variables in Lake Dianchi watershed (China): Stable trend or abrupt shift? Theor. Appl. Climatol. 2015, 119, 181–191. [Google Scholar] [CrossRef]
- Rodionov, S.; Overland, J.E. Application of a sequential regime shift detection method to the Bering Sea ecosystem. ICES J. Mar. Sci. 2005, 62, 328–332. [Google Scholar] [CrossRef]
- Frank, K.T.; Petrie, B.; Fisher, J.A.D.; Leggett, W.C. Transient dynamics of an altered large marine ecosystem. Nature 2011, 477, 86. [Google Scholar] [CrossRef] [PubMed]
- Vert-pre, K.A.; Amoroso, R.O.; Jensen, O.P.; Hilborn, R. Frequency and intensity of productivity regime shifts in marine fish stocks. Proc. Natl. Acad. Sci. USA 2013, 110, 1779. [Google Scholar] [CrossRef] [PubMed] [Green Version]
- Zhao, L. The Regime Shifts and Inversion of Catastrophic Driving Factors in the Ecosystems of Yilong Lake, Yunnan. Ph.D. Thesis, University of Chinese Academy of Sciences, Beijing, China, 2013. [Google Scholar]
- Portielje, R.; Van der Molen, D.T. Relationships between eutrophication variables: From nutrient loading to transparency. Hydrobiologia 1999, 408, 375–387. [Google Scholar] [CrossRef]
- Wang, F.; Zhao, G.; Mu, X.; Gao, P.; Sun, W. Regime shift identification of runoff and sediment loads in the Yellow River Basin, China. Water 2014, 6, 3012–3032. [Google Scholar] [CrossRef] [Green Version]
- van Nes, E.H.; Arani, B.M.S.; Staal, A.; van der Bolt, B.; Flores, B.M.; Bathiany, S.; Scheffer, M. What do you mean, ‘tipping point’? Trends Ecol. Evol. 2016, 31, 902–904. [Google Scholar] [CrossRef]
- Jeppesen, E.; Jensen, J.P.; Kristensen, P.; Søndergaard, M.; Mortensen, E.; Sortkjær, O.; Olrik, K. Fish manipulation as a lake restoration tool in shallow, eutrophic, temperate lakes 2: Threshold levels, long-term stability and conclusions. In Biomanipulation Tool for Water Management; Gulati, R.D., Lammens, E.H.R.R., Meijer, M.-L., van Donk, E., Eds.; Springer: Dordrecht, The Netherlands, 1990; Volume 61, pp. 219–227. [Google Scholar]
- Balayla, D.; Lauridsen, T.L.; Søndergaard, M.; Jeppesen, E. Larger zooplankton in Danish lakes after cold winters: Are winter fish kills of importance? Hydrobiologia 2010, 646, 159–172. [Google Scholar] [CrossRef]
- Bayley, S.E.; Creed, I.F.; Sass, G.Z.; Wong, A.S. Frequent regime shifts in trophic states in shallow lakes on the Boreal Plain: Alternative “unstable” states? Limnol. Oceanogr. 2007, 52, 2002–2012. [Google Scholar] [CrossRef] [Green Version]
- Cui, B.; Zhai, H. Characteristics of wetland functional degradation and its ecological water requirement for restoration in Yilong Lake of Yunnan Plateau. Chin. Sci. Bull. 2006, 51, 127–135. [Google Scholar] [CrossRef]
- Li, X. Present situation and countermeasures of fishery industry development in Lake Yilong, Shiping County. Mod. Agric. Sci. Technol. 2014, 328–329, 333. [Google Scholar]
- Shi, L.; Sun, Q. Brief talk on effect of aquatic plant purifying water body of Yilonghu Lake. Yunnan Environ. Sci. 2005, 24, 40–42. [Google Scholar]
- Zhou, Z.-C.; Shen, Y.-C.; Xue, H.-B. Temporal and spatial variation of nitrogen and phosphorus and their load estimation in cage-culture waters in Liusha Bay, Guangdong. J. Guangdong Ocean Univ. 2014, 34, 65–69. [Google Scholar]
- Stirling, H.P.; Dey, T. Impact of intensive cage fish farming on the phytoplankton and periphyton of a Scottish freshwater loch. Hydrobiologia 1990, 190, 193–214. [Google Scholar] [CrossRef]
- Wu, R.S.S. The environmental impact of marine fish culture: Towards a sustainable future. Mar. Pollut. Bull. 1995, 31, 159–166. [Google Scholar] [CrossRef]
- Zhou, Q.; Wang, W.; Huang, L.; Zhang, Y.; Qin, J.; Li, K.; Chen, L. Spatial and temporal variability in water transparency in Yunnan Plateau lakes, China. Aquat. Sci. 2019, 81, 36. [Google Scholar] [CrossRef]
- Njiru, J.M.; Aura, C.M.; Okechi, J.K. Cage fish culture in Lake Victoria: A boon or a disaster in waiting? Fish. Manag. Ecol. 2018. [Google Scholar] [CrossRef]
- Kotta, J.; Wernberg, T.; Jänes, H.; Kotta, I.; Nurkse, K.; Pärnoja, M.; Orav-Kotta, H. Novel crab predator causes marine ecosystem regime shift. Sci. Rep. 2018, 8, 4956. [Google Scholar] [CrossRef] [Green Version]
- Wang, H.-J.; Xu, C.; Wang, H.-Z.; Kosten, S. Long-term density dependent effects of the Chinese mitten crab (Eriocheir sinensis (H. Milne Edwards, 1854)) on submersed macrophytes. Aquat. Bot. 2017, 140, 84–91. [Google Scholar] [CrossRef]
- Matsuzaki, S.-I.S.; Usio, N.; Takamura, N.; Washitani, I. Effects of common carp on nutrient dynamics and littoral community composition: Roles of excretion and bioturbation. Fundam. Appl. Limnol. 2007, 168, 27–38. [Google Scholar] [CrossRef]
- Matsuzaki, S.-I.S.; Usio, N.; Takamura, N.; Washitani, I. Contrasting impacts of invasive engineers on freshwater ecosystems: An experiment and meta-analysis. Oecologia 2009, 158, 673–686. [Google Scholar] [CrossRef]
- Van Geest, G.J.; Coops, H.; Scheffer, M.; van Nes, E.H. Long transients near the ghost of a stable state in eutrophic shallow lakes with fluctuating water levels. Ecosystems 2007, 10, 37–47. [Google Scholar] [CrossRef] [Green Version]
- Conley, D.J.; Paerl, H.W.; Howarth, R.W.; Boesch, D.F.; Seitzinger, S.P.; Havens, K.E.; Lancelot, C.; Likens, G.E. Controlling eutrophication: Nitrogen and phosphorus. Science 2009, 323, 1014–1015. [Google Scholar] [CrossRef]
- Heisler, J.; Glibert, P.M.; Burkholder, J.M.; Anderson, D.M.; Cochlan, W.; Dennison, W.C.; Dortch, Q.; Gobler, C.J.; Heil, C.A.; Humphries, E.; et al. Eutrophication and harmful algal blooms: A scientific consensus. Harmful Algae 2008, 8, 3–13. [Google Scholar] [CrossRef] [Green Version]
- Le Moal, M.; Gascuel-Odoux, C.; Ménesguen, A.; Souchon, Y.; Étrillard, C.; Levain, A.; Moatar, F.; Pannard, A.; Souchu, P.; Lefebvre, A.; et al. Eutrophication: A new wine in an old bottle? Sci. Total Environ. 2019, 651, 1–11. [Google Scholar] [CrossRef] [PubMed] [Green Version]
- Redfield, A.C. The biological control of chemical factors in the environment. Am. Sci. 1958, 46, 230A, 205–221. [Google Scholar] [CrossRef]
- Liang, Z.; Wu, S.; Chen, H.; Yu, Y.; Liu, Y. A probabilistic method to enhance understanding of nutrient limitation dynamics of phytoplankton. Ecol. Model. 2018, 368, 404–410. [Google Scholar] [CrossRef]
- Wang, H.-J.; Wang, H.-Z.; Liang, X.-M.; Wu, S.-K. Total phosphorus thresholds for regime shifts are nearly equal in subtropical and temperate shallow lakes with moderate depths and areas. Freshw. Biol. 2014, 59, 1659–1671. [Google Scholar] [CrossRef] [Green Version]
- Scheffer, M. Ecology of Shallow Lakes; Springer: Dordrecht, The Netherlands, 1998; Volume 22. [Google Scholar]
Figure 1.
Location of Lake Yilong.

Figure 2.
Detection of regime shifts based on the regime shift index (RSI) derived from water transparency (Secchi disk depth, SD, (a)) and chlorophyll a (Chl.a, (b)), and variations of total phosphorus (TP) and total nitrogen (TN) (c), and the TN/TP ratio (by mass) and aquatic macrophyte coverage (AMC) (d).

Figure 3.
TP thresholds for regime shifts (Zone I indicates the lake maintained a clear state, Zone II indicates the lake maintained a turbid state; TurbTot, total turbidity; TP, total phosphorus).
Figure 3.
TP thresholds for regime shifts (Zone I indicates the lake maintained a clear state, Zone II indicates the lake maintained a turbid state; TurbTot, total turbidity; TP, total phosphorus).


Table 1.
Basic limnological parameters and the key events since the 1980s of Lake Yilong.
| Basic Limnological Parameters | Key Events | ||||
|---|---|---|---|---|---|
| Parameters | Values | Parameters | Values | Year | Events |
| Elevation (m a.s.l) | 1414 | TN load (t/(km2·a)) | 12.9 a | 1981 | The lake dried up |
| Watershed area (km2) | 360.4 | TP load (t/(km2·a)) | 1.52 a | 1985–1998 | Cage fish (farmed in 1985, removed during 1995–1998) |
| Lake area (km2) | 28.4 | SD (m) | 0.48 ± 0.25 b | 2003 | Crab stocking |
| Maximum depth (m) | 5.7 | Chl.a (μg/L) | 66.16 ± 49.71 b | 2008–2011 | Fish farming (amount of 30.353 t juvenile fish were put into the lake in Jan. 10th to Feb. 20th, 2009) |
| Mean depth (m) | 3.9 | TN (mg/L) | 3.38 ± 1.51 b | 2009–2013 | Drought (the lake almost dried up in 2013) |
| WRT (year) | 1.94 | TP (mg/L) | 0.07 ± 0.04 b | 2014 | A rehydration project was implemented to replenish the lake |
| Trophic state | eutrophic | TN/TP ratio (by mass) | 48.05 ± 17.16 b | 2016 | Integrated management of the lake watershed was largely started |
WRT, water residence time; SD, Secchi disk depth; TN, total nitrogen; TP, total phosphorus; Chl.a, chlorophyll a. a cited from the literature [35]; b mean ± Sd.
© 2020 by the authors. Licensee MDPI, Basel, Switzerland. This article is an open access article distributed under the terms and conditions of the Creative Commons Attribution (CC BY) license (http://creativecommons.org/licenses/by/4.0/).
Share and Cite
MDPI and ACS Style
Zhao, L.; Wang, M.; Liang, Z.; Zhou, Q. Identification of Regime Shifts and Their Potential Drivers in the Shallow Eutrophic Lake Yilong, Southwest China. Sustainability 2020, 12, 3704. https://0-doi-org.brum.beds.ac.uk/10.3390/su12093704
AMA Style
Zhao L, Wang M, Liang Z, Zhou Q. Identification of Regime Shifts and Their Potential Drivers in the Shallow Eutrophic Lake Yilong, Southwest China. Sustainability. 2020; 12(9):3704. https://0-doi-org.brum.beds.ac.uk/10.3390/su12093704
Chicago/Turabian StyleZhao, Lei, Mingguo Wang, Zhongyao Liang, and Qichao Zhou. 2020. "Identification of Regime Shifts and Their Potential Drivers in the Shallow Eutrophic Lake Yilong, Southwest China" Sustainability 12, no. 9: 3704. https://0-doi-org.brum.beds.ac.uk/10.3390/su12093704
Note that from the first issue of 2016, this journal uses article numbers instead of page numbers. See further details here.