Article

Production Risk and Competency among Categorized Rice Peasants: Cross-Sectional Evidence from an Emerging Country

1
School of Economics and Management, Yangtze University, Jingzhou 434023, China
2
College of Economics and Management, Huazhong Agricultural University, Wuhan 430070, China
3
Dean Faculty of Social Sciences, PMAS Arid Agriculture University Rawalpindi, Rawalpindi 46300, Pakistan
4
Institute of Agricultural and Resource Economics, University of Agriculture, Faisalabad 38040, Pakistan
5
Department of Agricultural Economics, Sindh Agriculture University, Tandojam 70060, Pakistan
*
Authors to whom correspondence should be addressed.
Sustainability 2020, 12(9), 3770; https://0-doi-org.brum.beds.ac.uk/10.3390/su12093770
Submission received: 10 March 2020 / Revised: 20 April 2020 / Accepted: 23 April 2020 / Published: 6 May 2020

Abstract

:
Pakistan is an agrarian economy confronting both risk and uncertainty. Rural migration to urban and off-farm work is increasing in the country. Off-farm work assists in decreasing risk and uncertainty while technical efficiency is linked with off-farm employment. This research effort aims at investigating the underpinnings of production characteristics, risk, and efficiency across categories of rice farmers, i.e., with and without off-farm work, by developing two stochastic frontier models. Empirical results reveal that both groups of farmers are using inputs in different ways, subsequently production varies across these groups. Farmers in both the categories have common characteristics in terms of production function. Coefficient of family size is positively significant to the group of farmers having off-farm work while negatively associated to their counterparts. High temperature and prevalence of disease found risk increasing factors. Though one group is more efficient, in general both groups are technically inefficient. The short-term policy focus should be diverted to ensuring availability and timely application of inputs to enhance efficiency. In the long run, policy initiatives need to be taken towards rural development by providing employment facilitating social and economic infrastructure, along with focus on Research and Development (R&D) particularly keeping the rice belt in view.

1. Introduction

Participation in off-farm employment is an importunate phenomenon among rural populations in both developed and developing countries. With the passage of time, reliance on off-farm work has increased progressively among rural populations [1]. Numbers of countries have been associated with the significance of nonfarm work and earned income is found to be 20% to 75% among households [2,3,4,5,6,7]. For instance, 70% of rural households were found intricate in off-farm activities in Taiwan; 65% in the United States of America; 74% in Ghana; and 50% in the Kwara state of Nigeria [8,9,10,11]. Similarly, farmers’ involvement in nonfarm work in Latin American countries was found to be 40%, while Dutch farmers’ involvement is at 35% [12]. With the income from nonfarm work being a category of significant importance to farmers, much research has been done for the wellbeing of families [13,14,15].
The impact of nonfarm employment on the production of farms has been elaborated in great detail in previous research. For instance, a study was conducted about off-farm involvement and its impact on the production of farms. A negative relation was found between nonfarm work and production [16]. Similarly, Goodwin and Mishra [17] found that households that undertake off-farm work are less efficient. Another study showed that off-farm employment has negative effects on dairy farms [18]. In contrast, recent studies revealed positive effects of nonfarm activities on the technical efficiency of farmers. For instance, Ahmed and Melesse [19] stated that maize farmers who had off-farm employment had enlarged technical efficiency compared to their counterparts. Some other studies also revealed significance and positive relations among nonfarm employment and technical efficiency in the cases of Chinese, Ethiopian, and Slovenian farmers [20,21,22].
Many scholars have worked on risk in agriculture production in their studies such as Arshad et al.; Huang et al.; Mane and Watkins; Parry et al. [23,24,25,26]. Research about production risk in agriculture sector has huge connotations. Scholars are struggling hard to study it for agricultural sustainability and for food security of growing populations. An earlier study disclosed that nonfarm activities are crucial for rural households to maintain their income input price risks instead of labour wages [15]. Off-farm work is cognizant to best management strategy among rice farmers in Pakistan [27]. Production theory reveals that risk-averse farmers will allocate their labour to off-farm employment to gain margin in on-farm income, and small farmers were found to be more risk-averse [10,28,29,30]. In a very recent study, Chomba and Nyang’au conducted research in Kenya about rice, coffee, and dairy farmers, and found that risk management as a growth-increasing technique and innovation also shows positive impacts on farmers’ competency and growth [31]. Further, another study conducted in Indonesia shows in its results that rice farmers are facing numerous risks, but by adopting different techniques, their competency has increased rice growth [32]. Additionally, involvement of rural households in nonfarm activities is helping to reduce poverty and income inequality [33,34]. Gross domestic production (GDP) is increased by off-farm activities in developing countries [35,36,37].
The agriculture sector provides food to more than 7 billion people and shares more than 50% in revenue of the world’s population [38]. The sector is a mainstay of Pakistan’s economy, contributing 18.9% to its gross domestic product (GDP) and employing of 42.3% of its labour force. More than 60% of the population of the country lives in rural areas and depends directly or indirectly on this sector [39]. It provides the bulk of inputs to the agriculture-based industries in the country.
Rice is cultivated on 11% of the total agricultural area in the country. It is not only considered a second staple food, but also provides greater foreign exchange revenue. Its shares in value added to the agriculture sector is 3.1%, and 0.6% to the GDP [39]. Rice farmers are facing low yield per acre and comparatively much less than other rice growing countries [40]. Risk is a persistent characteristic for the rural life in developing countries like Pakistan. The economy of any country depends on weather conditions [41]. Heavy rains in monsoon seasons and floods had negative repercussions on the agriculture sector in the 2010, 2012, and 2014 seasons in Pakistan. As forecasted globally, utilization of rice in the coming years will increase by 1.5% due to the increasing population in Asia and rising demand in Africa [42]. On the other hand, in a recent study it was realized that the factors of education, small farms, and large family size stimulate Pakistani farmers’ participation in off-farm work [34]. Moreover, 23.6% of households were involved in off-farm activitiesformally, while the rest were engaged informally in Pakistan [43] In this study, off-farm work comprises labour (includes labour on daily wages on farm, different types of mechanics, transport operations, construction labour), self-employment (comprises shop keepers, commission agents and fertilizers or pesticide business, any type of trader), public & private services (consists all types of employment in public and private sector institutions, teachers, lawyers, doctors), and migration (includes migration temporary inside or out of the country).
Developing countries are the facing serious issue of productivity stagnation, like in Pakistan. Climate change, weather uncertainty (i.e., rainfall and temperature), and crop disease are associated with production risk [26,29,44]. On the other hand, usage of fertilizer, chemical, and capital are enhancing the yield [44]. It is quite necessary to check and overcome the responding factors that constrain the maximization of yield and promote risk. Hence, the objective of the present study is to assimilate the performance of productions behavior among categorized rice farmers in Pakistan. The present study adds reasonable scholarly value to earlier research on the effect of off-farm employment on production risk and technical efficiency altogether. In South Asia’s perspective in general, and in Pakistan’s perspective in particular, this is a novel research endeavor towards the lesser-researched subject matter of rice farmers.

2. Theoretical Framework

According to the literature review, a general theoretical framework was built to examine the production function and labor allocation among households which deal with production risk [14,45,46]. There is fixed operator time of a day ( E ¯ ), where time spent on farm production = ( L ) ; time spent for off-farm work = ( L m ) ; and leisure time = ( l ) . There are two sources of income of households in rural areas, i.e., income from the agriculture sector as well as from off-farm employment. By following Kumbhakar; Chang and Wen [47,48], production function for labour is represented as follows:
F ( L ) = f ( L ) + g ( l ) ε h ( L ) u
where f ( . ) represents the input’s impact on mean level of output and g ( . ) characterizes the input’s impact on the mean level of risk production, and where ε represents an error term which is allied with risk of output, and supposes that it follows distribution (an arbitrary one) of ε ~ i . i . . d . . ( 0 , σ ε 2 ) . Positive g ( . ) reflects the input as increasing risk, while negative g ( . ) considers the input as risk reduction and h ( . ) u represents the efficiency of production, whereas u   ~   i . . i . . d . . ( u , ¯ σ u 2 ) . reflects a random noise to the stochastic frontier function of production, where, consumption ( C ) and leisure time ( l ) influenced the utility of the rice households. Utility of the households can be maximized with total income and constraint time.
Hence,
M a x c . l = E U ( c , l ) ,
C = P [ f ( L ) + g ( l ) h ( L ) u ] + w L m
E = L + l + L m
where expected utility for each farm is denoted by E U ( . ) , here P indicates agricultural commodity price and w represents nonfarm wages rates’ equilibrium.
By substituting Equations (2) and (3) in Equation (1) to solve the model, we get the following equation.
M a x L , L m = E U { { P [ f ( L ) + g ( L ) ε h ( L ) u ] + w L m } ,   { E ¯ L L m } }
As Kuhn Tucker, first order necessary condition, allocated time on the farm and off-farm work, denoted as follows:
E U ( . ) L = E U ( . ) C P ( f L + g L ε h L u ) E U ( . ) l = 0 ;
E U ( . ) L m = E U ( . ) C w E U ( . ) l 0 ;   L m 0 ; E U ( . ) L m L m = 0
Equation (6) defines time allocated for off-farm work by farm households. Two possibilities may occur for the optimal condition. First, if the farmers are not engaged in off-farm work then the inequality constraint holds true. Second, if the farmer works off the farm, the equality constraint will occur. By solving Equations (5) and (6), two possibilities reveal themselves for labour allocation simultaneously. Here, (i) ( L 1 ,   L m ) , specifies engagement with off-farm work; (ii) ( L 0 ,   0 ) , specifies the farmers who are not participating in off-farm activities. Furthermore, if the optimal use of labour persisted, then the function of production gives two supply functions of agriculture as follows:
F ( L 1 ) = f ( L 1 ) + g ( L 1 ) ε h ( L 1 ) u if   L m > 0
F ( L 0 ) = f ( L 0 ) + g ( L 0 ) ε h ( L 0 ) u if   L m = 0
Equations (7) and (8) lead to the core empirical analysis of this study. To associate both theoretical frameworks and empirical analysis with each other, numerous problems have been addressed for the econometric model. Firstly, if the determinant of off-farm work correlates with the productivity of the farm due to characteristics which are unobservable, self-selection problems may occur. In a traditional way, Heckman’s model, with the addition of the Inverse Mills Ration (IMR) for the production function, was used to correct the endogeneity issue [49]. This technique is theoretically sound, but in the present study, the production function has composite errors. Thus, for the correction term it is not considerable to derive the symbolic forms. It is a great challenge to find an appropriate instrument while applying an invalid tool, leading to worse evaluation when there is no self-selection opportunity for correction [50]. In this study, for the empirical analysis, farmers were categorized into two of groups (i.e., with and without off-farm employment), and the function of production was estimated separately for each category of rice farmers. Moreover, to control the endogeneity between the binary choice and stochastic frontier for production with the risk model, owing to the lack of manageable experimental technique, in the present study, we analyzed the production function by separating both groups.

3. Econometric Approach

In the present study, an econometric approach was used in two steps. First, for the categorized groups of farmers, production function was estimated with two stochastic frontier models. Secondly, estimated technical efficiency distributions and risk were compared with scholarly logic.

3.1. Stochastic Frontier and Risk Models Estimation

The extension of the typical frontier model is an estimated model which concerts to the term of heterogeneous risks [51,52]. Production function, subsequent to Wang [52], can be described by the following:
y i = x i β + v i u i v i ~ N ( 0 , σ v i 2 ) ;   u i ~ N + ( u ¯ i , σ u i 2 ) σ v i 2 = exp ( z i γ ) ;   u ¯ i = w i α ,
where   y i   represents the logarithm of the production yield; x i   characterizes the logarithm of the production inputs; β is the coefficient vector of the production frontier; and v i   a n d   u i are random error and inefficiency terms, respectively. For conservative conditions, in model of stochastic production function technique, normal distribution followed by v i (random error) with mean = 0 and variance ( σ v i 2 ), and u i (inefficiency term) and ( u ¯ ) is mean value, while ( σ u 2 ) represents the variance of distribution (truncated normal). Exogenous factors were used to compute the efficiency and risk heterogeneity. Here, w i (vector) represents exogenous variables, which have an impact on inefficiency mean values. The vector z i denotes exogenous variables assuming exponential function for risk function as [51,53]. Vector ( α ) is a parameter of production inefficiency and ( γ ) is a vector of parameter linked with risk of production. By using the method of likelihood estimation in Equation (9), another equation can be obtained as follows:
ln L = c o n s t a n t   t 1 2 i l n [ exp ( z i γ ) + σ u 2 ] + i l n Φ ( w i α σ i λ i ε i λ i σ i ) 1 2 i ( ε i + w i α ) 2 σ i 2
Here,
σ i 2 = σ v i 2 + σ u 2 ;   ε i = y i x i β ; λ i = [ σ u 2 exp ( z i γ ) ] 1 2
Equation (10) generally can be used for numerous purposes. Hence, we assume H 0 : α = 0 , which indicates null hypotheses, while H 0 : γ = 0 , clarified for the statistical position. For instance, if α = 0 , then production risk by Equation (9) would be like the risk function of production used by Just and Pope [53]. If, in contrast, γ = o then Equation (9) would be an ordinary stochastic frontier model of production without risk [54]. For each null hypotheses, the likelihood ratio can be computed and thereafter technical efficiency can be estimated by T E i = E [ exp ( u i ) i ] as Battese and Coelli [55], while exp ( z i ȓ ) is a vector for the exponential function for risk.

3.2. Dominance Criterion for Stochastic Model

For comparison of technical efficiency between categorized groups, two models of statistics were applied. The traditional t-test was employed to check whether both groups were equal by mean and an f test was used to check the variance equality of categorized groups. To compare the distribution difference of risk and technical efficiency between categorized rice farmers, a stochastic dominance model was used (by following Sherlund et al., who conducted a study in 2002 using stochastic dominance criterion for comparing the technical efficiency among West Africa rice farmers [56]).
Cumulative Density Functions (CDFs) are used for the ranking of distributions and two conditions are argued in terms of criteria, i.e., (i) first-order, stochastic dominant (FSD), and (ii) second-order, stochastic dominant (SSD). Furthermore, in this study, it was hypothesized that nonfarm activities have impacts on technical efficiency (TE) and production risk. Moreover, P ( T E ) denotes the CDF of efficiency for the group of “with off-farm work”, while N P ( T E ) reveals the CDF of efficiency for the group of “without off-farm work”. Technical efficiency of the nonfarm employment group of farmers differentiates from that of off-farm employment group in term of FSD if:
N . P ( T . E ) P ( T . E ) 0 , where   T . E R .
By Equation (11), technical efficiency (TE) of rice farmers for CDF of the “with off-farm employment” is higher than that of the CDF of “without off-farm employment” [57]. In other words, the P ( T E ) curve is present on the left side of the N P ( T E ) curve in the graph. Further, if technical efficiencies are intersecting for these two CDFs, then it is not possible for the FSD to differentiate between two alternatives. Moreover, if there is no FSD association between two distributions, then the SSD can be used to make a choice between distributions [57]. In the SSD, the N P ( T E ) curve is present on left side of the P ( T E ) curve for discrimination and then,
T E ( N P ( T E ) P ( T E ) )   d T E 0 where   T E R .
In the condition of T E R , to compare the area under these CDFs, the SSD test is required. By Equation (12), the area under N P ( T E ) always should be greater than the area under P ( T E ) for the SSD requirement.

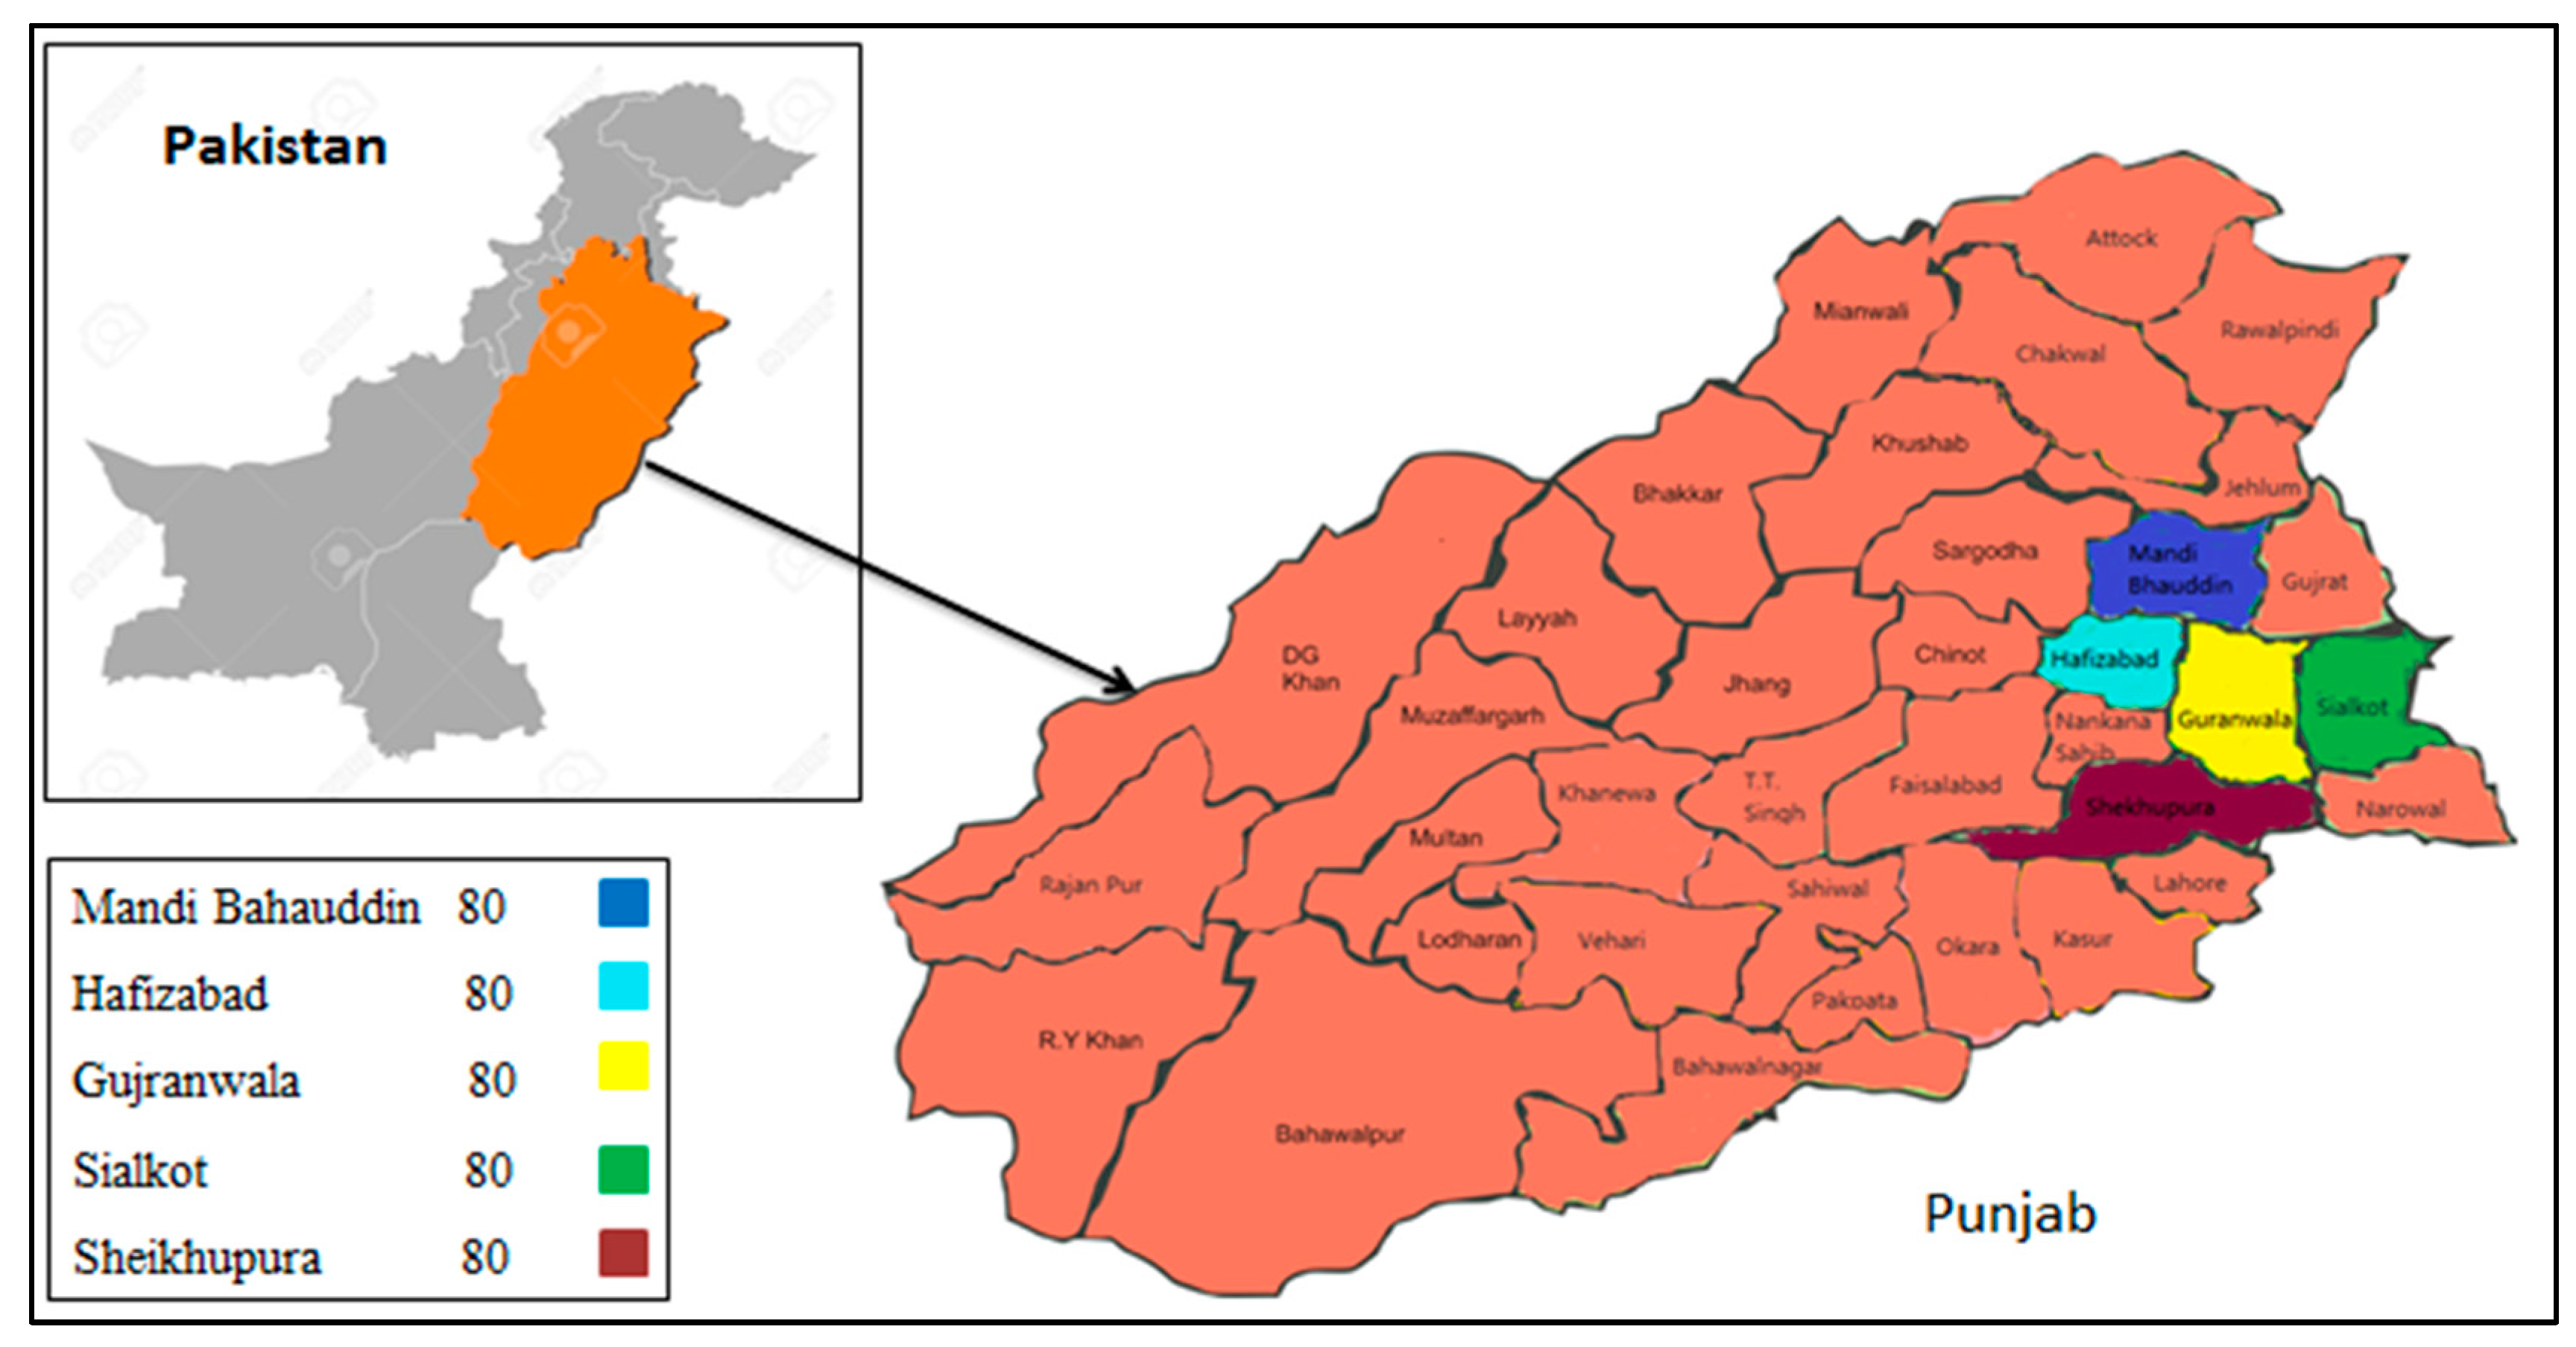
4. Study Area and Data Collection

The Punjab province was purposively selected. The motivation in selecting these five districts (Gujranwala, Sialkot, Hafizabad, Mandi Bahauddin, and Sheikhupura districts) was that rice crops make up about 70% of the crops grown in these regions, which accounts for 50% of the country’s production [58]. These regions are mainly located in a rice-wheat cropping zone. Moreover, this region is integrated well with urban surroundings and an industrial zone, which attracts members of the rural population to work in the industrial sector and get remittances from the overseas population of the region, which is helping in poverty reduction [59]. Cross-sectional data for this study was collected during the cropping year 2015–2016. Using Yamane’s formula [60] for sample selection, we selected households in the study area; a total of 400 rice farmers were finalized from the selected districts using a multistage stratified snowball sampling technique (It is used to find those people who are not want to disclose their identity or personal information. In this technique one or two persons first are found and then asked them to give information of relative peoples. Hence, some of the farmers in the area were not willing to give information about their off-farm employment due to the fear of implement of income tax and sometimes get benefits from the government when their crops effected by natural hazard) for having off-farm employment, and a random selection method was used to select without off-farm households [61]. From each district, 80 farm households were interviewed and then equally bifurcated into two categories of households, i.e., 40 farmers with off-farm employment and 40 without off-farm employment.
The main objective of the study was to understand the cost and production practices, hence, the respondents were asked to give detail of inputs and outputs. Moreover, risk-related data were also gathered from online sources and by investigation from the farmers of both groups. Figure 1 shows the study area of collected data.

5. Results and Discussion

The main objective of the present study was to know about the production structure and in the meanwhile to understand the risk function with technical efficiency among rice farmers in the Punjab province of Pakistan.

5.1. Descriptive Statistics of the Used Variables

The descriptive statistics of the used variables are divulged in Table 1. The results distinguished between both categories of rice farmers. For the association of data between categorized farmers, a t-test was applied. Yield is the output variable shown in kg per acre. Input variables are segregated into different categories. Labour input variable is noted as used man days to follow the Dhungana et al. [62]. Input variable machine is observed by hours used per farm. Fertilizer and chemicals used at farm level were measured in kilograms and liters, respectively. These variables are used by considering risk for yield by applying different ratios [53] and it is also not possible without fertilizer to catch the food production aim to feed the world’s growing population. Irrigation and seed input variables are specified in number of irrigation applied and kg per farm respectively. Water has a vital role among rice production input variables, and irrigated areas for rice crops represent 59% of Asia [63].
For the farm size, dummy variables were used in the present study. Farmsize1 defines agricultural area less than 5 acres; farmsize2 describes agricultural land more than 5 acres and less than 12.5 acres. Farmsize3 represents areas more than 12.5 and less than 25 acres, while farmsize4 indicates more than 25 acres. Some other socioeconomic factors are also defined and used for the mean inefficiency, i.e., age, education, and family size of the households. Additionally, data were also exerted on environmental characteristics from the agricultural statistics of Pakistan, as available online. Annual averages of rainfall and temperature were used in this model. Farmers were also interviewed either they have or have not any disease risk for the rice crop. On average, the yield was found to be 2142 and 1892.2 kg per acre for both categories of farmers, with and without off-farm work, respectively. Farmers having off-farm employment had higher mean values for variables use of machine/agricultural equipment, fertilizer applied, number of irrigation, and education. Household head’s age is less for those farmers who have off-farm work than their counterparts. As far as labour, chemical, seed, and family are concerned, with the same mean value no difference was identified.

5.2. Descriptive Statistics of the Used Variables

In Table 2, stochastic production frontier function is categorized in several sets and empirical results are presented.

5.2.1. Estimated Results of Deterministic Production Frontier Model

For the rice production function, the Cobb-Douglas model was used to define the set of deterministic frontiers. The Cobb-Douglas function was used because it is appropriate for the rice technology to capture the controlled variables [64]. The results of the determinant function in Table 2 reveal that characteristics of categorized groups of rice farmers are mostly common. For instance, elasticity of the labour among all input uses of both groups had the highest values, followed by irrigation. Their coefficient values were 0.373 and 0.232 for the category of farmers with off-farm employment and 0.298 and 0.271 for the category of farmers without off-farm employment, respectively. Similarly, uses of machine and agricultural equipment for both categories of farmers had the lowest elasticity. The results are in line with Chang and Wen; Audibert [48,65]. However, both groups of rice farmers are using inputs in different ways. Farmers with off-farm employment are practicing with higher levels of labour, machine, fertilizer, and irrigation than that of their counterpart group. These results are in contrast with the previous studies done by Chang and Wen; Fuwa et al. [48,66]. The explanation of this phenomenon in our study is that farmers have more income due to off-farm work, and are spending more on inputs and are ahead in yield production of rice crops than the other group of farmers. Recent studies support our results; farmers who engaged in nonfarm work were found to be better and more efficient than their counterparts in north China [22,67]. Moreover, availability of more water and more irrigation for rice crops would increase the rice production [68,69]. Farmers without off-farm work are using a higher input of chemicals than that of their counterpart farmers. Likewise, Chang and Wen [48] found the same findings in their study in Taiwan, and stated that farmers who engaged in nonfarm employment were using more chemicals than those without nonfarm activities. Moreover, all determinant variables of both groups of rice farmers had a positive impact on yield. These results indicate that increase in input quantity will enhance the output of rice crop.

5.2.2. Estimation of Technical Inefficiency

The results regarding function of inefficiency are presented in Table 2, and indicate that farm size of all categories had a positive effect on yield for both groups of farmers. Likewise, earlier studies found that labour and farm size have positive impact on the yield of rice [18,48,70]. Results of the present study revealed that larger farms are more efficient. Furthermore, social factors were also examined for this part of inefficiency, and among them, education has a positive impact on inefficiency for those rice farmers who have off-farm work. The explanation is that more literate famers have more opportunity to work off-farm and for investment in agriculture, thereby gaining higher production. The results are consistent with Abedullah et al. [68]. In addition, Idiong [71] stated that education was found to be positively significant in relation to efficiency among Nigerian farmers. On the other hand, there was no effect on the farmers’ efficiency of education without off-farm work. Furthermore, large family size had a negative effect on efficiency without off-farm employment farmers. This may be due to a surplus of labour. In an earlier study, it was revealed that a decrease in labour use can increase the farm productivity of crops of Chilean farmers [72].

5.2.3. Risk Function

The results regarding production risk are presented in the Table 2. Results reveal that labour had a negative effect on risk production. This indicates that labour is a risk-decreasing variable. Our findings are in contrast with earlier studies found that labour is a risk-increasing factor [48,73], while in other studies [44,47,74] it is reported that labour is a risk-decreasing factor among farmers and has a positive impact on production efficiency. Moreover, the use of machines has a negative and significant impact on risk function, which means that investment in agricultural equipment and machine use is a risk-decreasing function among the selected categories of rice farmers in the study area. The results of earlier studies support to our study [48,53]. Further, Vortia and his colleagues [75] conducted a study recently and their results show that innovation mechanisms, such as modern equipment, enhance the growth and productivity of rice crops in Northern Ghana. Results reveal that fertilizer and chemical use have negative and significant impacts on risk production function for those farmers who do not have off-farm work. These findings indicate that more use of fertilizer and chemicals decreases risk in rice production in such groups of farmers. These results are in line with a very recent study conducted in Ethiopia [19]. Results also illustrate that irrigation has negative and significant effects on risk function for categorized groups. This means that investment in irrigation systems is risk-decreasing and will encourage rice production. Temperature has positive and significant impacts on risk function among farmers. It indicates that increase in temperature will decrease the rice production and investment in environment protection projects would help to enhance the rice production. The results of Shakoor et al. [76] support our findings, as they found in their study that an increase in the maximum average of temperature will decrease rice production. Moreover, the results portrayed in Table 2 indicate that disease is also positively and significantly correlated to risk function among rice farmers. These results for both categories of farmers indicate that more attention needs to be paid to control rice diseases, so that farmers can become more efficient. Earlier studies explicitly advocate for our findings [29,73,77,78]. For instance, pesticides have significant and positive impacts on agriculture production in the world. In addition, Villano and Fleming [73] it is disclosed that pesticide was found to be a risk-decreasing factor among rice farmers in the Philippines.

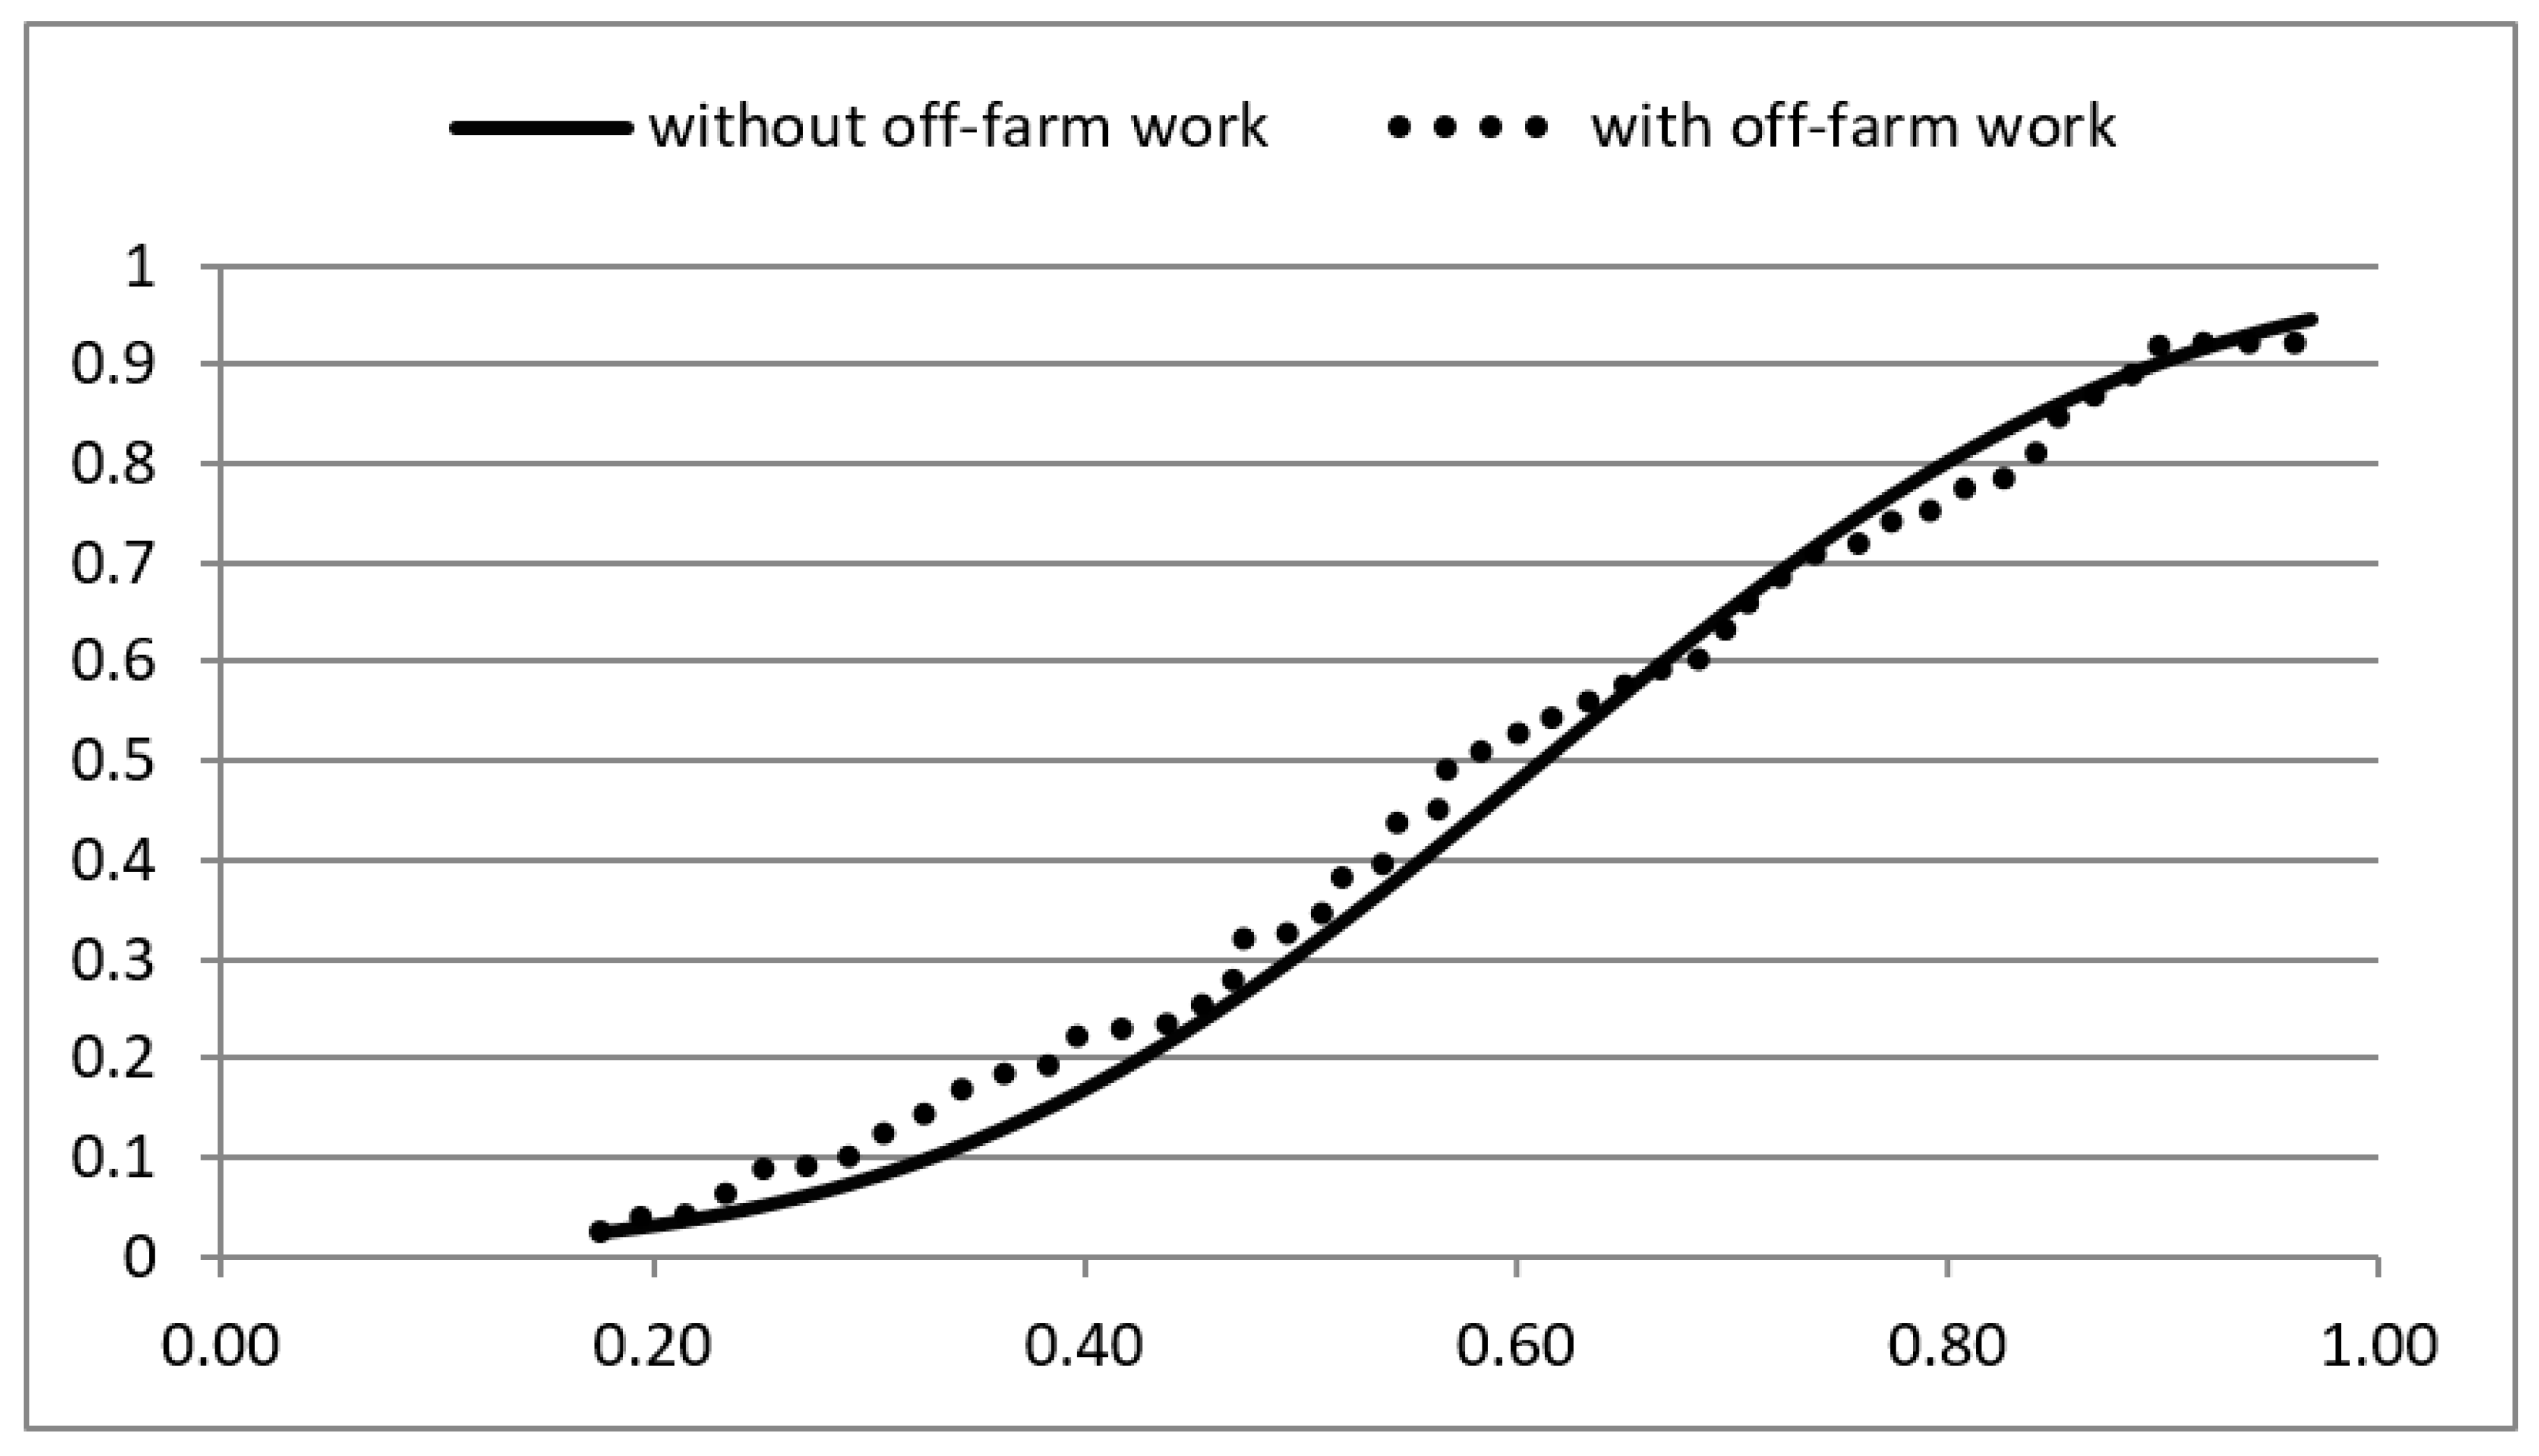
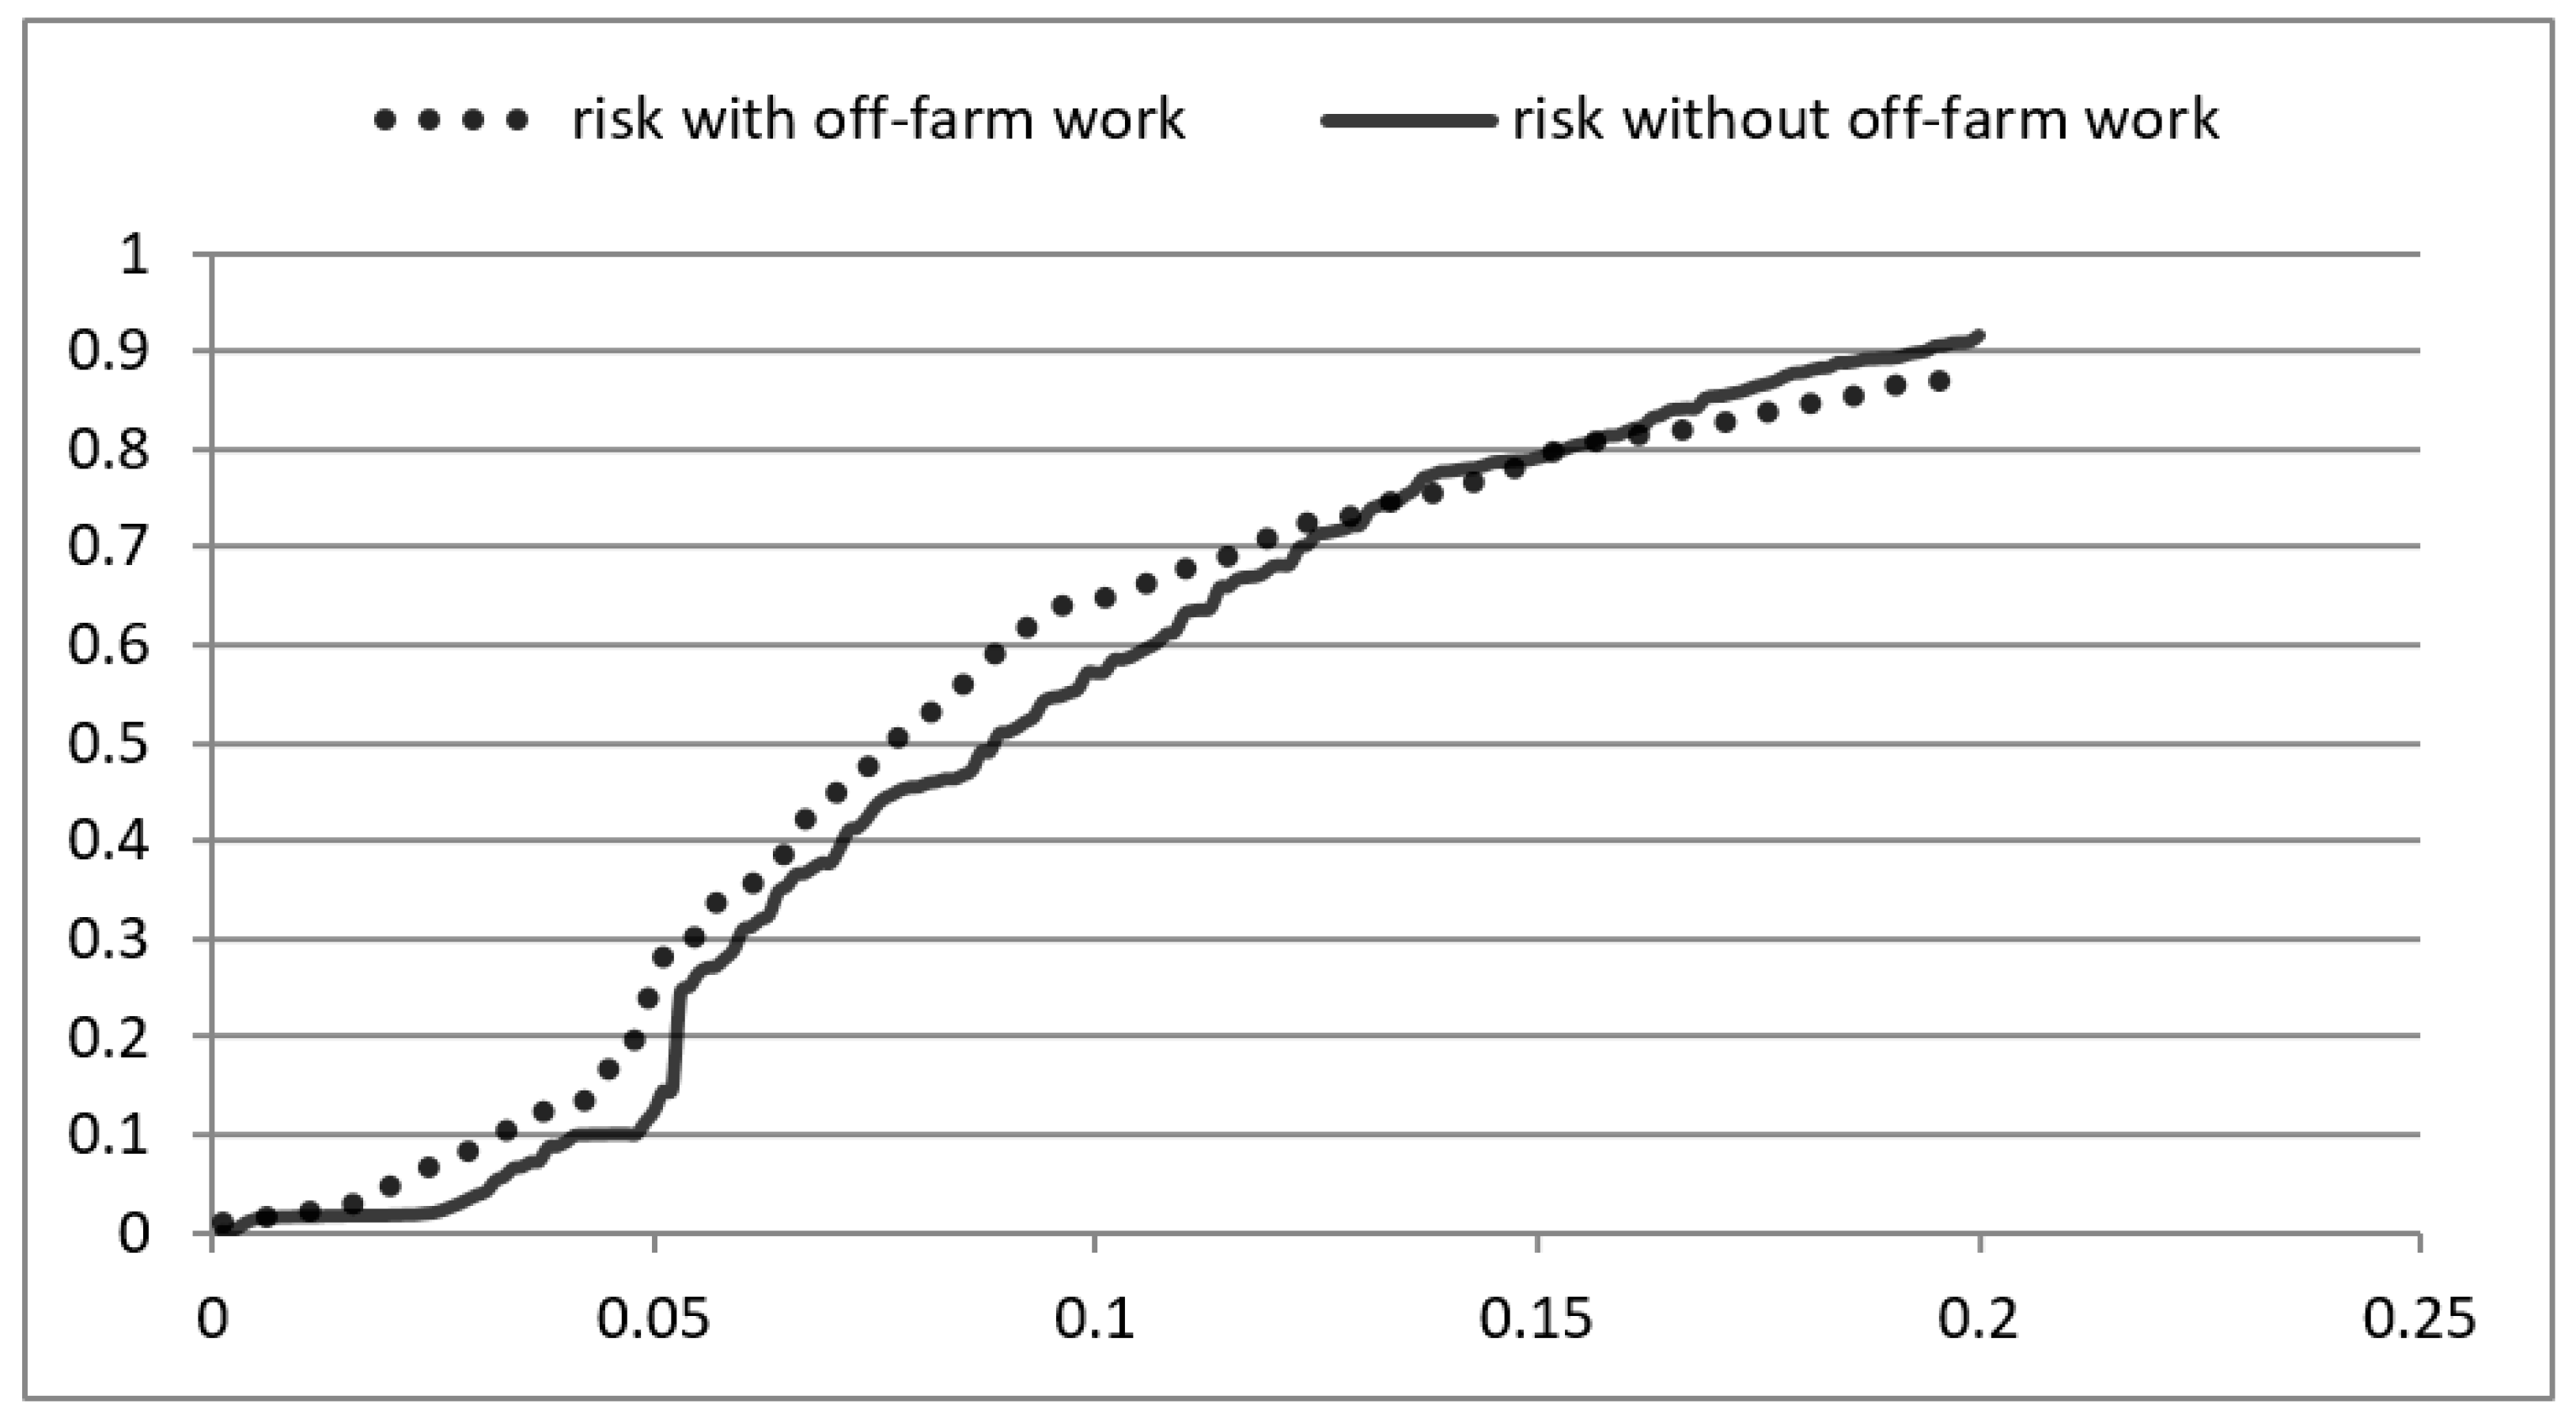
5.3. Efficiency and Risk Distribution Comparisons

In Table 3, technical efficiency and risk distribution are reported in the form of percentile of categorized groups of rice farmers. The results reveal that mean values of technical efficiencies were 0.891 and 0.789 for with and without off-farm employment groups of farmers, respectively. This indicates that nonfarm employment has a positive effect on technical efficiencies. The results of the study conducted by Fernandez-Corndjo et al. [8] support our findings; they revealed in the results of their study that off-farm employment involvement shows greater effectiveness, and that farmers’ performance is better, both economically and in the production of their crops, in the United States. Several previous studies showed that nonfarm employment has negative impacts on technical efficiencies [48], while it has also been revealed that off-farm work/employment has no effect on technical efficiency [79]. Some imperative results have been presented with regard to technical efficiency of percentile distribution, showing that from the 1st to 50th percentile, the technical efficiency was higher for the group of famers with off-farm work. From 60th to 95th percentile, the technical efficiency was lower for the category of same group.
Moreover, risk distribution between categorized groups of rice farmers are also revealed in Table 3. The risk mean value was 0.197 for the group of rice farmers with off-farm work, while 0.104 was the calculated average risk value for their counterparts. This shows a higher risk among farmers with off-farm work than for those in the other group. These results are aligned with an earlier study conducted by Chang and Wen [48]. They revealed that farmers with off-farm employment are confronting more risks. However, imperative results were revealed with regard to percentile distribution between two groups. Farmers with off-farm work are facing more risky scenarios from the 1st to the 60th percentile. On the other hand, CDF’s direction of risk distribution reverses from the 75th to the 95th percentile. This core finding brings novelty in the whole research idea, which has potential for opening new vistas for the rice economy of Pakistan.
For good understanding of technical efficiency comparison between two groups, CDFs are shown in Figure 2. The CDFs’ curve for the group of rice farmers with off-farm work is higher from around the 1st to the 50th percentile, while CDFs of both groups intersect at the point of around the 60th percentile. From the 70th to the 90th percentile, CDFs are higher for without off-farm work group, and at the point of the 91st percentile touch both curves, and thereafter CDFs for the off-farm work group goes further downwards than the without off-farm work group. This is maybe due to different hours’ work for the farmers of off-farm work/employment.
The results of CDFs with regard to risk distribution, compared between categorized rice farmers, are demonstrated graphically in Figure 3. The CDFs’ curve from the 1st percentile to around the 75th percentile for group engaging in nonfarm activities is higher than for the other group of farmers. This indicates that the first order stochastic dominants condition is qualified. But thereafter, the CDFs’ curve of risk distribution for with nonfarm activities is lower than that of without nonfarm employment. Hence, rice growers with nonfarm employment are facing higher risks in production than those farmers who are not engaged in off-farm activities.

6. Conclusions

The present study was conducted to investigate the production variation in yield, production risk, and off-farm employment, and likely impact on technical efficiencies across two categories of rice farmers in Pakistan. The study found different uses of input between two categories of farmers. More input quantities were used by the group with off-farm work than by their counterpart, and consequently that group enjoyed higher output. In addition, some characteristics of categorized farmers were found common regarding production function. Elasticity of the labour use was found to be the highest, followed by irrigation. The usage of machines and agricultural equipment for both categorized farmers showed lowest elasticity. The results regarding production risk revealed that labour, usage of machines, and irrigation were found to be risk-decreasing variables in both the groups. Moreover, temperature and disease were found to be risk-increasing functions for both groups. Though both groups of farmers were found technically inefficient, group of farmers engaging in nonfarm work were found to be relatively more efficient. According to CDFs, in the beginning, the group of farmers with off-farm employment was found to be more efficient. But as the percentile moved to the 75th quantum, it showed the group of farmers with off-farm employment to be less efficient.
The present study revealed that irrigation, chemical, and fertilizer factors are positively significant to technical efficiency. The short-term policy focus should be diverted to ensuring availability of irrigation water and timely application of fertilizer and chemicals to enhance technical efficiency. Besides school education of rice farmers, technical kinds of advisory services may create miracles if serious policy attention is given. In the long run, all-out policy efforts need to be endeavored towards rural development by providing employment facilitating social and economic infrastructure, along with focus of Research and Development (R&D), particularly keeping the rice belt in view. With regard to risk production, government should invest in environmental research projects to protect the crops from ecological change.

Author Contributions

Conceptualization, M.R. and P.Q.; methodology, M.R.; software, M.R.; validation, M.R., A.N. and M.A.I.; formal analysis, M.R.; investigation, M.R., M.A.I.; resources, M.R.; data entry, M.R., M.A.I. and A.N.; writing—original draft preparation, M.R.; writing—review and editing, A.S., A.N., P.Q.; supervision, M.R.; funding acquisition, M.R. All authors have read and agreed to the published version of the manuscript.

Funding

This research supported by Yangtze University talent Project Fund No 802100270303.

Conflicts of Interest

The authors declare no conflict of interest.

References

  1. Barrett, C.B.; Reardon, T.; Webb, P. Nonfarm income diversification and household livelihood strategies in rural Africa: Concepts, dynamics, and policy implications. Food Policy 2001, 26, 315–331. [Google Scholar] [CrossRef]
  2. Yu, X.; Zhao, G. Chinese agricultural development in 30 years: A literature review. Front. Econ. China 2009, 4, 633–648. [Google Scholar] [CrossRef]
  3. De Brauw, A.; Rozelle, S. Reconciling the returns to education in off-farm wage employment in rural China. Rev. Dev. Econ. 2008, 12, 57–71. [Google Scholar] [CrossRef]
  4. Xiaobing, W.; Herzfeld, T.; Glauben, T. Labor allocation in transition: Evidence from Chinese rural households. China Econ. Rev. 2007, 18, 287–308. [Google Scholar]
  5. Adams, R.H. Nonfarm Income, Inequality, and Poverty in Rural Egypt and Jordan; World Bank Publications: Washington, DC, USA, 2001; Volume 2572. [Google Scholar]
  6. De Brauw, A.; Huang, J.; Rozelle, S.; Zhang, L.; Zhang, Y. The evolution of China’s rural labor markets during the reforms. J. Comp. Econ. 2002, 30, 329–353. [Google Scholar] [CrossRef] [Green Version]
  7. Benjamin, D. Household composition, labor markets, and labor demand: Testing for separation in agricultural household models. Econom. J. Econom. Soc. 1992, 60, 287–322. [Google Scholar] [CrossRef]
  8. Fernandez-Cornejo, J.; Ashok, M.; Nehring, R.; Hendricks, C.; Southern, M.; Gregory, A. Off-Farm Income, Technology Adoption, and Farm Economic Performance; United States Department of Agriculture (USDA): Washington, DC, USA, 2007; 53p.
  9. Jolliffe, D. The impact of education in rural Ghana: Examining household labor allocation and returns on and off the farm. J. Dev. Econ. 2004, 73, 287–314. [Google Scholar] [CrossRef]
  10. Babatunde, R.O. On-farm and off-farm works: Complement or substitute? Evidence from rural nigeria. In Proceedings of the 4th international conference of the African Association of Agricultural Economists, Hammamet, Tunisia, 22–25 September 2013. [Google Scholar]
  11. Haggblade, S.; Hazell, P.; Reardon, T. The rural non-farm economy: Prospects for growth and poverty reduction. World Dev. 2010, 38, 1429–1441. [Google Scholar] [CrossRef]
  12. Davis, B.; Di Giuseppe, S.; Zezza, A. Income Diversification Patterns in Rural Sub-Saharan Africa: Reassessing the Evidence; World Bank Policy Research Working Paper; World Bank: Washington, DC, USA, 2014. [Google Scholar]
  13. El-Osta, H.S.; Mishra, A.K.; Morehart, M.J. Off-farm labor participation decisions of married farm couples and the role of government payments. Appl. Econ. Perspect. Policy 2008, 30, 311–332. [Google Scholar] [CrossRef]
  14. El-Osta, H.S.; Mishra, A.K.; Morehart, M.J. Determinants of economic well-being among US farm operator households. Agric. Econ. 2007, 36, 291–304. [Google Scholar] [CrossRef]
  15. Mishra, A.K.; Goodwin, B.K. Farm income variability and the supply of off-farm labor. Am. J. Agric. Econ. 1997, 79, 880–887. [Google Scholar] [CrossRef]
  16. Yee, J.; Ahearn, M.C.; Huffman, W. Links among farm productivity, off-farm work, and farm size in the Southeast. J. Agric. Appl. Econ. 2004, 36, 591–603. [Google Scholar] [CrossRef]
  17. Goodwin, B.K.; Mishra, A.K. Farming efficiency and the determinants of multiple job holding by farm operators. Am. J. Agric. Econ. 2004, 86, 722–729. [Google Scholar] [CrossRef]
  18. Kumbhakar, S.C.; Biswas, B.; Bailey, D. A study of economic efficiency of Utah dairy farmers: A system approach. Rev. Econ. Stat. 1989, 71, 595–604. [Google Scholar] [CrossRef]
  19. Ahmed, M.H.; Melesse, K.A. Impact of off-farm activities on technical efficiency: Evidence from maize producers of eastern Ethiopia. Agric. Food Econ. 2018, 6, 1–15. [Google Scholar] [CrossRef] [Green Version]
  20. Abebe, G.G. Off-farm Income and Technical Efficiency of Smallholder Farmers in Ethiopia—A Stochastic Frontier Analysis; Swedish University of Agricultural Sciences: Uppsala, Sweden, 2014. [Google Scholar]
  21. Bojnec, S.; Ferto, I. Impact of Off-farm Income on Farm Efficiency in Slovenia. In Proceedings of the EAAE International Congress, Zurich, Switzerland, 30 August–2 September 2011. [Google Scholar]
  22. Zhang, L.; Su, W.; Eriksson, T.; Liu, C. How off-farm employment affects technical effi ciency of China’s farms: The case of Jiangsu. China World Econ. 2016, 24, 37–51. [Google Scholar] [CrossRef]
  23. Arshad, M.; Amjath-Babu, T.S.; Krupnik, T.J.; Aravindakshan, S.; Abbas, A.; Kächele, H.; Müller, K. Climate variability and yield risk in South Asia’s rice–wheat systems: Emerging evidence from Pakistan. Paddy Water Environ. 2016, 15, 249–261. [Google Scholar] [CrossRef]
  24. Huang, J.; Wang, Y.; Wang, J. Farmers’ adaptation to extreme weather events through farm management and its impacts on the mean and risk of rice yield in China. Am. J. Agric. Econ. 2015, 97, 602–617. [Google Scholar] [CrossRef]
  25. Mane, R.; Watkins, B. Stochastic Analysis of Margin Protection (MP) Crop Insurance in Arkansas Rice Production. In Proceedings of the 2016 Annual Meeting, San Antonio, TX, USA, 6–9 February 2016. [Google Scholar]
  26. Parry, M.L.; Rosenzweig, C.; Iglesias, A.; Livermore, M.; Fischer, G. Effects of climate change on global food production under SRES emissions and socio-economic scenarios. Glob. Environ. Chang. 2004, 14, 53–67. [Google Scholar] [CrossRef]
  27. Rizwan, M.; Deyi, Z.; Nazir, A.; Osti, R.; Ahmed, U.I.; Zhu, Y.; Iqbal, M.A. Risk Perceptions and Management Strategies of Rice Growing Households: Evidence from a Developing Country. J. Appl. Environ. Biol. Sci. 2017, 7, 15–26. [Google Scholar]
  28. Dadzie, S.K.N.; Acquah, H.D. Attitudes toward risk and coping responses: The case of food crop farmers at Agona Duakwa in Agona East District of Ghana. Int. J. Agric. For. 2012, 2, 29–37. [Google Scholar]
  29. Rizwan, M.; Ping, Q.; Saboor, A.; Ahmed, U.I.; Zhang, D.; Deyi, Z.; Teng, L. Measuring rice farmers’ risk perceptions and attitude: Evidence from Pakistan. Hum. Ecol. Risk Assess. 2019, 1–6. [Google Scholar] [CrossRef]
  30. Ping, Q.; Iqbal, M.A.; Abid, M.; Ahmed, U.I.; Nazir, A.; Rehman, A. Adoption of off-farm diversification income sources in managing agricultural risks among cotton farmers in Punjab Pakistan. J. Appl. Environ. Biol. Sci 2016, 6, 47–53. [Google Scholar]
  31. Chomba, S.J.; Nyang’au, S.P. Influence of entrepreneurial competencies on the growth of small and micro enterprises in the agricultural industry in Kirinyaga County, Kenya. Int. Acad. J. Innov. Leadersh. Entrep. 2019, 2, 1–13. [Google Scholar]
  32. Salim, M.N.; Fajar, H. Determinant analysis of productivity on rice management in indonesia. Int. J. Bus. 2019, 6, 369–383. [Google Scholar]
  33. De Janvry, A.; Sadoulet, E. Income strategies among rural households in Mexico: The role of off-farm activities. World Dev. 2001, 29, 467–480. [Google Scholar] [CrossRef]
  34. Rizwan, M.; Deyi, Z.; Nazir, A.; Osati, R.; Traore, L.; Sargani, G.R. Determinants and choices of off-farm work among rice farmers in a developing country. J. Anim. Plant Sci. 2017, 27, 1993–2002. [Google Scholar]
  35. Hongo, C.; Tsuzawa, T.; Tokui, K.; Tamura, E. Development of damage assessment method of rice crop for agricultural insurance using satellite data. J. Agric. Sci. 2015, 7, 59. [Google Scholar] [CrossRef]
  36. Nazir, A.; Li, G.; Sheikh, M.; Zhou, X.; Humayoon, A.; Rizwan, M.; Akhtar, S. Farmers’ perceptions of risk sources and risk coping strategies in Pakistan. J. Anim. Plant Sci 2018, 28, 889–902. [Google Scholar]
  37. Singla, S.; Sagar, M. Integrated risk management in agriculture: An inductive research. J. Risk Financ. 2012, 13, 199–214. [Google Scholar] [CrossRef]
  38. Abdullah, A.; Gillani, W.A.; Naveed, S.; Amanullah, K.; Kashif, H. Computerized farm guide: Using ICT for better dissemination of agriculture extension information, A paper. In Proceedings of the 3rd International Symposium on Intelligent Information Technology in Agriculture, Beijing, China, 14–16 October 2005. [Google Scholar]
  39. GOP Pakistan Economic Survey 2017-18. Available online: http://www.finance.gov.pk/survey/chapters_18/Economic_Survey_2017_18.pdf (accessed on 20 December 2019).
  40. FAOSTAT Comparing Data, Region. Available online: http://www.fao.org/faostat/en/#compare (accessed on 12 February 2017).
  41. Hess, U.; Richter, K.; Stoppa, A. Weather risk management for agriculture and agri-business in developing countries. In Climate Risk and the Weather Market, Financial Risk Management with Weather Hedges; Risk Books: London, UK, 2002. [Google Scholar]
  42. Carroll, J.M. Pakistan Grain and Feed Annual Grain and Feed Annual Report. Available online: https://apps.fas.usda.gov/newgainapi/api/report/downloadreportbyfilename?filename=Grain%20and%20Feed%20Annual_Islamabad_Pakistan_4-7-2010.pdf (accessed on 12 December 2019).
  43. GOP Economic Survey of Pakistan, 2013–2014. Ministry of Food and Agriculture. Finance Division, Economic Advisor’s Wing, Islamabad, Pakistan. Islam. Pakistan. 2014. Available online: http://ipr.org.pk/wp-content/uploads/2014/07/IPR-Analysis-on-Economic-Survey.pdf (accessed on 20 November 2019).
  44. Dai, J. A study on the risk and technical efficiency of Taiwan ricegrowing farms: 1998–2004. Taiwan. Agric. Econ. Rev. 2006, 11, 213–238. [Google Scholar]
  45. El-Osta, H.S.; Morehart, M.J. Determinants of poverty among US farm households. J. Agric. Appl. Econ. 2008, 40, 1–20. [Google Scholar] [CrossRef] [Green Version]
  46. Lass, D.A.; Findeis, J.L.; Hallberg, M.C. Factors Affecting the Supply of Off-farm Labor: A Review of Empirical Evidence; Iowa State University Press: Iowa, IA, USA, 1991. [Google Scholar]
  47. Kumbhakar, S.C. Specification and estimation of production risk, risk preferences and technical efficiency. Am. J. Agric. Econ. 2002, 84, 8–22. [Google Scholar] [CrossRef]
  48. Chang, H.H.; Wen, F.I. Off-farm work, technical efficiency, and rice production risk in Taiwan. Agric. Econ. 2011, 42, 269–278. [Google Scholar] [CrossRef]
  49. Heckman, J.J. Sample Selection Bias as a Specification Error (with an Application to the Estimation of Labor Supply Functions); National Bureau of Economic Research Cambridge: Cambridge, MA, USA, 1977. [Google Scholar]
  50. Wooldridge, J.M. Econometric Analysis of Cross Section and Panel Data; MIT Press: Cambridge, MA, USA, 2010; ISBN 0262296799. [Google Scholar]
  51. Battese, G.E.; Rambaldi, A.N.; Wan, G.H. A stochastic frontier production function with flexible risk properties. J. Product. Anal. 1997, 8, 269–280. [Google Scholar] [CrossRef]
  52. Wang, H.-J. Heteroscedasticity and non-monotonic efficiency effects of a stochastic frontier model. J. Product. Anal. 2002, 18, 241–253. [Google Scholar] [CrossRef]
  53. Just, R.E.; Pope, R.D. Production function estimation and related risk considerations. Am. J. Agric. Econ. 1979, 61, 276–284. [Google Scholar] [CrossRef]
  54. Aigner, D.; Lovell, C.A.K.; Schmidt, P. Formulation and estimation of stochastic frontier production function models. J. Econom. 1977, 6, 21–37. [Google Scholar] [CrossRef]
  55. Battese, G.E.; Coelli, T.J. Prediction of firm-level technical efficiencies with a generalized frontier production function and panel data. J. Econom. 1988, 38, 387–399. [Google Scholar] [CrossRef]
  56. Sherlund, S.M.; Barrett, C.B.; Adesina, A.A. Smallholder technical efficiency controlling for environmental production conditions. J. Dev. Econ. 2002, 69, 85–101. [Google Scholar] [CrossRef]
  57. Chavas, J.P. Risk Analysis in Theory and Practice, 1st ed.; Elsevier Academic Press: San Diego, CA, USA, 2004. [Google Scholar]
  58. GOP Agricultural statistics of Pakistan 2012–13. Ministry of Food andAgriculture (economic Wing), Finance Division, Government of Pakistan, Islamabad. In Islam. Pakistan; 2013. Available online: http://mnfsr.gov.pk/frmDetails.aspx. (accessed on 15 October 2019).
  59. Amjad, R.; Arif, G.M.; Mustafa, U. Does the labor market structure explain differences in poverty in rural Punjab? Lahore J. Econ. 2008, 8, 139–162. [Google Scholar] [CrossRef]
  60. Yamane, T. Research Methods: Determination of Sample Size. 1967. Available online: http://www.sciepub.com/reference/180098. (accessed on 15 February 2019).
  61. Hejazi, S. Sampling and Its Variants: Introduction to Research Methodology in Medical Sciences; Tehran Islamic Azad University: Tehran, Iran, 2006. [Google Scholar]
  62. Dhungana, B.R.; Nuthall, P.L.; Nartea, G.V. Measuring the economic inefficiency of Nepalese rice farms using data envelopment analysis. Aust. J. Agric. Resour. Econ. 2004, 48, 347–369. [Google Scholar] [CrossRef]
  63. Papademetriou, M.K.; Dent, F.J.; Herath, E.M. Bridging the Rice Yield Gap in the Asia-Pacific Region; FAO Regional Office for Asia and the Pacific Bangkok: Bangkok, Thailand, 2000. [Google Scholar]
  64. Tsai, S.; Wann, J. Selecting functional form for empirical economic model–the case of Taiwan rice production function. Taiwan. Agric. Econ. Rev. 1995, 1, 187–216. [Google Scholar]
  65. Audibert, M. Technical inefficiency effects among paddy farmers in the villages of the ‘Office du Niger’, Mali, West Africa. J. Product. Anal. 1997, 8, 379–394. [Google Scholar] [CrossRef]
  66. Fuwa, N.; Edmonds, C.; Banik, P. Are small-scale rice farmers in eastern India really inefficient? Examining the effects of microtopography on technical efficiency estimates. Agric. Econ. 2007, 36, 335–346. [Google Scholar] [CrossRef]
  67. Liao, H.; Du, Y.-F.; Huang, Z.; Wei, Y.-M. Measuring energy economic efficiency: A mathematical programming approach. Appl. Energy 2016, 179, 479–487. [Google Scholar] [CrossRef]
  68. Abedullah; Kouser, S.; Mushtaq, K. Analysis of technical efficiency of rice production in Punjab (Pakistan): Implications for future investment strategies. Pak. Econ. Soc. Rev. 2007, 45, 231–244. [Google Scholar]
  69. Lingard, J.; Castillo, L.; Jayasuriya, S. Comparative efficiency of rice farms in Central Luzon, the Philippines. J. Agric. Econ. 1983, 34, 163–173. [Google Scholar] [CrossRef]
  70. Johnston, D.; Le Roux, H. Leaving the household out of family labour? The implications for the size–efficiency debate. Eur. J. Dev. Res. 2007, 19, 355–371. [Google Scholar] [CrossRef]
  71. Idiong, I.C. Estimation of farm level technical efficiency in smallscale swamp rice production in cross river state of Nigeria: A stochastic frontier approach. World J. Agric. Sci. 2007, 3, 653–658. [Google Scholar]
  72. von Cramon-Taubadel, S.; Saldias, R. Access to credit and determinants of technical inefficiency of specialized smallholder farmers in Chile. Chil. J. Agric. Res. 2014, 74, 413–420. [Google Scholar] [CrossRef]
  73. Villano, R.; Fleming, E. Technical inefficiency and production risk in rice farming: Evidence from Central Luzon Philippines. Asian Econ. J. 2006, 20, 29–46. [Google Scholar] [CrossRef]
  74. Yang, J.; Wang, H.; Jin, S.; Chen, K.; Riedinger, J.; Peng, C. Migration, local off-farm employment, and agricultural production efficiency: Evidence from China. J. Product. Anal. 2016, 45, 247–259. [Google Scholar] [CrossRef] [Green Version]
  75. Vortia, P.; Nasrin, M.; Bipasha, S.K.; Islam, M.M. Extent of farm mechanization and technical efficiency of rice production in some selected areas of Bangladesh. GeoJournal 2019, 1–14. [Google Scholar] [CrossRef]
  76. Shakoor, U.; Saboor, A.; Baig, I.; Afzal, A.; Rahman, A. Climate variability impacts on rice crop production in Pakistan. Pakistan J. Agric. Res. 2015, 28, 19–27. [Google Scholar]
  77. Hart, K.A.; Pimentel, D. Environmental and economic costs of pesticide use. Encycl. pest Manag. New York Marcel Dekker 2002, 237–239. [Google Scholar] [CrossRef]
  78. Iqbal, M.A.; Ping, Q.; Abid, M.; Muhammad Muslim Kazmi, S.; Rizwan, M. Assessing risk perceptions and attitude among cotton farmers: A case of Punjab province, Pakistan. Int. J. Disaster Risk Reduct. 2016, 16, 68–74. [Google Scholar] [CrossRef]
  79. Lien, G.; Kumbhakar, S.C.; Hardaker, J.B. Determinants of off-farm work and its effects on farm performance: The case of Norwegian grain farmers. Agric. Econ. 2010, 41, 577–586. [Google Scholar] [CrossRef]
Figure 1. Map of study area.
Sustainability 12 03770 g001
Figure 2. Technical efficiency distribution of categorize groups of rice farmers.
Sustainability 12 03770 g002
Figure 3. Risk distribution of categorize groups of rice farmers.
Sustainability 12 03770 g003
Table 1. Descriptive statistics of used variables.
VariablesCharacterizationWith off-FarmWithout off-Farm* p-Value
MeanSDMeanSD
Yieldaverage(kg/acre)2142.00473.221892.2435.290.000
Laborused man days170.5234.28170.1628.440.000
Machineagricultural equipment used in hours81.3415.2365.8614.970.000
Fertilizerfertilizer used in Kg(s)2067.6259.11744.2278.20.000
ChemicalChemical used in liters63.628.1863.899.030.000
Irrigationno. of irrigation470.1054.77431.5659.970.004
seedseed used in kg114.7812.84112.0414.110.02
farmsize1agricultural land <5 acre0.130.030.110.0320.159
farmsize2agricultural land 5–12.5 acre0.450.110.420.0280.098
farmsize3agricultural land 12.5–25 acre0.330.090.390.790.095
farmsize4agricultural land >25 acre0.080.020.060.020.046
Ageage in years45.097.3648.7710.760.082
educ.School education in years9.653.216.573.550.000
famlysizetotal family members6.541.546.882.050.076
Rainfall $average rain fall991.80345.56991.80345.560.900
Tempr $average temperature30.060.7730.060.770.088
Diseasedummy, if yes = 1, no = 00.600.490.370.480.098
Source: field survey data. $ data was exerted from Pakistan agricultural statistics available online. * To test association between means of two samples a chi-square test is conducted.
Table 2. Estimation of the rice production function.
VariablesWith off-Farm WorkWithout off-Farm Work
A Deterministic Frontier Function
CoefficientStd. errs.CoefficientStd. errs.
Constant0.891 ***0.1490.742 ***0.139
log(labour)0.373 ***0.0750.298 ***0.072
log(machine)0.064 *0.0360.057 *0.032
log(fertilizer)0.190 ***0.0470.170 ***0.045
log(chemical)0.075 *0.0350.109 *0.042
log(irrigation)0.232 ***0.0450.271 ***0.049
log(seed)0.083 *0.0320.084 *0.037
Inefficiency mean function
Constant5.030 ***0.3684.915 ***0.317
farmsize20.663 ***0.0460.698 ***0.049
farmsize31.442 ***0.0481.387 ***0.049
farmsize41.969 ***0.0692.151 ***0.067
Age0.1180.1060.1050.090
educ0.055 *0.0360.0250.021
famlysize0.023 *0.062−0.067 *0.041
Function of risk
Constant−2.0131.9560.978 *2.176
log(labour)−0.314 ***0.076−0.304 ***0.074
log(machine)−0.061 *0.035−0.064 *0.032
log(fertilizer)0.1970.045−0.183 **0.048
log(chemical)0.0780.034−0.112 **0.042
log(irrigation)−0.226 ***0.051−0.267 ***0.046
log(seed)0.1170.036−0.0160.012
Rainfall0.0730.032−0.0080.035
tempr0.692 *0.5190.042 *0.566
disease0.016 *0.0110.076 *0.041
Log-likelihood213.349109.325
*** show significant level at 1%, ** indicate significance at 5%, * signifies at 10%.
Table 3. Technical efficiencies and risk distributions in percentiles.
Technical EfficienciesRisks
With off-Farm.Without off-FarmWith off-Farm.Without off-Farm.
Mean.0.891 *0.789 *0.197 $0.104 $
SD0.137 **0.146 **0.021 $$0.025 $$
Percentiles
1%0.0570.0320.0040.003
5%0.0890.0610.0070.006
10%0.1020.0720.0100.007
15%0.1450.0980.0170.01
25%0.2740.2190.0260.022
40%0.4510.4080.0470.041
50%0.5790.5420.0580.054
60%0.6790.6870.0690.065
75%0.8210.8560.0780.081
90%0.8910.9180.0830.091
95%0.9110.9200.0850.092
* A two-sample t-test was computed to estimate the equivalence of the mean of the sample for categorized groups, and the p-value of the t-test was 0.082. ** F-test was applied for estimation of the variance equivalence of samples for categorized groups and p-value of f-test is 0.009. $ A two sample t-test was computed for estimation the equivalence of means samples for categorized groups and p-value of t-test is 0.009. $$ F-test was applied for estimation of the variance equivalence of samples for categorized groups and p-value of f-test is 0.079.

