Article

Post-Emergence Herbicides for Effective Weed Management, Enhanced Wheat Productivity, Profitability and Quality in North-Western Himalayas: A ‘Participatory-Mode’ Technology Development and Dissemination

by
Anil K. Choudhary
1,2,3,
D.S. Yadav
1,
Pankaj Sood
1,
Shakuntla Rahi
1,
Kalpana Arya
1,
S.K. Thakur
1,4,
Ramesh Lal
4,5,
Subhash Kumar
1,5,
Jagdev Sharma
2,
Anchal Dass
3,
Subhash Babu
3,
R.S. Bana
3,
D.S. Rana
3,6,
Adarsh Kumar
3,7,
Sudhir K. Rajpoot
3,8,
Gaurendra Gupta
3,9,
Anil Kumar
1,10,
Harish M.N.
3,
A.U. Noorzai
3,11,12,*,
G.A. Rajanna
3,
Mohammad Halim Khan
13,
V.K. Dua
2 and
Raj Singh
3
add Show full author list remove Hide full author list
1
Farm Science Centre, CSK Himachal Pradesh Agricultural University, Sundernagar 175019, India
2
Division of Crop Production, ICAR-Central Potato Research Institute, Shimla 171001, India
3
Division of Agronomy, ICAR-Indian Agricultural Research Institute, New Delhi 110012, India
4
Farm Science Centre, CSK Himachal Pradesh Agricultural University, Kukumseri 175142, Lahaul & Spiti, India
5
Farm Science Centre, CSK Himachal Pradesh Agricultural University, Bajaura 175125, Kullu, India
6
School of Agricultural Sciences, Sharda University, Greater Noida 201306, Uttar Pradesh, India
7
National Bureau of Agriculturally Important Microorganisms, Mau 275109, Uttar Pradesh, India
8
Institute of Agricultural Sciences, Banaras Hindu University, Varanasi 221005, Uttar Pradesh, India
9
Indian Grassland and Fodder Research Institute, Jhansi 284003, Uttar Pradesh, India
10
Farm Science Centre, GAD Veterinary & Animal Science University, Tarn Taran 143412, Punjab, India
11
Department of Agronomy, Afghanistan National Agricultural Sciences & Technology University, Kandahar 3802, Afghanistan
12
Faculty of Agriculture, Sayed Jamaluddin Afghani University, Asadabad 2801, Kunar, Afghanistan
13
Attara PG College, Bundelkhand University, Atarra 210201, Uttar Pradesh, India
*
Author to whom correspondence should be addressed.
Sustainability 2021, 13(10), 5425; https://0-doi-org.brum.beds.ac.uk/10.3390/su13105425
Submission received: 9 March 2021 / Revised: 19 April 2021 / Accepted: 7 May 2021 / Published: 12 May 2021
(This article belongs to the Special Issue Soil Health Restoration and Environmental Management)

Abstract

:
‘Participatory-mode’ adaptive research was conducted in wheat in north-western Himalayas (NWH) during 2008–2014 to develop an improved chemical weed management (ICWM) technology. First of all, two years ‘on-farm experimentation’ was performed in a randomized block design at 10 locations in NWH using seven treatments (Clodinafop @ 60 g a.i./ha (Clod); Clod followed by 2,4-D (Na-salt) @ 1.0 kg a.i./ha (Clod-fb-D); Isoproturon 75 WP @ 1.0 kg a.i./ha (Iso); Iso + D; Sulfosulfuron 75% WG @ 25 g a.i./ha + Metsulfuron 5% WG @ 2 g a.i./ha (Sulf + Met); weed-free-check; and un-weeded-check). In this study, the post-emergence application of Sulf + Met reported the lowest weed-index and NPK depletion by weeds with higher weed control efficiency (86.4%), weed control index (81.1%) and herbicide efficiency index (2.62) over other herbicides. Sulf + Met exhibited significantly higher wheat productivity (3.57 t/ha), protein yield, net-returns and water-productivity, which was followed by Iso + D and Clod-fb-D, all of which remained statistically at par with each other. An impact assessment of intensive technology-transfer programme (2008–2014) revealed a higher technology adoption rate (71–98%) of ICWM leading to higher wheat productivity (~22%) and net income gains (2.8–26.4%) in NWH. Overall, Sulf + Met proved highly effective against mixed weed flora in wheat to boost wheat productivity, profitability, quality and water productivity in addition to a higher technology adoption rate and NIGs to transform rural livelihoods in NWH.

1. Introduction

India (Triticum aestivum L.) is the second largest producer of wheat in the world after China and accounts for ~13.5% of global wheat production [1]. It is the second most important foodgrain crop in India after rice, providing ~50% of total calories and protein requirements for a vast majority of the Indian population [2]. The total area under wheat in India is about 29.3 million ha (m ha) with production of 103.6 million tonnes (mt) and average productivity of 3.53 t ha−1 [1]. In India, wheat is grown over a wide range of latitudes (60° N to 60° S) and altitudes ranging from sea level to upto 3500 m in the tropics and subtropics [3]. Winter temperatures of 10 to 15°C and summer temperatures varying from 21 to 26 °C are ideal for wheat production. Hence, it also grows well in north-western Himalayan provinces of India namely, Himachal Pradesh, Jammu and Kashmir, and Uttarakhand but with poor productivity (1.94 t ha−1) far below the national average [4,5]. Weed menace is a major production constraint in wheat in north-western Himalayas (NWH) in general and Himachal Pradesh in particular as a majority of hill farmers follow poor weed management practices, causinga ~66% yield reduction in wheat depending upon the weed densities, type of weed flora and its infestation duration [6]. In Himachal Pradesh (Figure 1), about two thirds of arable land area contributes as a moderate to major wheat producing area (Figure 2a). We can transform ~80% of the arable wheat suitability area in the state from a moderate to major wheat producing area simply by following a sound chemical weed management technology (Figure 2b). In NWH, Phalaris minor, Avena ludoviciana, Lolium temulentum and Poa annua are the major grassy weeds; while Vicia sativa, Anagallis arvensis, Ranunculus arvensis and Coronopus didymus are the main broad-leaved weeds that grow in association with wheat crop. These weeds germinate even before wheat germination and flourish luxuriously, taking advantage of its slow initial growth in NWH. Thus, weed competition throughout the crop season reduces wheat yield drastically if not managed scientifically [6]. Conventional cultural and manual weed management (CCMWM) practices are time-consuming and labour-intensive; hence, chemical weed management is most cost-effective and easy compared to manual weeding [7,8]. Chemical weed management has also become highly essential over the CCMWM practices in NWH due to an emerging labour shortage in these under-privileged ecosystems owing to rural migration to urban areas for better livelihoods [9,10]. Thus, a labour shortage vis à vis the costly manual labour required for CCMWM practices is hindering the wheat cultivation especially, in the complex weed–flora-dominated areas in NWH.
In general, the tank-mix combination of Isoproturon and 2,4-D has been recommended for chemical weed management in wheat in NWH [11]. However, the complex weed flora dominated by grassy weeds, namely Phalaris minor, Avena ludoviciana, Lolium temulentum and Poa annua, is not effectively controlled by the combination of Isoproturon + 2,4-D. Some suitable combinations of recently evolved broad-spectrum post-emergence herbicides, namely, Clodinafop Proprgyl in combination with 2,4-D or Sulfosulfuron + Metsulfuron-methyl, may effectively control the mixed weed flora of wheat in NWH. Clodinafop Propargyl has also been found to be effective against Isoproturon-resistant Phalaris minor and Avena fatua in wheat in NWH [6]. It is absorbed through the leaves and shoots with no harmful effects on the wheat and the succeeding crops. Likewise, Sulfosulfuron has been reported to have effective control of Isoproturon-resistant Phalaris minor, alongwith marginal control of broad-leaf weeds of wheat, while Metsulfuron-methyl has been recommended for the control of broad-leaf weeds in winter cereals [12], indicating that a combination of Sulfosulfuron + Metsulfuron-methyl may prove effective against the complex weed flora of wheat. Thus, an ‘on-farm’ experimentation was undertaken to assess the suitability of various post-emergence herbicides to effectively control the complex weed flora of wheat, and thereby develop an alternative chemical weed management strategy for enhancing wheat productivity, profitability, quality and resource-use efficiency in NWH. In addition, an intensive technology transfer programme was also aimed at higher technology adoption for improved wheat productivity and income gains in NWH.

2. Materials and Methods

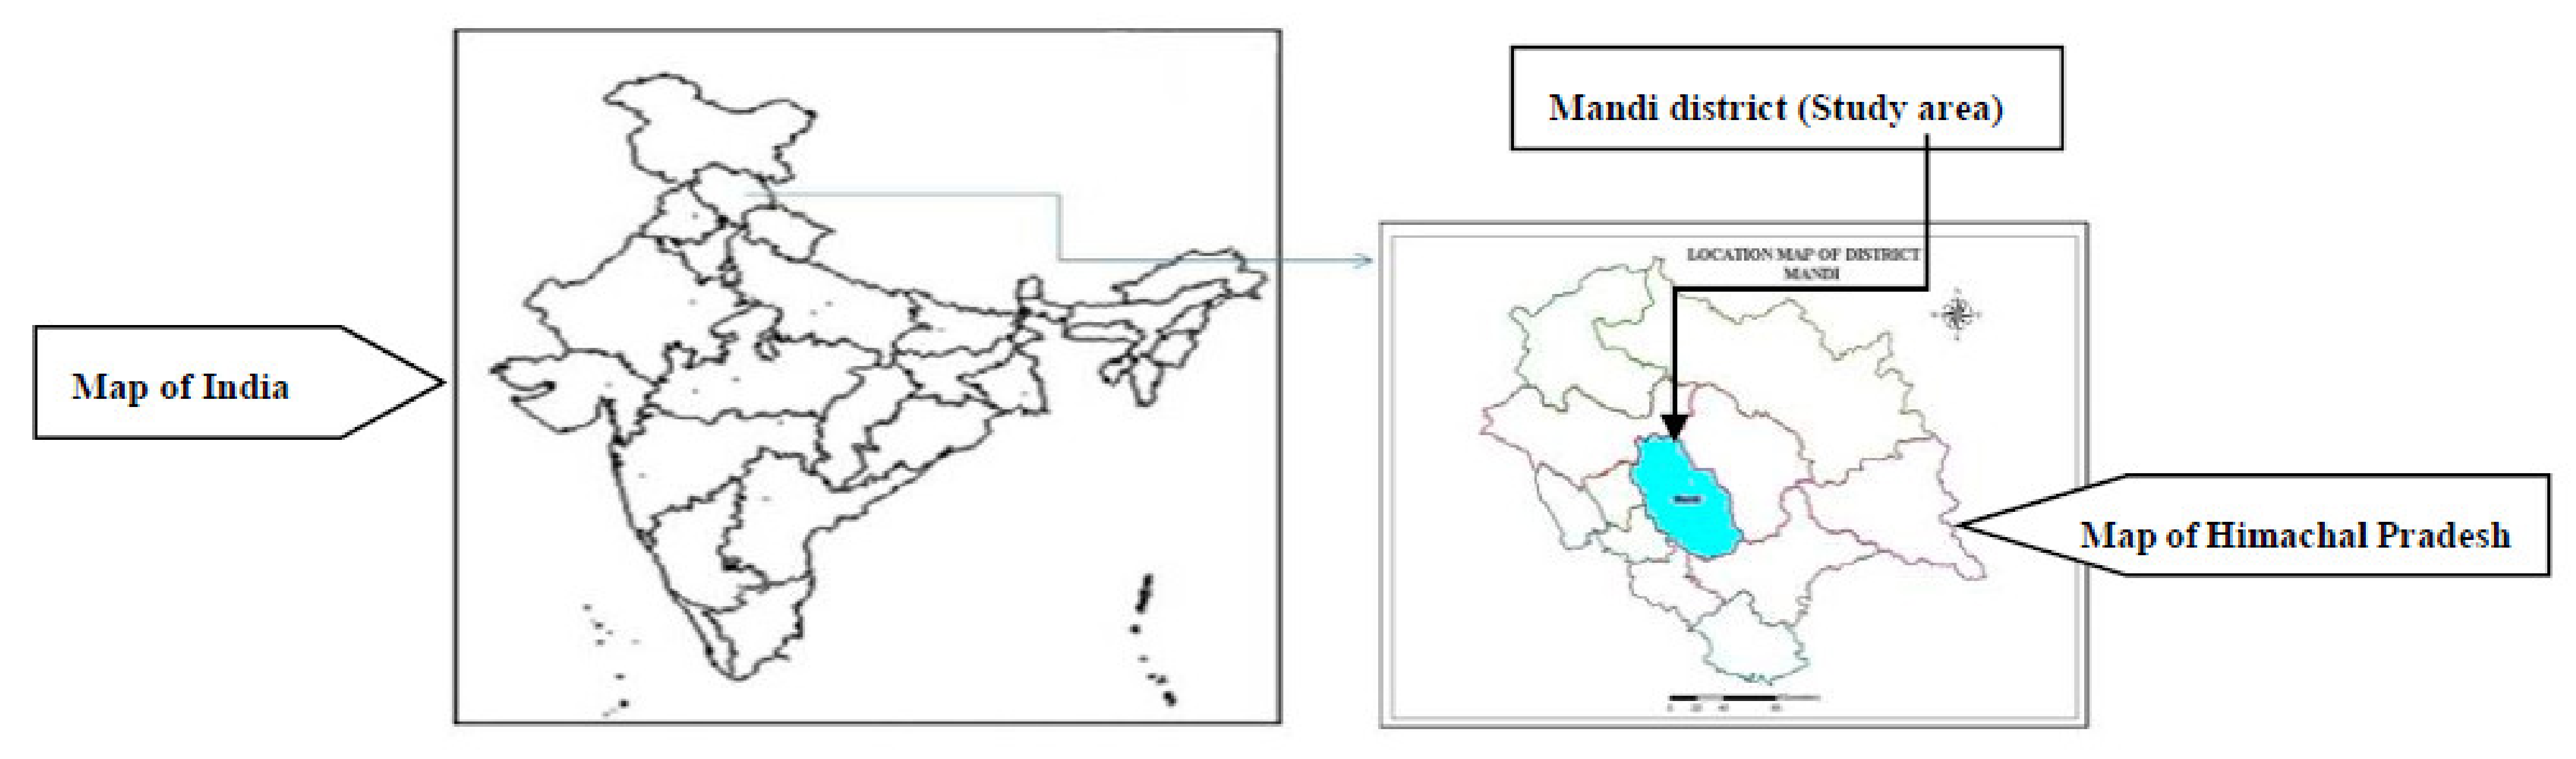
2.1. Experimentation Site and Methodology Followed

A field investigation was performed in wheat during Rabi 2008–2009to Rabi2013–2014 by CSK Himachal Pradesh Agricultural University (CSKHPAU), Farm Science Centre, (FSC) Sundernagar, India, situated in north-western Himalayas (NWH). For the initial two years (Rabi 2008–2009 to 2009–2010), an ‘on-farm experimentation (OFE)’ was performed in the Mandi district of Himachal Pradesh province of India, which was selected randomly as the study area after randomly selecting Himachal Pradesh as the study province in NWH (Figure 1). The intensive technology transfer programme comprised two years of OFE, frontline demonstrations (FLDs), method demonstrations, farmers’ training, field conventions and other extension activities for technology dissemination on farmers’ fields and its impact assessment as well. An assessment of pre- and post-training knowledge upgradation (Rabi 2008–2009 to 2009–2010), and technology adoption rate after one year of OFE (Rabi 2010–11), and then a technology impact assessment with respect to (w.r.t.) net income gains (NIGs) in the study area for the next three years (Rabi 2011–2012 to 2013–2014) were performed following an operational area framework methodology using standard procedures [10,13]. The reason for selecting the Mandi district as the study area was its unique geographical location (Figure 1) in the centre of Himachal Pradesh province [31°03′20″ to 32°04′30″ N latitude; 76°37′20″ to 77°23′15″ E longitude; 700 to 4000 m altitude] and its wet-temperate climate representing the whole of NWH [14]. Soil organic carbon (SOC), textural class, soil pH and available NPK of the OFE sites (0–15 cm soil depth) were determined using standard procedures as shown in Table 1. On average, soils of the OFE locations were silty-clay loam (acid Alfisol) in texture and acidic in reaction (pH 6.6–6.9), with medium SOC (7.3–9.5 g kg−1 soil), medium available-N (283.5–322.8 kg ha−1), high available-P (16.8–21.3 kg ha−1) and high available-K (261.5–278.7 kg ha−1) before experimentation (Table 1).

2.2. Field Experimentation Treatments and Crop Management

The multi-location OFE was conducted on wheat during 2008–2009 and 2009–2010 at 10 randomly selected locations on farmers’ fields in three randomly selected community-development-blocks (CDBs) of the Mandi district in Himachal Pradesh (India) having a predominance of rice-wheat cropping system covering 10 randomly selected villages: Jaral, Tarot, Chhattar, Sanghahan, Pali, and Bharjwanu (CDB-Sundernagar), Dondi, Satoh, Chawari (CDB-Balh) and Dhalli (CBD-Chuantra). The OFEcomprised seven treatments (T1 = Clodinafop @ 60 g a.i./ha; T2 = Clodinafop @ 60 g a.i./ha followed by (fb) 2,4-D (Na salt) @ 1.0 kg a.i./ha; T3 = Isoproturon 75 WP @ 1.0 kg a.i./ha; T4 = Isoproturon 75 WP @ 1.0 kg a.i. kg/ha + 2,4-D (Na salt) @ 0.5 kg a.i./ha; T5 = Sulfosulfuron 75% WG @ 25 g a.i./ha + Metsulfuron 5% WG @ 2 g a.i./ha; T6 = Weed-free check with 2 hand-weeding at 30 & 45 days after sowing (DAS); and T7 = Un-weeded check) and was conducted at 10 locations during Rabi 2008–2009 and 2009–2010 in wet-temperate NWH. The above post-emergence herbicides were sprayed using an ASPEE Knapsack sprayer fitted with a flat-fan nozzle in 750 L water ha−1 after 25–30 DAS of wheat. During 2008–2009, the above OFE was fully funded by CSKHPAU-FSC, Sundernagar (India) providing all farm inputs and technical support. During 2009–2010, only technical support was extended by the investigating scientists of CSKHPAU-FSC, Sundernagar (India), while expenditure on farm inputs was incurred by participating farmers. In order to assess the comparative bio-efficacy of post-emergence herbicides on the complex weed flora of wheat, the treatments T1–T4were conducted in a plot size of 500 m2 each, while T5–T7 were conducted in a plot size of 100 m2 each on farmers’ fields in the OFE covering a total of 2.3 ha area at 10 locations during both years. In the above OFE, the wheat variety ’HPW-236’ was sown using 100 kg seed ha−1 at a row spacing of 22 cm on 6th November 2008 and 7 November 2009, and harvested on 10 May 2009 and 12 May 2010 in respective crop seasons with respective crop season rainfall of 115.4 and 129.6 mm (Supplementary Figure S1). Rainfall data was recorded at the Agro-meteorological Observatory of CSKHPAU–FSC, Sundernagar (India) located in the centre of Mandi district in Himachal Pradesh (Figure 1 and Figure 2). The crop received five irrigations (60 mm each) during both years to ensure optimum soil moisture. Mineral N, P and K were applied @ 120 kg N + 60 kg P2O5 + 30 kg K2O ha−1 commonly in each treatment through urea (46% N), single super phosphate (16% P2O5) and muriate of potash (60% K2O), respectively. Urea was applied in three splits (50% basal, 25% at tillering, 25% at anthesis). Except for weed management, standard recommendations were followed for crop management [11].

2.3. Weed Studies

Weed count and weed dry biomass were recorded at 120 DAS by using a 0.25 m2 sized quadrate randomly at three places in each net plot and expressed as a number per m2 and g per m2, respectively, and then subjected to (square root transformation) for statistical analysis.
Weed control efficiency was determined using the standard procedure suggested by Das et al. [8] as follows:
Weed   control   efficiency   WCE = WDc     WDt × 100 WDc
where WDc is the weed density (number per m2) in the control plot (un-weeded check) and WDt is the weed density (number per m2) in treated plot.
Weed control efficiency (WCE) was determined using the standard procedure suggested by Das et al. [8] as follows:
Weed   control   index   WCI = WDMc   WDMt × 100 WDMc
where WDMc is the weed dry matter (kg ha−1) in control plot (un-weeded check) and WDMt is the weed dry matter (kg ha−1) in treated plot.
Weed index (WI) was determined using the standard procedure suggested by Das et al. [8] as follows:
Weed   index   WI = Ywf   Yt × 100 Ywf
where Ywf is the crop yield in the weed-free plot (kg ha−1) and Yt is the crop yield (kg ha−1) in the treatment plot for which WI is to be determined.
Herbicide efficiency index (HEI) was determined using the standard procedure suggested by Krishnamurthy et al. [21] as follows:
H e r b i c i d e   e f f i c i e n c y   i n d e x   HEI = Yt   Yc / Yt × 100 WDMt / WDMc × 100
where Yt is crop yield from the treated plot (kg ha−1); Yc is crop yield (kg ha−1) from the weedy-check plot; WDMt is the weed dry weight (kg ha−1) in the treated plot; and WDMc is the weed dry weight (kg ha−1) in the weedy-check plot.

2.4. Weed Chemical Analysis and Nutrient Depletion by the Weeds

To assess the effect of various weed management treatments on total weed dry matter (WDM) production at wheat harvest, the weed samples were again taken randomly by throwing a metallic quadrate of an area of 0.25 m2 (0.25 m × 0.25 m) at two places in net-plots [8]. Then, the collected weed samples were first sun-dried and then oven-dried at 70 °C till constant weight and converted to total WDM (kg ha−1) at wheat harvest during both years. Nutrient concentrations (% N, P & K) in these weed samples vis à vis NPK nutrient depletion (kg ha−1) by these weeds (at wheat harvest) were determined using standard procedures [22].

2.5. Plant Growth, Yield Attributes, Crop Productivity and Profitability

Plant observations related to plant height and yield attributes, namely, spike length, number of grains per spike and 1000-grain weight were recorded from 10 randomly selected plants from each net plot at each location using standard procedures [22]. For recording the number of spikes m−2 in the wheat crop, three observational units of one meter row length each were selected randomly from the net-plot rows and counted accordingly, and then the mean value was converted into a number of spikes m−2 [22]. Likewise, the grain, straw and biological yield from the net-plots of wheat harvested at physiological maturity were determined using standard procedures. The cost of cultivation (COC) in INR ha−1was calculated using prevailing market prices of inputs and outputs during the respective crop season. Gross returns were calculated using the prevalent market price of the wheat grains (INR 10,000 t−1) and straw (INR 1500 t−1) in the market. Net returns (INR ha−1) were calculated after subtracting the COC from the respective gross returns [23]. The benefit: cost ratio for each crop season was calculated by dividing the respective gross returns by the respective COC [23].

2.6. Plant Chemical Analysis and Protein Estimation

Wheat grain samples collected after harvest from all the field plots were oven-dried at 60 ± 2°C for 72 h and then ground in a Willey Mill fitted with stainless steel parts and passed through a 1 mm sieve. The N concentrations in these grain samples were estimated by the Micro-Kjeldahl method [15]. The protein content (%) in the wheat grains was determined by multiplying respective grain N concentrations (%) by a factorof6.25.

2.7. Resource-Use Efficiency

(i) Production efficiency: Production efficiency (PE) (kg ha−1 day−1) of wheat under different treatments was computed using a standard procedure as follows [24]:
PE = Total   economic   yield   of   wheat   kg / ha Duration   of   wheat   crop   days
(ii) Monetary efficiency: Monetary efficiency (ME) (INR ha−1 day−1) was expressed as a ratio of net returns (INR ha−1) to the duration of the wheat crop under a particular treatment as per the following formula [24]:
ME = Net   returns   of   wheat   INR / ha Duration   of   wheat   crop   days
(iii) Water use and water use efficiency: The ‘on-farm’ experimentation was performed at farmers’ fields in nearby CBDs to the CSK HPAU, FSC-Sundernagar, having similar agro-ecological situations. Thus, the rainfall data of the Agro-Meteorological Observatory of CSKHPAU–FSC, Sundernagar (India) was taken into consideration for water-use estimation (Supplementary Figure S1). Crops received five irrigations (60 mm each) during both years measured using the Parshall flume method, in addition to the respective crop season’s rainfall of 115.4 and 129.6 mm by taking into account the respective crop-growth period of the wheat. Total water use (TWU) comprised of the sum of effective rainfall (115.4; 129.6 mm) and irrigation water (300 mm) as 415.4 and 429.6 mm during 2008–2009 and 2009–2010, respectively. Water-use efficiency (WUE), Irrigation water productivity (IWP) and economic water productivity (EWP) were determined using standard procedures [25,26].

2.8. Technology Tranfer Methodologies

In order to achieve the objectives of the technology transfer on improved chemical weed management (ICWM) technology in wheat and its adoption in the study area, various technology transfer tools, namely, frontline demonstrations (FLDs), method demonstrations, farmers’ specialised training, field days, field conventions, phone-line advisory to farmers, farmer–farmer extension approach, TV telecasts, media releases and SMS service, etc., were employed in the current study. Thus, in addition to conducting the OFE, the farmers (n = 102) of participating/surrounding villages were trained through FLDs, hands-on training on ICWM through method demonstrations, training, phone-line advisory, TV telecasts, media releases and regular SMS service, etc. for technology dissemination during 2008–2010. Literature on ICWM in simple local language (Hindi) was also provided in training for occasional technical back-up in NWH.

2.9. Knowledge Behaviour, Technology Adoption Rate and Impact Assessment

A thorough study was undertaken with well-structured interview schedules (pre-OFE training and post-OFE training) to assess the knowledge level and its upgradation among trainee farmers (n = 102) during 2008–2010.The extent of ICWM adoption was ascertained after one year of ‘on-farm’ experimentation, i.e., 2011–2012, after generating primary data using a participatory rural appraisal (PRA) technique, interview schedules and a group dynamics method to obtain reliable and valid information [13,14]. The net income gains (NIG) by the adoption of ICWM among practicing farmers in NWH were also assessed during Rabi 2011–2012 to 2013–2014 following the standard procedure suggested by Choudhary and Rahi [10].

2.10. Statistical Analysis

Statistical analysis of two years of ‘on-farm’ experimental data was conducted under a randomised block design (7 treatments; 10 locations/replications) using standard procedures as suggested by Gomez and Gomez [27] following the SPSS statistical package. Critical difference (CD) values at p = 0.05 were used to determine the significant differences among treatment means.

3. Results and Discussion

3.1. Weed Flora of Wheat in NWH and Herbicidal Options

In wet-temperate NWH, dominant weed spp. Were Phalaris minor, Avena ludoviciana, Lolium temulentum and Poa annua among narrow leaf weeds (NLWs), and Vicia sativa, Anagallis arvensis, Ranunculus arvensis and Coronopus didymus among broadleaf weeds (BLWs), which grew in association with wheat across the study years (Figure 3 and Figure 4). Other weeds of minor importance were Lathyrus aphaca, Alopecurus myosuriodes, Stellaria media, Polygonum alatum and Plantago sp. Thus, there is predominance of mixed weed flora in wheat in NWH, where the sole use of herbicides having efficacy either against NLWs or BLWs is not advisable; rather, we need to develop a broad-spectrum NLW and BLW management strategy [5]. A post-emergence application of Isoproturon has already shown resistance against many biotypes of Phalaris minor and Avena fatua in wheat in NWH [6,28]. For ensuring broad-spectrum weed management, we can use new herbicidal combinations like Sulfosulfuron 75% WG + Metsulfuron 5% WG (Sulf + Met) or Clodinafop followed by 2,4-D (Na salt) [Clod-fb-D) over the conventional herbicidal combination of Isoproturon 75 WP + 2,4-D (Na salt) (Iso + D). Clodinafop Propargyl effectively controls the Isoproturon-resistant Phalaris minor, but again, few biotypes of Phalaris minor have recently shown cross-resistance to it in different parts of north India [6]; therefore, its use may be restricted to areas where cross-resistance has not appeared. Further, the emerging labour shortage in these under-privileged ecosystems due to rural migration to urban areas emphasizes the need to develop a sound chemical weed management technology for wheat to boost wheat productivity and farm incomes in NWH. Hence, the above discussion strongly advocates for assessing the bio-efficacy of an herbicidal combination of Sulfosulfuron 75% WG + Metsulfuron 5% WG both against BLWs and NLWs, in addition to addressing the emerging herbicide resistance in Phalaris minor in NWH [6,12].

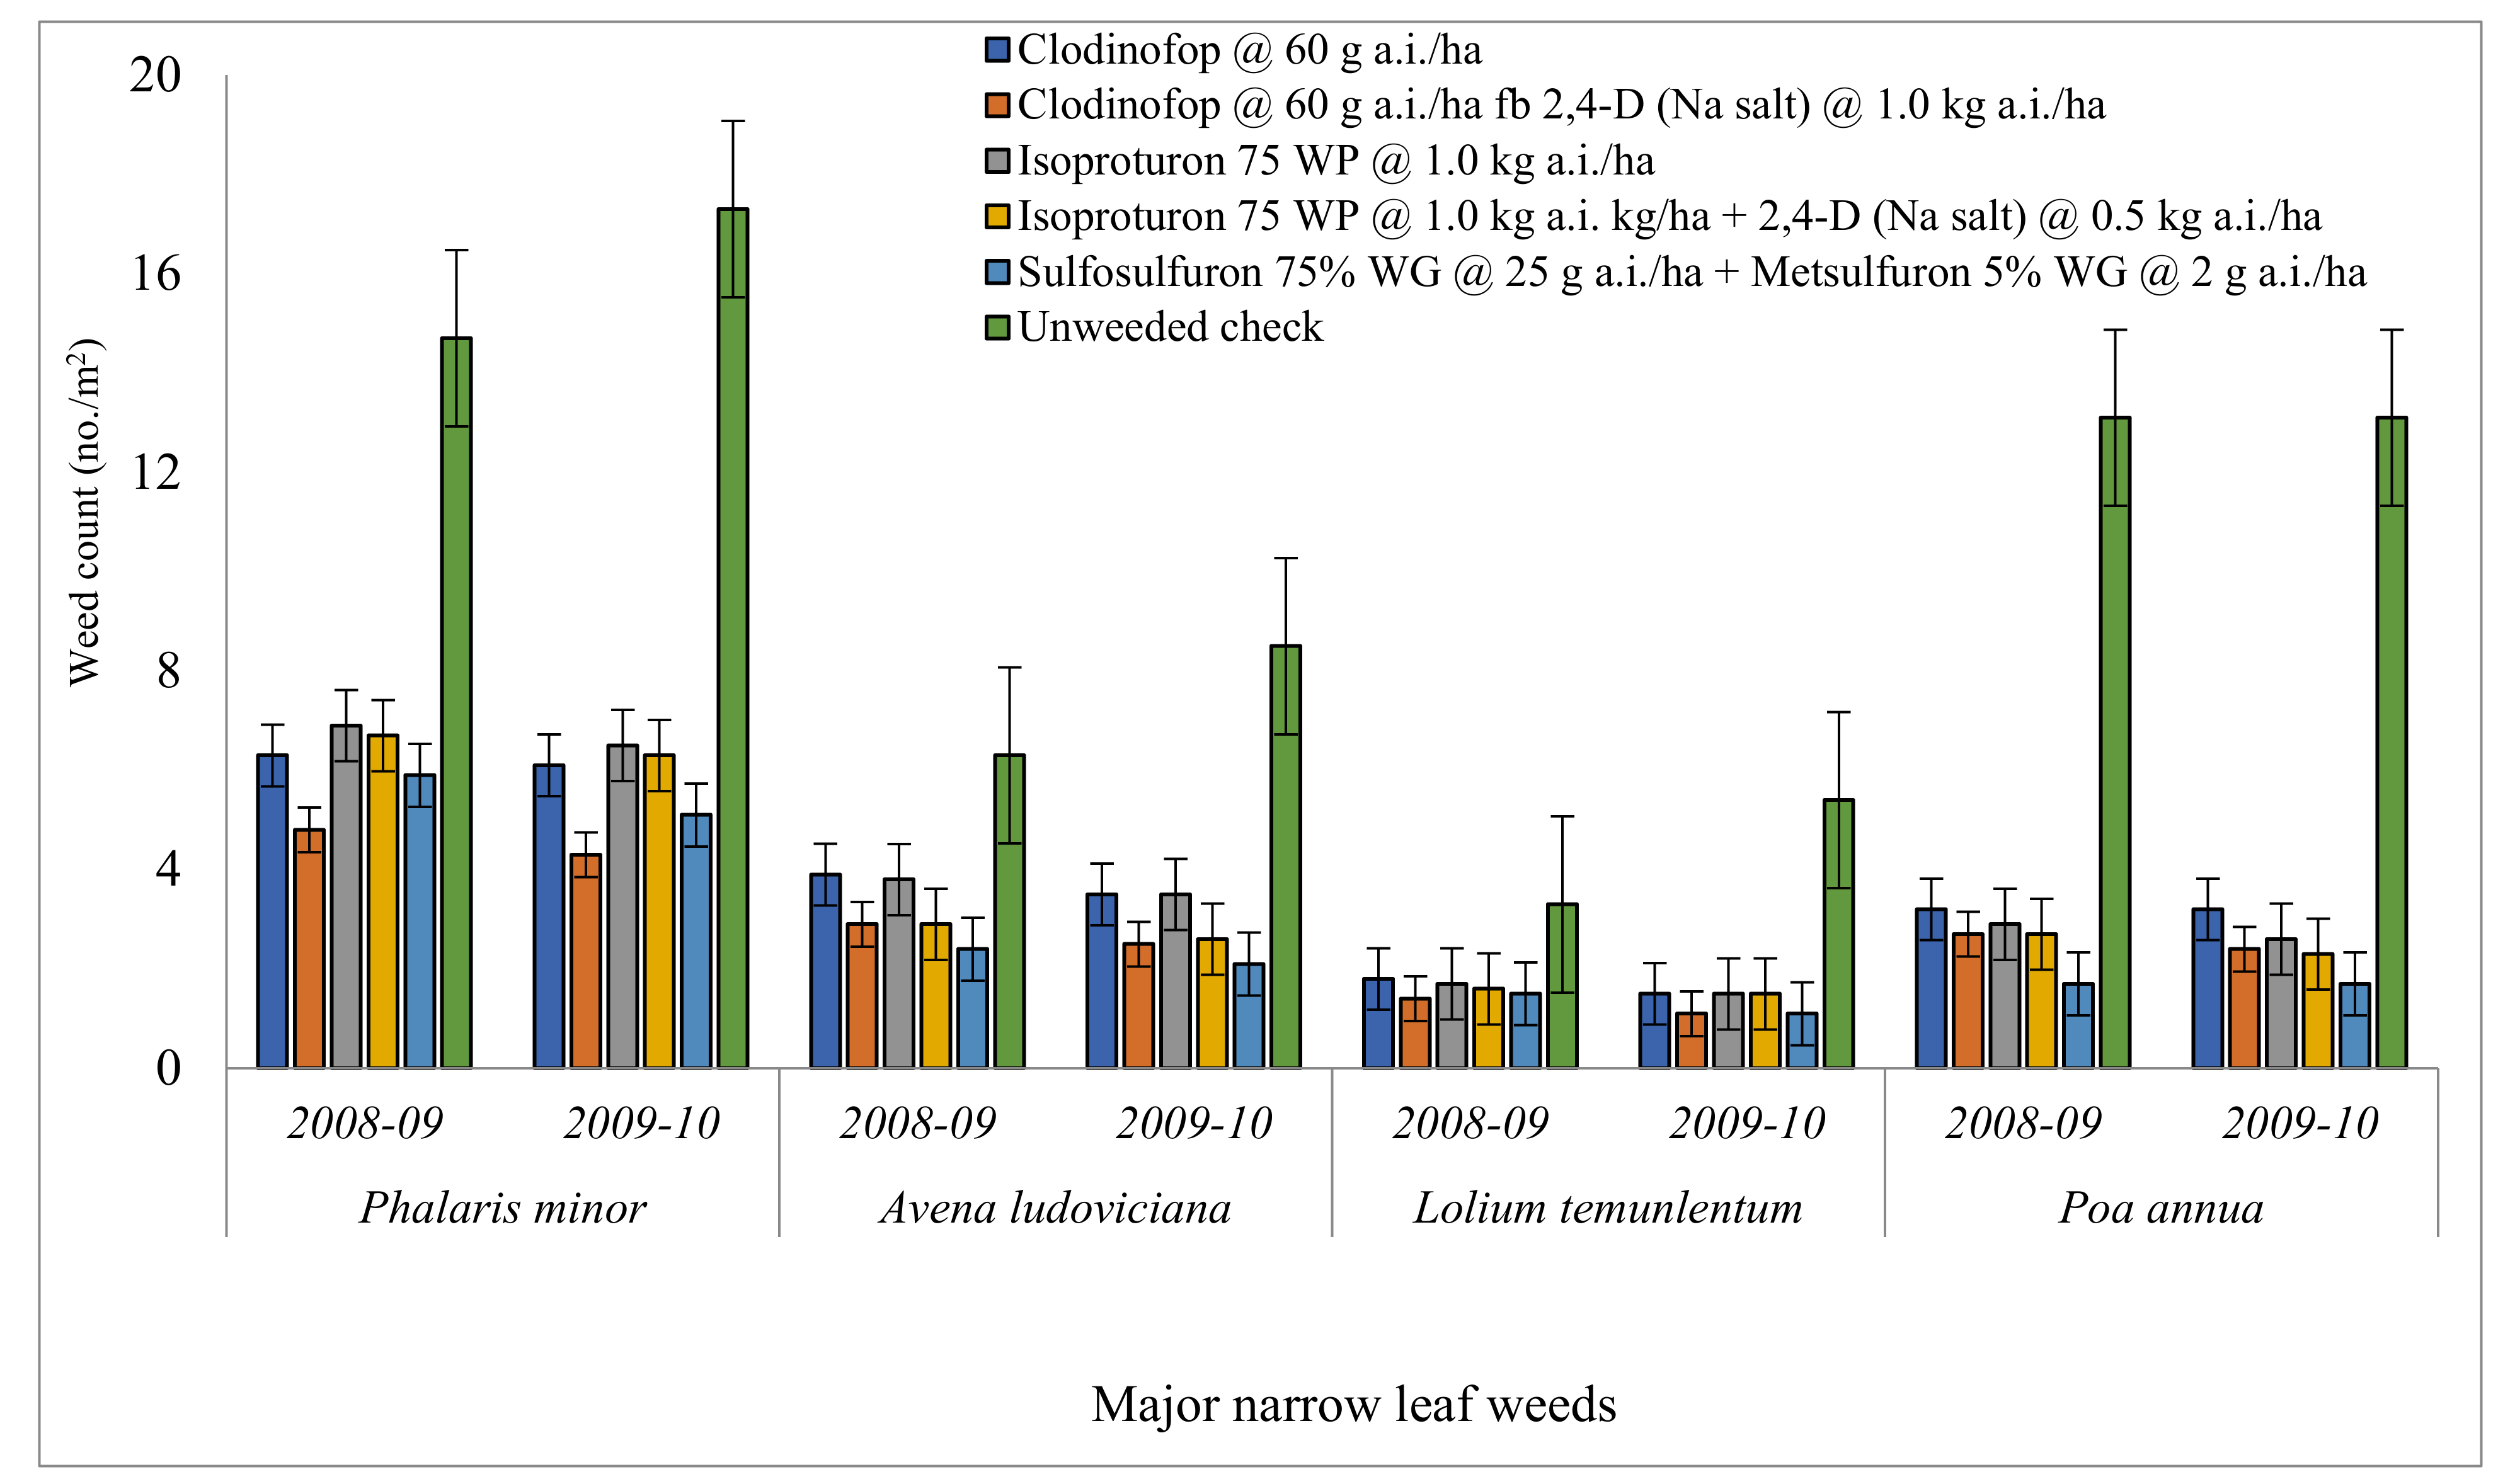
3.2. Weed Count and Weed Dry Matter Studies

A post-emergence application of Clod-fb-D resulted in the significantly lowest weed count of Phalaris minor and Lolium temulentum, which was followed by Sulf + Met (Table 2; Figure 3). Avena ludoviciana and Poa annua observed the lowest weed count using Sulf + Met followed by Clod-fb-D. Thus, Clod-fb-D is highly effective against Phalaris minor, Lolium temulentum and poa annua, while Sulf + Met is more effective for Avena ludoviciana and Poa annua management. Sulf + Met also exhibited the lowest weed count in all BLWs, namely,Vicia sativa, Anagallis arvensis, Ranunculus arvensis and Coronopus didymus which was followed by Iso + D and Clod-fb-D, respectively (Table 2; Figure 4), indicating that Sulf + Met is a better option for the effective control ofall BLW flora. The sole use of either Isoproturon or Clodinafop is not effective against the mixed weed flora of wheat, especially BLWs [8,29,30].
Total weed dry matter (TWDM) production of NLWs and BLWs at 120 DAS was significantly influenced by different herbicide treatments over un-weeded check (UWC), and followed the trend of Sulf + Met < Iso + D < Clod-fb-D < Iso < Clod > UWC, respectively (Table 2; Figure 5).Essentially, Sulf + Met proved superior for effectively controlling the mixed weed flora with the least species-wise weed population, total NLW and BLW population and TWDM during both years (Table 2; Figure 3 and Figure 4). This may be attributed to the inhibition of enzyme acetolactate synthase (ALS) by the application of Sulf + Met, which acts as a catalyst in the biosynthesis of branched-chain amino acids such as valine, leucine and isoleucine [31], and is thereby responsible for the higher effectiveness of Sulf + Met in selectively killing both NLWs and BLWs over Iso + D, Clod-fb-D as well as the sole application of Clodinafop-propargyl or Isoproturon [31,32,33].

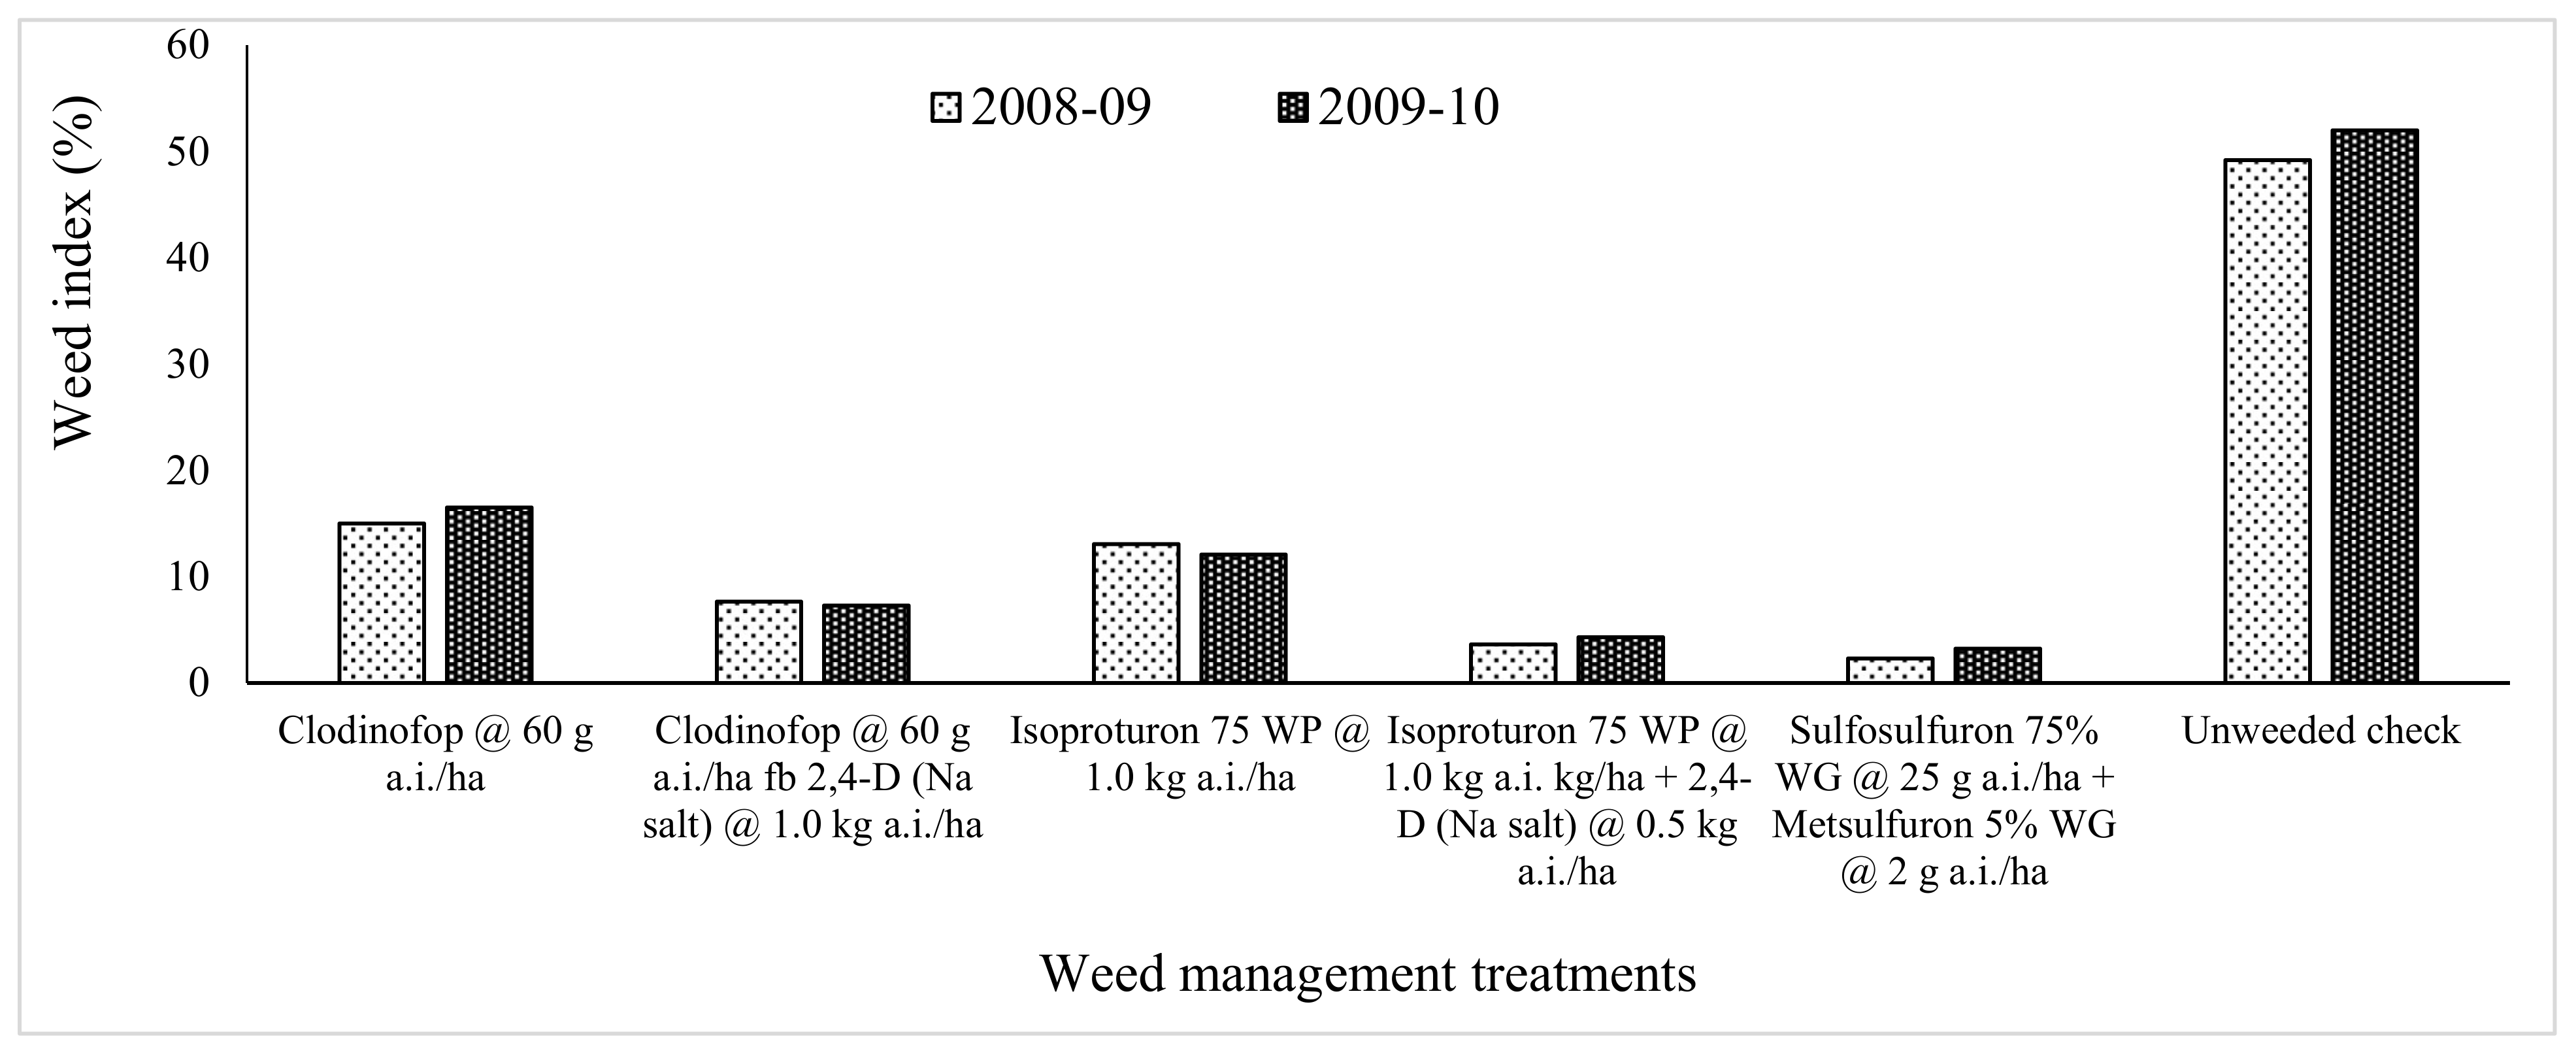
3.3. Weed Control Indices and Herbicide Efficiency Index

The post-emergence application of Sulf + Met exhibited higher weed control efficiency (WCE) after a weed-free check (WFC), while the sole use of Clodinafop exhibited the least WCE during both years (Figure 6 and Figure 7). WCE followed the trend of WFC > Sulf + Met > Clod-fb-D > Iso + D > Iso > Clod, respectively, indicating that Sulf + Met is highly effective against the mixed weed flora of both NLWs and BLWs, followed by Clod-fb-D and Iso-D. The weed control index (WCI) followed the trend of WFC > Sulf + Met > Iso + D > Clod-fb-D > Iso > Clod, respectively, which again indicated the superiority of Sulf + Met for effective NLW and BLW management after WFC, which was followed by Iso + D and Clod-fb-D.
The UWC exhibited the comparatively highest weed index (WI), owing to the lowest wheat grain yield during both years (Figure 8). WI followed the trend of Sulf + Met < Iso + D < Clod-fb-D < Iso < Clod < UWC, respectively, which indicates that Sulf + Met may harness higher wheat productivity owing to the least weed completion due to the effective management of both NLWs and BLWs over Iso-D and Clod-fb-D, respectively (Figure 8). The herbicide efficiency index (HEI) followed the trend of Sulf + Met > Iso + D > Clod-fb-D > Iso > Clod, owing to higher wheat grain yield and the least TWDM in wheat over other treatments [8], thus indicating that Sulf + Met is superior w.r.t. HEI over Iso + D and Clod-fb-D (Figure 9). The weed eradication in WFC plots enumerated significantly higher WCI and WCI in this treatment [22], while the excellent weed knockdown ability of Sulf + Met both against complex weed flora including Isoproturon- and Clodinafop-resistant NLWs could be assigned as the reason for superior weed indices, namely, WCE, WCI and WI as well as higher HEI by the application of Sulf + Met over other herbicidal treatments [31].The combined application of Sulf + Met exhibits both foliar and soil activity against weeds that inhibits cell division in shoots and roots by inhibiting the ALS enzyme and thereby blocks amino acid biosynthesis; hence, the weed plants suffer selectively [31,34]. This mechanism impairs the phloem transport in the weed plants with stunted growth on account of the cessation of cell division and slow plant death, thus providing excellent control of both dicot and monocot weeds by reducing their densities and TWDM [34,35].

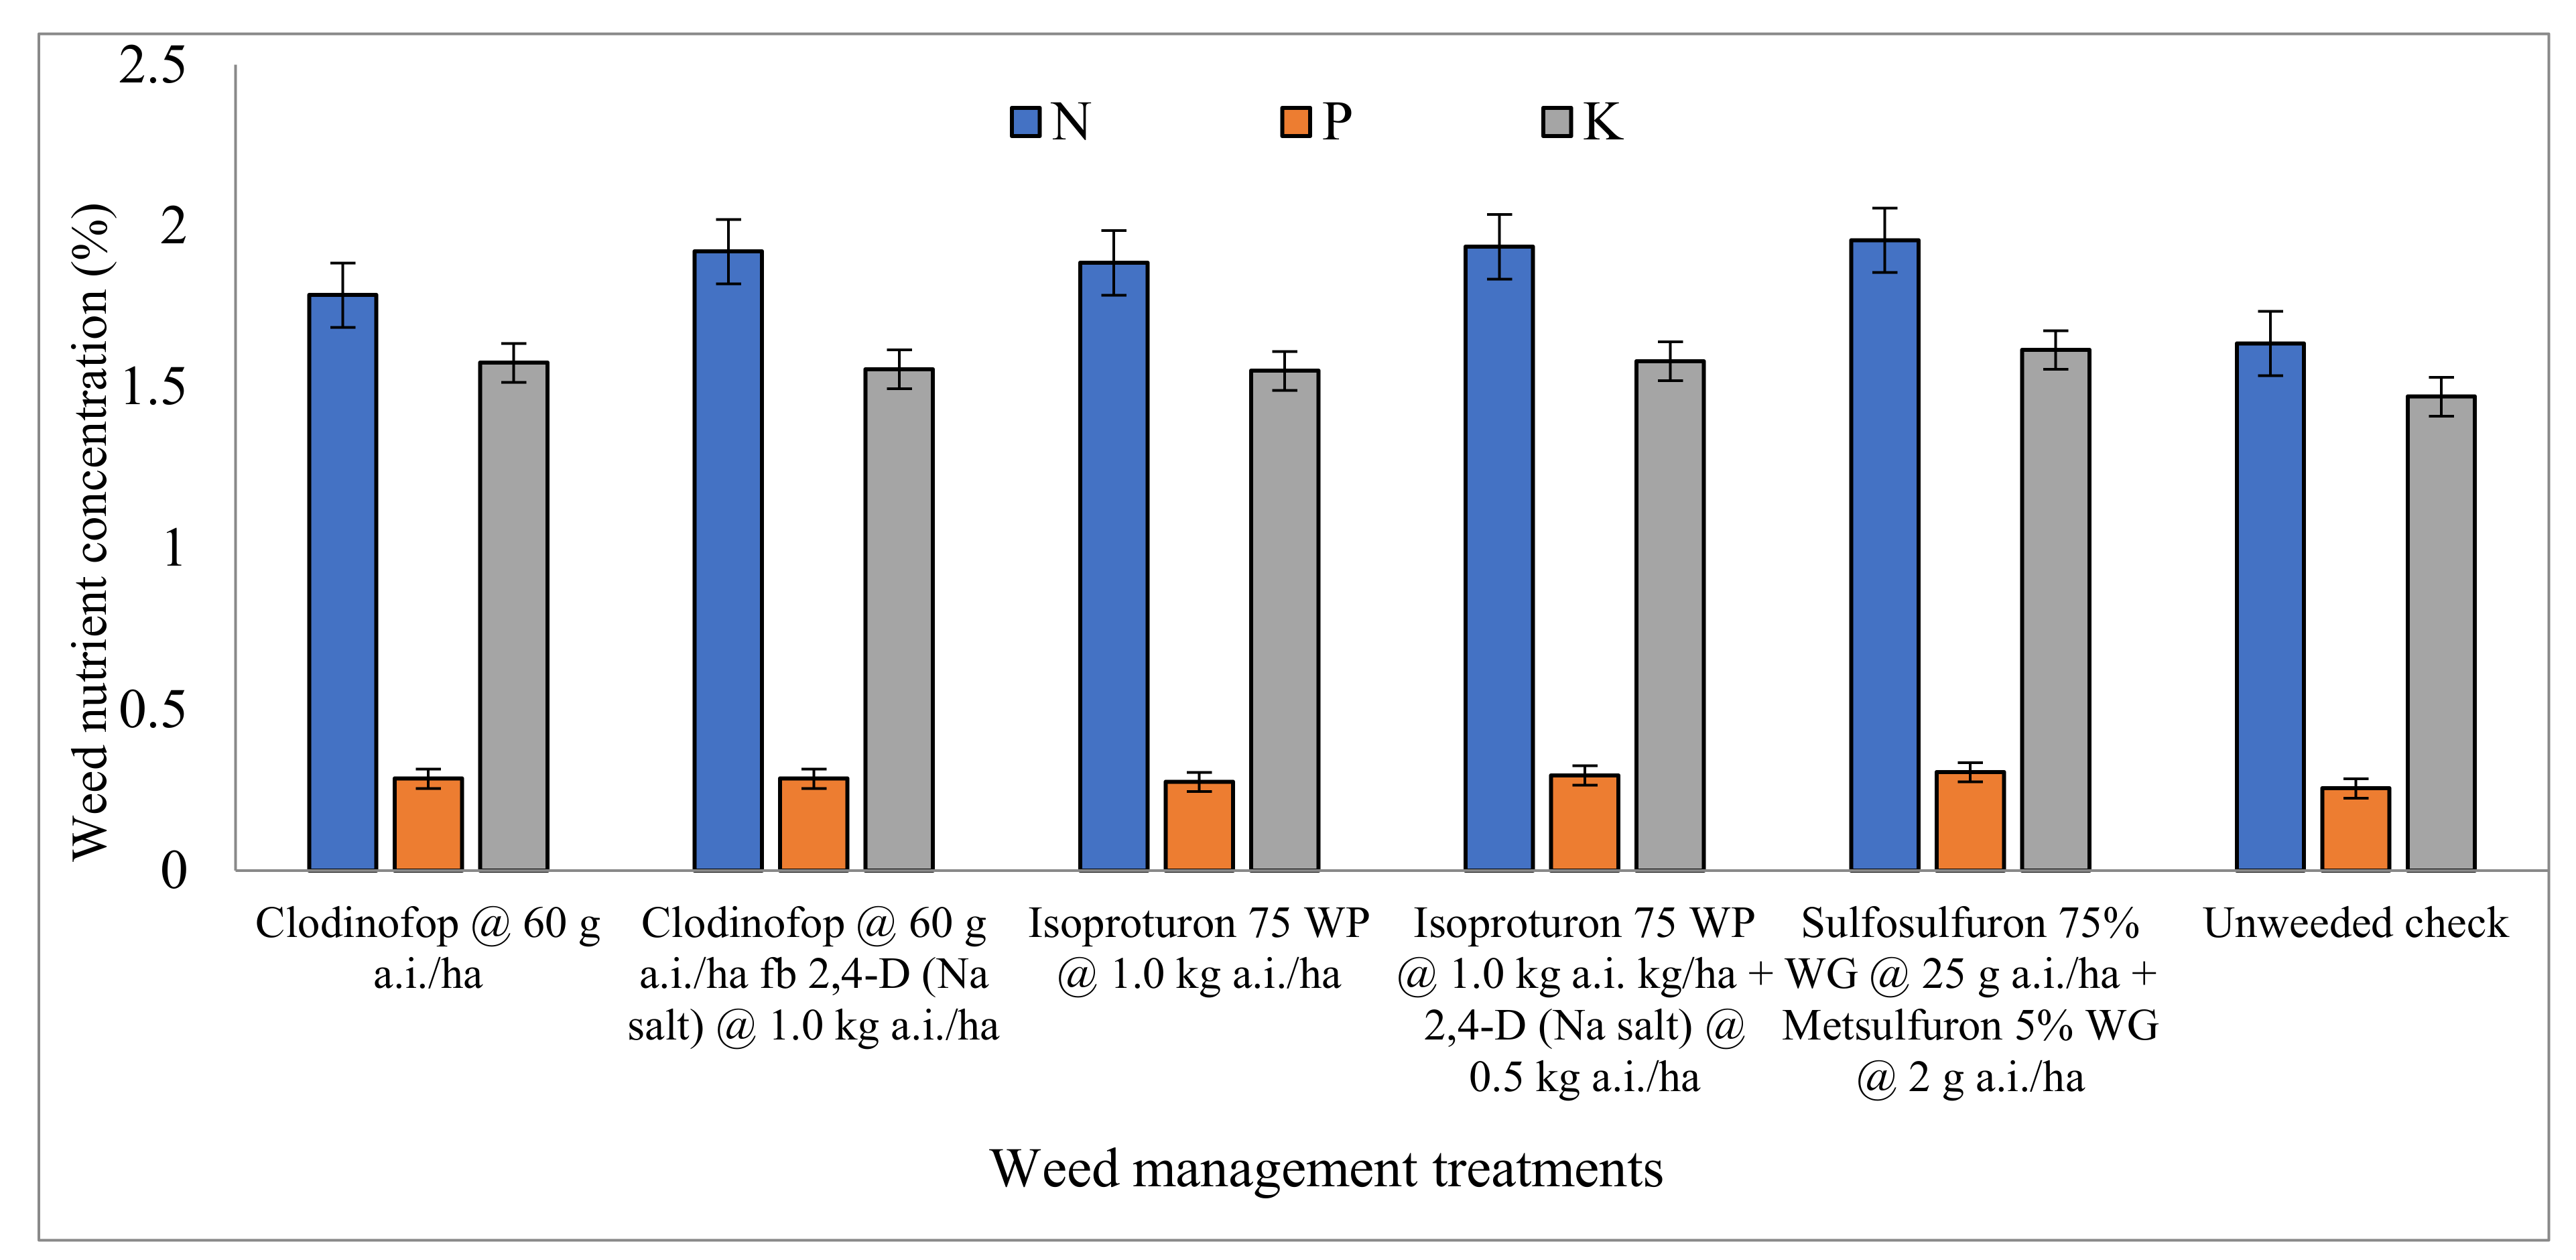
3.4. Weed Nutrient Concentrations and Weed Nutrient Depletion

Average nutrient concentrations (NPK) in mixed weed flora samples taken at wheat harvest followed the trend of Sulf + Met > Iso + D > Clod-fb-D > Iso > Clod > UWC, respectively, during both years (Figure 10). NPK concentrations in weed samples remained statistically at par among different herbicide treatments, except UWC, which exhibited the lowest values. NPK depletion by these weeds at wheat harvest followed the reverse trend of UWC > Iso > Clod > Clod-fb-D > Iso + D > Sulf + Met, respectively, where UWC exhibited the significantly highest NPK depletion, while Sulf + Met remained at par with Iso-D and Clod-fb-D exhibited the least NPK depletion (Figure 11). Since Sulf + Met is highly effective against the mixed weed flora of both NLWs and BLWs over Clod-fb-D or Iso + D, it observed higher weed nutrient concentrations due to the least inter- and intra-spp. competition [36,37,38]. Conversely, the lowest weed count of both NLWs and BLWs under Sulf + Met exhibited the lowest TWDM per m2 land area that computed the lowest weed nutrient depletion under Sulf + Met over other herbicidal treatments (Figure 11).

3.5. Growth, Yield Attributes, Wheat Productivity and Quality

Plant height, the number of spikes m−2 and grains spike−1 in wheat were significantly higher under Sulf + Met, which remained at par with Iso + D and Clod-fb-D, while the sole use of Isoproturon or Clodinafop exhibited the least magnitude of these parameters during both years (Table 3). Spike length and 1000-grain weight also exhibited higher values under Sulf + Met. Grain, straw and the biological yield of wheat followed the trend of WFC > Sulf + Met > Iso + D > Clod-fb-D > Iso > Clod > UWC, respectively, during both years (Table 4). On average, Sulf + Met exhibited an approximate1.1, 5.1, 11.2 and 15.2% higher grain yield over Iso + D, Clod-fb-D, Isoproturon and Clodinafop, respectively. Harvest index and protein content in wheat grains exhibited a non-significant influence under different weed management treatments, while protein yield was significantly influenced by these treatments (Table 4). Protein content and protein yield followed the trend of WFC > Sulf + Met > Iso + D > Clod-fb-D > Iso > Clod > UWC, respectively, during both years. On average, Sulf + Met exhibited an approximate5.1, 10, 18.5 and 25.3% higher protein yield over Iso + D, Clod-fb-D, Isoproturon and Clodinafop, respectively. In general, WFC plots attained better growth due to the elimination of NLWs and BLWs in addition to better availability of space, moisture, nutrients and light, which in turn had superior yield attributes and consequently higher wheat yield, protein content and protein yield in WFC [36]. Similarly, Sulf + Met exhibited a relatively higher knockdown effect on NWLs and BLWs owing to the inhibition of ALS enzyme-impairing amino acid biosynthesis selectively killing the weeds and reducing crop-weed competition for space, light and nutrients, which collectively led to better growth and yield attributes (spikes m−2, grains spike−1) in wheat, resulting in a higher wheat yield and protein yield over other herbicidal combinations [35,36]. Thus, the low weed infestation in Sulf + Met and WFC helped in accumulating more biomass in wheat plants owing to better nutrient and water acquisition and optimum photosynthesis as a result of low crop-weed competition for light and space, which resulted in better yield expression in wheat [31,35,39,40]. The solitary use of a single herbicide resulted in lesser grain and straw yield in wheat due to poor weed control and higher crop-weed competition [36,37,38,41].

3.6. Economic Analysis

Cost of cultivation (COC) followed the trend of WFC > Clod-fb-D > Sulf + Met > Iso + D > Clod > Iso> UWC, respectively (Table 5). Gross returns followed the trend of WFC > Sulf + Met > Iso + D > Clod-fb-D > Iso > Clod > UWC, respectively, whereas net returns were significantly higher under Sulf + Met (INR 28569/ha), followed by Iso + D, WFC, Clod-fb-D, Iso and Clod, respectively, during both years. The benefit: cost ratio (BCR) followed the trend of Iso + D > Sulf + Met > Iso > Clod-fb-D > Clod > WFC > UWC, respectively. Among chemical weed management options, Sulf + Met exhibited significantly higher gross and net returns while it remained statistically at par with Iso + D. The application of Iso + D remained statistically at par with Sulf + Met and computed significantly higher BCR (3.01) because of its comparatively lower COC over Sulf + Met in the current study. These results may be attributed to better economic feasibility of these treatments linked with higher production potential over other treatments [31]. Reduced weed infestation under Sulf + Met lowered the crop-weed competition, which enhanced the source-sink relationship in wheat leading to higher nutrient acquisition and photosynthesis [30,37,42,43], which resulted in more biomass production vis à vis higher wheat productivity and economic returns [31,34].

3.7. Production-Efficiency, Monetary-Efficiency and Water Productivity

Production efficiency (PE) and monetary efficiency (ME) followed the trend of WFC > Sulf + Met > Iso + D > Clod-fb-D > Iso > Clod > UWC, respectively, indicating the superiority of Sulf + Met, followed by Iso + D and Clod-fb-D, all of which remained statistically at par during both years (Table 6). Total water use (TWU) was the same among different treatments; however, total water productivity (TWP), irrigation water productivity (IWP) and economic water productivity (EWP) followed the trend of WFC > Sulf + Met > Iso + D > Clod-fb-D > Iso > Clod > UWC, respectively, during both years (Table 6). Hence, WFC proved significantly superior among different weed management options, though it behaved statistically at par with Sulf + Met and Iso + D w.r.t. TWP, IWP and EWP in the current study. The effective control of complex weed flora under Sulf + Met and WFC exhibited better yield expression and resultant economic performance, which led to improved PE, ME and water productivity in these treatments over the rest of the herbicidal treatments [31,35].

3.8. Knowledge Upgradation and Technology Adoption Rate

Pre-training knowledge behaviour of farmers (n = 102) in different CBDs of participating and surrounding villages of the study area in NWH revealed that farmers’ knowledge about chemical weed management (CWM) practices varied between 7–48%, which was upgraded to 78–100% after imparting training (Table 7). Among CWM practices, the pre-training knowledge level was lowest (7%) about herbicide resistance as well as about the agronomic measures for herbicide resistance avoidance, both of which upon training were improved to 78 and 99%, respectively. The pre-training knowledge level of conventional cultural and manual weed management (CCMWM) practices varied between 23–81% among trainee farmers (n = 102) which was upgraded to 91–100% after imparting training.
Among CCMWM practices, the trainee farmers had the lowest knowledge level (23%) of crop rotations and intercropping systems for wheat, which upon training was upgraded to 91%. The highest pre-training knowledge level was ~81% and about agronomic weed management operations, which was improved to 97% after imparting training. The technology adoption rate after one year of OFE execution varied between 71–98% about CWM practices, with the lowest adoption rate (71%) for agronomic measures to reduce herbicide resistance and the highest adoption rate (98%) for the application of various chemical herbicides for CWM in wheat (Table 7). The technology adoption rate for CCMWM practices varied between 72–95%, with the lowest values (72%) for summer ploughing and crop residue retention, while the highest adoption rate (95%) was observed for agronomic weed management operations in wheat in NWH (Table 7). The higher post-training knowledge upgradation (n = 102) and higher technology adoption rate revealed that operational area framework-based intensive technology transfer programmes may lead to faster and higher knowledge upgradation and technology adoption amongst target farmers [10,44,45,46].

3.9. Impact Assessment and Net Income Gains

Based upon the OFE, finally an improved chemical weed management technology (ICWM) was developed against the mixed weed flora of wheat in NWH i.e., post-emergence application of Sulfosulfuron 75% WG @ 25 g a.i./ha + Metsulfuron 5% WG @ 2 g a.i./ha after 25–30 DAS of wheat. This ICWM technology was then extensively transferred in wet-temperate NWH to effectively control the NLWs and BLWs of wheat for harnessing higher wheat productivity with better quality, profitability and water productivity in addition to curtailing the herbicide resistance issues that emerged due to conventionally used herbicides in NWH. During 2008–2010, CSKHPAU–FSC, Sundernagar (India) conducted 20 OFEs in 10 villages/locations of three CBDs of the Mandi district in NWH for two years in addition to numerous frontline demonstrations (FLDs), method demonstrations, farmers’ training, field days, TV telecasts, media releases, field conventions, phone–line advisory, regular SMS service, etc. for technology dissemination on farmers’ fields. The CBD-wise available information (based on primary and secondary data) revealed that in the Mandi district of Himachal Pradesh alone, the adoption of CWM practices were scaled-up from 48% in 2008 to 98% in the year 2014, which improved wheat productivity by ~22% (2008–2009 to 2013–2014). Numerous operational area framework-based ‘on-farm’ experimentation and intensive technology transfer programmes have brought high success rates in technology adoption and productivity enhancement worldwide [13,14,44,47,48,49]. An assessment of net income gains (NIG) by the adoption of ICWM technology in wheat was performed in the study area for three years (2011–2012 to 2013–2014) through well-structured interview schedules (Table 8).
The NIG analysis revealed that net returns from conventional cultural and manual weed management (CCMWM) practices ranged between INR 18,667–21,580 ha−1, with an average value of INR 20,764 ha−1 among TWM practicing farmers (n = 30) out of the 102 trained farmers (n = 102). Net returns from CCWM practices ranged between INR 21,530–27,962 ha−1, with an average value of INR 27,411 ha−1 among practicing farmers (n = 102) receiving NIG gains of 24.2% over CCMWM in the study area. The ICWM technology Sulfosulfuron 75% WG @ 25 g a.i./ha + Metsulfuron 5% WG @ 2 g a.i./ha, was the best performer, with net returns ranging from INR 22,365 to 29,522 ha−1, with an average value of INR 28,198 ha−1receiving ~26.4% and 2.8% higher NIGs over CCMWM and CCWM, respectively, in wheat in north-western Himalayas (Table 8). Higher NIG gains through the adoption of sound farm technologies have also been reported by many researchers for bringing socio-economic transformation in livelihoods of hill farmers of NW Himalayas [9,10,13,14].

4. Conclusions

Post-emergence application of Sulfosulfuron 75% WG @ 25 g a.i./ha + Metsulfuron 5% WG @ 2 g a.i./ha (Sulf + Met) emerged as an improved chemical weed management (ICWM) technology against the mixed weed flora of wheat in NWH. Sulf + Met exhibited significantly higher weed control efficiency (86.4%), weed control index (81.1%) and herbicide-efficiency index (2.62) in addition to lower weed nutrient depletion over other herbicidal treatments. Sulf + Met reported significantly higher wheat productivity (3.57 t ha−1), protein yield (0.44 t ha−1), net returns (INR 28,569 ha−1) and water productivity. The Iso + D and Clod-fb-D were another two viable herbicidal combinations to manage complex weed flora of wheat in NWH; however, their repeated use may lead to development of Isoproturon- and Clodinafop-resistant Phalaris minor biotypes as per the reports from NWH. The impact assessment of intensive technology transfer programme revealed higher knowledge upgradation (78–100%), a higher technology adoption rate (71–98%) and improved wheat productivity (~22%) in NWH. The adoption of ICWM technology also enhanced the NIG by ~26.4 and 2.8% over CCWM and CCMWM in wheat in NWH, which advocates for employing ‘participatory-mode’ adaptive research and technology transfer programmes in remote agro-ecologies. Essentially, Sulf + Met proved a potential ICWM technology against the mixed weed flora of wheat for boosting the crop and water productivity, profitability and quality of wheat in NWH.

Supplementary Materials

The following are available online at https://0-www-mdpi-com.brum.beds.ac.uk/article/10.3390/su13105425/s1, Figure S1: Rainfall pattern of the study area during crop growth months (Rabi 2008–2009 to 2009–2010).

Author Contributions

Conceptualization, A.K.C., D.S.Y., P.S., S.R., K.A. and S.K.T.; Data curation, A.K.C., D.S.Y., P.S., S.R., K.A., S.K.T., R.L., S.K., J.S., A.D., S.B., R.S.B., A.K. (Adarsh Kumar), S.K.R., G.A.R. and M.H.K.; Project administration, A.K.C., D.S.Y., P.S., S.R., K.A., S.K.T. and S.K.; Writing—original draft, A.K.C., D.S.Y., R.L., J.S., A.D., R.S.B., D.S.R., A.K. (Adarsh Kumar), S.K.R., G.G., A.K. (Anil Kumar), H.M.N. and A.U.N.; Writing—review and editing, A.K.C., J.S., A.D., S.B., A.U.N., G.A.R., M.H.K., V.K.D., R.S. All authors have read and agreed to the published version of the manuscript.

Funding

This research received no external funding.

Institutional Review Board Statement

The study was conducted according to the guidelines of the Declaration of Helsinki, and approved by the Institutional Review Board of CSK Himachal Pradesh Agricultural University, Palampur 176062, India.

Informed Consent Statement

Informed consent was obtained from all subjects involved in the study.

Data Availability Statement

The data presented in this study are available on request from the corresponding author.

Acknowledgments

Authors are thankful to CSK Himachal Pradesh Agricultural University, Palampur, India and Indian Council of Agricultural Research (ICAR), New Delhi for providing the technical and financial support. The financial and technical support provided by the World Bank funded project ‘Agricultural Technology Management Agency (ATMA)’ through Government of Himachal Pradesh, India is also highly acknowledged. The authors are grateful to the project staff, government agricultural extension officials of State Department of Agriculture, Government of Himachal Pradesh, India for their contributions to the study. The authors also thank the farmers for their participation in this ‘On-farm’ adaptive research and impact analysis feedback.

Conflicts of Interest

The authors declare no conflict of interest.

Abbreviations

Abbreviation UsedFull Form
a.i.Active ingredient
BLWBroadleaf weeds
BCRBenefit: cost ratio
CDBsCommunity-development-blocks
CCWMConventional chemical weed management
CCMWMConventional cultural and manual weed management
CWMChemical weed management
COCCost of cultivation
ClodClodinafop @ 60 g active ingredient (a.i.)/ha
Clod-fb-DClodinafop @ 60 g a.i./ha followed by 2,4-D (Na salt) @ 1.0 kg a.i./ha
DASdays after sowing
EWPEconomic water productivity
fbFollowed by
FLDsFrontline demonstrations
hahectare
HEIHerbicide efficiency index
ICWMImproved chemical weed management
INRIndian national rupee
IWPIrrigation water productivity
IsoIsoproturon 75 WP @ 1.0 kg a.i./ha
Iso + DIsoproturon 75 WP @ 1.0 kg a.i. kg/ha + 2,4-D (Na salt) @ 0.5 kg a.i./ha
KPotassium
NNitrogen
mMeter
m haMillion hectares
MEMonetary–efficiency
mtMillion tonnes
NIGNet income gains
NLWNarrow leaf weeds
NWHNorth-western Himalayas
OFEOn-farm experimentation
PPhosphorus
PEProduction–efficiency
Sulf + MetSulfosulfuron 75% WG @ 25 g a.i./ha + Metsulfuron 5% WG @ 2 g a.i./ha
SOCSoil organic carbon
tTonnes
TWDMTotal weed dry matter
UWCUn-weeded check
WFCWeed-free check
WCEWeed control efficiency
WCIWeed control index
WDWeed density
WDMWeed dry matter
WGWettable granules
WUEWater-use efficiency
WPWettable powder

References

  1. FAOSTAT. 2021. Available online: http://www.fao.org/faostat/en/#data/QC (accessed on 17 April 2021).
  2. Choudhary, A.K.; Suri, V.K. ‘On-farm’ participatory technology development on forage cutting and nitrogen management in dual-purpose wheat (Triticum aestivum) in NW Himalayas. Commun. Soil Sci. Plant. Anal. 2014, 45, 741–750. [Google Scholar] [CrossRef]
  3. Rana, K.S.; Choudhary, A.K.; Sepat, S.; Bana, R.S. Advances in Field Crop Production; Post Graduate School, Indian Agricultural Research Institute: New Delhi, India, 2014; p. 475. [Google Scholar]
  4. Choudhary, A.K.; Singh, A.; Yadav, D.S. ‘On farm testing’ of wheat cultivars for site-specific assessment under varied bio-physical regimes in mid-hill conditions of Mandi district of Himachal Pradesh. J. Community Mobil. Sust. Dev. 2010, 5, 1–6. [Google Scholar]
  5. Badiyala, D.; Shekher, J.; Sharma, S.K.; Singh, R.; Choudhary, A.K. Agronomic research in hills with special reference to Himachal Pradesh–An overview. Indian J. Agron. 2012, 57, 168–174. [Google Scholar]
  6. Angiras, N.N.; Kumar, S.; Rana, S.S.; Sharma, N. Standardization of dose and time of application of clodinafop-propargyl to manage weeds in wheat. Himachal J. Agric. Res. 2008, 34, 15–18. [Google Scholar]
  7. Chhokar, R.S.; Malik, R.K. Isoproturon resistant Phalaris minor and its response to alternate herbicides. Weed Tech. 2002, 16, 116–123. [Google Scholar] [CrossRef]
  8. Das, T.K.; Kaur, R.; Singh, R.; Shekhawat, K.; Choudhary, A.K. Weed Management; Division of Agronomy, ICAR-Indian Agricultural Research Institute: New Delhi, India, 2017; p. 44. [Google Scholar]
  9. Choudhary, A.K. Scaling-up of protected cultivation in Himachal Pradesh, India. Curr. Sci. 2016, 111, 272–277. [Google Scholar] [CrossRef]
  10. Choudhary, A.K.; Rahi, S. Organic cultivation of high yielding turmeric (Curcuma longa L.) cultivars: A viable alternative to enhance rhizome productivity, profitability, quality and resource-use efficiency in monkey-menace areas of north western Himalayas. Indus. Crops Prod. 2018, 124, 495–504. [Google Scholar] [CrossRef]
  11. CSKHPAU. Complete Package and Practices for Cultivation of Rabi Season Crops in Himachal Pradesh; Directorate of Extension Education, CSK Himachal Pradesh Agricultural University: Palampur, India, 2008; p. 96. [Google Scholar]
  12. Singh, R.K.; Verma, S.K.; Prasad, S.K.; Singh, S.B. Effect of metsulfuron-methyl against broadleaf weeds in wheat (Triticum aestivum). J. Crop. Weed 2015, 11, 161–166. [Google Scholar]
  13. Choudhary, A.K.; Thakur, S.K.; Suri, V.K. Technology transfer model on integrated nutrient management technology for sustainable crop production in high value cash crops and vegetables in north-western Himalayas. Commun. Soil Sci. Plant. Anal. 2013, 44, 1684–1699. [Google Scholar] [CrossRef]
  14. Choudhary, A.K.; Suri, V.K. Low-cost vermi-composting technology and its application in bio-conversion of obnoxious weed flora of north-western Himalayas into vermi-compost. Commun. Soil Sci. Plant. Anal. 2018, 49, 1429–1441. [Google Scholar] [CrossRef]
  15. Piper, C.S. Soil and Plant. Analysis; Scientific Publishers Inc.: New York, NY, USA, 1950. [Google Scholar]
  16. Jackson, M.L. Soil Chemical Analysis; Prentice Hall of India Ltd.: New Delhi, India, 1967; pp. 219–221. [Google Scholar]
  17. Walkley, A.; Black, C.A. An examination of the Dagtjareff (wet acid) method for determining soil organic matter and a proposed modification of the chromic acid titration method. Soil Sci. 1934, 37, 29–38. [Google Scholar] [CrossRef]
  18. Subbiah, B.V.; Asija, G.L. A rapid procedure for the determination of available-N in soils. Curr. Sci. 1956, 25, 259–260. [Google Scholar]
  19. Olsen, S.R.; Cole, C.V.; Watanabe, F.S.; Dean, L.A. Estimation of Available-P in Soils by Extraction with Sodium Bicarbonate; USDA Circular No. 939; U.S. Government Printing Office: Washington, DC, USA, 1954.
  20. Hanway, J.J.; Heidel, H. Soil Analysis Methods as Used in Iowa State College Soil Testing Laboratory, Bulletin 57; Iowa State College of Agriculture: Iowa, IA, USA, 1952; p. 131. [Google Scholar]
  21. Krishnamurthy, K.; Raju, B.G.; Raghunath, G.; Jagnath, M.K.; Prasad, T.V.R. Herbicide efficiency index in sorghum. Indian J. Weed Sci. 1975, 7, 75–79. [Google Scholar]
  22. Rana, K.S.; Choudhary, A.K.; Sepat, S.; Bana, R.S.; Dass, A. Methodological and Analytical Agronomy; Post Graduate School, Indian Agricultural Research Institute: New Delhi, India, 2014; p. 276. [Google Scholar]
  23. ISA. Indian Society of Agronomy–6th Revised Edition of Agronomic Terminology; Indian Society of Agronomy, IARI: New Delhi, India, 2014; pp. 463–465. [Google Scholar]
  24. Kumar, A.; Choudhary, A.K.; Suri., V.K. Influence of AM-fungi and applied phosphorus on growth indices, production efficiency, phosphorus-use efficiencyand fruit-succulence in okra (Abelmoschus esculentus)–pea (Pisum sativum) cropping system in an acid Alfisol. Indian J. Agric. Sci. 2015, 85, 1030–1037. [Google Scholar]
  25. Igbadun, H.E.; Mahoo, H.F.; Tarimo, A.K.P.R.; Salim, B.A. Crop water productivity of an irrigated maize crop in Mkoji sub-catchment of Great Ruaha river basin Tanzania. Agric. Water Manag. 2006, 85, 141–150. [Google Scholar] [CrossRef]
  26. Adeboye, O.B.; Schultz, B.; Adekalu, K.O.; Prasad, K. Crop water productivity and economic evaluation of drip-irrigated soybeans. Agric. Food Secur. 2015, 4. [Google Scholar] [CrossRef] [Green Version]
  27. Gomez, K.A.; Gomez, A.A. Statistical Procedures for Agricultural Research, 2nd ed.; Wiley-Inter-Science Publication; John Wiley & Sons: New York, NY, USA, 1984. [Google Scholar]
  28. Om, H.; Kumar, S.; Dhiman, S.D. Biology and management of Phalaris minor in rice-wheat system. Crop. Prot. 2004, 23, 1157–1168. [Google Scholar] [CrossRef]
  29. Kumar, S.; Angiras, N.N.; Rana, S.S.; Sharma, N. Alternative methods of Isoproturon application in wheat. Himachal J. Agric. Res. 2009, 35, 31–33. [Google Scholar]
  30. Kaur, T.; Bhullar, M.S.; Walia, U.S. Bio-efficacy of ready-mix formulation of clodinafop-propargyl + metsulfuron for control of mixed weed flora in wheat. Indian J. Weed Sci. 2015, 7, 121–124. [Google Scholar]
  31. Meena, V.; Kaushik, M.K.; Dotaniya, M.L.; Meena, B.P.; Das, H. Bio-efficacy of readi-mix herbicides on weeds and productivity in late-sown wheat. Indian J. Weed Sci. 2019, 51, 344–351. [Google Scholar] [CrossRef]
  32. Chhokar, R.S.; Sharma, R.K.; Pundhi, A.K.; Singh, R.K. Evaluation of herbicides for control of Rumex dentatus, Convolvulus arvensis and Malva Parviflora. Indian J. Weed Sci. 2007, 39, 214–218. [Google Scholar]
  33. Kumar, M.; Kishore, R.; Kumar, S.; Bisht, S. Efficacy of different post-emergence herbicides application alone and in combination in wheat. J. Pharmacog. Phytochem. 2018, SP1, 1668–1670. [Google Scholar]
  34. Chand, L.; Puniya, R. Bio-efficacy of alone and mixture of herbicides against complex weed flora in wheat under sub-tropical conditions. Indian J. Agric. Sci. 2017, 87, 1149–1154. [Google Scholar]
  35. Barla, S.; Upasani, R.R.; Puran, A.N. Herbicide combinations for control of complex weed flora in wheat. Indian J. Weed Sci. 2017, 49, 36–40. [Google Scholar] [CrossRef]
  36. Dass, A.; Shekhawat, K.; Choudhary, A.K.; Sepat, S.; Rathore, S.S.; Mahajan, G.; Chauhan, B.S. Weed management in rice using crop-competition–A review. Crop. Prot. 2016, 95, 45–52. [Google Scholar] [CrossRef]
  37. Rajpoot, S.K.; Rana, D.S.; Choudhary, A.K. Influence of diverse crop management practices on weed suppression, crop and water productivity and nutrient dynamics in Bt-cotton based intercropping systems in a semi-arid Indo-Gangetic plains region. Indian J. Agric. Sci. 2016, 86, 1637–1641. [Google Scholar]
  38. Rajpoot, S.K.; Rana, D.S.; Choudhary, A.K. Bt-cotton–vegetable-based intercropping systems as influenced by crop establishment method and planting geometry of Bt-cotton in Indo-Gangetic plains region. Curr. Sci. 2018, 115, 516–522. [Google Scholar] [CrossRef]
  39. Rasmussen, I.A. Effect of sowing date, stale seedbed, row width and mechanical weed control on weeds and yields of organic winter wheat. Weed Res. 2004, 44, 12–20. [Google Scholar] [CrossRef]
  40. Chaudhari, D.D.; Patel, V.J.; Patel, H.K.; Mishra, A.; Patel, B.D.; Patel, R.B. Assessment of pre-mix broad spectrum herbicides for weed management in wheat. Indian J. Weed Sci. 2017, 49, 33–35. [Google Scholar] [CrossRef]
  41. Mansoor, M.; Ahmad, H.K.; Khan, H.; Yaqoob, M. Development of economical weed management strategies for mungbean. Pak. J. Weed Sci. Res. 2004, 10, 151–156. [Google Scholar]
  42. Lemerle, D.; Verbeek, B.; Cousens, R.D.; Coombes, N.E. The potential for selecting wheat varieties strongly competitive against weeds. Weed Res. 1996, 36, 505–513. [Google Scholar] [CrossRef]
  43. Harish, M.N.; Choudhary, A.K.; Dass, A.; Singh, V.K.; Pooniya, V.; Varatharajan, T. Tillage and phosphorus management in maize (Zea mays L.) under maize–wheat cropping system. Indian J. Agric. Sci. 2021, 91, 117–122. [Google Scholar]
  44. Tendler, J. Tales of dissemination in small-farm agriculture: Lessons for institution builders. World Dev. 1993, 21, 1567–1582. [Google Scholar] [CrossRef]
  45. Moneva, L.A.; Cadao, J.B.; Jackson., J. Farmer based extension in the Philippines: The world neighbours-Mag-uugmad foundation experience. In Working with Farmers: The Key to the Adoption of Forage Technologies, ACIAR Proceedings No. 95; Hacker, B., Ed.; Australian Centre for International Agricultural Research (ACIAR): Canberra, Australia, 2003; pp. 91–93. [Google Scholar]
  46. Choudhary, A.K.; Suri, V.K. System of rice intensification in short duration rice hybrids under varying bio-physical regimes: New opportunities to enhance rice productivity and rural livelihoods in north-western Himalayas under a participatory-mode technology transfer program. J. Plant. Nutr. 2018, 41, 2581–2605. [Google Scholar] [CrossRef]
  47. Biggs, S.D. A multiple source of innovation model of agricultural research and technology promotion. World Dev. 1990, 18, 1481–1499. [Google Scholar] [CrossRef] [Green Version]
  48. Biggs, S.D.; Smith, G. Beyond methodologies: Coalition-building for participatory technology development. World Dev. 1998, 26, 239–248. [Google Scholar] [CrossRef]
  49. Cramb, R.A. Processes affecting the successful adoption of new technologies by smallholders. In Working with Farmers: The Key to the Adoption of Forage Technologies, ACIAR Proceedings No. 95; Hacker, B., Ed.; Australian Centre for International Agricultural Research (ACIAR): Canberra, Australia, 2003; pp. 11–22. [Google Scholar]
Figure 1. Location of the study area of the Mandi district in Himachal Pradesh, India.
Sustainability 13 05425 g001
Figure 2. Map of Himachal Pradesh province of India showing (a) major/moderate wheat producing areas, and (b) wheat suitability areas. (Graphics Source: GIS Centre, CSKHPKV, Palampur, India).
Sustainability 13 05425 g002
Figure 3. Influence of different weed management treatments on weed count of major NLWs at 120 DAS in wheat (Rabi 2008–2009 & 2009–2010). The vertical bars indicate standard errors.
Sustainability 13 05425 g003
Figure 4. Influence of different weed management treatments on weed count of major BLWs at 120 DAS in wheat (Rabi 2008–2009 and2 009–2010). The vertical bars indicate standard errors.
Sustainability 13 05425 g004
Figure 5. Influence of different weed management treatments on total weed dry matter (kg/ha) at wheat harvest (Rabi 2008–2009 and 2009–2010). The vertical bars indicate standard errors.
Sustainability 13 05425 g005
Figure 6. Influence of different weed management treatments on weed control efficiency (%) at 120 DAS in wheat (Rabi 2008–2009 and 2009–2010). The vertical bars indicate standard errors.
Sustainability 13 05425 g006
Figure 7. Influence of different weed management treatments on weed control index (%) at 120 DAS in wheat (Rabi 2008–2009 and 2009–2010). The vertical bars indicate standard errors.
Sustainability 13 05425 g007
Figure 8. Influence of different weed management treatments on weed index at 120 DAS in wheat (Rabi 2008–2009 and 2009–2010).
Sustainability 13 05425 g008
Figure 9. Influence of different weed management treatments on herbicide-efficiency index at 120 DAS in wheat (Rabi 2008–2009 and 2009–2010). The vertical bars indicate standard errors.
Sustainability 13 05425 g009
Figure 10. Influence of different weed management treatments on weed nutrient (NPK) concentrations (%) at wheat harvest (2-year av.). The vertical bars indicate standard errors.
Sustainability 13 05425 g010
Figure 11. Influence of different weed management treatments on nutrient (NPK) depletion by weeds at wheat harvest (2-year av.). The vertical bars indicate standard errors.
Sustainability 13 05425 g011
Table 1. Physico-chemical properties of experimental soils at initiation of ‘on-farm’ field experimentation in wet-temperate NW Himalayas.
S.No.ParameterStatus/ValueMethods Employed
1.Textural classSilty-clay loamInternational pipette method [15]
2.Soil reaction (pH)6.6–6.91:2.5 soil: water suspension [16]
3.Organic carbon (g kg−1)7.3–9.5Rapid titration method [17]
4.Available-N (kg ha−1)283.5–322.8Alkaline permanganate method [18]
5.Available-P (kg ha−1)16.8–22.30.5 M NaHCO3, pH = 8.5 [19]
6.Available-K (kg ha−1)261.5–278.7Ammonium acetate [20]
Table 2. Effect of different weed management treatments on weed count and weed dry matter production in wheat in NW Himalayas.
TreatmentsWeed Count at 120 DAS (Number per m2) Total Weed Dry Matter at 120 DAS
(g m−2)
Rabi 2008–2009Rabi 2009–2010
NLWsBLWsTotal NLWsBLWsTotal 2008–20092008–2009
Clod4.0 b (15.2)5.1 b (26.0)6.5 b (41.2)3.8 b (14.3)5.5 b (29.7)6.7 b (44.0)8.3 b (68.5)8.5 b (71.2)
Clod-fb-D3.5 c (11.8)1.5 d (1.8)3.8 d (13.6)3.3 c (10.3)1.3 d (1.2)3.5 d (11.5)6.6 c (42.8)6.4 c (40.3)
Iso4.0 b (15.3)4.1 c (16.0)5.6 c (31.3)3.8 b (14.1)4.6 c (20.3)5.9 c (34.4)8.1 b (65.8)8.3 b (68.8)
Iso + D3.8 b (13.9)1.4 d (1.6)4.0 d (15.5)3.6 bc (12.7)1.3 d (1.1)3.8 d (13.8)6.1 c (36.6)5.9 c (34.8)
Sulf + Met3.5 c (11.5)1.3 d (1.1)3.5 d (12.0)3.2 c (10.0)1.1 d (0.8)3.4 d (10.8)5.9 c (34.8)5.7 c (31.9)
WFC0.7 d (0.0)0.7 e (0.0)0.7 e (0.0)0.7 d (0.0)0.7 e (0.0)0.7 e (0.0)0.7 d (0.0)0.7 d (0.0)
UWC6.2 a (37.4)6.3 a (38.6)8.7 a (76.0)6.7 a (44.3)7.1 a (49.7)9.7 a (94.0)13.0 a (168.6)13.6 a (185.2)
Note: 1. Different alphabets in superscript represent the statistical differences among the treatment means w.r.t. weed count and total weed dry matter. 2. Values of weed count and total weed dry matter are transformed to square root (√x + 0.5), while those in parentheses are the original values; 3. (Treatments: Clod = Clodinofop @ 60 g a.i./ha; Clod-fb-D = Clodinofop @ 60 g a.i./ha followed by (fb) 2,4-D (Na salt) @ 1.0 kg a.i./ha; Iso = Isoproturon 75 WP @ 1.0 kg a.i./ha; Iso + D = Isoproturon 75 WP @ 1.0 kg a.i. kg/ha + 2,4-D (Na salt) @ 0.5 kg a.i./ha; Sulf + Met = Sulfosulfuron 75% WG @ 25 g a.i./ha + Metsulfuron 5% WG @ 2 g a.i./ha; WFC= Weed-free check; UWC = Un-weeded check).
Table 3. Effect of different weed management treatments on growth and yield attributes of wheat in NW Himalayas.
Treatments Plant Height (cm)Number of Spikes m−2Spike Length (cm)Number of Grains per Spike1000-Grain Weight (g)
2008–20092009–20102008–20092009–20102008–20092009–20102008–20092009–20102008–20092009–2010
Clod93.2 b94.2 b281.2 b284.0 b8.72 ns8.77 ns31.0 d31.1 c39.0 ns39.1 ns
Clod-fb-D95.8 a96.4 a291.6 a291.4 b8.81 ns8.83 ns33.4 bc33.6 ab40.6 ns40.7 ns
Iso94.1 a94.9 a287.7 a289.1 a8.82 ns8.85 ns32.1 cd32.6 bc39.6 ns39.7 ns
Iso + D95.9 a96.8 a293.1 a293.4 a9.13 ns9.09 ns33.7 abc34.1 ab40.7 ns40.8 ns
Sulf + Met96.1 a97.1 a296.7 a297.7 a9.18 ns9.19 ns34.9 ab35.0 a41.1 ns41.1 ns
WFC96.1 a97.2 a299.3 a301.2 a9.25 ns9.28 ns35.6 a35.6 a42.1 ns42.1 ns
UWC87.3 c89.8 c229.3 c232.1 c7.14 ns7.25 ns21.2 e21.4 d36.9 ns37.1 ns
Note: 1. The different alphabets in superscript represent the statistical differences among the treatment means w.r.t. different parameters while ns represent non-significant differences. 2. (Treatments: Clod = Clodinofop @ 60 g a.i./ha; Clod-fb-D = Clodinofop @ 60 g a.i./ha followed by (fb) 2,4-D (Na-salt) @ 1.0 kg a.i./ha; Iso = Isoproturon 75 WP @ 1.0 kg a.i./ha; Iso + D = Isoproturon 75 WP @ 1.0 kg a.i. kg/ha + 2,4-D (Na-salt) @ 0.5 kg a.i./ha; Sulf + Met = Sulfosulfuron 75% WG @ 25 g a.i./ha + Metsulfuron 5% WG @ 2 g a.i./ha; WFC= Weed-free check; UWC = Un-weeded check).
Table 4. Effect of different weed management treatments on crop productivity, protein content and protein yield of wheat in NW Himalayas.
TreatmentsGrain Yield
(t ha−1)
Straw Yield
(t ha−1)
Biological Yield (t ha−1)Harvest Index (%)Protein Content (%)Protein Yield
(kg ha−1)
2008–20092009–20102008–20092009–20102008–20092009–20102008–20092009–20102008–20092009–20102008–20092009–2010
Clod3.06 d3.13 e4.75 d4.78 e7.81 d7.91 d39.2 ns39.5 ns11.18 ns11.33 ns342.1 f354.6 f
Clod-fb-D3.32 c3.47 c5.10 c5.27 c8.42 c8.74 b39.4 ns39.7 ns11.65 ns11.72 ns386.8 d406.7 d
Iso3.13 d3.29 d4.85 d5.02 d7.97 d8.31 c39.2 ns39.6 ns11.43 ns11.52 ns357.8 e379.0 e
Iso + D3.47 b3.58 bc5.31 b5.39 bc8.77 b8.98 ab39.5 ns39.9 ns11.71 ns11.85 ns406.3 c424.2 c
Sulf + Met3.51 ab3.62 ab5.35 ab5.41 b8.86 ab9.03 ab39.6 ns40.1 ns12.18 ns12.30 ns427.5 b445.3 b
WFC3.60 a3.74 a5.47 a5.56 a9.06 a9.31 a39.7 ns40.2 ns12.35 ns12.58 ns444.6 a470.5 a
UWC1.83 e1.80 f3.11 e3.06 f4.94 e4.86 e37.0 ns36.9 ns11.00 ns11.03 ns201.3 g198.5 g
Note: 1. The different alphabets in superscript represent the statistical differences among the treatment means w.r.t. different parameters while ns represent non-significant differences. 2. (Treatments: Clod = Clodinofop @ 60 g a.i./ha; Clod-fb-D = Clodinofop @ 60 g a.i./ha followed by (fb) 2,4-D (Na-salt) @ 1.0 kg a.i./ha; Iso = Isoproturon 75 WP @ 1.0 kg a.i./ha; Iso + D = Isoproturon 75 WP @ 1.0 kg a.i. kg/ha + 2,4-D (Na-salt) @ 0.5 kg a.i./ha; Sulf + Met = Sulfosulfuron 75% WG @ 25 g a.i./ha + Metsulfuron 5% WG @ 2 g a.i./ha; WFC = Weed-free check; UWC = Un-weeded check).
Table 5. Effect of different weed management treatments on cost of cultivation, gross and net returns and benefit: cost ratio of wheat in NW Himalayas.
Treatments Cost of Cultivation
(INR ha−1)
Gross Returns
(INR ha−1)
Net Returns
(INR ha−1)
B: C Ratio
2008–20092009–20102008–20092009–20102008–20092009–20102008–20092009–2010
Clod14,07114,07137,004 d37,692 e22,933 c23,621 d2.63 bc2.68 bc
Clod-fb-D14,81114,81140,086 c41,773 c25,275 b26,962 bc2.71 b2.82 abc
Iso13,84613,84637,819 d39,670 d23,973 c25,824 c2.73 b2.87 ab
Iso + D14,09614,09641,799 b43,033 b27,703 a28,937 a2.97 a3.05 a
Sulf + Met14,29614,29642,304 ab43,425 b28,008 a29,129 a2.96 a3.04 a
WFC17,20617,20643,289 a44,820 a2,6083 b27,614 b2.52 c2.60 c
UWC13,00613,00622,659 e22,308 f9653 d9302 e1.74 d1.72 d
Note: 1. The different alphabets in superscript represent the statistical differences among the treatment means w.r.t. different parameters. 2. (Treatments: Clod= Clodinofop @ 60 g a.i./ha; Clod-fb-D = Clodinofop @ 60 g a.i./ha followed by (fb) 2,4-D (Na salt) @ 1.0 kg a.i./ha; Iso = Isoproturon 75 WP @ 1.0 kg a.i./ha; Iso + D = Isoproturon 75 WP @ 1.0 kg a.i. kg/ha + 2,4-D (Na salt) @ 0.5 kg a.i./ha; Sulf + Met = Sulfosulfuron 75% WG @ 25 g a.i./ha + Metsulfuron 5% WG @ 2 g a.i./ha; WFC = Weed-free check; UWC = Un-weeded check).
Table 6. Effectof different weed management treatments on water productivity, production efficiency and monetary efficiency of wheat in NW Himalayas.
Treatments Total Water Productivity (TWP)
(kg ha−1 mm−1)
Irrigation Water Productivity (IWP)
(kg ha−1 mm−1)
Economic Water Productivity (EWP)
(INR ha−1 mm−1)
Production Efficiency (PE)
(kg ha−1 day−1)
Monetary Efficiency (ME)
(INR ha−1 day−1)
2008–20092009–20102008–20092009–20102008–20092009–20102008–20092009–20102008–20092009–2010
Clod7.36 c7.28 d10.19 b10.42 c89.08 c87.74 d16.52 d16.81 d200.0 c202.6 c
Clod-fb-D7.99 b8.08 b11.07 ab11.57 ab96.50 b97.24 bc17.95 bc18.66 bc216.7 b224.6 b
Iso7.52 c7.66 c10.42 b10.97 bc91.04 c92.34 cd16.89 cd17.70 cd204.4 c213.3 c
Iso + D8.34 ab8.34 b11.55 a11.94 ab100.62 ab100.17 ab18.73 ab19.26 ab225.9 ab231.4 ab
Sulf + Met8.45 a8.43 ab11.71 a12.08 a101.84 a101.08 ab18.98 ab19.48 ab228.7 a233.5 ab
WFC8.65 a8.72 a11.98 a12.48 a104.21 a104.33 a19.43 a20.13 a234.0 a241.0 a
UWC4.40 d4.19 e6.09 c10.42 c54.55 d51.93 e9.88 e9.67 e122.5 d119.9 d
Note: 1. The different alphabets in superscript represent the statistical differences among the treatment means w.r.t. different parameters. 2. [Treatments: Clod = Clodinofop @ 60 g a.i./ha; Clod-fb-D = Clodinofop @ 60 g a.i./ha followed by (fb) 2,4-D (Na salt) @ 1.0 kg a.i./ha; Iso = Isoproturon 75 WP @ 1.0 kg a.i./ha; Iso + D = Isoproturon 75 WP @ 1.0 kg a.i. kg/ha + 2,4-D (Na salt) @ 0.5 kg a.i./ha; Sulf + Met = Sulfosulfuron 75% WG @ 25 g a.i./ha + Metsulfuron 5% WG @ 2 g a.i./ha; WFC = Weed-free check; UWC= Un-weeded check].
Table 7. Assessment of knowledge upgradation (av. values) and technology adoption (%) among trainee farmers (n = 102) in NW Himalayas, India (study area).
Technology ComponentPre-Training (%)Post-Training
(%)
Technology Adoption Rate after One Year of ‘on-farm’ Experimentation(%) (n =102) *
A. Chemical weed management practices
Knowledge about various chemical herbicides (controlling narrow leaf, broad-leaf weed and both) and their application469896
Knowledge about various chemical herbicides (pre-emergence and post-emergence) and their application3910098
Methodology, dose and time of application of herbicides489997
Use of appropriate herbicide sprayers4310088
Volume of water to be used for herbicide spray419793
Knowledge about micro-herbicides and their application298177
Knowledge about herbicide resistance and agronomic measures to reduce it77871
Precautions in use of herbicides379592
Maintenance of herbicide sprayers399890
Reduction in drudgery using herbicides2591
Crop yield enhancement through chemical weed management3893
Economic benefits of chemical weed management3595
Integrated weed management418386
B. Conventional cultural and manual weed management practices
Knowledge about weed flora of wheat (narrow leaf, broad-leaf and sedges) and their manual management6210082
Knowledge about agronomic weed management operations (tillage and earthing-up)819795
Knowledge about sowing time and hand-weeding in wheat8010094
Knowledge about appropriate stages of hand-weeding in wheat4810093
Crop residue/leaf mulching and its benefits in weed management689588
Knowledge about crop rotations and inter-cropping systems239188
Summer ploughing and crop residue retention2810072
Knowledge about cleaning of seed and machinery before use3210088
Note: * Technology adoption rate of 102 trained farmers after one year of ‘on-farm’ experimentation i.e., 2011.
Table 8. Net income gains (NIG) by the adoption of improved chemical weed management practices in NW Himalayas (study area) [3-year av. Rabi 2011–2012 to 2013–2014].
Weed Management OptionsNumber of Farmers *Net Returns (INR ha−1) Percent Increase in NIG over CMWMPercent Increase in NIG over CCWM
RangeAverage
Conventional cultural and manual weed management (CCMWM)n = 3018,667–21,58020,764-
Conventional chemical weed management (CCWM)n = 10221,530–27,96227,41124.2%-
Improved chemical weed management (ICWM) (Sulfosulfuron + Metsulfuron)n = 10222,365–29,52228,19826.4%2.8%
* Note: n is the number of farmers practicing CCMWM (n = 30), CCWM (n = 102) and ICWM (n = 102).
Publisher’s Note: MDPI stays neutral with regard to jurisdictional claims in published maps and institutional affiliations.

