Article

Urban Structure in Troubled Times: The Evolution of Principal and Secondary Core/Periphery Gaps through the Prism of Residential Land Values

1
Technion-Israel Institute of Technology, Haifa 3200003, Israel
2
Ruppin Academic Center, Emek Hefer 4025000, Israel
*
Author to whom correspondence should be addressed.
Sustainability 2021, 13(10), 5722; https://0-doi-org.brum.beds.ac.uk/10.3390/su13105722
Submission received: 22 April 2021 / Revised: 9 May 2021 / Accepted: 18 May 2021 / Published: 20 May 2021

Abstract

:
The structure of modern cities is characterized by the uneven spatial distribution of people and activities. Contrary to economic theory, it is neither evenly distributed nor entirely monocentric. The observed reality is the result of various feedbacks in the context of the interactions of attraction and repulsion. Heretofore, there is no agreement concerning the means to measuring the dimensions of these interactions, nor the framework for explaining them. We propose a simple model and an associated method for testing the interactions using residential land values. We claim that land values reflect the attractiveness of each location, including its observable and unobservable characteristics. We extract land values from prices of residences by applying a dedicated hedonic model to extensive residential real estate transaction data at a detailed spatial level. The resulting land values reflect the attractiveness of each urban location and are an ideal candidate to measure the degree of centrality or peripherality of each location. Moreover, assessment of land values over time indicates ongoing centralization and peripheralization processes. Using the urban structure of a small and highly urbanized country as a test case, this paper illustrates how the dynamics of the gap between central and peripheral urban areas can be assessed.

1. Introduction

The structure of modern cities is characterized by the uneven spatial distribution of people and activities. Traditional economic theory suggests that either agglomeration forces and economies of scale will create a core region that dominates urban geography or that equilibrating forces will eliminate polarization. In fact, contrary to economic theory, the spatial distribution of people and activities is neither evenly distributed nor entirely monocentric. This is the well-known Lucas paradox applied to an urban context [1]. We have proposed an endogenous growth model that does not presume equilibrium and that generates various grades of polarity [2,3,4,5]. Accordingly, the observed reality is the result of various feedbacks in the context of the interactions of attraction and repulsion forces.
The urban core/periphery literature is rich with multi-layered definitions of peripherality. In addition to the strictly geographical definition, peripheries reflect the spatial realizations of social disparities [6]. Spatially uneven development may be the trigger to economic and social polarization processes [7] that further increase the gap between core and periphery. But there are other dimensions and perspectives on peripherality that make it difficult to explain the phenomenon by means of a simple definition and agreed upon method. There are various typologies of peripheries in urban areas. They display various spatial, functional, and subjective characteristics [8]. At the same time, there are various socio-economic or relational perspectives to the study of peripherality [9]. A promising approach to the assessment of the urban core and periphery is the view of spatial inequalities as the result of the competition among locations in efforts to attract investments [10]. Specifically, uneven spatial development can be linked to real-estate investments that cause unequal provision of urban services, amenities, and residential qualities [11]. Consequently, certain locations become more attractive while others decline. This concept is the bridge that allows the use of the residential land value as a measure of the degree of centrality or peripherality of a certain location.
Agglomeration economies are among the most basic processes responsible for the existence of cities [12]. The appeal of a certain place to people and to firms searching for a location depends to a large extent, on the type and intensity of the activities already existing there. Land values reflect this appeal, and, therefore, they are expected to be higher in places in which certain activities are concentrated [such as urban areas] as opposed to places in which the same activities are sparse [such as rural areas]. Places with high land values generate in turn a positive feedback mechanism through local specialization. Activities that benefit from mutual proximity are willing to pay a higher location rent. These compete with activities that have less to gain from spatial agglomeration. In addition, the increasing spatial specialization leads to a concentration of services and transportation infrastructure that in turn causes greater differentiation in land values between “agglomeration spots” and other places. Therefore, land values reflect the quality of the environment at particular locations [13,14]. In residential areas, land values reflect the extent to which a location supplies an answer to the demand for preferred housing characteristics, including local amenities, accessibility of the area, job opportunities located nearby, etc.
Since the seminal contribution of Rosen [15], the hedonic price method was used extensively to place a value on specific aspects of residential locations. For example, distance from desirable amenities such as sea coasts, parks and open spaces in general [16,17,18,19,20,21], distance from the CBD [16,22,23,24,25], or accessibility to labor markets [26]. Additional examples are distance to transportation infrastructures such as highways and train stations as a means for improving accessibility to employment centers, shopping centers, educational and leisure institutions [27,28], and other neighborhood characteristics as local air quality [29], or education levels [30,31]. In contrast to these individual characteristics, assessments by means of land values express, in a single figure, through the willingness to pay of dwellers for living in that specific location a comprehensive measure of the qualities of a location, including all its observed and unobserved characteristics. In addition to those previously mentioned, examples of observable characteristics are topographical and geographical features or zoning restrictions, while examples of unobservable characteristics are the locational preferences of different social groups. Therefore, information on the variation of land values in space is important in order to assess the overall locational qualities of different geographical places.
Surprisingly, there is little information about land values. Most of the available property transactions are real estate sales, not vacant land. Although there are analyses of land values based on vacant land [32,33], these are scarce. On one hand, data on land transactions are less easily available than on real estate transactions [34]. On the other, since urban areas and most places are, in general, already developed, when this type of data is available, it refers to less valuable locations. The main problem with land value in urban and highly demanded areas is that it cannot be directly assessed even if data about real estate transactions is available. Obviously, land value is an important component in the housing price, but in order to evaluate it, indirect methods are necessary. A residence can be conceptualized as a composite commodity, comprising two main components: The plot of land on which it is located and its physical structure [35,36]. The concept of physical structure includes any housing characteristic that can be reproduced in any other place, as, for example, the footage, the number of rooms, the existing facilities, the building quality, etc. The challenge is, given data about real estate transactions and housing characteristics, how to assess the subjacent land value.
This research suggests that residential land values are a reliable measure for the analysis of detailed locational appeal in urban areas and, in particular, the gap between urban cores and more peripheral urban zones. In addition, splitting the available data into different periods, the analysis of the dynamics between the center and the periphery is possible. The remainder of the paper is organized as follows: Section 2 presents a description of the methods and the test case. The empirical results are presented in Section 3, and Section 4 summarizes the findings and discusses the conclusions.

2. Materials and Methods

2.1. Residential Land Value Calculation

Land valuation is part of the daily tasks of real estate appraisals [37,38]. However, the appraisers’ task is performed in the context of a specific property, with full data about its physical characteristics, its location, and auxiliary data about the local real estate market. This traditional approach of assessing the land value of specific real estate property is based on the difference between the market price of the property and its construction cost [25]. Therefore, this method is useful for specific real estate properties, when both the market price of the entire structure [which can be a single house or an apartment building] and its construction cost are accurately known. However, it cannot be used for large-scale regional assessment. This is because sometimes only the market price of part of the structure is available [for example, a single apartment within a building]. Even if market prices are available, construction costs are difficult to calculate given the great variation of built structure types, even in small geographical areas, as detached and semi-detached houses, row houses, and different types of low- and high-rise buildings. It turns out that an accurate measurement of land value at a small regional scale based on real estate transactions is possible, but only under very particular conditions and data availability.
The calculation method is based on de Groot et al. [13]. The method assumes the availability of a dataset of M real estate transactions of residences [houses or apartments] for a certain period and a certain [small] geographical area. The dataset includes information about the property price P j [where 1 j M ], the lot size in which the residence is built, S i and N housing characteristics x j i [where 1 i N ]. Among the housing characteristics, the basic data generally included is the dwelling size of the house, the number of rooms, the construction date or house age, and probably additional details. In that case, the following semi-log regression model can be estimated:
ln ( P ) = a + b 0 · ln ( S ) + b 1 · x 1 + + b N · x N + ε
Following Equation (1) and solving the regression model, the rate of change of the natural logarithm of the property price when the natural logarithm of the lot size varies infinitesimally is given by the following derivative:
ln ( P ) ln ( S ) = ( 1 / P ) · P ( 1 / S ) · S = S P · P S
But, on the other hand, following Equation (1):
ln ( P ) ln ( S ) = b 0
Therefore, from Equations (2) and (3):
L S = b 0 · P S
Since L / S represents the marginal value of an additional square meter of lot size on the overall property price, the term ( b 0 · P ) / S represents the value of a square meter of land in that specific period, for a small geographic area [for proper identification, it is important to allow the b 0 ’s to vary over small geographical units.]. Therefore, in this case, the residential land value [RLV] is
R L V = b 0 · P S
The RLV calculated by the method is the price that an average and hypothetical dweller is willing to pay in that area and that period for an additional square meter of built space, in the margin.
The geographical aggregation is performed at two levels: the detailed cadaster block boundaries, and the much coarse municipal boundary level. Once the aggregation is performed, individual regressions are performed for each unit [block or city]. Only the units in which the b 0 regressor is positive and significant are considered in the analysis.

2.2. Data Description

The transactions dataset includes all real estate transactions performed in Israel during the period 1998–2017, as recorded by the Israeli Tax Authority. Each transaction includes the property price [in New Israeli Shekel], the dwelling size, number of rooms, the property age, and a few additional details such as the floor number [if the property was not a detached house], etc. In addition, each transaction can be localized by its cadaster system characteristics, which are its block number [generally smaller than a statistical area] and its parcel number. These features allowed us to georeference the transactions and to perform areal aggregations of the observations at two different levels of detail: The urban block, which is the most detailed level, and the municipal area, which includes all the urban blocks belonging to the same city and is, obviously much larger and coarser. Both urban blocks and municipal areas are represented by their centroids and georeferenced in a map. The main explanatory variable is the distance to Tel–Aviv, calculated as the Euclidean distance to the point that represents the Tel–Aviv municipality.
The original real–estate transactions dataset included 1,458,329 records. After the cleanup of outliers, records with missing data, and records that could not be georeferenced due to incorrect block numbers, the dataset was reduced to 996,576 transactions. We calculated the actual 2017 values of all the transactions, according to changes in the consumer price index, bringing them to a common ground. Table 1 includes the descriptive statistics of the final dataset.

3. Results

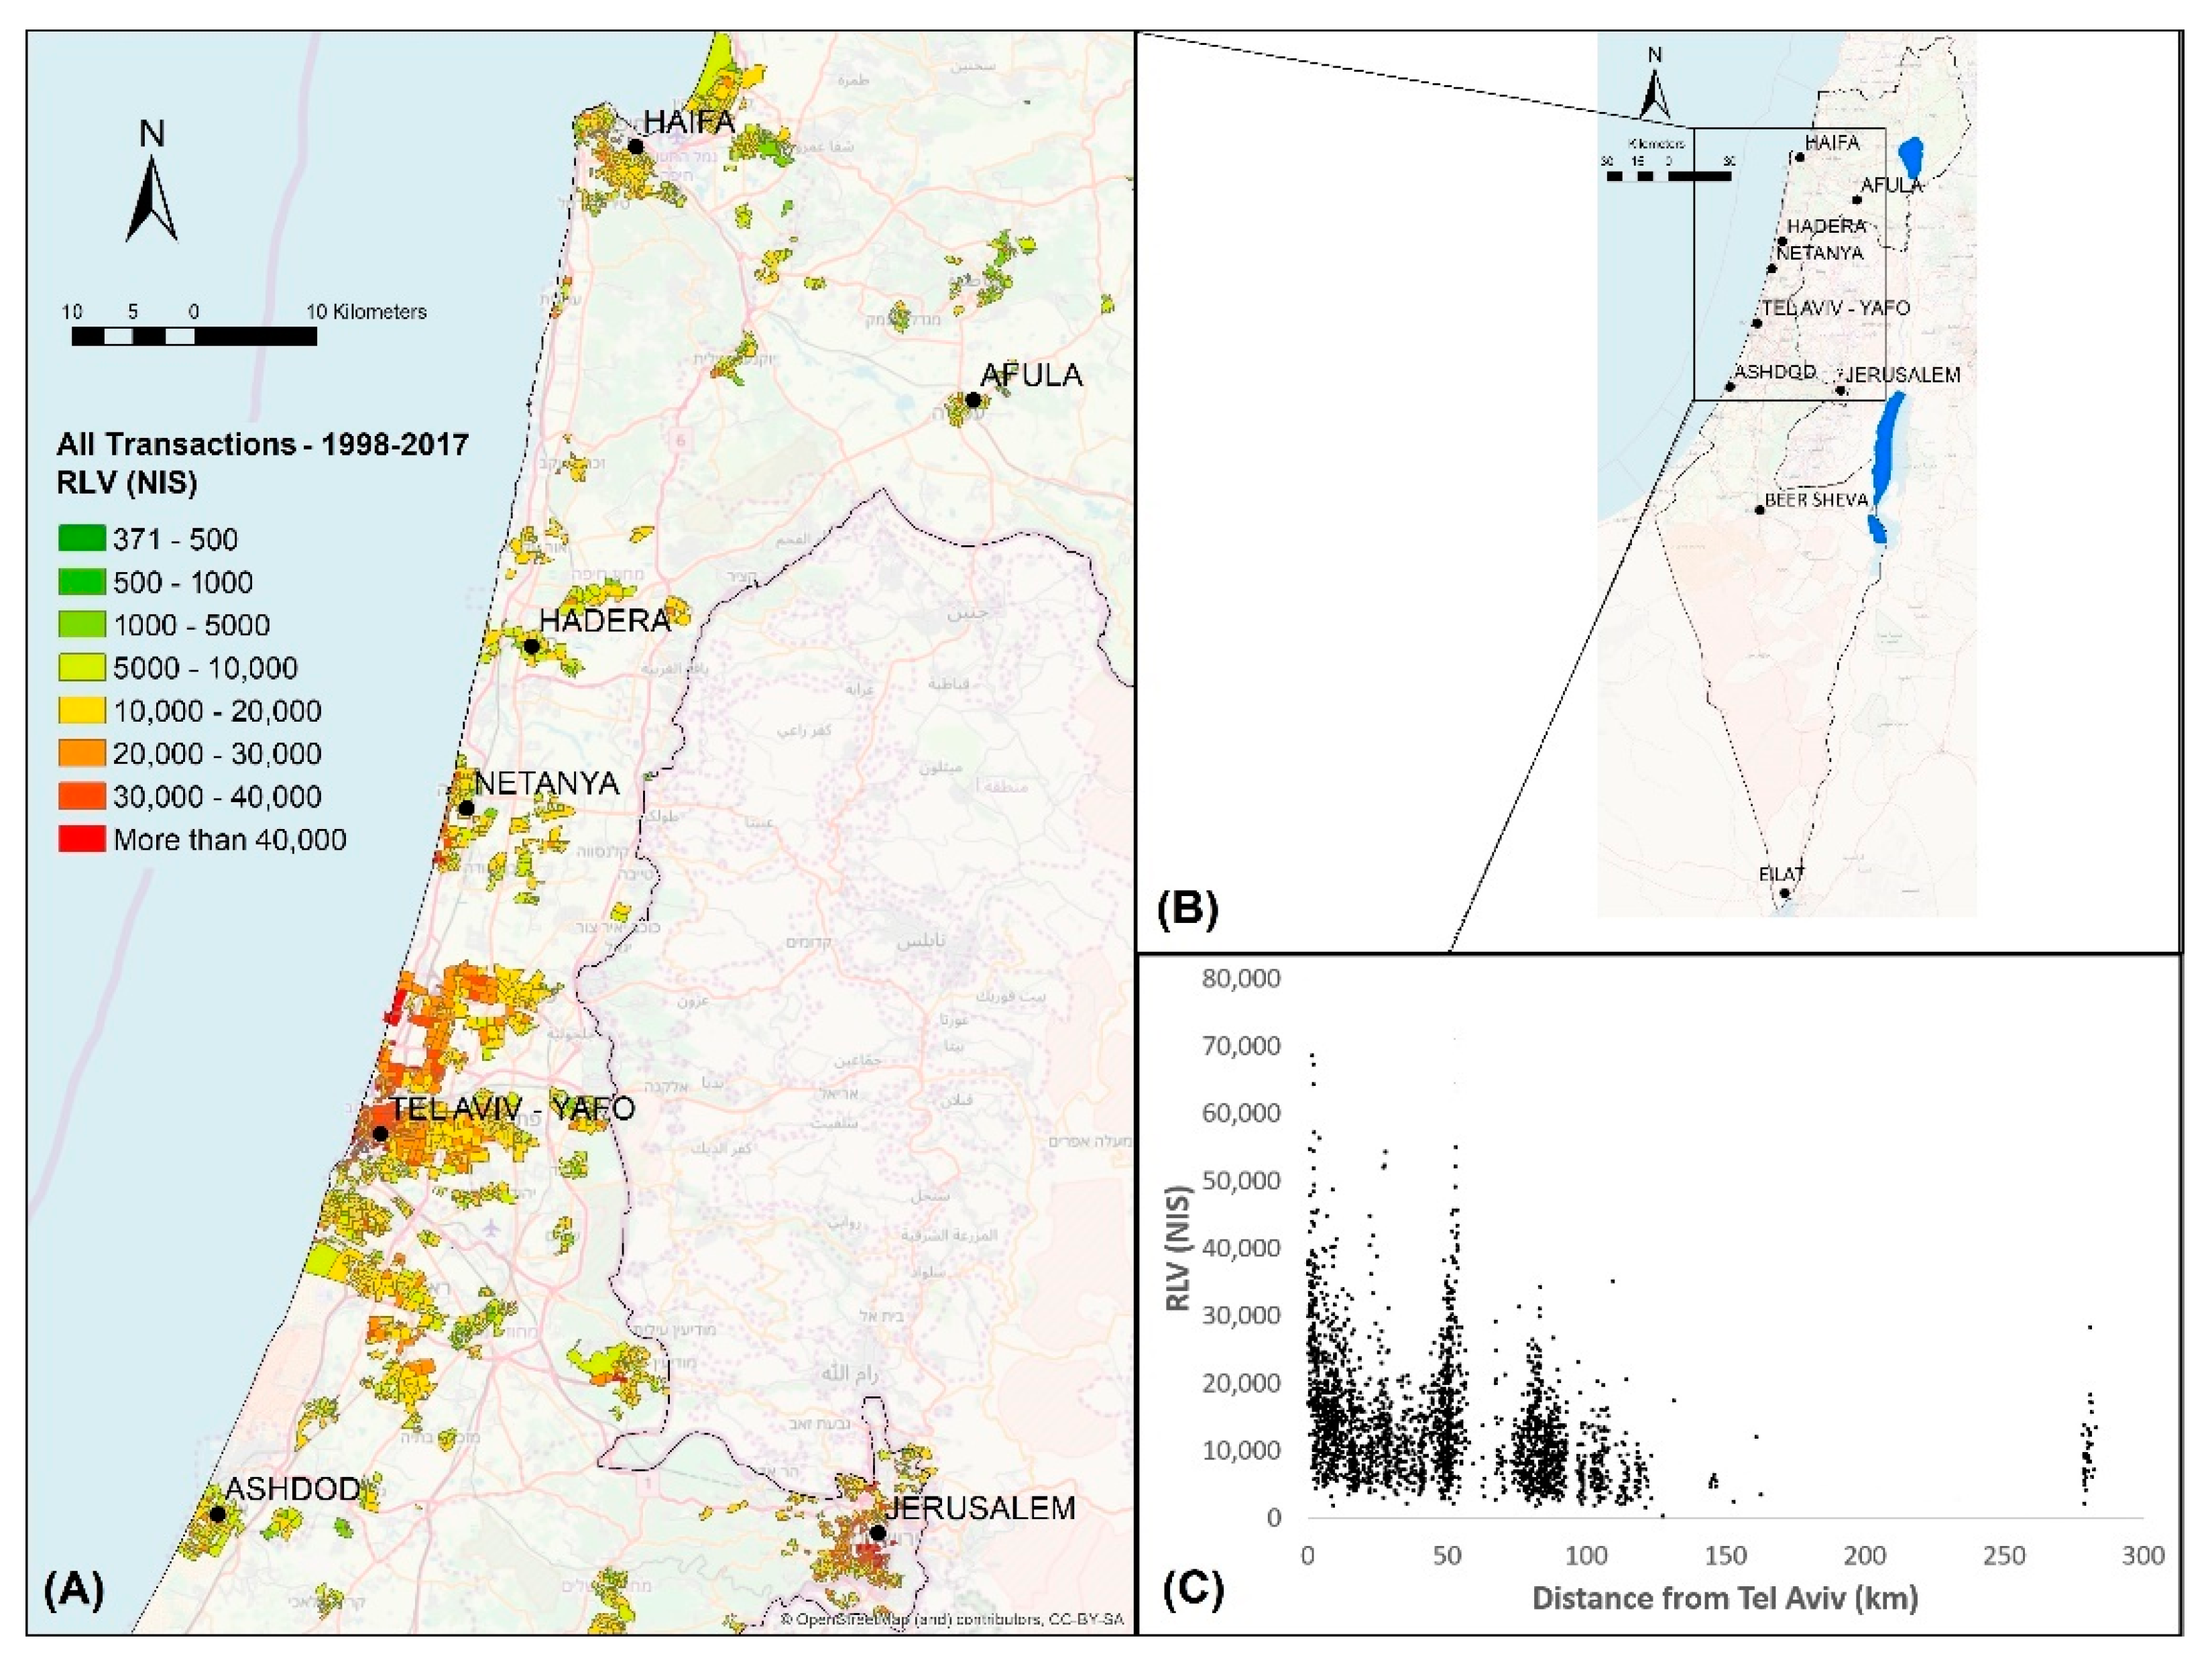
3.1. Block Level at a Single Time Period

In order to obtain the initial overall picture of the urban structure, we used the most detailed geographical level [blocks] and considered all the available transactions, regardless of their date. Therefore, the 996,576 transactions of residences during the period 1998–2017 were aggregated by blocks. For each block, we estimated the regression described in Equation (1). b 0 resulted positive and significant in 2444 blocks, which contained only 837,339 transactions [roughly 84% of the total]. Table 2 shows the descriptive statistics of the results.
Graphical results of the analysis for the whole period, together with an outline of the urban areas of interest are included in Figure 1.
When all transactions are considered, the significant blocks are evenly distributed among urban areas, both in the city cores and their outskirts. Tel-Aviv, located on the Israeli Mediterranean shore, is the second biggest city in Israel, after its capital, Jerusalem [according to the Israeli Central Bureau of Statistics, in 2016 the population in Jerusalem was around 882,000 inhabitants, compared with 439,000 in Tel Aviv. Haifa, the third-largest city hosted in 2016 280,000 inhabitants, followed by Beer Sheva, with around 206,000 inhabitants]. However, the whole metropolitan area of Tel Aviv hosts around 44% of the Israeli population [the same document from the Israeli Central Bureau of Statistics reports that in 2016 the total Israeli population was around 8,560,000 inhabitants. A Tel Aviv municipality report from 2017 [“Strategic plan update to the city of Tel Aviv–Tel Aviv in the metropolis and the country” in Hebrew], states that the Tel Aviv metropolitan area hosted in 2016 around 3,785,000 inhabitants] and is considered the most dynamic region in the country both socially and economically [39], and for this reason, the Tel Aviv metropolis is considered the core area of the country. Figure 1B shows the location of the Israeli main cities [Tel Aviv, Jerusalem, and Haifa] and additional smaller cities. Measuring RLVs depending on the distance from Tel Aviv means that the relative geographical location of other big cities, like Haifa, Jerusalem, and others, will interfere with the downward trends expected. Indeed, the results are shown in Figure 1C demonstrate that, in general, RLVs decrease consistently with increasing distance from Tel Aviv, but the influence of other urban cores is clearly discernible. But the RLV by block as a function of the distance from Tel Aviv [Figure 1C] a complex pattern emerges, that highlights the advantages and disadvantages of geographical aggregation of small units as blocks. On one hand, a detailed account of the RLV variability within urban areas and among them, showing local differences and contrasts [Figure 1A]. On the other, the same variability at very short distances has the potential to obscure the big picture. The conglomeration of dots near the vertical axes represents the blocks located in Tel Aviv and its immediate neighborhoods. The sparse dots located above RLV of 20,000 NIS at a distance of above 25 km represent the blocks in Netanya, located in the north of Tel Aviv. The vertical cloud of dots located at a distance of 50 km represents the RLV of blocks located in Jerusalem, while the lower and thicker cloud at a distance of around 80 km includes most of the blocks located in Haifa and its surroundings. Finally, the vertical arrangement of dots at 270 km from Tel Aviv are blocks from the southern city of Eilat. Regardless spiky distribution of the observations, the trend is clear: As the distance from Tel Aviv increases, the RLV decreases.

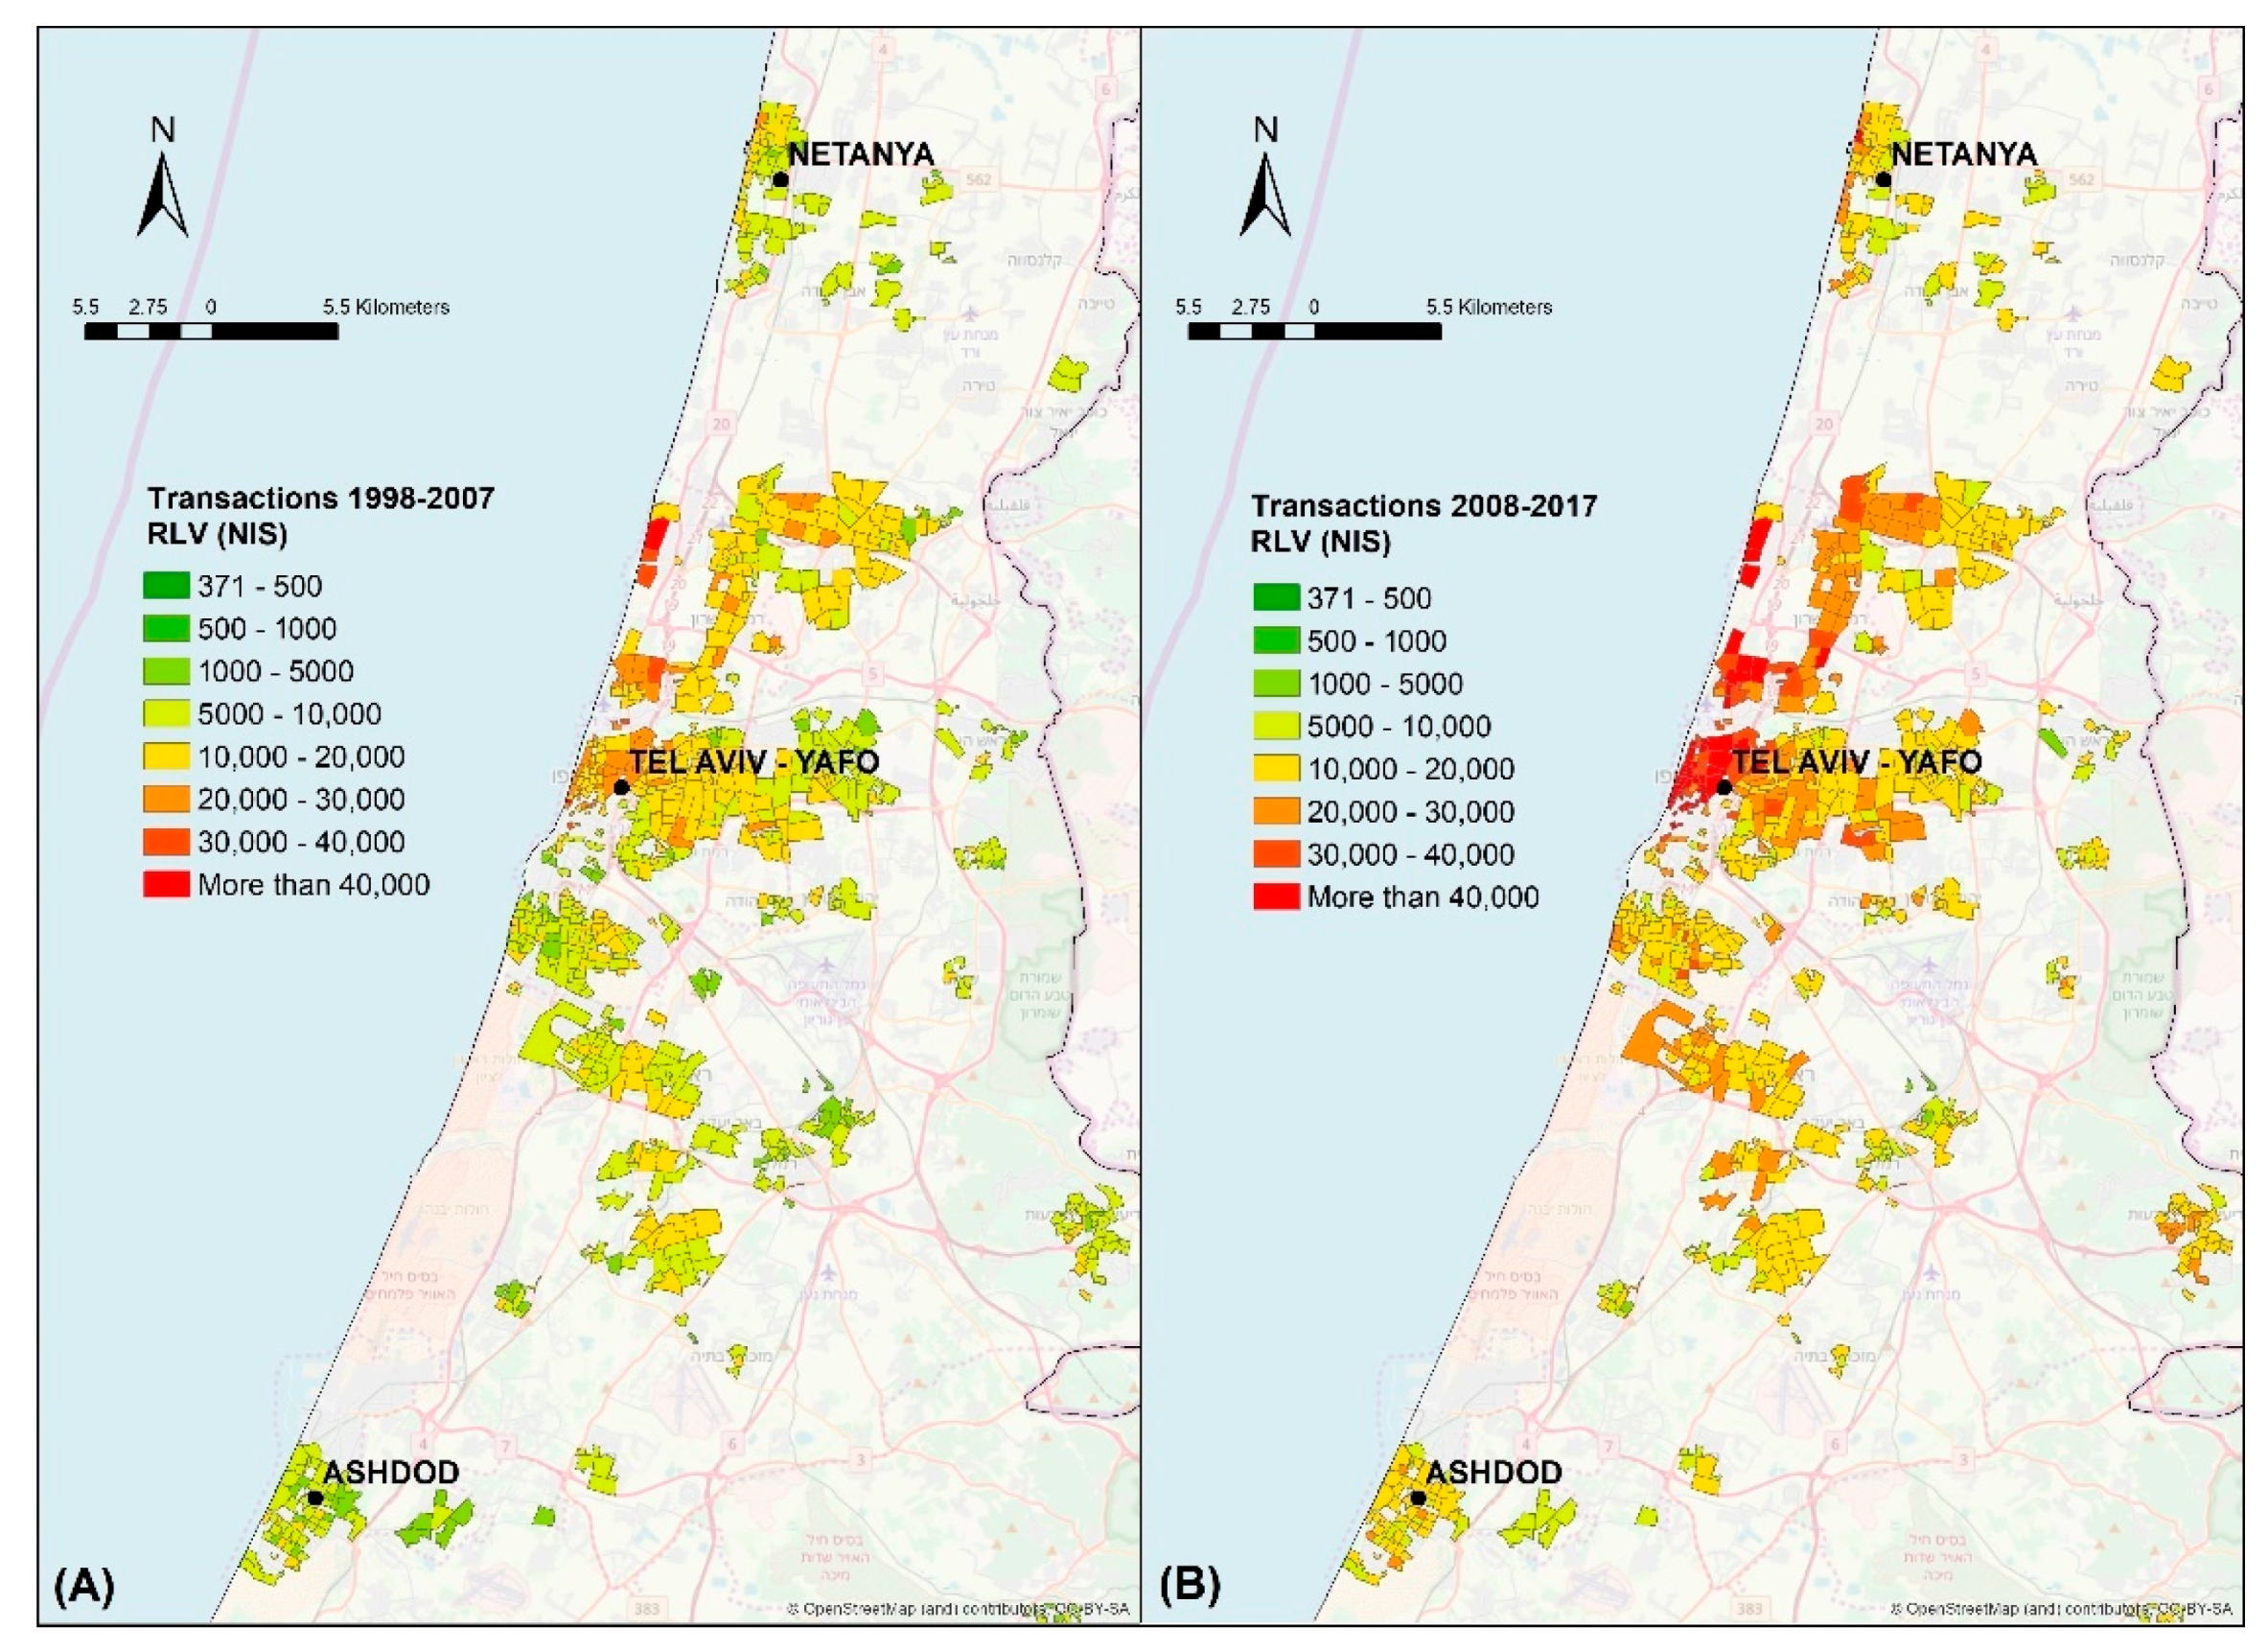
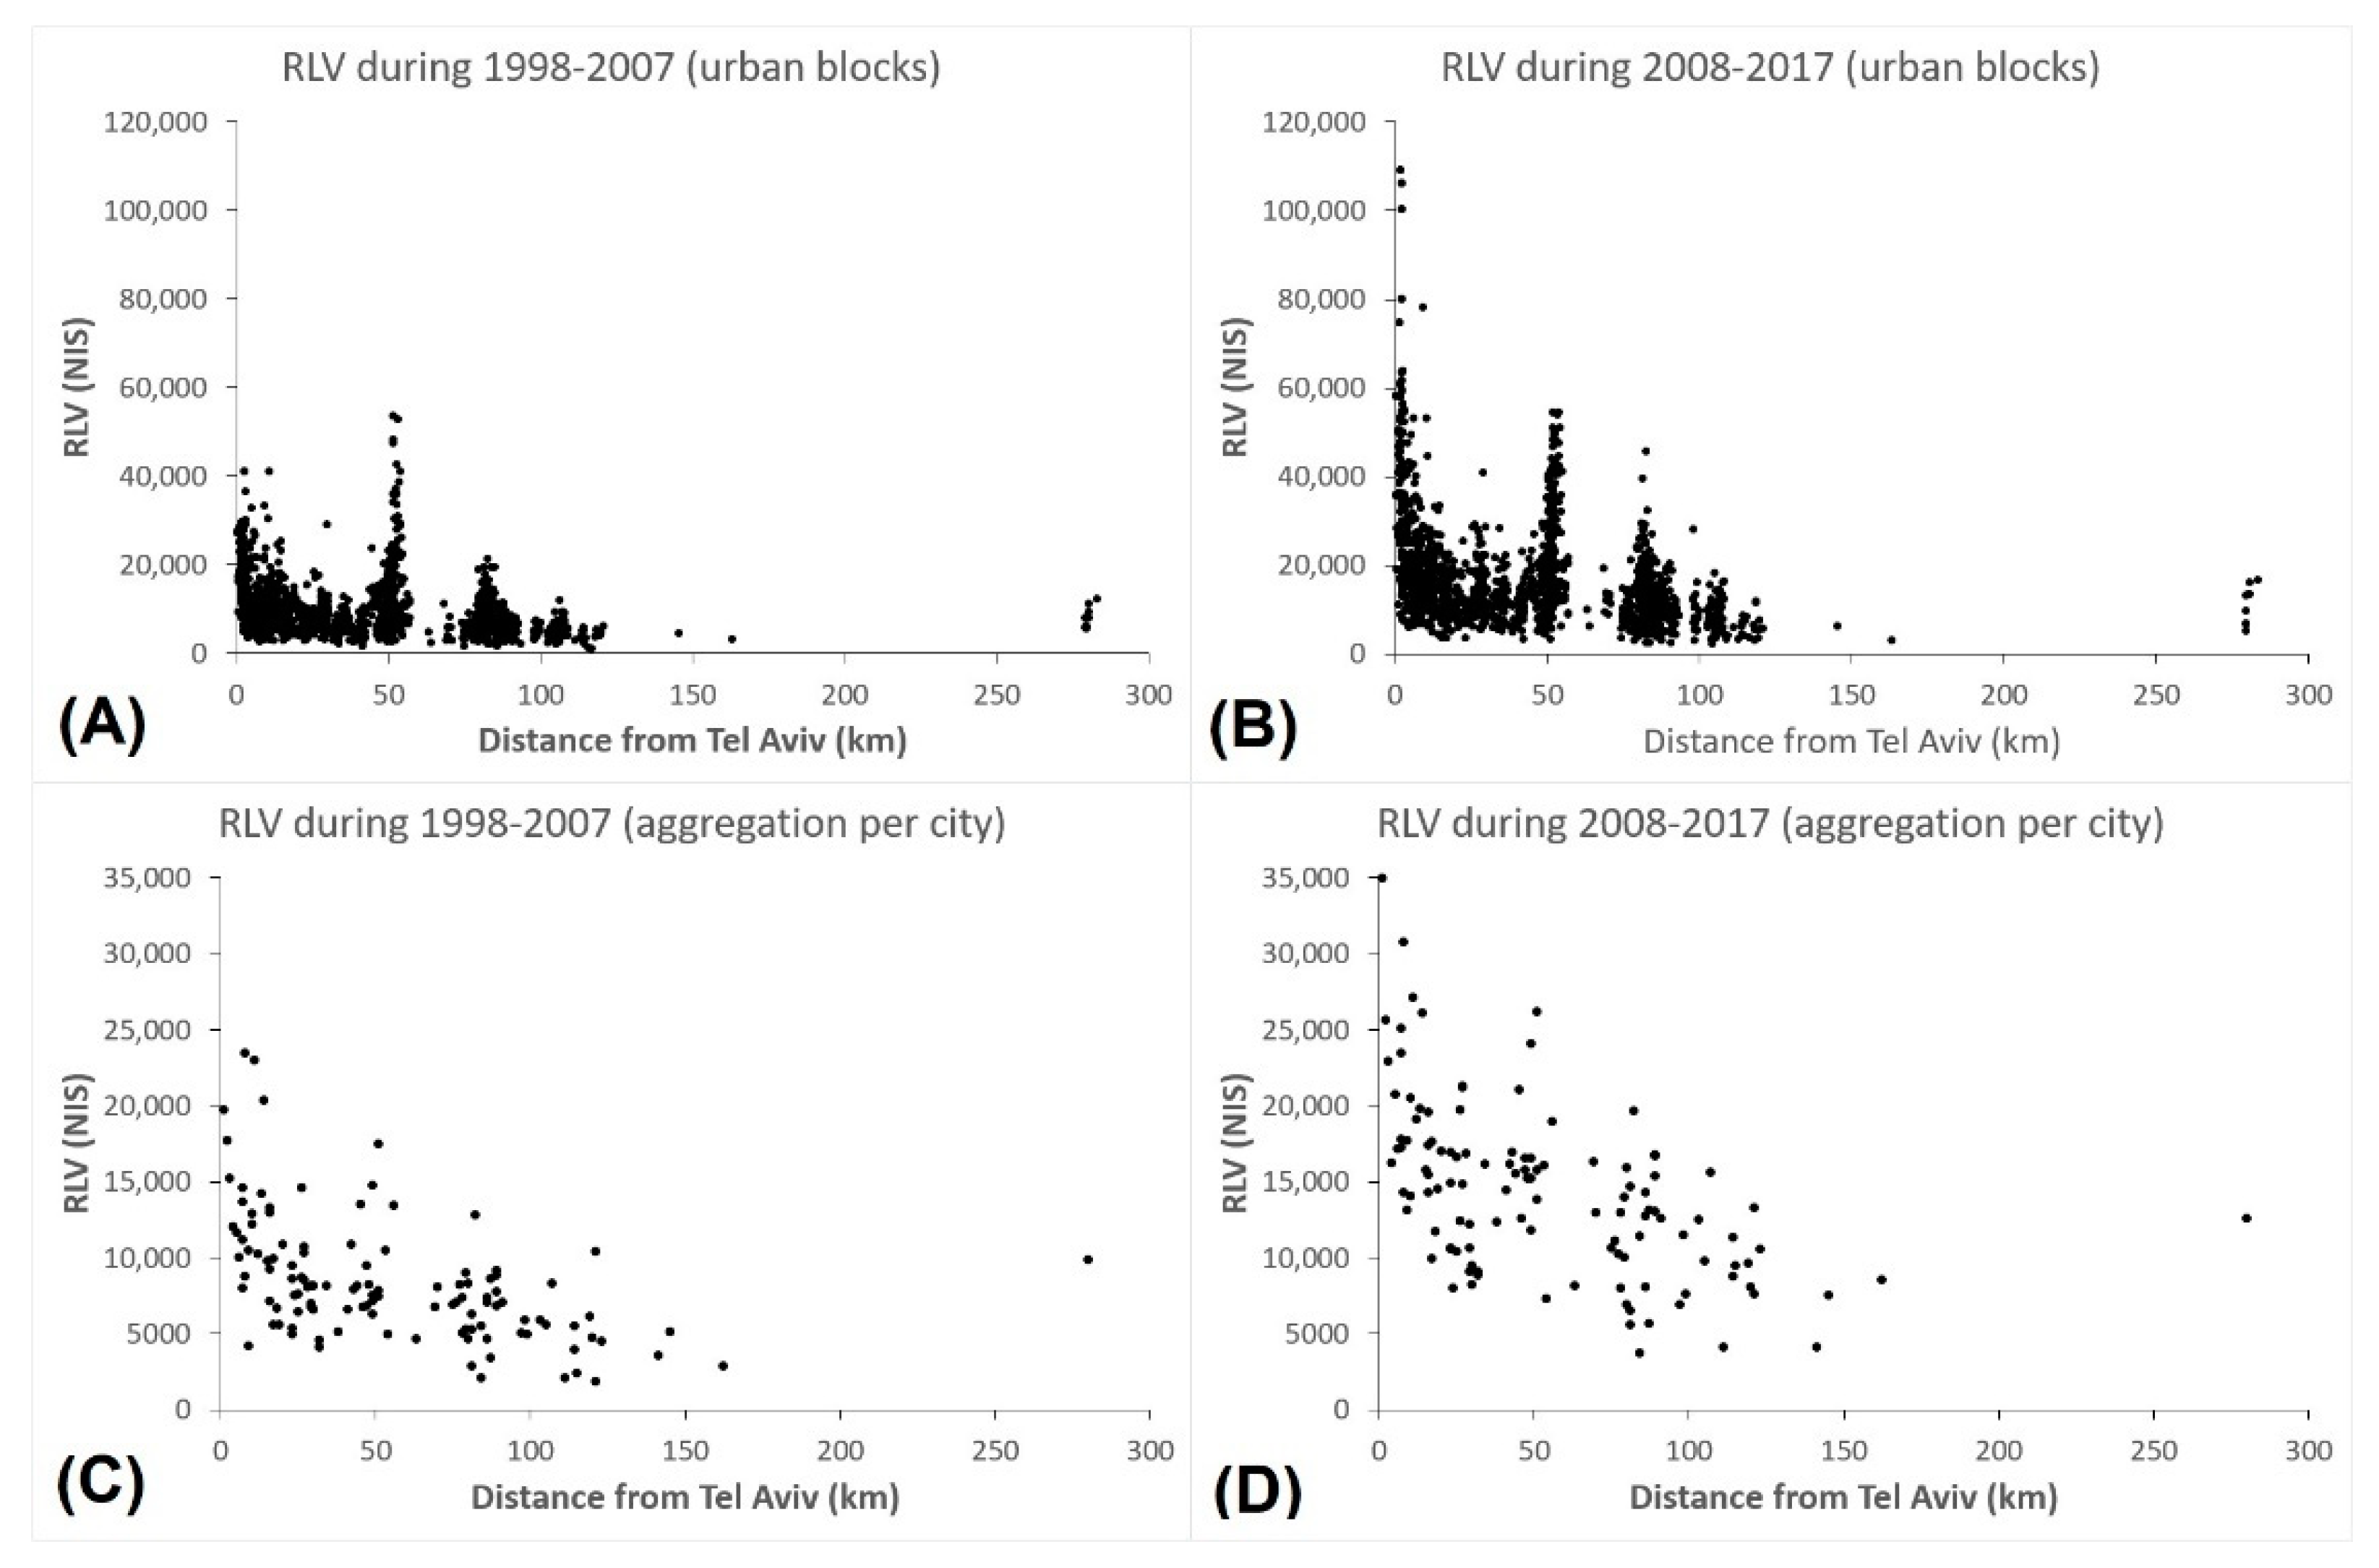
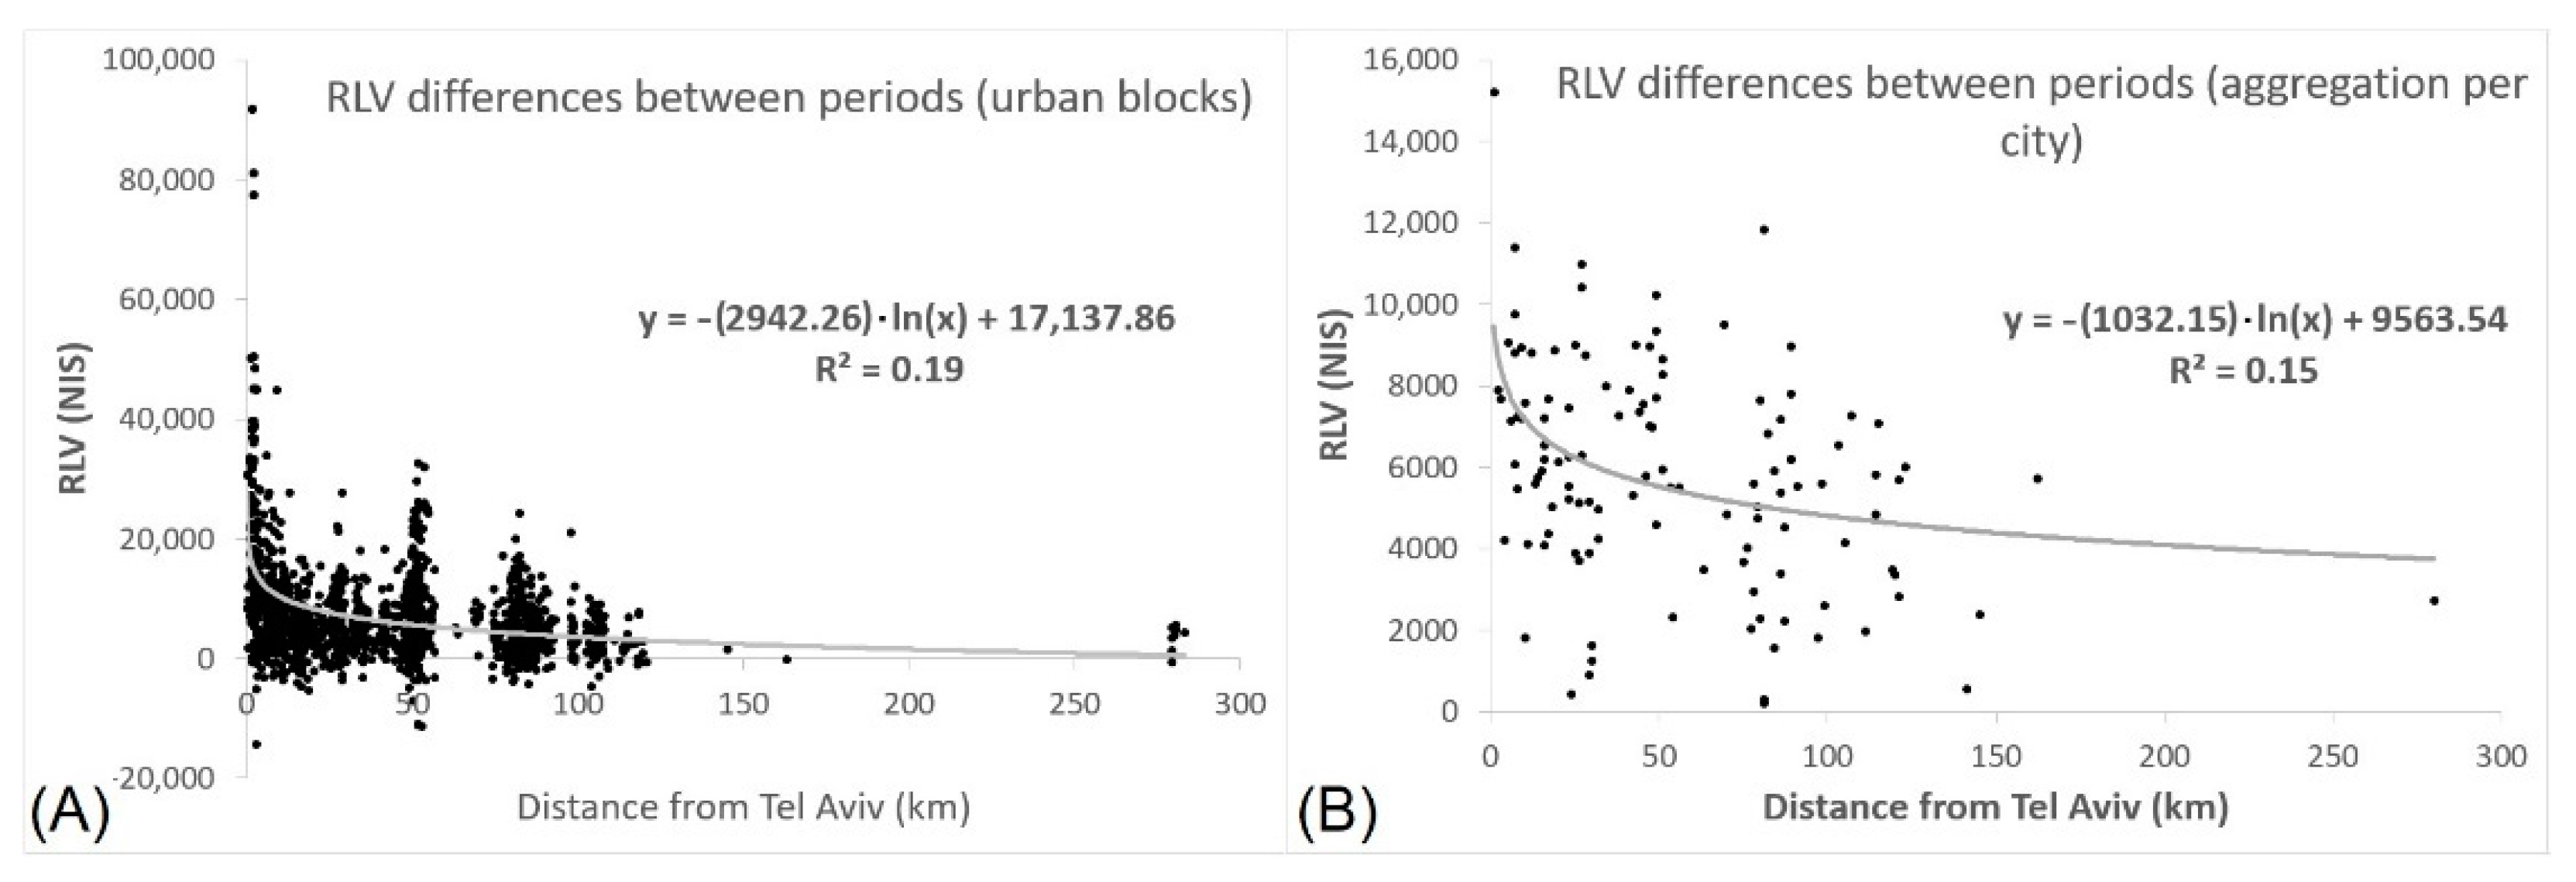
3.2. Block and City Level Comparison during Two Time Periods

For most of the urban areas in Israel, there are abundant data about real estate transactions, that is reliable enough to split the dataset into two different periods, allowing for the analysis of the dynamics between the center and the periphery. The minimal requirement for a block or city to be included in the analysis is to have 30 transactions in each period. The core-periphery gap is measured here through the relative changes of RLVs in the different periods and through space. The first period is between 1 January 1998 and 31 December 2007, and the second from 1 January 2008 until 31 December 2017. In order to be able to compare the results of both periods, the number of geographic units in which the transactions are aggregated must be kept constant. The first aggregation approach is by blocks [as previously] and therefore the relevant blocks are those in which the regression in Equation (1) is significant and b 0 positive in both periods. This results in 961,432 transactions distributed among 1532 blocks. To test the robustness of the results, a second aggregation method was performed, using municipal areas, that comprise all the urban blocks belonging to the same municipality. This aggregation results in 118 municipal areas in which, in both periods, 957,104 transactions were recorded. Also in this case, in all the municipal areas considered, regression in Equation (1) was significant and b 0 was positive. Table 3 shows the descriptive statistics of both aggregations for each period.
The sharp increase in RLVs is evident comparing the left and right maps in Figure 2.
The general trend is towards the dark red scale [the color symbols and the ranges of values are the same in both maps]. This suggests that residential land values increased in the later period everywhere, and the increase was considerable. But the maps also suggest that the RLVs increased more near Tel Aviv than far away from it. In order to test visually this hypothesis, we elaborate graphs of the RLV as a function of the distance from Tel Aviv at two different levels of aggregation: Urban blocks and municipal areas, which include several blocks. Figure 3 summarizes the results as a function of the distance between urban blocks and municipalities from Tel Aviv during both periods.
RLVs increase over time everywhere, but this trend is much more evident in the central parts of the country than in the periphery. In all four charts, Tel Aviv and its neighborhoods appear near the vertical axes, Jerusalem at around 50 km, Haifa at 80 km, and Eilat in the rightest position. The trend of decreasing RLV with increasing distances is similar, but the gradient becomes much steeper. During the two analyzed periods, RLVs in the center increase significantly more than RLVs in the periphery. In other words, at least observed through the prism of the built land values, the gap between center and periphery in Israel is, apparently, widening. The RLV in urban blocks varies widely, even within the same city [as shown in the Tel Aviv area in Figure 2]. This is the reason also for the column-like concentration of observations in the upper charts of Figure 2; in the biggest cities, urban blocks with very low and extremely high RLV coexists.
The trend described previously using urban blocks becomes, using municipal areas, much clearer and unequivocal, as shown in the lower charts of Figure 3. RLVs aggregated at the level of municipalities tend to decrease as their distance to Tel-Aviv increases, as observed in both periods. The impact of the distance from the core on RLVs seems also to increase over time since also the differences of RLVs between both periods are larger in the core and decrease with distance [Figure 3B,D]. All these apparent trends [related also to urban blocks and municipal areas] are confirmed by the regressions reported in Table 4 and shown in Figure 4.
Table 4 reports the results of the correlation between the RLV aggregated by urban blocks and municipal areas, and the logarithm of the distance to Tel Aviv. All the results are significant, and the distance coefficients are negative, as expected, with quite similar explanatory power. The results are consistent, significant, and conclusive. Not only that the regression coefficients become steeper over time, but also the difference between the RLVs recorded during the different periods is significant and negative. These statistical results confirm the trends observed in Figure 2 and Figure 3. This suggests that the gap that divides the appeal of locations in the center of Israel and its periphery is not only large but also that it is increasing over time.

4. Discussion and Conclusions

4.1. Residential Land Values as A Measure of Peripherality

Land values reflect the willingness to pay by consumers for housing services that can be produced on a certain parcel of land. It also reflects the potential for profit-maximizing future land improvements that developers can generate. As such, it reflects the potential highest and best use at a specific location. The land value reflects the balance of the advantages [including urban amenities, accessibility to jobs, services, environmental qualities, etc.] and the disadvantages [such as crowding, pollution, or simply bad reputation] of living at that location. As opposed to traditional measurements of individual aspects associated with the dwelling in a specific location, generally calculated using hedonic analysis, the land value represents a comprehensive assessment of its overall qualities. Despite the potential importance of accurate measurements of land values for policy and economic analysis, little information is available about it, and its calculation based on other types of available data, as real estate transactions, can be troublesome. An analysis performed using Dutch data [13] suggests a land value calculation methodology based on data on the plot size of detached houses. This paper shows how the original approach can be extended to all types of dwellings, calculating the residential land value [RLV] in a certain area. This is made possible by the use of large datasets of real estate transactions for the calculation of RLV in any location where data is available, at a variety of geographical extensions, and at different periods of time. The results shed light not only on the spatial structure of the RLVs but also on their variation over time. We agree with the view that uneven spatial development is caused by competition between different locations and results in the differential provision of residential qualities and urban amenities [10]. These amenities, together with features related to the geographical location, like accessibility, nearness to highly valued places [as the city center, seashore, open spaces, landscapes, etc. depending on the specific case] and being far from undesired locations [as noisy, polluted, or unpleasant sites] define the willingness to pay for living in a certain place. We interpret core locations as places where “everyone would like to live”, and hence characterized mainly by high land values. Peripheral locations, even if are not located in a strictly geographical periphery [6], are less desired places in which the competition for space is less fierce and hence the land values are lower. Therefore, residential land values [RLVs] can be used as an accurate assessment of the degree of centrality or peripherality of a certain location.

4.2. Residential Land Values and Spatial Policies

RLVs reflect the variability of the appealing attributes over space. When calculated at a fine-grain resolution it is a valuable tool for assessing intraurban and interurban variability among neighborhoods of the same city, among cities, and at a regional, large scale. In Israel, the discourse about geographical cores and peripheries is, to a large extent, mediated by residential-related issues, as the perceived migration pressure into its urban cores, and the rising dwelling prices within them [40,41,42]. There is a long-term debate about the imbalance between the economic growth of the center of Israel and the lagged development of its northern and southern peripheries, the policies implemented aimed to mitigate it, and their degree of success [43,44]. The government has defined explicit objectives of population dispersal and development of the periphery, but these were not achieved, according to the State Comptroller and Ombudsman of Israel. [“The housing crisis-A special audit report” [2015], in Hebrew. https://www.mevaker.gov.il/he/Reports/Report_279/f43ab2c3-db98-447c-8e49-8b3977bc660d/003-diur-1-new.pdf?AspxAutoDetectCookieSupport=1, accessed on 22 April 2021] The geographical and economic analysis performed in this paper by means of calculated RLVs all over the country sheds light on one of the basic reasons for this policy failure: Despite the efforts invested in the development of the periphery in Israel, the appealing of locations in the Tel Aviv metropolitan area is still, in average, much higher than in any other place in the country. Moreover, as time passes, the appealing increases, compared with other, more peripheral locations. In other words, the core-periphery gap in Israel is consistently widening.

4.3. Urban Core-Periphery: Between Binary and Multipole Interpretations

The expansion of cities at the expense of part of the surrounding rural areas, and the variety of transformations experienced by those newly urbanized zones [8,45,46] calls for different perspectives to the assessment and measurement of centrality and peripherality. In cases where detailed socio-economic and geographic data is available, sophisticated approaches that account for several dimensions of peripherality are possible [9]. In comparison, the approach suggested in this paper is simple in the sense that it is based on a single value: The residential land value. It is obvious that there is a wide range of locational, socio-economic, planning, and historical factors that determine the observed residential land value. At the same time, residential land values have an influence on additional factors, such as the characteristics of the population that is willing, and able to reside, in a certain place. However, the great advantage of RLVs as a measure of peripherality is their comprehensiveness: It represents the attractiveness and the appealing of a location, taking implicitly into account all its visible and invisible characteristics. In this sense, the suggested approach is close to a binary core-periphery view, although it is aimed to assign “peripherality values” in a continuum between the highest and the lowest observed RLVs. At the same time, when the geographical areas are small enough [as exemplified by the case of urban blocks] the approach also fits into the micro-scale and fine-grain perspective advocated by Popescu et al. 2020 [9]. The variation of RLVs observed at the level of urban blocks in cities that can be considered “peripheral” as a whole, and particularly the cases in which RLVs remain stable over time in a context of widespread increasing values, can be viewed as an additional example of “peripheralization within the periphery” [9]. Therefore, the RLV approach is also able to cope with multipole core-peripheral situations in which the whole urban system can be addressed, but at the same time, smaller metropolitan areas or even individual cities can also be focused on.

4.4. Summary and Further Research

The results of this research suggest that RLVs are a reliable measure for the analysis of the geographical structure of the location appraisals in urban areas. Unlike simple property price assessments, the calculation of RLVs dissociates the built structures from the land they are built on, leaving a clear-cut measure: The value of the specific place. As such, it is an ideal candidate for simple measurement of the degree of centrality or peripherality of a certain location. Therefore, it can be used to assess the gap between urban cores and more peripheral urban zones. This view conceptualizes the urban system as a spatial playground composed of different cities, which in turn contain a mosaic of residential areas with dissimilar characteristics, as, for example, urban blocks. But there is an additional dimension that needs to be incorporated into the picture if we aim to develop a more comprehensive understanding of the dynamics of urban systems: Its habitants. The households living in the urban system are the players in the urban playground. But the households’ behavior continuously modifies the playground itself. The modeling of this inherently out-of-equilibrium setting is a great challenge that should be addressed. Residential land values interpreted as measures of centrality or peripherality at a certain point of time are basic and significant building blocks in this effort.

Author Contributions

Conceptualization, E.B., D.B. and D.C.; methodology, E.B., D.B. and D.C.; software, E.B. and D.B.; validation, E.B., D.B. and D.C.; formal analysis, E.B. and D.B.; investigation, E.B., D.B. and D.C.; resources, D.B. and D.C.; data curation, E.B.; writing—original draft preparation, E.B. and D.B.; writing—review and editing, E.B., D.B. and D.C.; visualization, D.B.; supervision, D.B. and D.C.; project administration, D.B. and D.C.; funding acquisition, D.B. and D.C. All authors have read and agreed to the published version of the manuscript.

Funding

This research was partially funded by the Alrov Institute for Real Estate Research at Tel Aviv University, and the Israel Science Foundation, Grant Number 319/17.

Institutional Review Board Statement

Not applicable.

Informed Consent Statement

Not applicable.

Data Availability Statement

Summarized data will be provided upon request.

Acknowledgments

The authors wish to thank the Alrov Institute and the Israel Science Foundation for their support.

Conflicts of Interest

The authors declare no conflict of interest.

References

  1. Lucas, R.E. Why Doesn’t Capital Flow from Rich to Poor Countries? Am. Econ. Rev. 1990, 80, 92–96. [Google Scholar]
  2. Broitman, D.; Czamanski, D. Cities in Competition, Characteristic Time, and Leapfrogging Developers. Environ. Plan. B 2012, 39, 1105–1118. [Google Scholar] [CrossRef]
  3. Broitman, D.; Czamanski, D. Bursts and Avalanches: The Dynamics of Polycentric Urban Evolution. Environ. Plan. B 2015, 42, 58–75. [Google Scholar] [CrossRef] [Green Version]
  4. Broitman, D.; Benenson, I.; Czamanski, D. The Impact of Migration and Innovations on the Life Cycles and Size Distribution of Cities. Int. Reg. Sci. Rev. 2020, 43, 531–549. [Google Scholar] [CrossRef]
  5. Broitman, D.; Czamanski, D. Endogenous Growth in a Spatial Economy: The Impact of Globalization on Innovations and Convergence. Int. Reg. Sci. Rev. 2020, 0160017620946095. [Google Scholar] [CrossRef]
  6. Kühn, M. Peripheralization: Theoretical Concepts Explaining Socio-Spatial Inequalities. Eur. Plan. Stud. 2015, 23, 367–378. [Google Scholar] [CrossRef]
  7. Benedek, J.; Moldovan, A. Economic convergence and polarisation: Towards a multi-dimensional approach. Hung. Geogr. Bull. 2015, 64, 187–203. [Google Scholar] [CrossRef] [Green Version]
  8. Dadashpoor, H.; Ahani, S. A conceptual typology of the spatial territories of the peripheral areas of metropolises. Habitat Int. 2019, 90, 102015. [Google Scholar] [CrossRef]
  9. Popescu, C.; Soaita, A.M.; Persu, M.R. Peripheralitysquared: Mapping the fractal spatiality of peripheralization in the Danube region of Romania. Habitat Int. 2021, 107, 102306. [Google Scholar] [CrossRef]
  10. Harvey, D. Spaces of Capital: Towards a Critical Geography; Routledge: London, UK, 2001; ISBN 978-0-415-93240-0. [Google Scholar]
  11. Lefebvre, H.; Nicholson-Smith, D. The Production of Space; Blackwell: Oxford, UK, 1991. [Google Scholar]
  12. Rosenthal, S.S.; Strange, W.C. The Micro-Empirics of Agglomeration Economies. In A Companion to Urban Economics; Arnott, R.J., McMillen, D.P., Eds.; Blackwell Publishing Ltd.: Oxford, UK, 2006; pp. 7–23. ISBN 978-0-470-99622-5. [Google Scholar]
  13. De Groot, H.; Marlet, G.; Teulings, C.; Vermeulen, W. Cities and the Urban Land Premium; Edward Elgar Publishing: Cheltenham, UK, 2015. [Google Scholar]
  14. Yuan, F.; Wei, Y.D.; Wu, J. Amenity effects of urban facilities on housing prices in China: Accessibility, scarcity, and urban spaces. Cities 2020, 96, 102433. [Google Scholar] [CrossRef]
  15. Rosen, S. Hedonic prices and implicit markets: Product differentiation in pure competition. J. Political Econ. 1974, 82, 34–55. [Google Scholar] [CrossRef]
  16. Richardson, H.W.; Gordon, P.; Jun, M.J.; Heikkila, E.; Peiser, R.; Dale-Johnson, D. Residential property values, the CBD, and multiple nodes: Further analysis. Environ. Plan. A 1990, 22, 829–833. [Google Scholar] [CrossRef]
  17. Lutzenhiser, M.; Netusil, N.R. The effect of open spaces on a home’s sale price. Contemp. Econ. Policy 2001, 19, 291–298. [Google Scholar] [CrossRef]
  18. Smith, V.K.; Poulos, C.; Kim, H. Treating open space as an urban amenity. Resour. Energy Econ. 2002, 24, 107–129. [Google Scholar] [CrossRef]
  19. Walsh, R. Endogenous open space amenities in a locational equilibrium. J. Urban Econ. 2007, 61, 319–344. [Google Scholar] [CrossRef]
  20. Conway, D.; Li, C.Q.; Wolch, J.; Kahle, C.; Jerrett, M. A Spatial Autocorrelation Approach for Examining the Effects of Urban Greenspace on Residential Property Values. J. Real Estate Financ. Econ. 2010, 41, 150–169. [Google Scholar] [CrossRef]
  21. Gibbons, S.; Mourato, S.; Resende, G.M. The amenity value of English nature: A hedonic price approach. Environ. Resour. Econ. 2014, 57, 175–196. [Google Scholar] [CrossRef] [Green Version]
  22. Li, M.M.; Brown, H.J. Micro-neighborhood externalities and hedonic housing prices. Land Econ. 1980, 56, 125–141. [Google Scholar] [CrossRef]
  23. Heikkila, E.; Gordon, P.; Kim, J.I.; Peiser, R.B.; Richardson, H.W.; Dale-Johnson, D. What happened to the CBD-distance gradient?: Land values in a policentric city. Environ. Plan. A 1989, 21, 221–232. [Google Scholar] [CrossRef]
  24. Chen, J.; Hao, Q. The impacts of distance to CBD on housing prices in Shanghai: A hedonic analysis. J. Chin. Econ. Bus. Stud. 2008, 6, 291–302. [Google Scholar] [CrossRef]
  25. Glumac, B.; Herrera Gomez, M.; Licheron, J. A Residential Land Price Index for Luxembourg: Dealing with the Spatial Dimension. SSRN J. 2018. [Google Scholar] [CrossRef]
  26. Osland, L.; Thorsen, I. Effects on Housing Prices of Urban Attraction and Labor-Market Accessibility. Environ. Plan. A 2008, 40, 2490–2509. [Google Scholar] [CrossRef]
  27. Malaitham, S.; Fukuda, A.; Vichiensan, V.; Wasuntarasook, V. Hedonic pricing model of assessed and market land values: A case study in Bangkok metropolitan area, Thailand. Case Stud. Transp. Policy 2020, 8, 153–162. [Google Scholar] [CrossRef]
  28. Dziauddin, M.F. Estimating land value uplift around light rail transit stations in Greater Kuala Lumpur: An empirical study based on geographically weighted regression [GWR]. Res. Transp. Econ. 2019, 74, 10–20. [Google Scholar] [CrossRef]
  29. Chay, K.Y.; Greenstone, M. Does air quality matter? Evidence from the housing market. J. Political Econ. 2005, 113, 376–424. [Google Scholar] [CrossRef] [Green Version]
  30. Dubin, R.A.; Goodman, A.C. Valuation of education and crime neighborhood characteristics through hedonic housing prices. Popul. Environ. 1982, 5, 166–181. [Google Scholar] [CrossRef]
  31. Gibbons, S.; Machin, S. Valuing English primary schools. J. Urban Econ. 2003, 53, 197–219. [Google Scholar] [CrossRef] [Green Version]
  32. Colwell, P.F.; Munneke, H.J. Directional Land Value Gradients. J. Real Estate Financ. Econ. 2009, 39, 1–23. [Google Scholar] [CrossRef]
  33. Lavee, D. Land use for transport projects: Estimating land value. Land Use Policy 2015, 42, 594–601. [Google Scholar] [CrossRef]
  34. Kok, N.; Monkkonen, P.; Quigley, J.M. Economic Geography, Jobs, and Regulations: The Value of Land and Housing. In American Real Estate and Urban Economics Conference; Berkeley Program for Housing and Urban Policy and the European Property Research Institute at Maastricht University: Denver, CO, USA, 2011. [Google Scholar]
  35. Davis, M.A.; Heathcote, J. The price and quantity of residential land in the United States. J. Monet. Econ. 2007, 54, 2595–2620. [Google Scholar] [CrossRef] [Green Version]
  36. Tideman, N.; Plassmann, F. The effects of changes in land value on the value of buildings. Reg. Sci. Urban Econ. 2018, 69, 69–76. [Google Scholar] [CrossRef]
  37. Pagourtzi, E.; Assimakopoulos, V.; Hatzichristos, T.; French, N. Real estate appraisal: A review of valuation methods. J. Prop. Investig. Financ. 2003, 21, 383–401. [Google Scholar] [CrossRef] [Green Version]
  38. Davis, M.A.; Larson, W.D.; Oliner, S.D.; Shui, J. The price of residential land for counties, ZIP codes, and census tracts in the United States. J. Monet. Econ. 2021, 118, 413–431. [Google Scholar] [CrossRef]
  39. Alfasi, N.; Fenster, T. A tale of two cities: Jerusalem and Tel Aviv in an age of globalization. Cities 2005, 22, 351–363. [Google Scholar] [CrossRef]
  40. Krakover, S. Spatio-Temporal Trends of Housing and Population Growth During a Building Cycle: Evidence from Metropolitan Tel-Aviv, 1968 to 1990. Urban Geogr. 1999, 20, 226–245. [Google Scholar] [CrossRef]
  41. Frenkel, A.; Bendit, E.; Kaplan, S. Residential location choice of knowledge-workers: The role of amenities, workplace and lifestyle. Cities 2013, 35, 33–41. [Google Scholar] [CrossRef]
  42. Ben-Shahar, D.; Gabriel, S.; Golan, R. Can’t get there from here: Affordability distance to a superstar city. Reg. Sci. Urban Econ. 2020, 80, 103357. [Google Scholar] [CrossRef]
  43. Gradus, Y.; Krakover, S. The Effect of Government Policy on the Spatial Structure of Manufacturing in Israel. J. Dev. Areas 1977, 11, 393–409. [Google Scholar]
  44. Gradus, Y.; Einy, Y. Trends in core-periphery industrialization gaps in Israel. In Geographical Research Forum [Occasional Papers] Beer-Sheva; Inist-CNRS: Vandœuvre-lès-Nancy, France, 1981; pp. 25–37. [Google Scholar]
  45. De Noronha, T.; Vaz, E. Framing urban habitats: The small and medium towns in the peripheries. Habitat Int. 2015, 45, 147–155. [Google Scholar] [CrossRef]
  46. Todes, A. Shaping peripheral growth? Strategic spatial planning in a South African city-region. Habitat Int. 2017, 67, 129–136. [Google Scholar] [CrossRef]
Figure 1. Map of Israel with its principal cities (B), RLV by blocks based on all transactions during period 1998–2017 as a function of the distance from Tel Aviv (C) and zoom-in on RLV by blocks in the principal Israeli metropolitan areas (A).
Sustainability 13 05722 g001
Figure 2. RLV by urban blocks during two periods. A focus in the Tel Aviv metropolitan area during 1998–2007 (A) and 2008–2017 (B).
Sustainability 13 05722 g002
Figure 3. RLV by urban areas based on all transactions during two periods as a function of the distance from Tel Aviv. 1998–2007 (A,C), 2008–2017 (B,D) at two aggregation levels, urban blocks (A,B) and municipal areas (C,D).
Sustainability 13 05722 g003
Figure 4. RLV differences between both periods [1998–2007 and 2008–2017] at two aggregation levels, urban blocks (A) and municipal areas (B).
Sustainability 13 05722 g004
Table 1. Descriptive statistics of the transaction’s dataset.
All TransactionsDetached HousesApartments
Number of transactions996,576106,248890,328
Average price [NIS]1,573,9372,163,1361,503,625
Average dwelling size [square meters]94.19148.9787.65
Average property age20.8119.8820.93
Average number of rooms3.814.983.68
Table 2. Descriptive statistics of the transaction’s dataset.
MeanStd. Dev.Min.Max.
Number of transactions per block342412304732
Calculated RLV [NIS]13,965910537270,927
Distance from Tel Aviv [km]51450.028283
Table 3. Descriptive statistics of the aggregation of all transactions by blocks during two different periods [1998–2007 and 2008–2017].
MeanStd. Dev.Min.Max.
Number of transactions per block in period 1260279303671
Number of transactions per block in period 2235253302845
Calculated RLV per block in period 1 [NIS]98026080114753,037
Calculated RLV per block in period 2 [NIS]17,03111,3212469109,212
Distance of blocks from Tel Aviv [km]43390.028283
Number of transactions per municipal area in period 138757104323671
Number of transactions per municipal area in period 2403559273831,813
Calculated RLV per municipal area in period 1 [NIS]85994183190723,525
Calculated RLV per municipal area in period 2 [NIS]14,1705653372434,974
Distance of municipal area from Tel Aviv [km]55431280
Table 4. Regression results of RLV by urban blocks and municipal areas as a function of the logarithm of the distance from Tel Aviv.
DistanceConstantR SquareN
RLV by block
difference between periods
[−2942.26] ***17,137.86 ***0.18741532
RLV by municipal area
difference between periods
[−1032.15] ***9563.64 ***0.1535118
*** Significant at 0.01.
Publisher’s Note: MDPI stays neutral with regard to jurisdictional claims in published maps and institutional affiliations.

