
Development of a Decision Support System Framework for Cultural Heritage Management


1
Management & Economics Research Group, Department of Engineering, Università degli Studi di Palermo, Viale delle Scienze, 90128 Palermo, Italy
2
Department of Management, Mathematics and Mechanics, Politecnico di Bari, Viale Japigia 182/B, 70126 Bari, Italy
*
Author to whom correspondence should be addressed.
Sustainability 2021, 13(13), 7070; https://0-doi-org.brum.beds.ac.uk/10.3390/su13137070
Submission received: 31 March 2021
/
Revised: 7 June 2021
/
Accepted: 10 June 2021
/
Published: 23 June 2021
(This article belongs to the Special Issue Sustainable Marketing Management)
Abstract
:Decision support systems (DSSs) have been traditionally identified as useful information technology tools in a variety of fields, including the context of cultural heritage. However, to the best of our knowledge, no prior study has developed a DSS framework that incorporates all the main decision areas simultaneously in the context of cultural heritage. We fill this gap by focusing on design-science research and specifically by developing a DSS framework whose features support all the main decision areas for the sustainable management of cultural assets in a comprehensive manner. The main decision-making areas considered in our study encompass demand management, segmentation and communication, pricing, space management, and services management. For these areas, we select appropriate decision-making supporting techniques and data management solutions. The development of our framework, in the form of a web-based system, results in an architectural solution that is able to satisfy critical requirements such as ease of use and response time. We present an application of the innovative DSS framework to a museum and discuss the main managerial implications and future improvements.
1. Introduction
Cultural heritage can be everything tangible and intangible that constitutes evidence of the value of a civilization. This category can include objects of art, books, documents, everyday objects, clothes, scientific instruments, opera foundations, museums, theatres, festivals, archives, and archaeological sites. It can also encompass parks, libraries, churches, and monuments of various kinds and types. In spite of the notable pre-COVID-19 growth of the travel and tourism sector [1], the fragmented nature of information on cultural heritage has made it difficult to plan strategic actions based on empirical evidence with the aim of increasing the economic and social sustainability of cultural heritage systems [2]. This leads to a lack of evidence-based strategies, inefficient use of resources, and missed opportunities, which make it difficult to face the current and future challenges of recovering from the COVID-19 pandemic and preserving and promoting cultural assets in an economically, environmentally, and socially sustainable way, as well as making heritage education accessible, participatory, and cross-cultural (e.g., [2,3]). These challenges, along with the increasing complexity and variety of management operations and their difficult analysis and control, give rise to the need for Information Technology (IT) tools that are capable of supporting the decision-making process for managing cultural heritage.
Decision support systems (DSSs) have been traditionally identified as useful IT tools in a variety of fields, including the context of cultural heritage [3]. DSSs have indeed been shown to be able to confer competitive advantages [3]. They successfully increase organizational control and individual productivity through their ability to manipulate data accurately and consistently [4]. In addition to this, they reduce costs and facilitate the identification of measures that make a process more efficient and productive, creating useful scenarios [3,5,6,7]. DSSs reduce work time by helping users to plan efficiently and improve the level of customer engagement, thus saving time and money [8,9,10]. For instance, in the construction industry, DSSs have supported downtown development while preserving existing cultural buildings, identifying restoration priorities constrained by a predefined budget, defining adaptive reuse strategies, and analyzing and storing information regarding changes in the historical building layout [3,5,6,11,12,13]. In the sustainable environmental context, Trovato et al. [7] have designed a system that aims to help in landscape decision making for the protection of natural and cultural heritage. Other DSSs have supported decisions for museum institutions by presenting graphs, statistics, and maps on visitor movement, optimizing exhibition project planning for art museums, capturing visitor data, and evaluating candidates for museum ambassador roles [9,10,14].
However, to the best of our knowledge, the extant literature has developed DSS frameworks for cultural heritage management that exclusively focus on specific decision areas/problems without taking a comprehensive perspective that simultaneously incorporates all the main decision areas of interest for a manager in the cultural heritage environment. To fill this research gap, improve the decision-making process in the context of cultural heritage, and better respond to the above current and future challenges in this environment, this paper focuses on design-science research [15] and develops an innovative DSS framework for the sustainable management of cultural assets as one output of an ongoing research project: the IDEHA—“Innovations for data processing in the Cultural Heritage sector”—project (code ARS01_00421, http://www.ponricerca.gov.it/opportunita/progetti-di-ricerca-industriale-e-sviluppo-sperimentale/cultural-heritage/ (accessed on 11 June 2021)), a large nation-level Italian research program funded by the Ministry of Education, University, and Research. Specifically, we propose a DSS framework based on the study of the macro-processes of cultural heritage work, including the analysis of the interconnections between them considering the logic of the access and valorization of cultural heritage, the management of cultural heritage, and the examination of significant professional profiles. The main decision-making areas considered in our study include demand management, segmentation and communication, pricing, space management, and service management. In each of these areas, we identify the crucial issues and design the tools and methodologies that can support cultural heritage managers in making interrelated decisions. In some cases, we rely on tools that already exist in the literature and combine them in a novel way. In some other cases, we develop them ad hoc.
We highlight that our study is fully connected to sustainability issues. Indeed, maintaining active and functioning cultural assets is the foundation of cultural sustainability, i.e., preserving cultural heritage, beliefs, and practices. Sustainability involves “ensuring the continued contribution of heritage to the present through the thoughtful management of change” that is “responsive to the historical environment and the social and cultural processes that created it” [16]. In the same vein, the “sustainable management of cultural heritage is considered important not just in guiding decisions about heritage conservation but most of all in offering the necessary long-term and holistic framework for interpreting how economic, social, cultural, and biological systems fit together” [17]. DSSs help achieve this goal by supporting managers to make the best decisions for the given cultural heritage site and as such are capable of increasing social and economic sustainability [3,18]. Having an active cultural asset means ensuring equitable and inclusive education and promoting worthwhile work. A DSS can promote economic sustainability as the manager can leverage resources, investments, technological development, and institutional changes in harmony.
We select museums as our setting given that they incorporate numerous economic, cultural, social, and sustainable aspects that require careful decision making from the manager side and due to their clear relevance. The system is designed to support the intuition of the museum manager with the possibility of obtaining useful information from a strategic–operational point of view, as well as meeting the need for the improvement of the daily management decision-making processes in the industry. The designed DSS aims at assisting relevant specific museum issues. The decisions that the system supports involve monitoring average visitor inflow and future values through demand forecasting. It aids in the development of effective strategies that consider the preferences and differences of individual visitors with the use of segmentation. The DSS suggests the optimum selling prices of admission tickets in a way that ensures a fair balance between supply and demand. The system bolsters the maximization of the number of visitors simultaneously within the museum by preventing congestion or underutilization of halls. Finally, it strives to ensure that the user has control over general museum information such as average visiting time, use of communication channels, hourly distribution of visits, and other useful information. To meet the characteristics of adaptability, flexibility, interactivity, efficiency, and ease of use of a DSS, the system has been conceived and developed as a Web Application. This choice has also allowed the advantages of distribution, updating, security, scalability, and access deriving from the Web App architecture itself to be embraced. Overall, our DSS framework and implementation can provide useful guidelines to researchers and practitioners on how to design DSSs in multiple contexts of cultural heritage management.
The remainder of the paper is organized as follows. In Section 2, we review the relevant literature on DSSs. In Section 3, we propose our DSS framework. In Section 4, we apply and implement our framework to the case of museums. In Section 5, we provide managerial implications in the context of cultural heritage, and in Section 6 we present the conclusions.
2. Literature Review
Decision support systems emerged from the strong interest generated by the development of personal computers, computer networks, large database systems, and the strong expansion of computer-based models.
From the analysis of recent literature, several DSS definitions have emerged. In 2003, Marakas [19] defined it as: “A decision support system is a system under the control of one or more decision makers that assists in the activity of decision making by providing an organized set of tools intended to impose a structure on portions of the decision-making situation and improve the ultimate effectiveness of the decision outcome”. More simply, in 2005, Turban et al. [20] describe it as “... an approach for support decision-making” and finally, in 2007, Morge [21] identified DSSs as “computer-based systems that support decision-making activities including expert systems and multi-criteria decision analysis”. In essence, a DSS is a computer architecture that helps the user to make decisions but without substituting him/her. It does not provide an optimal solution, and even if it does, such a solution is then evaluated by the manager who is the final decision maker—that is, a DSS stands in the middle of the decision-making process as a decision aid. The DSS uses a data processing system and an information management system to interactively provide support. In the system, all the information needed to understand the issue is always available. It is possible to explore the data from different points of view according to the user’s needs. Additionally, a user can evaluate the scenarios resulting from the choices. Similar to the above definitions, Nelson Ford [22] suggests that a DSS is an interactive system that helps decision makers utilize data and models to solve unstructured or semi-structured problems. As such, it differs in terms of objectives, operational differences, and users, from Expert Systems (ESs), which are instead problem-solving computer programs that achieve good performance in a specialized problem domain that is considered difficult and requires specialized knowledge and skills. Similar differences are pointed out by Pfeifer and Lüthi [23].
As we can notice from the above definitions, they do not give an absolute description of what a DSS consists of. However, they define the general characteristics of a DSS. According to Turban et al. [20], a DSS functions as a support for decision makers, mainly in semi-structured and unstructured situations combining computerized information and human judgment. The DSS should provide support to all decision makers at each management level and try to integrate levels [20]. Moreover, the decision is the result of a negotiation between several individuals, so it must support communication between decision makers. A fundamental element that a DSS must have is adaptability and flexibility over time, i.e., it should accommodate a range of decision-making styles and processes [20]. Finally, Turban et al. [20] suggest that a DSS provides access to a diversity of data sources, formats, and types because one can use a DSS as a stand-alone tool for a decision maker or it can be deployed within an organization using the web and network technologies.
While adhering to the general definition, many DSSs have distinctive features that create classifications. In 1980, Alter proposed a taxonomy of DSSs based on the degree to which output can directly determine the decision. It is related to a spectrum of generic operations that can be performed by a DSS [24]. Alter [24] conducted a field study of 56 DSSs that he classified into seven distinct types: file drawer system, data analysis system, analysis information systems, accounting, and financial models, representational models, optimization models, and suggestion models. The increasing emergence of more and more diverse DSSs allowed reformulating of the taxonomy proposed by Alter [24] to keep the number of categories manageable in a new modern framework, consisting of data-driven, model-driven, and knowledge-driven DSSs [4].
The above discussion refers to DSSs in general. However, this paper focuses on the development of a DSS framework for cultural heritage management. Then, a natural question in our context relates to the role of DSS in the management of cultural heritage. In this regard, Prieto et al. [3] have developed a system that can help in the city center’s development, as it tries to develop global urban preventive conservation strategies capable of minimizing heritage buildings’ deterioration and reducing the cost of isolated interventions against hazards through urban plans and preventive conservation programs. Taking into consideration tangible and intangible cultural heritage, this tool includes a multi-scenario analysis, assessing environmental risks. It considers static-structural risks together with historical data related to the monuments’ life cycle, based on historical records, assessing the degree of vulnerability of the building over time [3]. Kim et al. [11] have analyzed how decision makers or executors often make decisions on which heritage is prioritized to be restored within the limited budget. However, very few tools are available to determine appropriate restoration priorities for the diverse historical heritage, perhaps due to a lack of systematized decision-making aids [11]. Their study proposes an alternative decision support model to prioritize restoration needs within the executable budget, through a model constructed on the stochastic analytic hierarchy process (S-AHP) and knowledge-based experience curve (EC) [11]. In the construction industry field, the identification of appropriate artifact restoration activities, especially for cultural properties, depends on the prior experience of the workers and companies involved [5]. The increasing number of restoration projects dictates the need to support experience-based problem diagnostics and facilitate the identification of appropriate restoration measures [5]. Grama et al. [5] designed an application as a case-based reasoning decision support system. This DSS allows the user to describe the current problems and proposes similar cases, previously stored in the database, and the actions taken in those situations [5]. In this way, it helps the user to identify the causes of defects and appropriate corrective actions using specific knowledge from previous experiences to solve new problems, in a very similar way to how humans rely on their previous experience [5]. The European Union identifies the cultural heritage of cities as the main driver of development strategies. From this perspective, adaptive reuse can play a decisive role in terms of increasing the life cycle of heritage and as an urban strategy that is capable of generating new economic, cultural, and social values.
Della Spina [12,13] has proposed a decision support tool, which constitutes an integrated evaluation model. It is based on the combined use of multi-criteria techniques and economic-financial analysis, with the aim to classify the adaptive reuse strategies and define the most suitable scenario of an unused cultural heritage asset. Mustafa et al. [6] have highlighted the potentials of Building Information Modelling (BIM) as a decision support system for cultural heritage management. Their paper finds that by modeling the information captured by the 3D laser scanner and utilizing the existing data, BIM is capable of helping managers to retrieve, analyze and store important information in a more efficient and productive process, focusing on the changes in the historical building’s layout [6]. Additionally, in recent years, the intensification of tourism, the rapid growth of urban settlements, rural abandonment, and the adoption of various agricultural techniques are profoundly and rapidly changing the landscape character of the eastern Mediterranean [7]. A landscape risk assessment model (LRA) and a decision support system (LDSS) have been developed through the MedScapes-ENPI project [7]. The “LRA-LDSS” model aimed to develop a tool that helps in landscape decision making for the protection of the natural and cultural heritage of the eastern Mediterranean area [7]. This DSS model has been developed to enable users and stakeholders to generate useful scenarios in the planning process of selected areas and for landscape risk assessment [7].
Some studies have focused on museums specifically. Ali et al. [8] implemented a geographic information system (GIS), which is among the foremost useful sorts of DSS, to support the tourism sector and the activity of museum tourism in Khartoum, Sudan. It is a comprehensive application that presents geoinformatics data of the city and its analyses and outputs, such as histograms of visitors in previous years and the probability of visitors to disperse [8]. Additionally, this system provides comprehensive decision support for the province of Khartoum: it does not only offer a subsidy to local tourism planners, resulting in reduced working time, but also helps tourists to efficiently plan their tourist trip to Khartoum by providing useful information on accurate maps, statistics, and virtual reality images [8]. In the same vein, Lee et al. [14] have realized a DSS model to optimize scheduling exhibition projects for art museums. During 2003–2008, only 55% of the area of all galleries in the Taipei Fine Arts Museum was utilized [14]. When it comes to the performance and utility of an art museum, the goal of exhibition scheduling is to maximize the percentage usage of the total gallery area [14]. As the combinations of possible exhibitions for all galleries at any given time are numerous, it is challenging for the art museum’s planner to make an optimal decision [14]. Thus, they have developed a decision support model using genetic algorithms, called SCHeduling Exhibitions for Museum of Art (“SCHEMA”), where the galleries are the resource that the exhibitions utilize in the sequence of their priority values [14].
A museum should be aware of several factors that can improve its services, and one of these is the experience of visitors during their visits. Budiarto et al. [8] have proposed a new approach to monitoring the behavior of museum visitors through the implementation of a computer vision software called “Eyeface”. The software was used to capture visitor data, including demographic information and engagement level data [9]. It performs the functions of a DSS, as its data are used by the museum to reorganize its exhibition, which can improve the level of visitor engagement [9]. Moreover, a DSS for museums was designed for the purpose of evaluating candidates to fill the role of museum ambassador [10]. Using the TOPSIS multi-criteria method, such a DSS is able to determine the most suitable candidate, saving time and money for selection [10].
As pointed out earlier, the above studies in the context of cultural heritage (e.g., museums) focus on specific decision areas/problems and, to the best of our knowledge, there is no prior study developing a DSS framework that incorporates all the main decision areas simultaneously in the context of cultural heritage. We fill this gap by grounding our study in design-science research [15] and by developing a DSS framework, whose features support all the main decision areas for sustainable management of cultural assets in a comprehensive manner.
3. Decision Support System Framework
The DSS framework for cultural heritage management presented in this study has been developed within the “Innovations for data processing in the Cultural Heritage sector”—IDEHA—project (code ARS01_00421, http://www.ponricerca.gov.it/opportunita/progetti-di-ricerca-industriale-e-sviluppo-sperimentale/cultural-heritage/ (accessed on 11 June 2021)), a large nation-level Italian research program funded by the Ministry of Education, University and Research. The project focuses on developing innovative IT tools for data processing and management in the cultural heritage sector and is developed nationwide through collaboration with numerous universities, research institutions, and private companies. The proposed DSS framework aims to support organizations and companies interested in cultural heritage and museum management, aiding the adoption of scientific criteria and policies for the planning and management of daily operations, thus minimizing the risks of losses for cultural assets. Cultural heritage is a prominent sphere of socio-cultural processes and must be managed in a sustainable manner, generating real economic and social benefits for their local host communities [25]. To achieve our aim, we implemented the steps represented in Figure 1, which are extensively discussed in the following subsections together with their relative outputs. The overall result of this process is the proposed DSS framework for cultural heritage management reported in Figure 2, the details of which are discussed in the next subsections as well.
We wish to highlight that our approach verifies the guidelines of Hevner et al. [15] for design-science research, which must produce a viable artifact in the form of a construct, a model, a method, or an instantiation [15]. Specifically:
- We developed and implemented a DSS framework into a real DSS prototype for cultural heritage management. Thus, we meet the first design-science research guideline of producing a viable artifact, given that our study focuses on developing a framework and a prototype of DSS for the cultural heritage context.
- The second guideline is related to problem relevance, suggesting that the technology-based solutions have to deal with important and relevant business problems. The problem addressed by this study is certainly relevant because we are developing a DSS framework with a number of features that support important decisions for sustainable management of cultural heritage, as discussed in the Introduction and Literature Review sections.
- Third, the utility, quality, and efficacy of a design artifact is demonstrated because the prototype is already implemented and available as one of the outputs of the national research project carried out by numerous universities, research centers, and cultural heritage institutions, as mentioned earlier in this section.
- Fourth, regarding the research contribution guideline, we contribute significantly because in the extant literature there is lack of a DSS framework that comprehensively takes into account the main decision areas of interest for a manager in the cultural heritage environment.
- Fifth, regarding the research rigor, our approach is rigorous because we performed extensive research to develop the most suitable framework for the context of use, i.e., cultural heritage, and took into consideration the main approaches utilized in the literature in the field of DSSs with respect to both the models/techniques and the architectural structure/solutions, as extensively described below in this section.
- Sixth, the design follows a search process (sixth guideline) as architectural solutions and techniques are grounded in a rigorous study of existing DSSs for cultural asset management and in the iteration of the cycle of observed system use and impact, problem identified, and solution posed and implemented.
- Finally, regarding the last guideline, i.e., communication of research, there are activities carried out in this respect, because, as we have pointed out, this research is part of a larger national research project on information technology in cultural heritage funded under a competitive national research program in Italy and carried out by numerous universities, research centers and cultural heritage institutions. Therefore, both technology-oriented and management-oriented audiences are (and will be) involved in the dissemination of the results.
3.1. Background Study
The first step in the development of this DSS framework is to explore the context where the system will operate. In this regard, we follow the macro-processes categorization of International Concilium of Museums [26], which consists of the following traditional macro-processes of work that characterize the field of cultural heritage: “Identification and protection of cultural heritage”, “Access to and valorization of cultural heritage”, “Conservation of cultural heritage”, “Management of cultural heritage” [26]. The processes most closely related to our DSS framework development are the last two. For each of the four macro-processes, the areas of activity (ADA) and the related activities were identified, in line with the same guidelines provided by the International Concilium of Museums [26]. In particular, with regard to “Access to and valorization of cultural heritage”, the following areas of activity [26] have guided us in the identification of the most important decision-making areas at an operational level for our DSS:
- ADA 2.1 “Enhancement of cultural heritage” includes everything that regards the definition of the institutional mission and the care of relations with other institutes, bodies, and external stakeholders. It also concerns the design of routes and spaces, such as the definitions of exhibition criteria and the design, evaluation, updating of information systems, including IT;
- ADA 2.2 “Promotion of cultural goods and services” deals with the analysis of the demand and supply of cultural services and the definition of the marketing plan for communication and promotion;
- ADA 2.3 “Design and implementation of cultural activities” deals with the activities of defining objectives, identifying resources and constraints, planning, and taking care of administrative aspects.
With regard to “Management of cultural heritage”, the following area of activity [26] has guided us in the identification of the most important decision-making areas at an operational level for our DSS:
- ADA 4.1 “Management of the cultural institution” includes everything related to planning and management of services, spaces, safety, goods and resources, as well as the design of the cultural project of the institution.
3.2. User Identification
An in-depth analysis of cultural heritage workforce was necessary to determine the user identification. Concerning professional profiles, to define a unitary reference framework for the certification of professional skills, in Italy, Legislative Decree no. 13 of 2013 launches a reorganization of the system of professional qualifications, in line with the European Union system. Each region was assigned a certain professional field and the Lazio region has been given the task of defining the professional profiles of culture [26]. From the analysis of the professional profiles, now there is no specific training path and the numerous existing degrees do not offer the possibility to obtain adequate training in the cultural field and museology [26]. The necessary skills are acquired through field experience or training days, conferences, congresses, and/or masters, but the diversity of these learning methods does not guarantee the homogeneity skills, leading to a high degree of specialization, but lacking a general vision [26]. With specific regard to museums, the organizational model of state museums identified by the Ministerial Decree of 23 December 2014 envisages, in addition to the directorate, the presence of four functional areas: care and management of collections, study, teaching, and research; marketing, fundraising, services, and public relations; administration, finance, and management of human resources; facilities, fittings, and security [26]. Additionally, it includes the following professional figures [26]:
- Director, who is the guardian and interpreter of the institution’s identity and mission, by the guidelines of the responsible administration. She/he is responsible for the cultural asset management as a whole, and the implementation and development of its cultural and scientific project;
- Responsible for mediation and educational services, who deals with educational projects, identifying communication and mediation methods, using appropriate and functional tools for the different target groups of the educational action;
- Responsible for the management and care of the collections, with responsibility for the conservation, security, management, and enhancement of the collections;
- Logistics and Security Manager, who is responsible for activities aimed at ensuring the safety of people and properties, both movable and immovable;
- Communicator, who is the person who has to observe the correct and adequate communication of the mission, information about the heritage and its activities;
- Digital Strategy Director, a transversal professional profile who designs, supports and coordinates the digital aspects related to the management, conservation, communication, and accessibility.
The user of the DSS will be the director, called the manager from now on, because thanks to her/his responsibilities, she/he has a comprehensive understanding of the cultural heritage. Moreover, this is in line with the typical user of a DSS, which needs to be an apical figure of the organization, according to Nelson Ford [22].
3.3. Decision Areas Definition
Based on the careful analysis of the above areas of activity as well as the activities of main professional profiles in cultural heritage (and specifically museums), we have focused on five critical types of decisions in this context: demand management, segmentation and communication, pricing, space management, and service management. In particular, we have focused on the issues of:
- Matching supply and demand, by forecasting visitor demand using the recurrent neural network time series method;
- Development of effective strategies through knowledge of the audience, utilizing visitor segmentation based on the joint application of Silhouette analysis and the K-means method;
- The ticket pricing, constructing the demand curve based on data;
- Congestion or underutilization of halls, through the special formulation of an optimization model that allows the artworks to be arranged in the different halls to maximize the number of visitors at the same time;
- Availability of an overall view of the cultural heritage’s management, thanks to the design of a dashboard with a clear and simple information section.
From the careful examination of the cultural heritage context during the execution of the national research project, these issues turned out to be the most relevant ones among the managerial issues. In the next section, we deepen each of the above decision areas by discussing the techniques utilized to facilitate the decision-making process of the manager in these decision areas.
3.4. Choosing Techniques
3.4.1. Demand Management
The term “Demand management” refers to support of all those decisions aimed at maintaining, increasing, and even sometimes decreasing the visitor number to overcome: (a) excess demand, where the level of demand is higher than budgeted, leading to congestion of space and services; (b) an oversupply, where the amount of demand is less than desired, which may indicate financial loss.
The forecast is useful to anticipate the effects of decisions made today that will produce results over time.
The first step is to understand and define the objective of forecasting, which, in this specific case, is to provide a forecast of the number of visitors. With demand forecasting, the DSS does not provide a solution to the problem of excess supply and demand, but only a tool for monitoring them. It will be the responsibility of the user to analyze the influential factors—that is, the demand forecasting provides information about the correct course of tactical actions and strategies and can help the manager understand more easily if corrections are needed.
After that, in the second step, the main factors influencing the demand forecast have to be identified. They should include general market conditions and the state of the economy, the competitors’ actions, technological innovation, and changes in consumer tastes. For instance, there is a positive trend towards the enjoyment of culture, which increasingly puts consumers at the center and makes itself a dynamic place with the support of digital devices. Augmented reality (AR) and virtual reality (VR) applications make the user an active protagonist of stories and paths capable of conveying the sense of places with an immediate language. With these systems, cultural heritage visitors can explore their surroundings enjoyably [27]. Researchers also argue that the interaction between the visitor and AR systems contributes to a richer viewing experience, which leads to a co-creation of experience [27]. Moreover, these tools can help when the visit is not accessible to the public. Häkkilä et al. [28] carried out the prototyping and evaluation of a virtual visit to the historic cemetery of Salla from World War II, which is located in an inaccessible border area between Finland and Russia. Their VR aimed to create as accurate a simulation as possible of the cemetery, including its atmosphere; users can navigate the virtual cemetery and place a candle on a grave [28].
The third step is to choose a forecasting method. There are different types. Forecasting techniques can be categorized into four general types of methods or procedures: (a) qualitative, mainly subjective, which is based on the collection and analysis of judgments and opinions; (b) time series, using historical demand data: statistical and adaptive; (c) causal or econometric, use relationships between demand and other factors to develop the forecast; (d) simulation, which mimics consumer choices and/or combines time series and causal methods.
When selecting and evaluating the applicability of a particular method, the literature suggests analyzing many factors, such as the convenience, which is easy and inexpensive but risky, the market popularity, what others are doing, and the structured judgment, which experts recommend [29]. Additionally, the statistical criteria, the relative track records, and the guidelines from previous research have to be considered [29]. Based on these criteria and a literature review, the following time series forecasting methods were considered: autoregressive integrated moving average (ARIMA), Seasonal Auto Regressive Integrated Moving Average (SARIMA), and Long short-term memory (LSTM). While all these methods are valid and exhibit both advantages and disadvantages, we opted for the latter method for the simplicity of implementation in the DSS under a deep learning logic. Indeed, long short-term memory networks are particular recurrent neural networks (RNN) utilized in the sector of deep learning. Unlike classic feed-forward networks where the data provided are static, the type of data that the RNN is capable of processing is a time sequence or time series [30]. In essence, the LSTM is a recurrent neural network where “the basic unit in the hidden layer of an LSTM network is the memory block, which contains one or more memory cells and a pair of adaptive, multiplicative gating units which gate input and output to all cells in the block” [31]. The advantage of LSTM over standard RNNs is as follows. The standard RNNs fail to learn in the presence of time lags that are not particularly small, e.g., greater than 5–10 discrete time steps between relevant input events and target signals [30,31]. In contrast, LSTM solves complex time-consuming lag tasks that have never been solved by previous RNN algorithms because it is not affected by the back-flow errors [31,32]. Indeed, compared to RNNs, LSTMs have the advantage of learning long-term dependencies. Remembering information for long periods is practically their default behavior [30]. Their operation is based on the backpropagation algorithm, i.e., backward error propagation; the basic idea of this is to update the weights inside the network according to the error made in predicting the output. This value is calculated as the difference between the desired output value and the output value of the network for the same input. The goal is to minimize this error.
LSTM allows us to understand the relationships between the factors as it models the degree of influence exerted on demand by each of the different factors and to implement it over a shorter time. Additionally, it has a limited need for data [33]. On the other hand, although random methods have greater explanatory power, insufficient data would lead to a loss of this characteristic [33]. Moreover, tourism demand can be volatile and it is sensitive to catastrophic influences, e.g., COVID-19 [34]. As tourism behavior is complex, and there is a wide choice of variable forecasts, econometric-type models have often been found to be inaccurate [35]. Both random and non-random methods require a considerable amount of time and money. Practical considerations have shown that the ARIMA and SARIMA methods require careful data analysis for pre-processing, such as statistical parameters that require an end-user training background. To make the DSS framework more usable for managers, it was decided to omit the above-mentioned techniques and focus on LSTM. In support of our choice, Lee et al. [36] demonstrated that deep learning models can be successfully used to predict cultural visitor flow.
To ensure the accuracy of the prediction, the DSS processes the Root Mean Square Error (1) (RMSE) [37]. This is a widely used measure as it is an ideal measure for making business decisions through its easy interpretation: a lower RMSE value implies a better result. Additionally, the RMSE is a good measure for comparing models where the mean error is not zero because it penalizes the distortions arising from it [38]. The last peculiarity is the scale effect, i.e., its ability to “weigh” larger errors more heavily. Thus, the larger the difference between the predicted and the actual values, the higher the RMSE value and the lower the prediction accuracy. The RMSE is calculated as in (1).
where is the estimated demand in period t and is the actual demand in the same period. It is noteworthy that the DSS not only presents the demand management section for all visitors but, through an option, it is also possible to forecast demand for each type of ticket (full, reduced, group reduced, and free), thus allowing us to estimate the demand for different customer segments.
3.4.2. Segmentation and Communication
Nowadays, one of the most crucial aspects of the cultural heritage context is communication [39]. If you are not able to position your service or product, it will certainly not have a positive impact on the market. Therefore, it is necessary to study and understand the customers, i.e., the visitors. The communication process, also in the cultural heritage field, is an essential activity for the achievement of strategic objectives and the performance of management functions in an organization [40]. The most critical aspect is in the dialogue between the heritage and its visitors, given that it aims to contribute to the cultural growth of the community through the creation and transmission of knowledge [40]. This contribution must be based on a constant and profitable relationship. However, it is very difficult for a cultural heritage site to reach and attract all the consumers who could be part of its market because potential consumers are too numerous and diverse. They have different needs, wishes, and preferences. Therefore, cultural institutions will try to focus on their strengths and target particular consumer segments. They need to divide their market into segments, i.e., groups of individuals with similar characteristics that can be targeted with a similar marketing strategy [41]. Segmentation criteria are various. A good segmentation system can also be a combination of different factors, e.g., geographic and demographic ones [41]. In this case, from a careful analysis of the cultural heritage context, the main attributes that discriminate consumers can be summarized in:
- Socio-demographic and geographic aspects: sex, age, educational qualification and profession, geographic origin;
- General culture consumption: the number of museums, cultural heritage sites, exhibitions and theme parks visited; the number of screenings at the cinema, plays, musical concerts and dance performances attended; reading of books and newspapers; use of the internet and radio, and whether they actively participate in cultural activities;
- Cultural visit behavior: the visitor’s communication channels, frequency and motivation for the visit, the eventual reservation, the accompaniment, the (multimedia) supports used (e.g., audio guide), the type of ticket, the time and duration of the visit, participation in extra activities, the importance of themes and artworks, information materials, tours, ancillary services (cafeteria, souvenir store), and professionalism of the staff;
- Overall assessment of satisfaction regarding the visiting experiences.
The system should provide the user with the possibility of obtaining representative graphs of the groups of visitors and the characteristics associated with each group, and a graph of the averages of the attributes for each identified cluster should be displayed.
To obtain a clustering of the visitors based on the segmentation factors available from files appropriately loaded into the system, two statistical techniques were jointly used: Silhouette analysis and the K-Means method. The first technique is used to identify of the number of clusters. Such a number is then used by the second technique (i.e., K-Means algorithm), which allows one to obtain the profiles of the segments by computing the means of each segmentation variable for each cluster. Therefore, the combined use of these two tools happens in two steps: the Silhouette analysis provides the indication of the number of clusters, whereas the K-Means method uses such a number to come up with the allocation of units in clusters and the profiles of each segment.
Silhouette analysis is useful to determine the optimal number of clusters in terms of cohesion and separation, i.e., the measure of the “distance” between units within and between clusters, respectively.
The analysis involves calculating Coefficient (2):
where a(i) is the average dissimilarity of unit i calculated with respect to all other units assigned to the same cluster; b(i) is the minimum average dissimilarity of unit i calculated with respect to all other clusters. Its value is between 1 and −1.
Having this information and the number of clusters from the Silhouette analysis, the DSS moves on with the analysis through the K-Means method, whose goal is to minimize the total intra-cluster variance [42,43]. It is a non-hierarchical method, which allows a set of objects to be divided into K clusters based on their attributes. The literature has argued that K-Means clustering is a practical and useful tool for exploring differences among museum visitors. K-Means clustering is a well-accepted method in social science research, often utilized in data processing and social network analysis because it is an exploratory method, providing guiding results for further confirmatory research [42,43]. The output of the K-Means method is a graph and/or table in which the averages of each variable are reported for each identified cluster. Figure 3 reports an example with some of the previously described segmentation variables. In this case, the K-means algorithm allocates units (i.e., customers) in two clusters (this number is obtained by means of the Silhouette analysis) and provides the profile of two clusters showing the average values of the two clusters for each variable utilized in the segmentation.
These techniques allow the user to have a segmentation that allows them to understand the characteristics of customers and then choose a communication strategy that better matches such characteristics.
3.4.3. Pricing
To participate in the activities of the given cultural heritage site, visitors are very often asked to pay an entrance fee. For this reason, the third decision area is Pricing, which is based on traditional profit maximization. Based on classical micro-economic principles, the procedure for predicting the optimum price was formulated, calculated in a specific month of the year, selected by the user. Once the ticket type and date have been selected, the system, based on the uploaded historical data (including variable costs), will display the price–demand curve for each segment and the optimal price.
In detail, the following steps are followed:
- (1)
- Approximation of the demand function through a straight line using linear regression for each segment (e.g., full ticket, reduced ticket, group ticket). The use of linear regression is for simplicity because managers of cultural heritage often do not have statistical backgrounds.
- (2)
- Calculation of the profit function for determining the optimal price p from textbook micro-economics:where is the above demand function approximated through a straight line from linear regression and c is the marginal cost incurred by the cultural heritage organization.
- (3)
- Calculation of the first order condition π’(p) = 0 to find the optimal price given the estimated form of the demand and the marginal cost.
An example is shown in Figure 4. The equation of the regression line is:
and considering an estimated marginal cost of EUR 5, the optimal price of the full ticket is:
For this example of pricing decisions, we used a marginal cost of EUR 5 following an average indication provided from cultural heritage organizations. Of course, this value (as well as those of all other variables) can vary depending on the size and structure of the cultural heritage site. Each organization will use its own marginal cost.
Using this methodology and equipping the system with this tool allows the user to gain numerous advantages and support to her/his decisions. The price–demand curve is useful to monitor the presence of anomalous points in the price–demand relationship. Moreover, with the optimal price calculation, the user can better discriminate individual segments and adjust the price of the admission ticket. Practicing good price discrimination, through continuous data collection over time, helps make proper decisions to effectively reach targeted segments [44].
Knowing the optimal price ensures that the decision support system can help in improving economic performance. If the current price is lower than the optimal recommended price, the user might consider increasing it to likely increase profits. Conversely, if the current price is higher, the decision would be to decrease the price and run promotions to increase demand. Finally, price optimization is useful for predicting the behavior of potential buyers when the price of a product or service changes. We remark that the DSS yields an optimal price considering data-driven demand function and variable costs, but being the output of a simplified economic model, the final decision on which price to set for each segment of customers is left to the manager, who can always opt for the price suggestions provided by the DSS or use them as starting points for more informed decisions.
3.4.4. Space Management
The fourth decision-making area is defined as “Space Management”, which refers to the organization of the allocation of the artworks and the visit routes. The importance of this type of decision is pivotal as it favors a better visitor experience and more efficient work. Indeed, the main problem is related to the congestion of the areas that show high attractiveness and vitality with consequent positive economic impact but, at the same time, possibly worsen the quality of the visiting experience. The optimization model implemented in the DSS provides a valid support to the decision about the allocation of the artworks in the various halls in a way that congestion is reduced and attractiveness is maximized. However, as pointed out for the pricing decision area already, the manager has an extensive understanding of the context, considering, for example, the building floor plan and visitor routes, and she/he is the final decision maker that can take the arrangement of exhibitions provided by the DSS as a valuable suggestion to combine with more qualitative considerations.
Considering specific indices, the DSS has been designed to execute an optimization model able to establish the arrangement of the artworks by maximizing the number of visitors in the cultural heritage and at the same time satisfy the constraints imposed. The problem of placing the artworks was formulated in the form of a nonlinear programming model:
The objective function (6) is:
where artwork—, hall—, artwork category—, is a binary decision variable equal to 1 if the artwork belonging to set of artworks of the category is assigned to hall , 0 otherwise, and is an attractiveness index, which is based on historical data measures of the number of visitors attracted on average by a certain artwork, i.e., an indicator of the interest of visitors towards the i-th artwork.
The constraints below are the mathematical relations that describe the domain of the solution.
CONSTRAINT 1: each artwork must be assigned at most to one hall only (7):
CONSTRAINT 2: artworks placed in the same hall must not exceed the occupiable hall space (8):
where and are the occupancy indices of the artwork and the hall, respectively. The first is obtained by considering the sum of the 𝑚3 of the artwork itself and the volume measured around it to avoid the artworks being too close together and to the public; the second is the available 𝑚3 of the hall itself. These values are normalized on a scale from 1 to 10, where 1 is the minimum value and 10 is the maximum value.
CONSTRAINTS 3–4: only artworks in the same thematic category may be placed in the same hall (9):
where are binary variables equal to 1 if the given thematic category is assigned to the hall and they are related to the variables through the following set of constraints (10):
where, with some reuse of notation, also indicates the size of each thematic category, i.e., the number of artworks belonging to the same category.
CONSTRAINT 5: each hall must have a maximum capacity equal to the maximum number of people it can accommodate () (11).
CONSTRAINT 6: the index of inflow of the single hall (12) is within a certain percentage P of the average index of inflow of all the halls (13–14). The last constraint allows us to take into consideration the arrangements of halls whose variance is less than a percentage of the average value that is considered acceptable to avoid large inflow unbalance. By indicating with the inflow index of the single hall and with the average inflow index of all the halls, we will have:
Then, the sixth constraint is:
To solve the formulated optimization problem, different methods, including genetic algorithms, have been used to solve the problem and check the goodness of the solutions by comparing it with the optimal solution obtained by enumerating all possible solutions.
3.4.5. Services Management
The last decision-making area, “Service Management”, serves to monitor the services that can be basic, complementary, and ancillary. The complementary services, i.e., those supporting the visitor, include pre-sales of entrance tickets, whereas the ancillary services cover the analysis of private activities and cafeteria. In sum, the system also provides information through graphs, for example, regarding the percentages of frequent visitors and the main communication channels. In particular, the dashboard refers to a set of graphical objects that, when structured and displayed in a certain manner, allow access at a glance to real-time and very important information, of different natures and complexity. Ease of reading and immediacy are therefore of fundamental importance. Therefore, the system must offer the possibility of extrapolating management information from the statistical graphs obtained from the uploading and processing of data. By integrating all the information in the system, the manager can come up with a decision regarding a particular service.
In the case of opening and closing hours, we are interested in how the user can view the time of arrival of visitors. The system creates a histogram showing the visitor number at each interval considered, to understand the times with the highest and lowest frequency. The study of the duration of the visit could provide food for thought, e.g., if the interval is too wide, one could consider reducing the number of artworks exhibited. The system presents the minimum, average, and maximum values of the duration of the visit. For communication channels, the user analyzes what and how much visitors know about the cultural site. By processing the information about the visitors’ number from each communication channel used, the system creates a pie chart: the size of the circular sector is directly proportional to the number of visitors received through that channel of communication. Additionally, the system presents a line graph for each alternative, showing the number of visitors over time.
The dashboard will help analyze additional activities or private events. The system displays a bar graph showing the type and number of participants of the events that took place in that month. The DSS extrapolates the information about the frequent visitors, i.e., the number of visitors who visit the cultural institution more than once, and shows a line graph containing the percentage of repeat visitors as time progresses. To avoid long queues at the ticket offices and the entrance, many institutions often decide to provide pre-sale and reservation services. This strategy is applied as well to obtain information about the expected demand. The system anticipates that the user wants to know the number of visitors, by segment, who use this service.
Finally, to offer a service that is as complete as possible, the cultural site is equipped with cafeteria (and souvenir store) services. After extrapolating and analyzing the information, the DSS displays the visitors’ number who use these services and their average expenditure. The DSS can create a bar graph showing the trend of these values.
3.5. Architecture Solution
The network architecture at the base of the DSS consists of a Client, a web server, and a Rest Server.
The web server acts as an intermediary between the client and the REST Server, i.e., the Client makes a Hypertext Transfer Protocol (HTTP) call to the web server and waits for a response. In turn, the web server, after properly processing the received data, issues a call to the REST Server, which performs calculation routines depending on the received request and returns the data in the form of JavaScript Object Notation (JSON) strings. Finally, the web server extracts the necessary information from the incoming data and transmits it to the client.
For the implementation of the software at the base of the system, we chose an integrated development environment widely used in web programming and the Java world. Such an Integrated Development Environment (IDE) is Eclipse. Thanks to the integrated features of Eclipse, it was easy to download and install the Apache Tomcat Application Server on which the Web Application modules were subsequently loaded. For the management and design of the system, Eclipse offers several build systems with different features and basic functionality. Among the tools taken into consideration, Maven was the best choice in terms of dependency management and updating. In Maven, the description of the build process, its dependencies on external modules and components, the order of operations, the directories and plugins needed, are carried out through an XML file. Maven automatically downloads all necessary Java libraries and plugins from one or more repositories (such as Maven2 Central Repository) and saves them in a local cache. Maven projects are configured using a Project Object Model, which is saved in a file called pom.xml.
For the realization of the back-end, in the case of the web server, the Java Enterprise Edition platform has been used. Therefore, the dynamic web Java Server page (JSP), Servlet, and the associated Java classes have been realized.
In the case of the Server Rest, it was decided to use the web micro-framework Flask, written in Python. Flask was designed to build RESTful and allowed to develop and integrate Python modules that contain the calculation routines implemented with the help of the different software libraries available in the machine learning domain. In addition, in order to guarantee the retrieval of information through REST requests, it was necessary to develop a server interface for the transfer of files through File Transfer Protocol (FTP).
For the realization of the code executed by the browser of the client device, we decided to use a free template named material dashboard based on HTML5, CSS3, and bootstrap and inspired by Google’s material design. Material dashboard makes use of lighting and motion effects. The overall layout resembles blocks on layers of different levels so that depth and order are evident. Navigation remains mainly on the left sidebar and content is on the right within the main panel. The individual pages are made dynamic by the use of the JavaScript programming language that allows scripts to be executed within the browser.
To manage data persistence and to perform data insertion, modification, and deletion queries, the relational Database Management System (DBMS) MySQL based on the Structured Query Language (SQL) query language was used. The database design phase was accomplished through the use of a free software package, called MySQL Workbench, which integrates visual tools for modeling, creating, and maintaining MySQL databases within a single environment. To obtain the database connection from the Java code, the Maven dependency for the Java Database Connectivity (JDBC) driver was inserted in the pom.xml file.
The need to develop machine learning algorithms has led to the choice and use of two main open-source machine learning libraries: Keras and Scikit Learn. Keras is a high-level neural network library, written in Python, able to run on TensorFlow or Theano and designed to allow rapid prototyping of deep neural networks. Additionally, Scikit Learn (sklearn) is a Python language library that provides algorithms for classification, regression, clustering, support vector machines, and others. The Keras library was used to build an LSTM network, while the Scikit Learn library was leveraged for clustering and linear regression algorithms. In addition to the machine learning libraries, the Jersey framework was used to create the REST service. This framework provides support for the JAX-RS API (JAVA API for RESTful Web Services) and serves as a reference implementation. For the extrapolation and manipulation of JSON data produced by the REST server, it was preferred to use the org.json library able to simplify the process of conversion of JSON strings to the object-oriented world. Finally, to implement the “Space Management” requirement, which provides support for the combinatorial calculation of the allocation of the artworks, we chose to use Itertools, a module present in the Python standard library.
3.6. Data Management
The functionalities implemented in the system require data from which to process the information to be shown to the user. Depending on the decision area and the selected technique, the data can be classified into the following categories: price–demand series, segmentation variables, space management, and numerical information for the dashboard.
In the current version of the DSS, except for the values relating to the artworks and halls, which can be entered manually into the system by the user, the system requires the data to be entered through a file in “CSV” format. This choice serves to impose a very precise arrangement and format of the data in addition to simplifying the operations of uploading and saving the data themselves.
Although the system helps ensure data consistency (for instance, providing warnings wrong formats), it is the responsibility of the user to make sure that the data are reliable, correct, and consistent. Indeed, the data regarding some input parameter may not always be reliable either because the actual value may be unknown due to uncertainty or because the user makes some mistake in data collection or saving. For instance, some data are obtained through a different software tool and are (automatically) uploaded in the system through a file. If the data are not reliable, the system can do little except highlight warnings in case of a wrong format. This is where the role of the user in checking the data becomes relevant. After all, the DSS does not substitute the user, but can support the decision-making process. In fact, in these cases, once the correct information becomes available, the user can always modify the data and re-run the analyses with the corrected value. Moreover, in the presence of uncertainty, the user can also hypothesize different scenarios with different values of one or more input parameters (e.g., what-if analysis) and see how changes in the parameters affect the outcomes.
However, we note that DSS does significantly help the user in decisions characterized by uncertainty. For instance, as explained, it supports demand forecasting and pricing decisions, which are by their nature characterized by the presence of uncertainty. Demand forecasting helps the user in having a reasonable idea of what demand to expect in order to organize operations. Similarly, pricing is a decision made under uncertainty as the optimal price depends on the expected demand. Thus, again, the demand forecasting supported by the DSS helps the user in finding a price to set in the presence of uncertainty.
Regarding the “Demand Management” decision area, it is necessary to provide the DSS with a file containing the historical series of data related to the demand trend over time. Each ticket type has a file including the time variable and the demand quantity. The data, which are displayed in the dashboard, include, among others:
- Number of visitors per hour, which links the time (hour) and the number of visitors (integer);
- Number of visitors per communication channel, which links the name of the communication channel (string) and the number of visitors (integer);
- Additional activities, which links the type of activity (string) and the number of participants (integer);
- Number of repeat visitors (those who have previously visited), which links time (date) and number of repeat visitors (integer);
- Presale flow by segment, which links time (date) and quantity of presale for each segment (integer);
- Number of visitors and average cafeteria and restaurant expenditure, which link time (date), amount of service visitors (integer), and value of expenditure (integer).
The fundamental input for the “Pricing” analysis is the file containing the price–demand series determined by the price (number) and demand (integer), distinguished for each ticket type and month of interest. This file will be naturally available to the given cultural heritage site from the historical records of demand (see above the demand management module) and ticket prices. From demand and prices series, a demand curve can be estimated, as discussed in the previous subsection. Together with the variable cost information uploaded using a similar file, the demand curve allows one to compute the price that maximizes profits.
As for the data needed for the “Segmentation and Communication” decision area, it is necessary to use variables that characterize the behavior of museum visitors. These are the variables identified in the Section 3.4.2. We assumed that these variables are derived from a survey. Indeed, in the cultural heritage sector, most of the surveys have been implemented mainly through this methodology—only 2% are observational surveys [45]. To ensure the validity of the data, the survey must be developed based on a systematic sample. The literature suggests the relationship between the number of visitors per year and the suggested sample size, Table 1 [46]. In our pilot study discussed in the next section, we considered an annual number of visitors of less than 5000 and a sample size of 100.
To determine the best location for artwork in the hall (“Space Management”), each hall is identified by: name, number of visitors accommodated, occupancy index, walkable sq.m. and total sq.m. On the other hand, the artwork is identified by name, artist, year, artistic period, thematic category, type of artwork, occupancy index and attractiveness index, as discussed in Section 3.4.4.
4. Case Study: Application to a Museum
According to UNESCO [47], the number of museums in the world has increased from 22,000 in 1975 to 95,000 today. This has resulted in a dramatic increase in cultural tourism in recent decades, and thus an increase in the movement of millions of people around the world [48]. For example, in 2019, the Louvre Museum in Paris had 9.6 million visitors, the National Museum of China in Beijing had 7.39 million, and the Vatican museums in Vatican City had 6.88 million [47,48]. Museums play a leading role in encouraging the creative and artistic economy locally and regionally [47]. They are also increasingly present in the social sphere, amplifying debate and discussion, tackling social issues, and encouraging public participation [48]. This is why museum institutions have been chosen as case studies.
At the beginning, a museum was viewed as a change of a private, honorable, or learned person’s collection that was shown to the public, especially to those concentrating to become artists. Although the didactic intent has always been inherent to museums, over the centuries, this aspect changed and disappeared. The museum has become a static place with the functions of conservation and custody. The current museum model, open to the entire society, dates back to the French Revolution and started to become a standard from the middle of the 19th century. Nowadays, the museum is defined as “a non-profit, permanent institution in the service of society and its development, open to the public, which acquires, preserves, researches, communicates and exhibits the tangible and intangible heritage of humanity and its environment for education, study and enjoyment” [49].
From the definition, the raison d’être of a museum is its connection with its collections, which makes it a permanent institution. It is supported by a well-organized organizational structure that follows well-defined goals and norms. The museum’s aims and profitability are measured differently and based on its functions of studying, preserving, communicating, and exhibiting the evidence of humankind. In brief, a museum has the tasks of: collecting, cataloging, studying, and preserving the collection. A museum organizes exhibitions, ordered according to a certain criterion and open to the public, conveys the symbolic value of the cultural heritage exhibited as well as makes the visit easy and pleasant by offering additional services.
Our DSS framework has been developed within the context of museums. The way the system is used by one or more users (actors) and the interaction between actors and the system is shown in the use case diagram, Figure 5. It does not describe the “internal logic” of its functionalities (which are instead presented in Figure 2) but the interaction between actors and the system and between the functions of the system (use cases) [50,51]. In this case, there is only one actor involved: the manager. The interaction between the manager and the system occurs in four main moments: login, the creation and/updating of an account or a museum, and the management of the museum, which are the main use cases. These are connected among themselves and with other use cases through two types of relationships: “include” and “extend”. The use case “include” is a directed relationship between two use cases which is utilized to show that behavior of the included use case (the addition) is inserted into the behavior of the including (the base) use case. For example, from Figure 5, the use case “Calculate price” is included in the use case “Manage Museum”. “Extend” is a directed relationship that specifies how and when the behavior defined in a usually supplementary (optional) extending use case can be inserted into the behavior defined in the extended use case. For instance, from Figure 5, the use case “Update Account” turns out to be optional with respect to “Login”.
The system functionalities defined during the framework analysis phase are highlighted. The start page is the login page that allows access to the system by entering credentials in a form. Once logged in, the system redirects the user to the museum’s management page, where it is possible to access a selected museum and modify data, halls, and artworks and, also, a side navigation bar will be visible to access the main functions of the system, which relate to the main decision areas extensively discussed in Section 3. In fact, from Figure 3, forecast demand relates to demand management, segment visitors relates to segmentation and communication, calculate price relates to pricing, place artworks relates to space management, and view dashboard shows all plots and includes also services management. Next, the data upload page provides the user with the option to select files for processing external data, reminding her/him about the format that the data in the file must satisfy.
Using the dashboard, the museum manager can consult relevant information simultaneously. After selecting the relevant month, the DSS shows simple, colorful, and easy-to-understand graphs. In Figure 6, we show one example: the histogram of average visitors per hour.
The “Demand Management” section (Figure 7) contains the basic elements to query the system about the demand forecast, as extensively discussed in Section 3.4.1 and Section 3.6. The system will respond by showing a graph of the demand trend over time, and it will be possible to see how the trained model approximates the true data, taking into account that 20% of the uploaded dataset is used as a test set. In addition to the approximation obtained, the page shows the value predicted by the model, which is the day after the last day in the dataset and the RMSE error. To conduct our simulation exercise for the decision area demand management, data were retrieved from the statistics office of the Italian Ministry of Cultural Heritage and Activities and Tourism (http://www.statistica.beniculturali.it/ (accessed on 11 February 2021)), which provides by type of museum institute monthly gross revenue and monthly demand for paying and non-paying customers. Then, we followed the procedure already discussed in Section 3.4.1 and Section 3.6.
Figure 8 exhibits an example output of the “Segmentation and Communication” module, namely the clusters obtained using subsequently Silhouette analysis and the K-Means method and the cluster averages for the individual segmentation variables presented in Section 3.4.2 and Section 3.6.
In the “Pricing” decision area, Figure 9, after selecting the month and type of ticket and starting the calculation, the DSS displays the price–demand curve and the estimated optimal price, following the procedures discussed in Section 3.4.3 and Section 3.6.
The “Space Management” section initially shows a summary of the halls and artworks entered into the system. As illustrated in Figure 10, by scrolling down and clicking on the “Calculate” button, the system yields and reports the allocation of artworks to the halls, as the output of the optimization model provided in Section 3.4.4.
5. Discussion
According to Power [4], once a DSS is implemented, it creates a competitive advantage if used and becomes a strength of the organization, if the organization is the sole owner and if the advantage provided is sustainable for at least three years, which is possible in the context of cultural heritage where the use of information technology (IT) and that of managerial tools are not well-developed. DSS can potentially help a firm in creating an advantage by providing many benefits, including improving personal efficiency and reducing staff needs, expediting problem-solving and increasing organizational control [4]. In some cases, DSSs can reduce costs where decision makers have high turnover and training is slow and cumbersome, and in situations where activities, departments, and projects are poorly controlled [4]. For this reason, an advantage of our DSS is that it allows the user to organize, inspect, and control cultural heritage quickly and clearly. Additionally, DSSs can create a major cost advantage by increasing efficiency or eliminating value-chain activities, improving individual productivity [4], especially in an industry such as cultural heritage where managers do not typically have business education backgrounds. One of the ways people can become more effective decision makers is to help them be more efficient in manipulating data, in improving consistency and accuracy, and to allow them to spend more on the substantive aspects of the jobs [4]. In this regard, our DSS has the advantage of having easy-to-read charts and easy-to-understand technique outputs. The DSS allows a person either to perform the same task in a shorter time or perform the same task more thoroughly in the same time span [22]. Moreover, a DSS can be used to help a company in better focusing on a specific customer segment, thus leading to an advantage in meeting that segment’s needs [4]. By tracking customers, a DSS can make it easier to serve a specific customer group with targeted services [4]. Our DSS framework, for instance, incorporates segmentation techniques that are at the core of segmenting the market and targeting specific customer segments.
In spite of the positive managerial implications above, there is still some resistance in the use of DSS in the context of cultural heritage. First, as we have mentioned above, managers may have insufficient computer training, and training cost could be higher than the competitive advantage achieved [4]. Second, some managers argue that using a DSS will decrease their status and force them to do a secretary’s work. Nevertheless, using a DSS is not the job of a secretary or personal assistant [4]. Third, many DSSs increase information overload, which may be a major problem for managers who already receive too much information [4].
There are various improvements and future research works that can be made. In our context, it will be necessary to monitor the innovative DSS during its application in the working environment of a museum. This means analyzing how it improves business performance through specific indicators and detecting what type of tools are the most used and which ones are difficult to understand. One disadvantage is that, in some circumstances, the user will have to find the data externally and enter it into the system as a file, making sure that the data are reliable and have acceptable consistency, especially in case of data uncertainty (though the system helps in this regard warning, for instance, about wrong formats). While in some cases this issue is unavoidable, as explained earlier, such limitation offers room for future developments. For instance, a potential solution to these problems (at least partially), which the project IDEHA is working on, consists of using some sensors inside the museum, whose main task is to receive and accumulate data on visitors, artworks, and halls within a special database. It is possible to install a Bluetooth sensor within each detectable area, called a node (in this case, the area around an artwork). Each time the visitor’s mobile device enters in a detectable area, the sensor will continue to receive a signal output from the device until the tolerance distance is exceeded. The sensor will record the time between the instant of check-in and the instant of check-out. The difference between these two moments will be the dwell time that is used for the algorithm of placing the artworks in the halls. Future research could also focus on incorporating tools in parallel or allowing the use of different methods for predicting demand. Finally, the efficiency of the decision support system could be increased by training machine learning models with larger datasets as well as using more complex models, which include, for instance, real options [52].
6. Conclusions
In this article, we have proposed and implemented (at the level of prototype) an innovative and comprehensive DSS for the management of a cultural asset (e.g., a museum) that is able to simultaneously consider all the main decision areas in a fairly simple manner, supporting the decision maker constantly. Our approach identifies tools and techniques that support the economic and social structure of a cultural organization through demand management, optimal pricing, space management, and visitor segmentation, respectively. Overall, this paper helps clarify which characteristics a DSS framework for cultural heritage should possess to be as complete and effective as possible while being very simple and user-friendly at the same time. Moreover, this paper also explains how the DSS framework should be implemented in practice.
The development, in the form of a web-based system, resulted in an architectural solution that includes a client, a web server, and a REST server. This choice has allowed us to satisfy some critical requirements such as ease of use, response time of the system, modularization, and scalability. It has made it possible to offer a diversified service, as well as a valid aid for museum management and strategic operational decisions. The product is a system that meets the needs of improvement of decision-making processes that are carried out at the strategic level by the cultural heritage manager. As the case study shows, the support that the system offers extends to wide areas and focuses on solving problems that occur in the management of cultural heritage.
In conclusion, we report again the definition of a decision support system, which is a computer architecture that helps the user to make decisions but without replacing him. Thus, it is evident that a DSS in the cultural heritage management of one’s daily work does not mean surrendering responsibility to a machine and lose freedom but rather to work in common agreement with it, to take suggestions into consideration, and to ensure rational and more informed decisions. A DSS is configured as an added value that should never be lacking in an organization, both public and private ones, that would like to improve more and more and aim for excellence in cultural heritage management.
Author Contributions
Conceptualization, E.D.M., P.R., S.Z., U.P. and L.A.; methodology, E.D.M., P.R., and S.Z.; software, S.Z.; validation, E.D.M., P.R., and S.Z.; formal analysis, E.D.M., P.R., and S.Z.; data curation, E.D.M., P.R., and S.Z.; writing—original draft preparation, E.D.M., P.R., and S.Z.; writing—review and editing, E.D.M., P.R., S.Z., U.P. and L.A.; supervision, P.R., U.P., and L.A.; project administration, P.R.; funding acquisition, P.R. All authors have read and agreed to the published version of the manuscript.
Funding
This research was funded by PON Program Innovation and Research 2014–2020-Italian Ministry of Education, University and Research, grant number ARS01_00421, http://www.ponricerca.gov.it/opportunita/progetti-di-ricerca-industriale-e-sviluppo-sperimentale/cultural-heritage/ (accessed on 2 August 2019).
Institutional Review Board Statement
Not applicable.
Informed Consent Statement
Not applicable.
Conflicts of Interest
The authors declare no conflict of interest. The funders had no role in the design of the study; in the collection, analyses, or interpretation of data; in the writing of the manuscript, or in the decision to publish the results.
References
- World Travel and Tourism Council. Travel & Tourism—Global Economy Impact & Trends 2020. 2020. Available online: https://wttc.org/Research/Economic-Impact (accessed on 29 January 2021).
- Loulanski, T.; Loulanski, V. The sustainable integration of cultural heritage and tourism: A meta-study. J. Sustain. Tour. 2011, 19, 837–862. [Google Scholar] [CrossRef]
- Prieto, A.J.; Macias-Bernal, J.M.; Silva, A.; Ortiz, P. Fuzzy decision-support system for safeguarding tangible and intangible cultural heritage. Sustainability 2019, 3953. [Google Scholar] [CrossRef] [Green Version]
- Power, D.J. Decision Support Systems: Concepts and Resources for Managers; Greenwood Publishing Group: Westport, CT, USA, 2002. [Google Scholar]
- Grama, C.; Urosevic, L.; Wuerthele, M. CBR based problem diagnostics application as a decision support system in the cultural heritage objects restoration. In Proceedings of the 15th WSEAS International Conference on Recent Researches in System Science, Corfu, Greece, 14–16 July 2011; pp. 131–136. [Google Scholar]
- Mustafa, M.H.; Ali, M.; Ismail, K.M.; Hashim, K.S.H.Y.; Suhaimi, M.S.M. BIM backed decision support system in the management of heritage building. Int. J. Built Environ. Sustain. 2019, 6, 63–71. [Google Scholar] [CrossRef]
- Trovato, M.G.; Ali, D.; El Halabi, A.; Meouche, S. Landscape risk assessment model and decision support system for the protection of the natural and cultural heritage in the Eastern Mediterranean Area. Land 2017, 6, 76. [Google Scholar] [CrossRef] [Green Version]
- Ali, T.; Subair, S.; Aleisa, H. Museum tourism in Khartoum, analysis and decision Sudan: A geoinformatics support system. In Proceedings of the International Conference on Image Processing, Computer Vision, and Pattern Recognition (IPCV). The Steering Committee of The World Congress in Computer Science, Computer Engineering and Applied Computing (WorldComp), Las Vegas, NV, USA, 17–20 July 2017; pp. 153–158. [Google Scholar] [CrossRef]
- Budiarto, A.; Pardamean, B.; Caraka, R.E. Computer vision-based visitor study as a decision support system for museum. In Proceedings of the 2017 International Conference on Innovative and Creative Information Technology (ICITech), Salatiga, Indonesia, 2–4 November 2017; pp. 1–6. [Google Scholar] [CrossRef]
- Wibowo, S.; Tyas, M.A.; Nada, N.Q.; Novita, M. Decision support system museum ambassadors using Topsis method. In IOP Conference Series: Materials Science and Engineering; IOP Publishing: Bristol, UK, 2020; p. 12037. [Google Scholar] [CrossRef]
- Kim, C.J.; Yoo, W.S.; Lee, U.K.; Song, K.Y.; Kang, K.I.; Cho, H. An experience curve-based decision support model for prioritizing restoration needs of cultural heritage. J. Cult. Herit. 2010, 11, 430–437. [Google Scholar] [CrossRef]
- Della Spina, L. Adaptive sustainable reuse for cultural heritage: A multiple criteria decision aiding approach supporting urban development processes. Sustainability 2020, 12, 1363. [Google Scholar] [CrossRef] [Green Version]
- Della Spina, L.; Giorno, C.; Casmiro Galati, R. An integrated decision support system to define the best scenario for the adaptive sustainable re-use of Cultural Heritage in southern Italy. In Proceedings of the International Symposium: New Metropolitan Perspectives, Italy (online), 26–28 May 2020; pp. 251–267. [Google Scholar] [CrossRef]
- Lee, H.Y.; Lin, Y.C. A decision support model for scheduling exhibition projects in art museums. Expert Syst. Appl. 2010, 37, 919–925. [Google Scholar] [CrossRef]
- Hevner, A.R.; March, S.T.; Park, J.; Ram, S. Design science in information systems research. MIS Q. 2004, 28, 75–105. [Google Scholar] [CrossRef] [Green Version]
- Matero, F. Preface. In Managing change: Sustainable approaches to the conservation of the built environment. In Proceedings of the 4th Annual US/ICOMOS International Symposium, Philadelphia, PA, USA, 6–8 April 2001; Teutonico, J.M., Matero, F., Eds.; Getty Conservation Institute: Los Angeles, CA, USA. [Google Scholar]
- Throsby, D. Sustainability in the conservation of the built environment: An economist perspective. In Managing change: Sustainable approaches to the conservation of the built environment. In Proceedings of the 4th Annual US/ICOMOS International Symposium, Philadelphia, PA, USA, 6–8 April 2001; Teutonico, J.M., Matero, F., Eds.; Getty Conservation Institute: Los Angeles, CA, USA; pp. 3–10. [Google Scholar]
- Petti, L.; Trillo, C.; Makore, B.N. Cultural Heritage and Sustainable Development Targets: A Possible Harmonisation? Insights from the European Perspective. Sustainability 2020, 12, 926. [Google Scholar] [CrossRef] [Green Version]
- Marakas, G.M. Decision Support Systems in the 21st Century; Prentice Hall: Upper Saddle River, NJ, USA, 2003. [Google Scholar]
- Turban, E.; Aronson, J.E.; Liang, T.P.; Maccarthy, R.V. Decision Support Systems and Intelligent Systems; Pearson Prentice-Hall: Upper Saddle River, NJ, USA, 2005. [Google Scholar]
- Morge, M. The hedgehog and the fox. In International Workshop on Argumentation in Multi-Agent Systems; Springer: Honolulu, HI, USA, 2007. [Google Scholar] [CrossRef]
- Nelson Ford, F. Decision support systems and expert systems: A comparison. Inf. Manag. 1985, 8, 21–26. [Google Scholar] [CrossRef]
- Pfeifer, R.; Lüthi, H.-J. Decision Support Systems and Expert Systems: A Complementary Relationship? In Expert Systems and Artificial Intelligence in Decision Support Systems; Springer: Lunteren, The Netherlands, 1987; pp. 41–51. [Google Scholar]
- Alter, S. Decision Support Systems: Current Practice and Continuing Challenges; Addison-Wesley Pub.: Reading, MA, USA, 1980. [Google Scholar]
- Pereira Roders, A.; Van Oers, R. Editorial: Bridging cultural heritage and sustainable development. J. Cult. Herit. Manag. Sustain. Dev. 2011, 1, 5–14. [Google Scholar] [CrossRef]
- International Concilium of Museums Italia. Professionalità e Funzioni Essenziali del Museo alla luce della Riforma dei Musei Statali. In COM Italia; Jalla, D., Ed.; ICOM ITALIA: Milan, Italy, 2017; Available online: http://www.icom-italia.org/wp-content/uploads/2018/06/ICOMItalia.SMN_.Quaderno2.novembre.2017.pdf (accessed on 22 February 2021).
- Tscheu, F.; Buhalis, D. Augmented reality at cultural heritage sites. In Information and Communication Technologies in Tourism 2016; Bilbao, Spain; Inversini, A., Schegg, R., Eds.; Springer: Cham, Switzerland, 2016; pp. 607–619. [Google Scholar] [CrossRef]
- Häkkilä, J.; Hannula, P.; Luiro, E.; Launne, E.; Mustonen, S.; Westerlund, T.; Colley, A. Visiting a virtual graveyard: Designing virtual reality cultural heritage experiences. In Proceedings of the 18th International Conference on Mobile and Ubiquitous Multimedia, Pisa, Italy, 26–29 November 2019; pp. 1–4. [Google Scholar] [CrossRef] [Green Version]
- Armstrong, J.S. Selecting Forecasting Methods. In Principles of Forecasting: A Handbook for Researchers and Practitioners; Armstrong, J.S., Ed.; Springer: Berlin/Heidelberg, Germany, 2009; pp. 365–385. [Google Scholar] [CrossRef] [Green Version]
- Gers, F.A.; Schraudolph, N.N.; Schmidhuber, J. Learning precise timing with LSTM recurrent network. J. Mach. Learn. Res. 2002, 3, 115–143. [Google Scholar]
- Gers, F.A.; Schmidhuber, J.; Cummins, F. Learning to forget: Continual prediction with LSTM. Neural Comput. 2000, 12, 2451–2471. [Google Scholar] [CrossRef]
- Hochreiter, S.; Schmidhuber, J. Long short-termmemory. Neural Comput. 1997, 9, 1735–1780. [Google Scholar] [CrossRef]
- Goh, C.; Law, R. The methodological progress of tourism demand forecasting: A review of related literature. J. Travel Tour. Mark. 2011, 28, 296–317. [Google Scholar] [CrossRef]
- Song, H.; Bastian, Z.G.; Vera, S.L. Combining statistical and judgmental forecasts via a web-based tourism demand forecasting system. Int. J. Forecast. 2013, 29, 295–310. [Google Scholar] [CrossRef]
- Petropoulos, C.; Nikolopoulos, K.; Patelis, A.; Assimakopoulous, V. A technical analysis approach to tourism demand forecasting. Appl. Econ. Lett. 2005, 12, 327–333. [Google Scholar] [CrossRef]
- Lee, W.; Lee, D. Cultural Heritage and the Intelligent Internet of Things. J. Comput. Cult. Herit. 2019, 12, 1–14. [Google Scholar] [CrossRef] [Green Version]
- Law, R.; Li, G.; Fong, D.K.C.; Han, X. Tourism demand forecasting: A deep learning approach. Ann. Tour. Res. 2019, 75, 410–423. [Google Scholar] [CrossRef]
- Nau, R. Forecasting with Moving Averages. Fuqua School of Business, Duke University, 1–3. 2014. Available online: https://people.duke.edu/~rnau/Notes_on_forecasting_with_moving_averages--Robert_Nau.pdf (accessed on 29 January 2021).
- Ke, X.; Yifei, L.; Xiaoxiao, M. An evaluation model to assess the communication effects of intangible cultural heritage. J. Cult. Herit. 2019, 40, 124–132. [Google Scholar] [CrossRef]
- Nielsen, J.K. Museum communication and storytelling: Articulating understandings within the museum structure. Mus. Manag. Curatorship 2017, 32, 440–455. [Google Scholar] [CrossRef]
- Kotler, N.G.; Kotler, P.; Kotler, W.I. Museum Marketing and Strategy: Designing Missions, Building Audiences, Generating Revenue and Resources; John Wiley & Sons: Hoboken, NJ, USA, 2008. [Google Scholar]
- Di Pietro, L.; Guglielmetti Mugion, R.; Mattia, G.; Renzi, M.F. Cultural heritage and consumer behaviour: A survey on Italian cultural visitors. J. Cult. Herit. Manag. Sustain. Dev. 2015, 5, 61–81. [Google Scholar] [CrossRef]
- Krantz, A.; Korn, R.; Menninger, M. Rethinking museum visitors: Using K-means cluster analysis to explore a museum’s audience. Curator Mus. J. 2009, 52, 363–374. [Google Scholar] [CrossRef]
- Roma, P.; Zambuto, F.; Perrone, G. The role of the distribution platform in price formation of paid apps. Decis. Support Syst. 2016, 91, 13–24. [Google Scholar] [CrossRef] [Green Version]
- Parca, S. Il sistema informativo sul pubblico dei luoghi della cultura statali. Contesto, Obiettivi, Strumento d’Indagine. The Public Information System of State Cultural Places. Context, Objectives, Investigation Tool. In Primo Colloquio Sulla Valorizzazione: Esperienza, Partecipazione, Gestione; MiBAC: Rome, Italy, 2012; pp. 57–65. [Google Scholar]
- Vitrano, S. La metodologia statistica. In Esperienza E Conoscenza Del Museo: Indagine Sui Visitatori Della Galleria Nazionale D’arte Moderna E Contemporanea; Ligozzi, M.M., Mastrandrea, S., Eds.; Mondadori Electa: Rome, Italy, 2008; pp. 44–51. [Google Scholar]
- UNESCO. Museums. 2020. Available online: https://en.unesco.org/themes/museums#:~:text=Museums%20are%20more%20than%20places,in%201975%20to%2095%2C000%20today (accessed on 29 January 2021).
- Statista. Most Visited Art Museums Worldwide in 2019. 2019. Available online: https://0-www-statista-com.brum.beds.ac.uk/statistics/246293/art-museums-by-total-attendance-worldwide/ (accessed on 22 February 2021).
- International Concilium of Museums. Statutes. Vienna. p. Art. 3. 2017. Available online: https://icom.museum/wp-content/uploads/2018/07/2017_ICOM_Statutes_EN.pdf (accessed on 29 January 2021).
- Siau, K.; Lee, L. Are use case and class diagrams complementary in requirements analysis? An experimental study on use case and class diagrams in UML. Requir. Eng. 2004, 9, 229–237. [Google Scholar] [CrossRef]
- Tian, Q.; Ma, J.; Liang, J.; Kwok, R.C.W.; Liu, O. An organizational decision support system for effective R&D project selection. Decis. Support Syst. 2005, 39, 403–413. [Google Scholar] [CrossRef]
- Morreale, A.; Robba, S.; Lo Nigro, G.; Roma, P. A real options game of alliance timing decisions in biopharmaceutical research and development. Eur. J. Oper. Res. 2017, 261, 1189–1202. [Google Scholar] [CrossRef]
Figure 1.
DSS framework development steps.

Figure 2.
DSS framework.

Figure 3.
Plot of means for each cluster in K-Means method.

Figure 4.
Price–demand curve of the full ticket on June using data over the 2002–2019 period.

Figure 5.
Use case diagram of the DSS.

Figure 6.
Dashboard interface.

Figure 7.
Demand management interface.

Figure 8.
Segmentation and communication interface.

Figure 9.
Pricing interface.

Figure 10.
Space management interface.


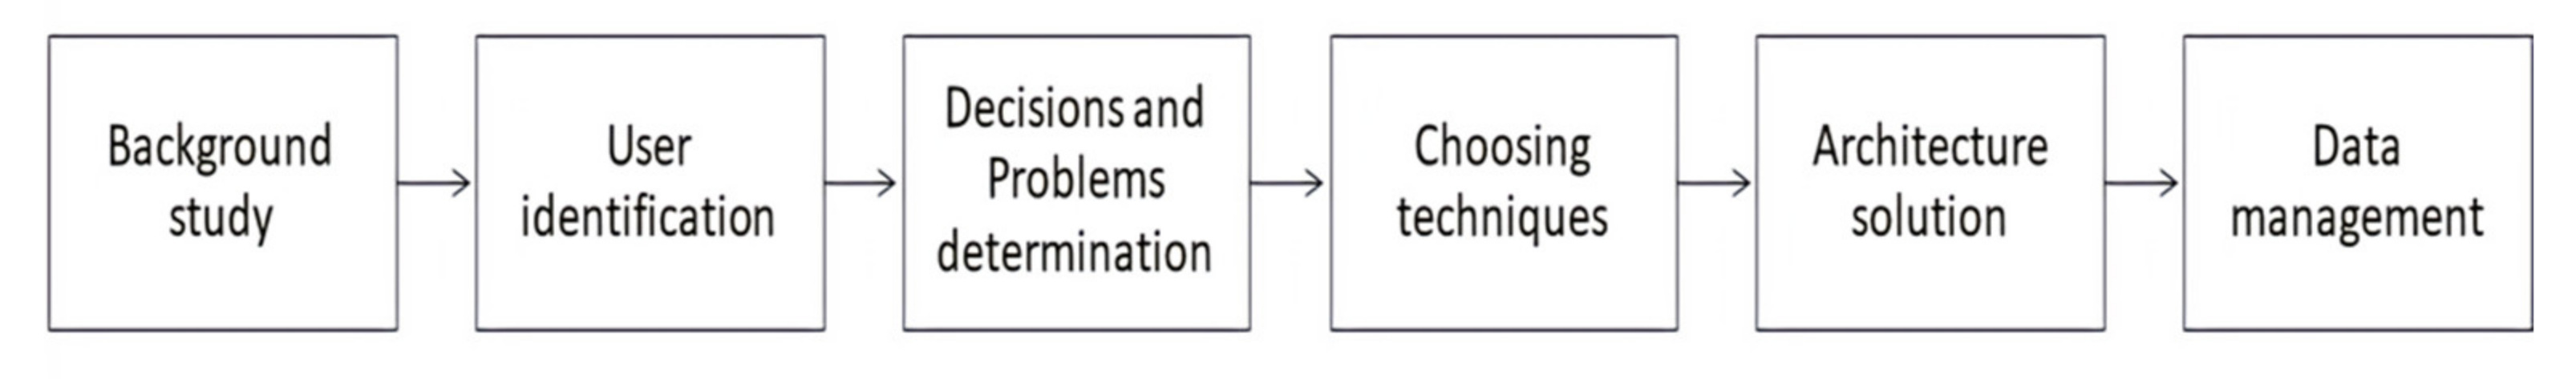
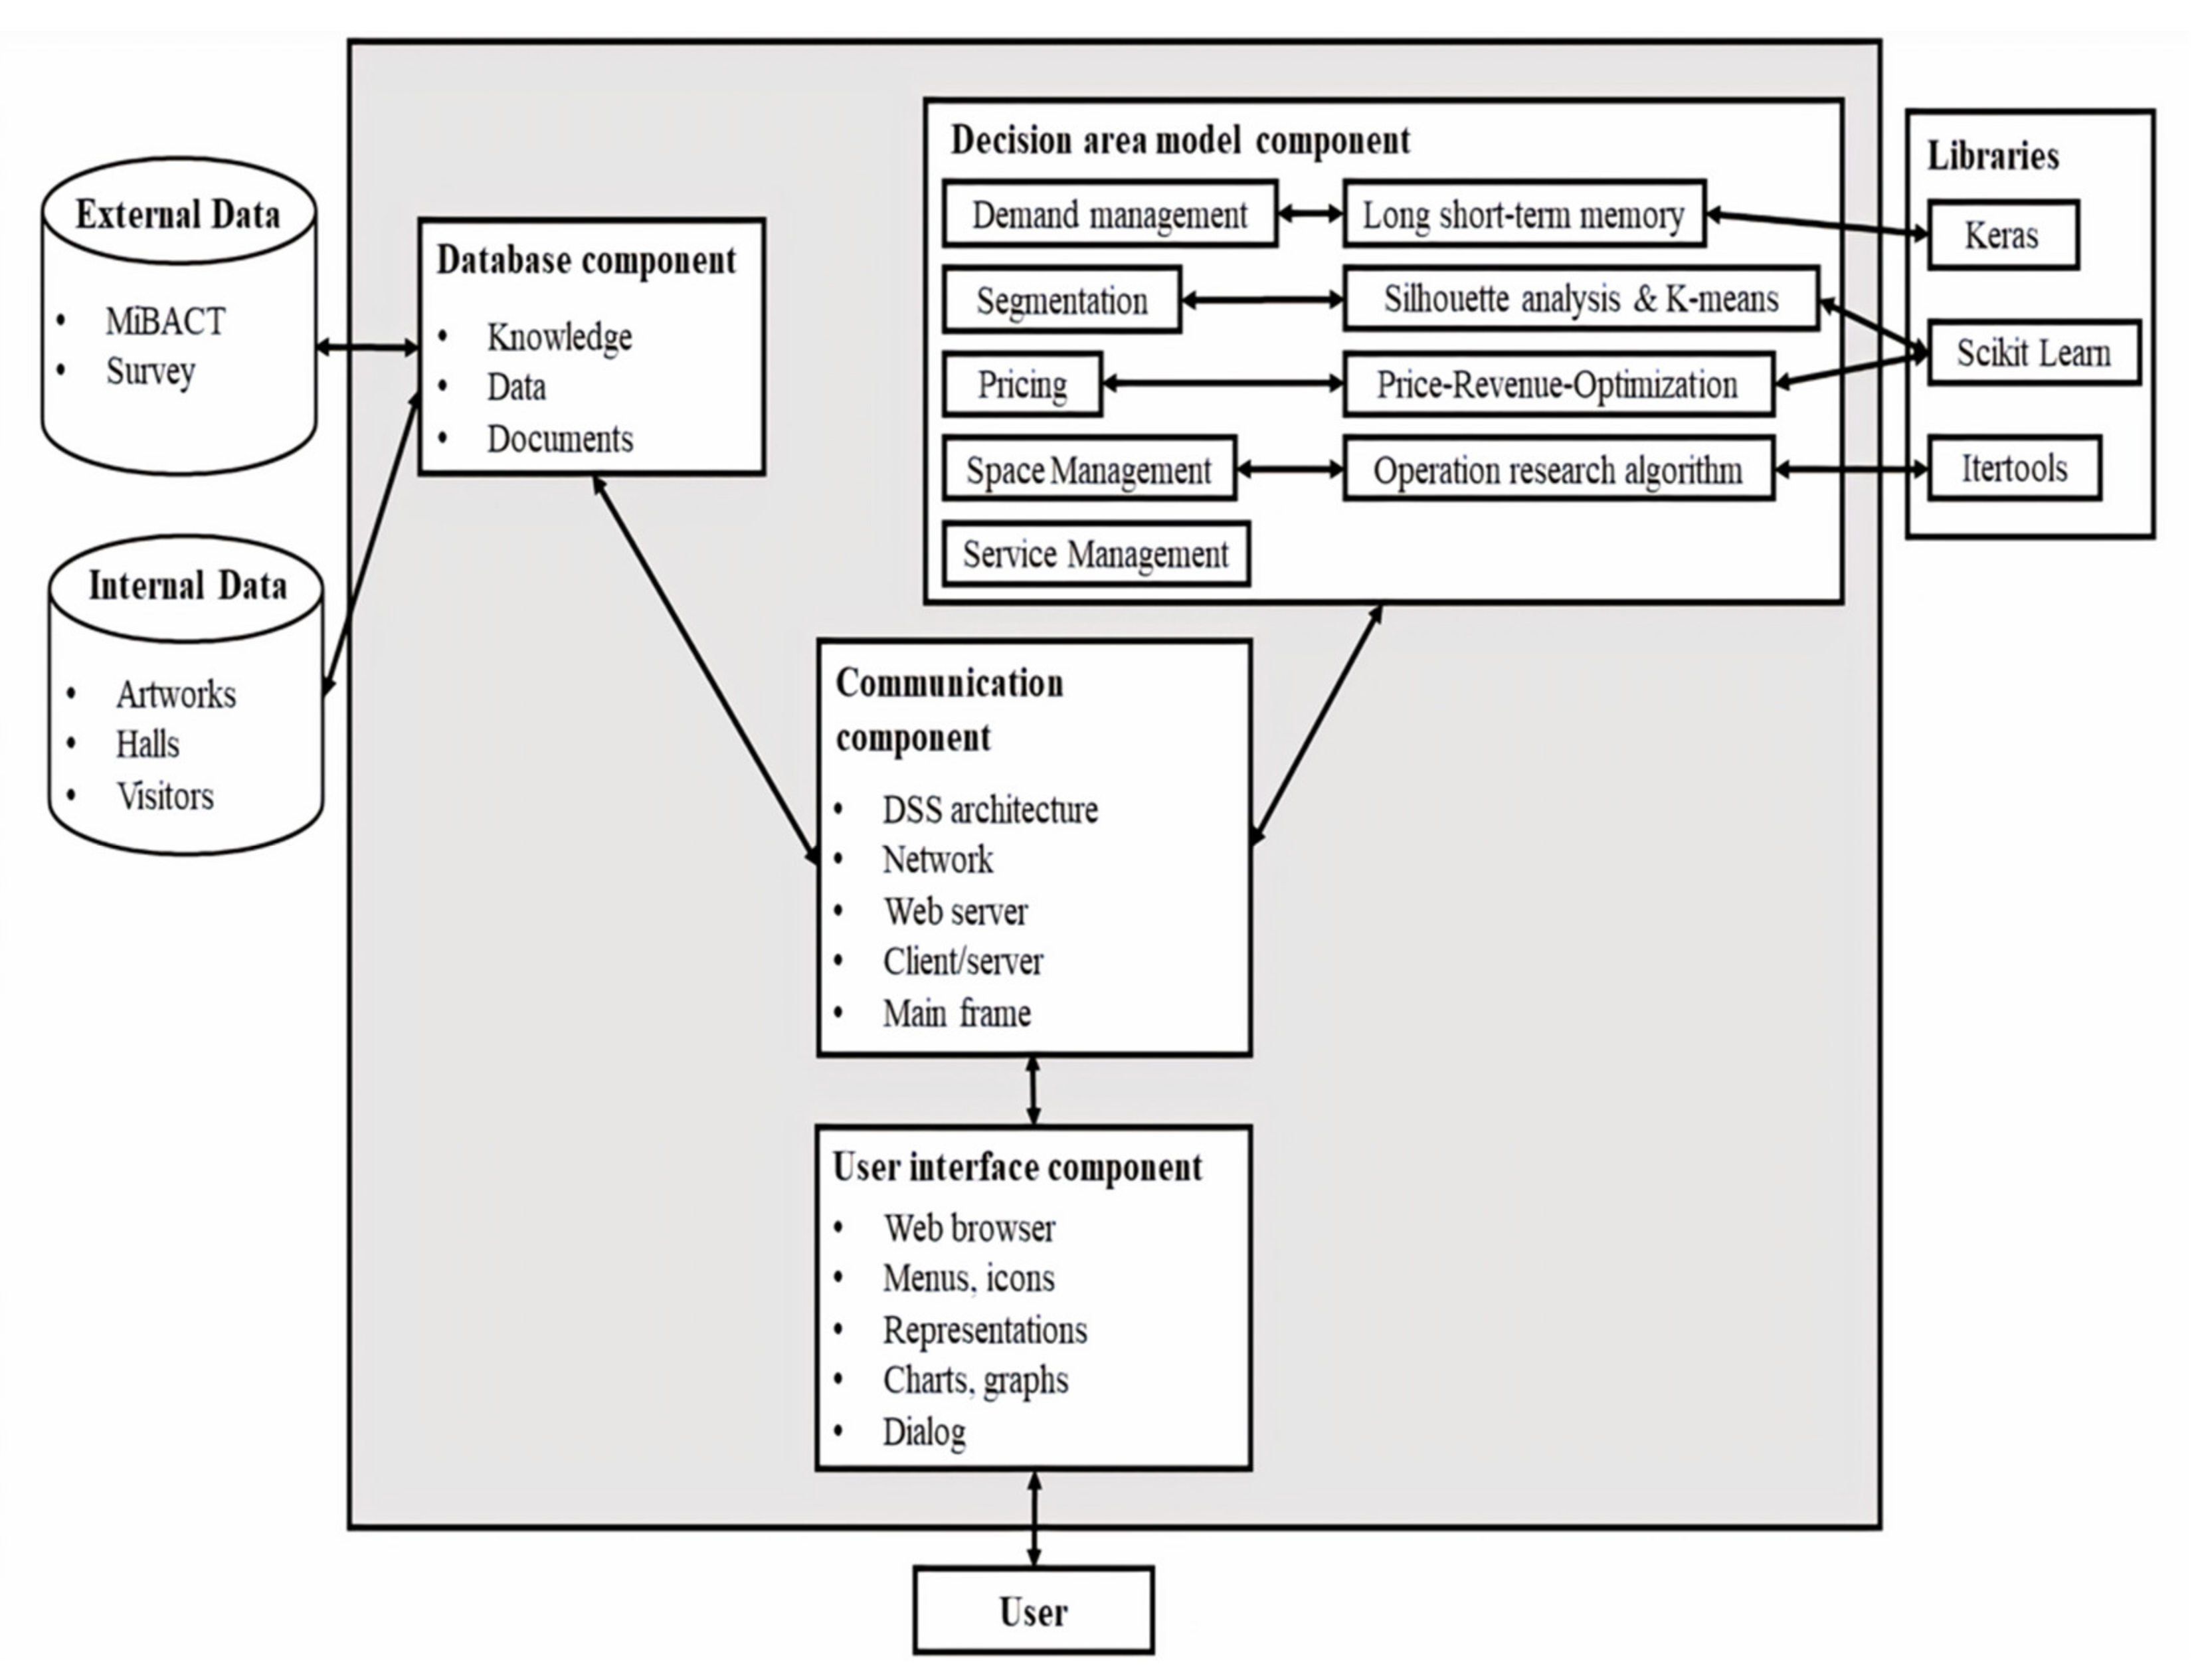
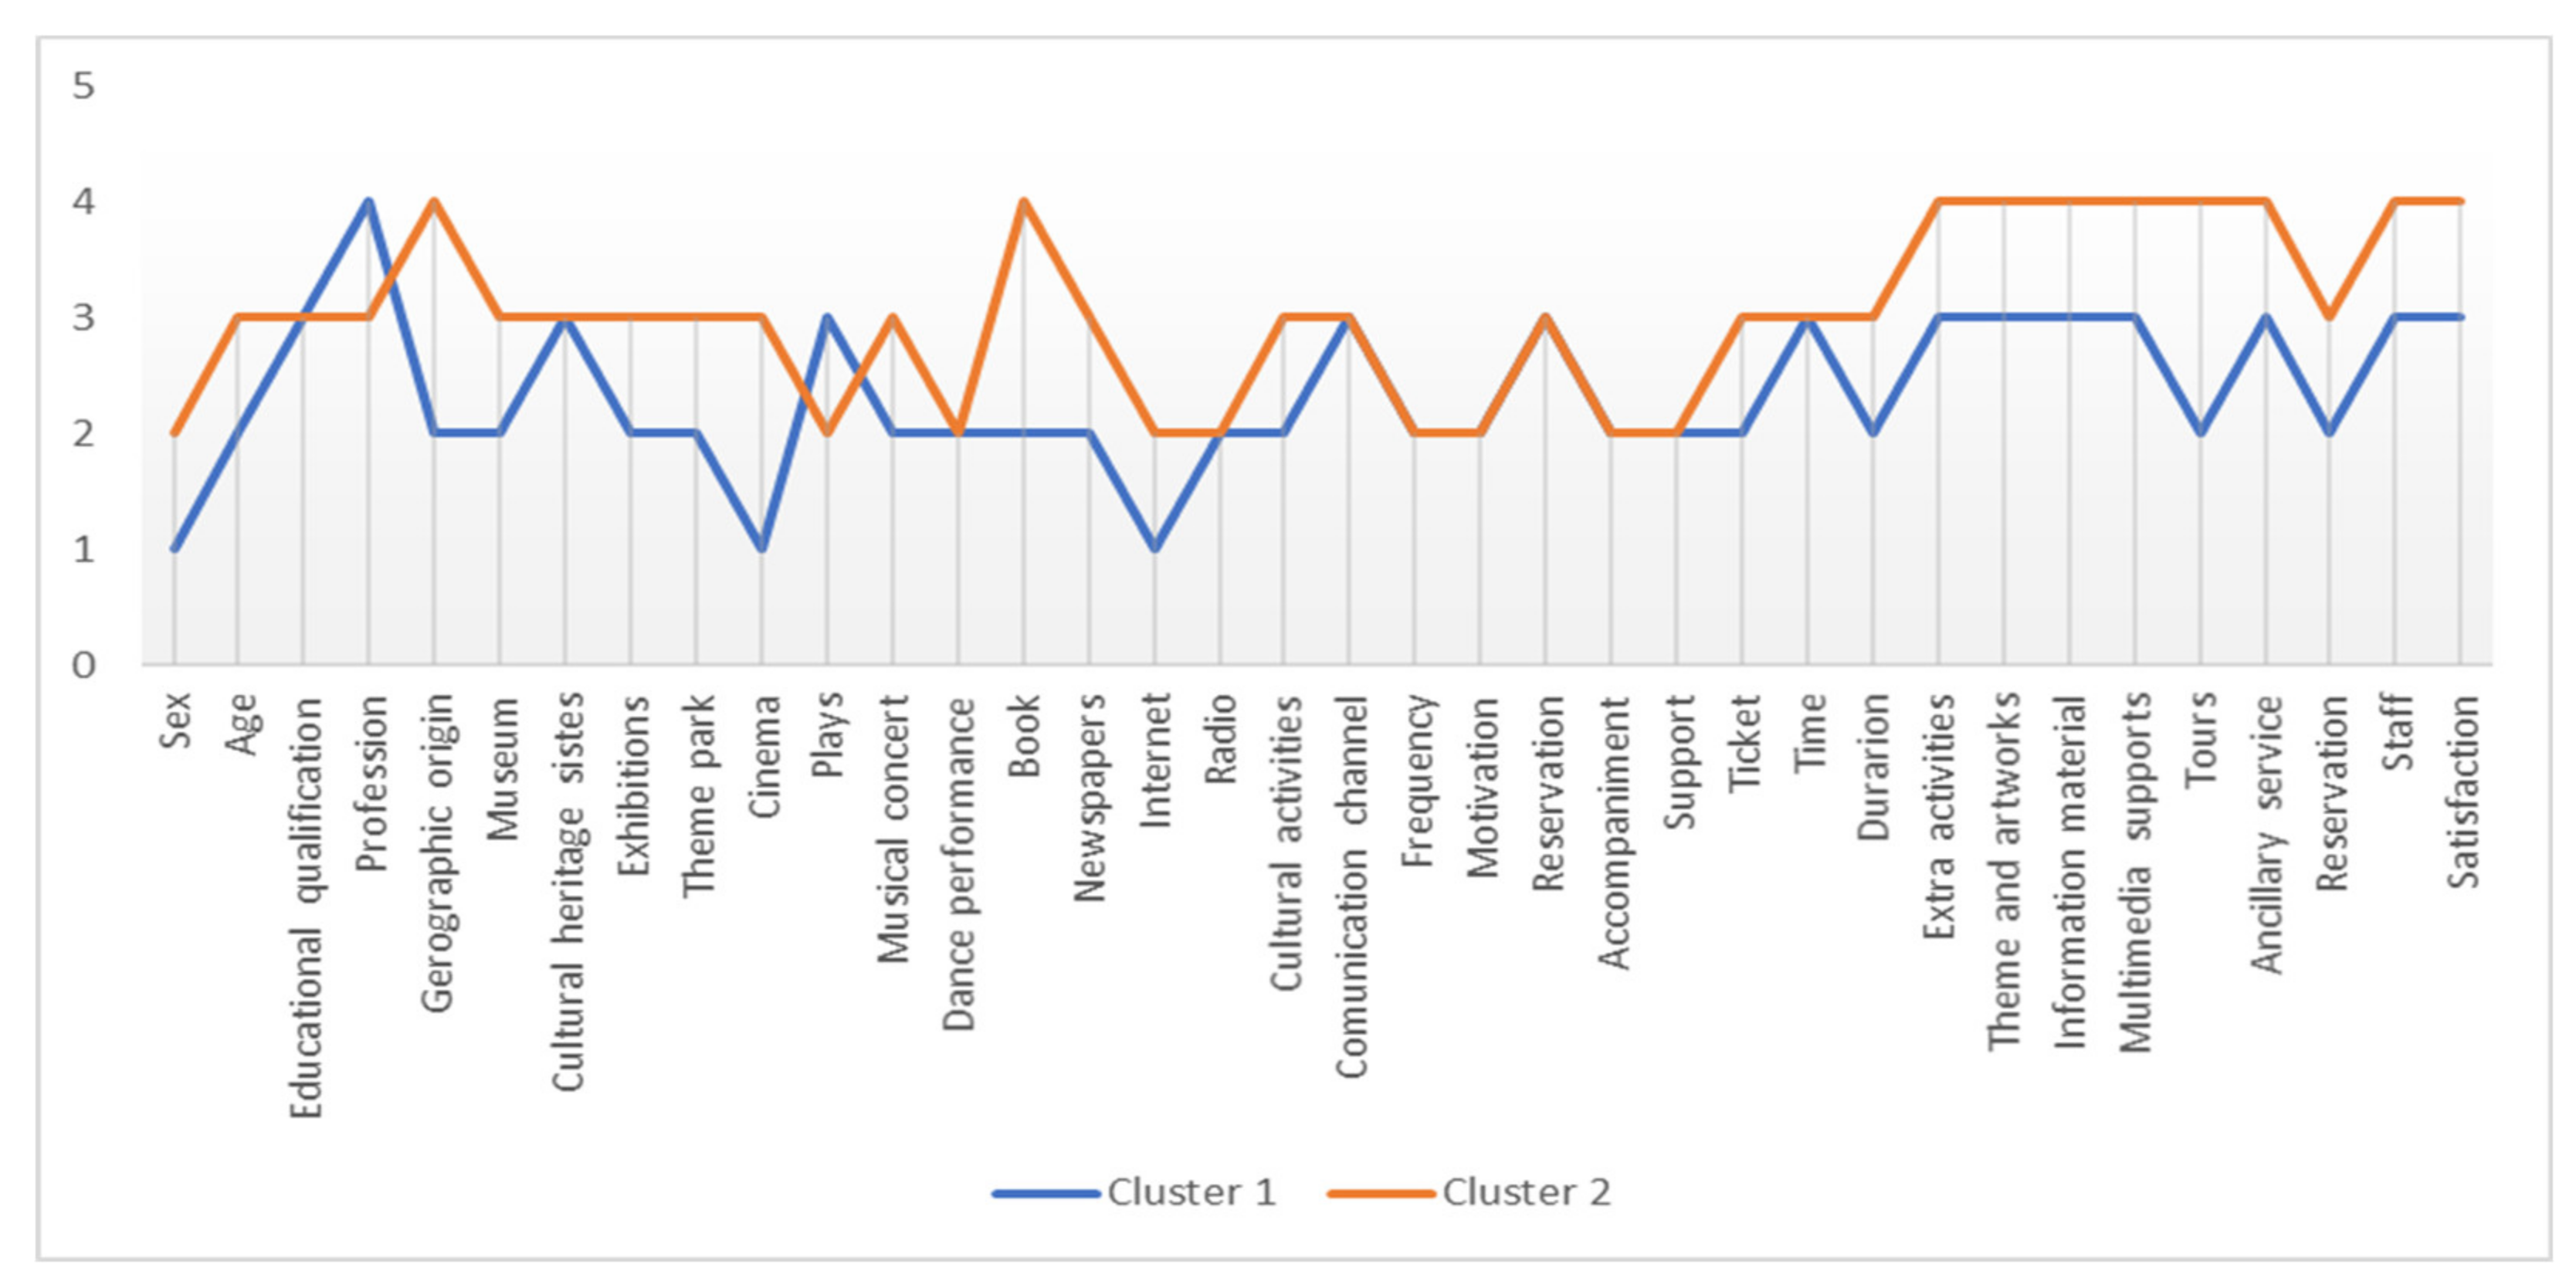
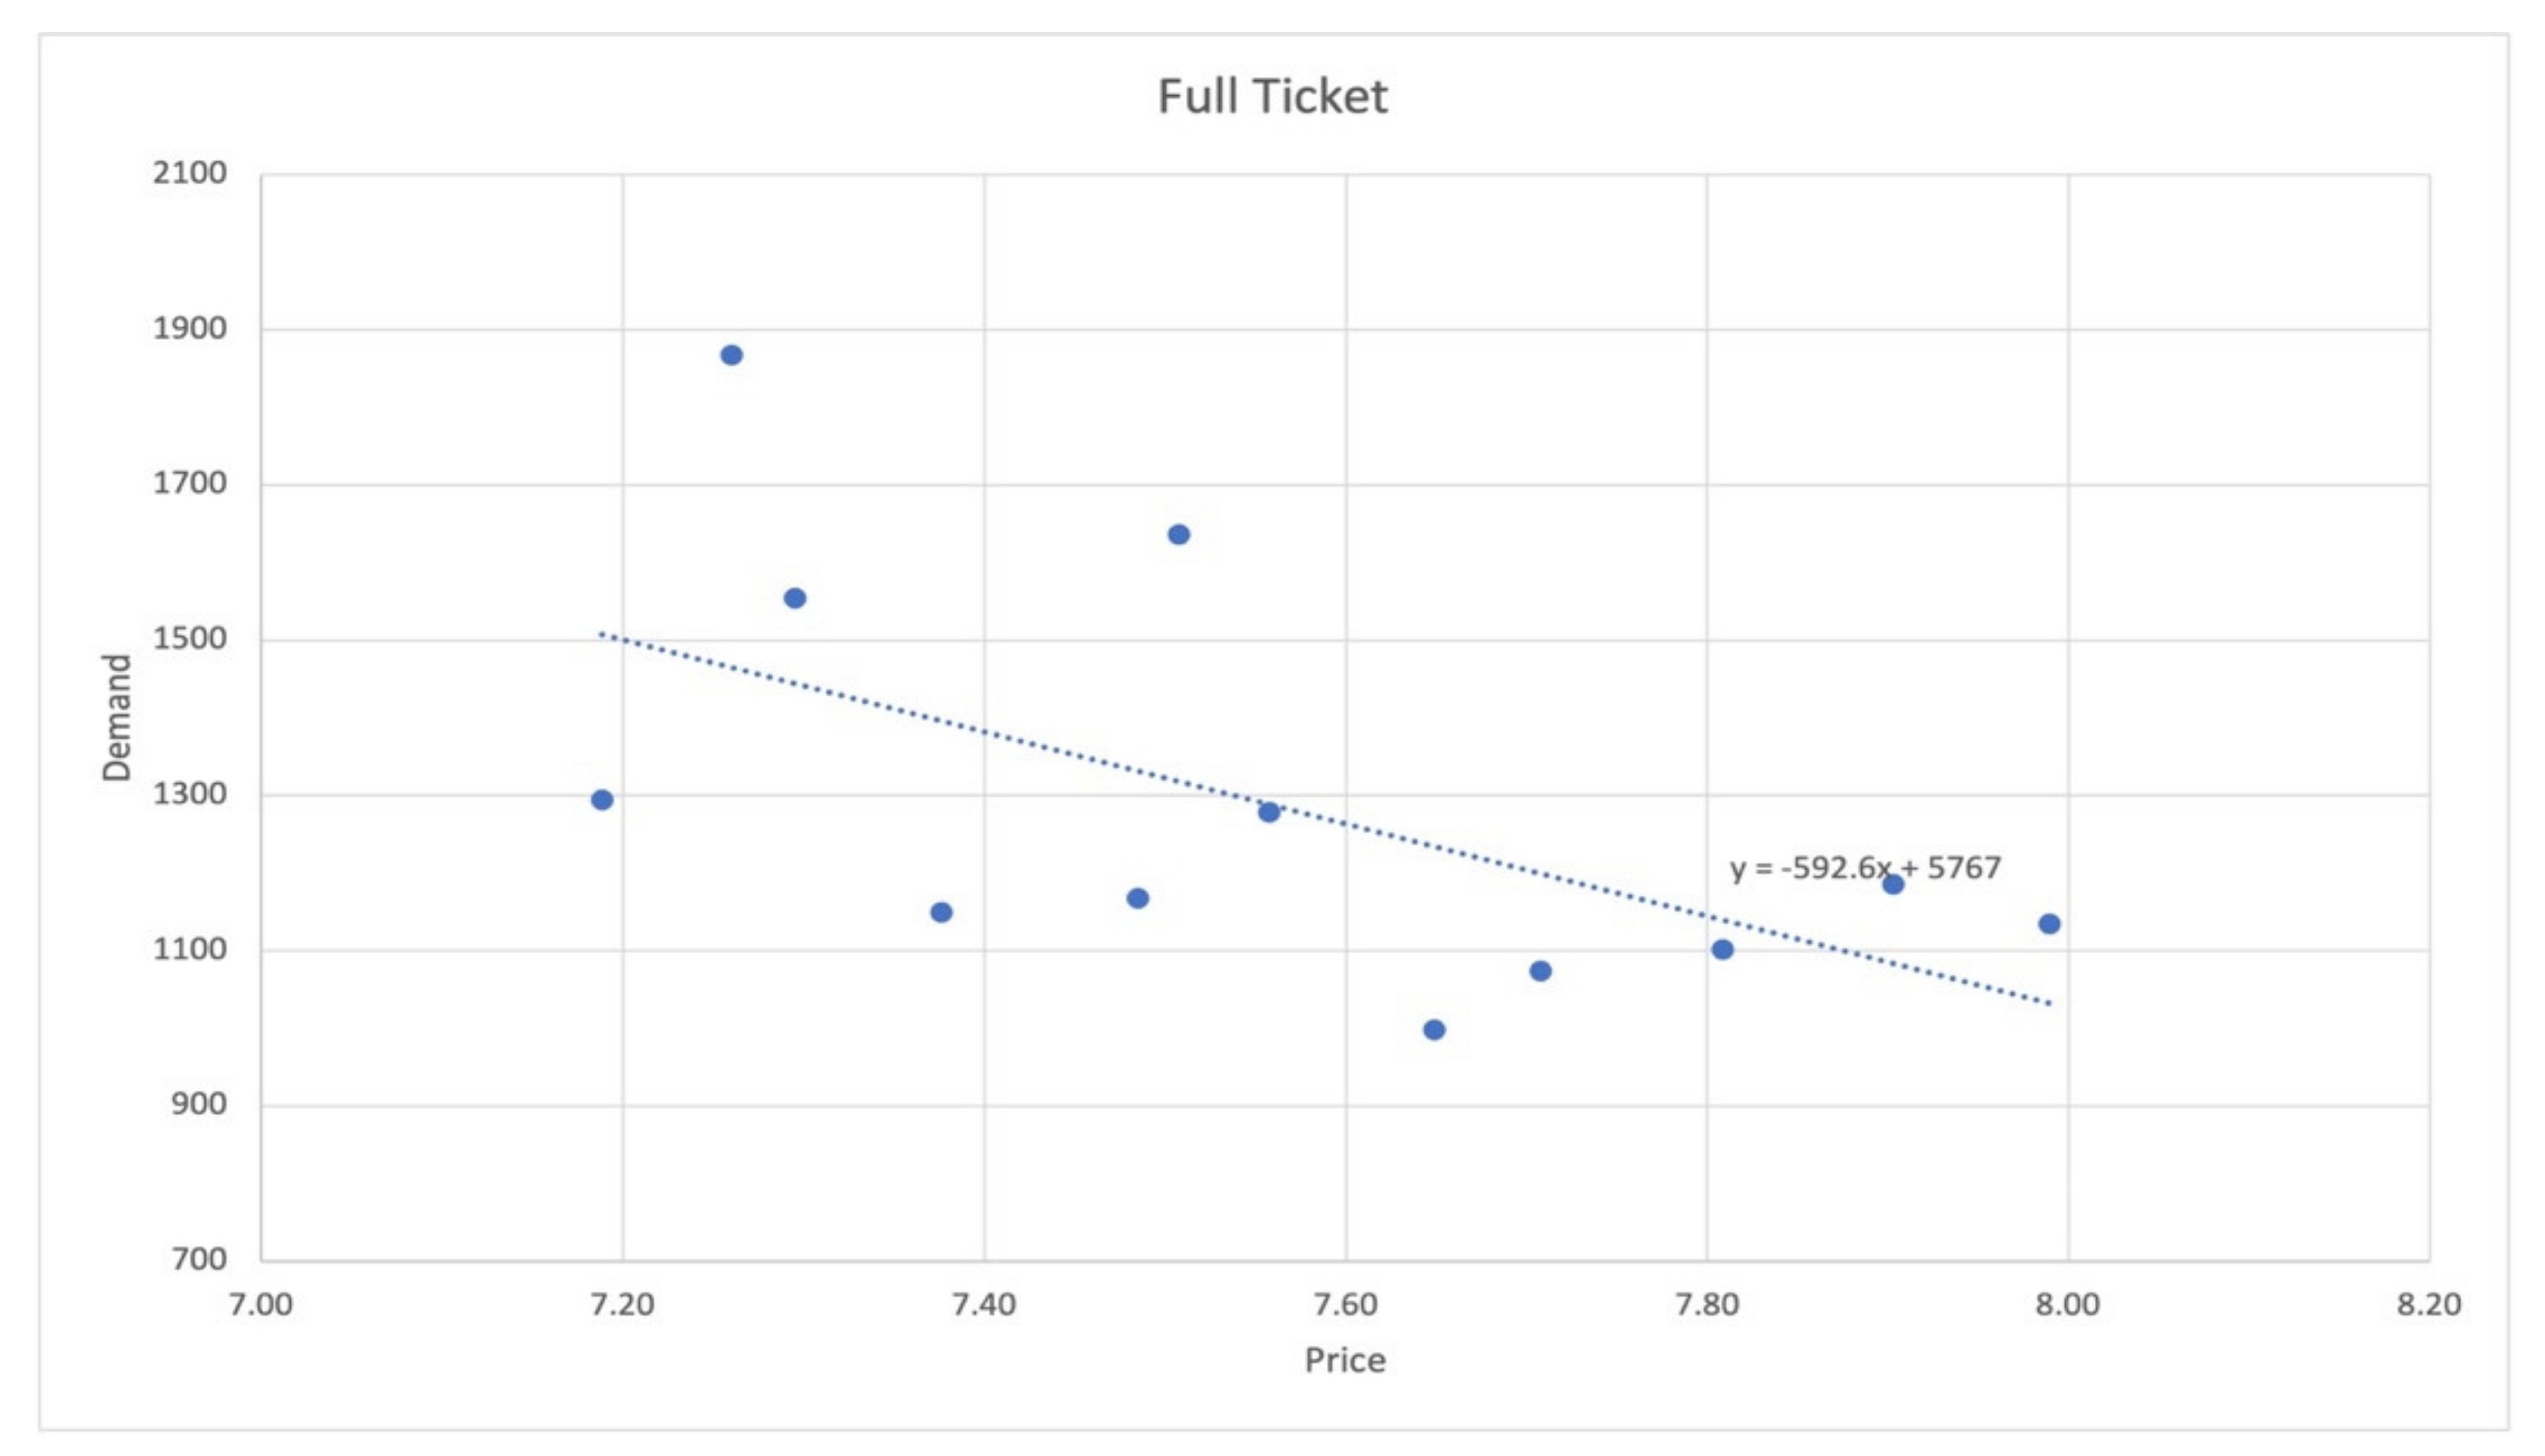
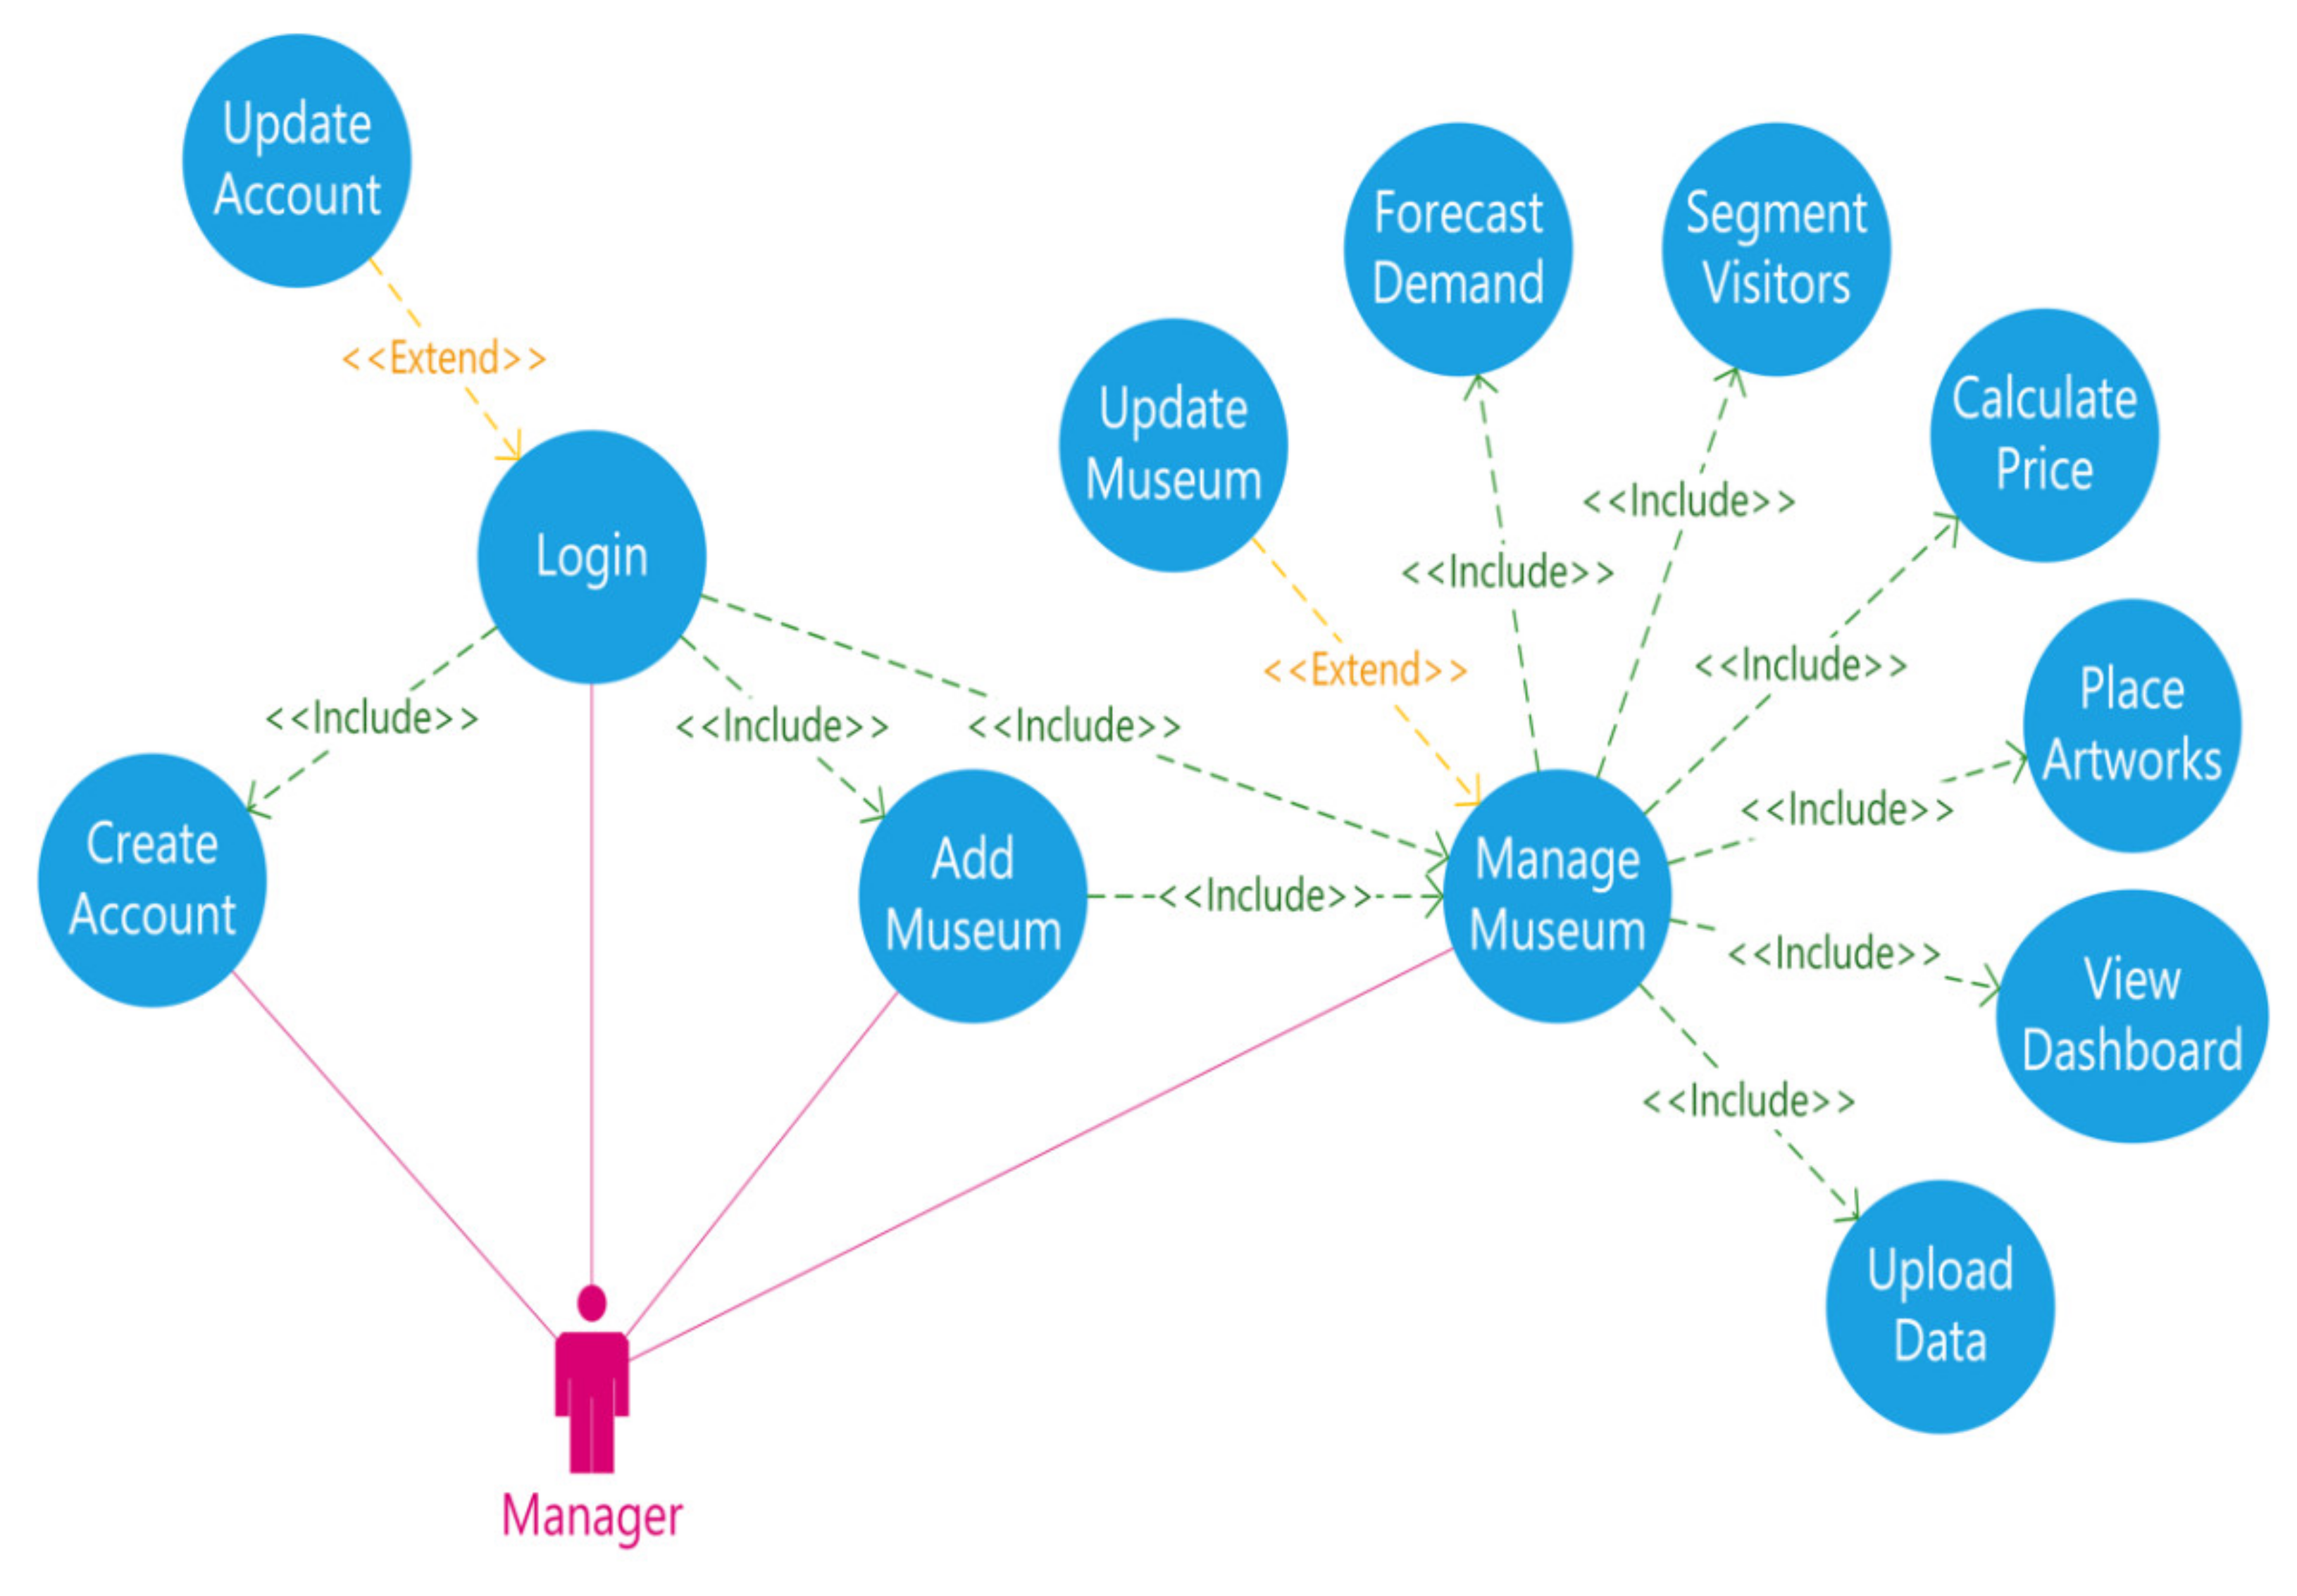
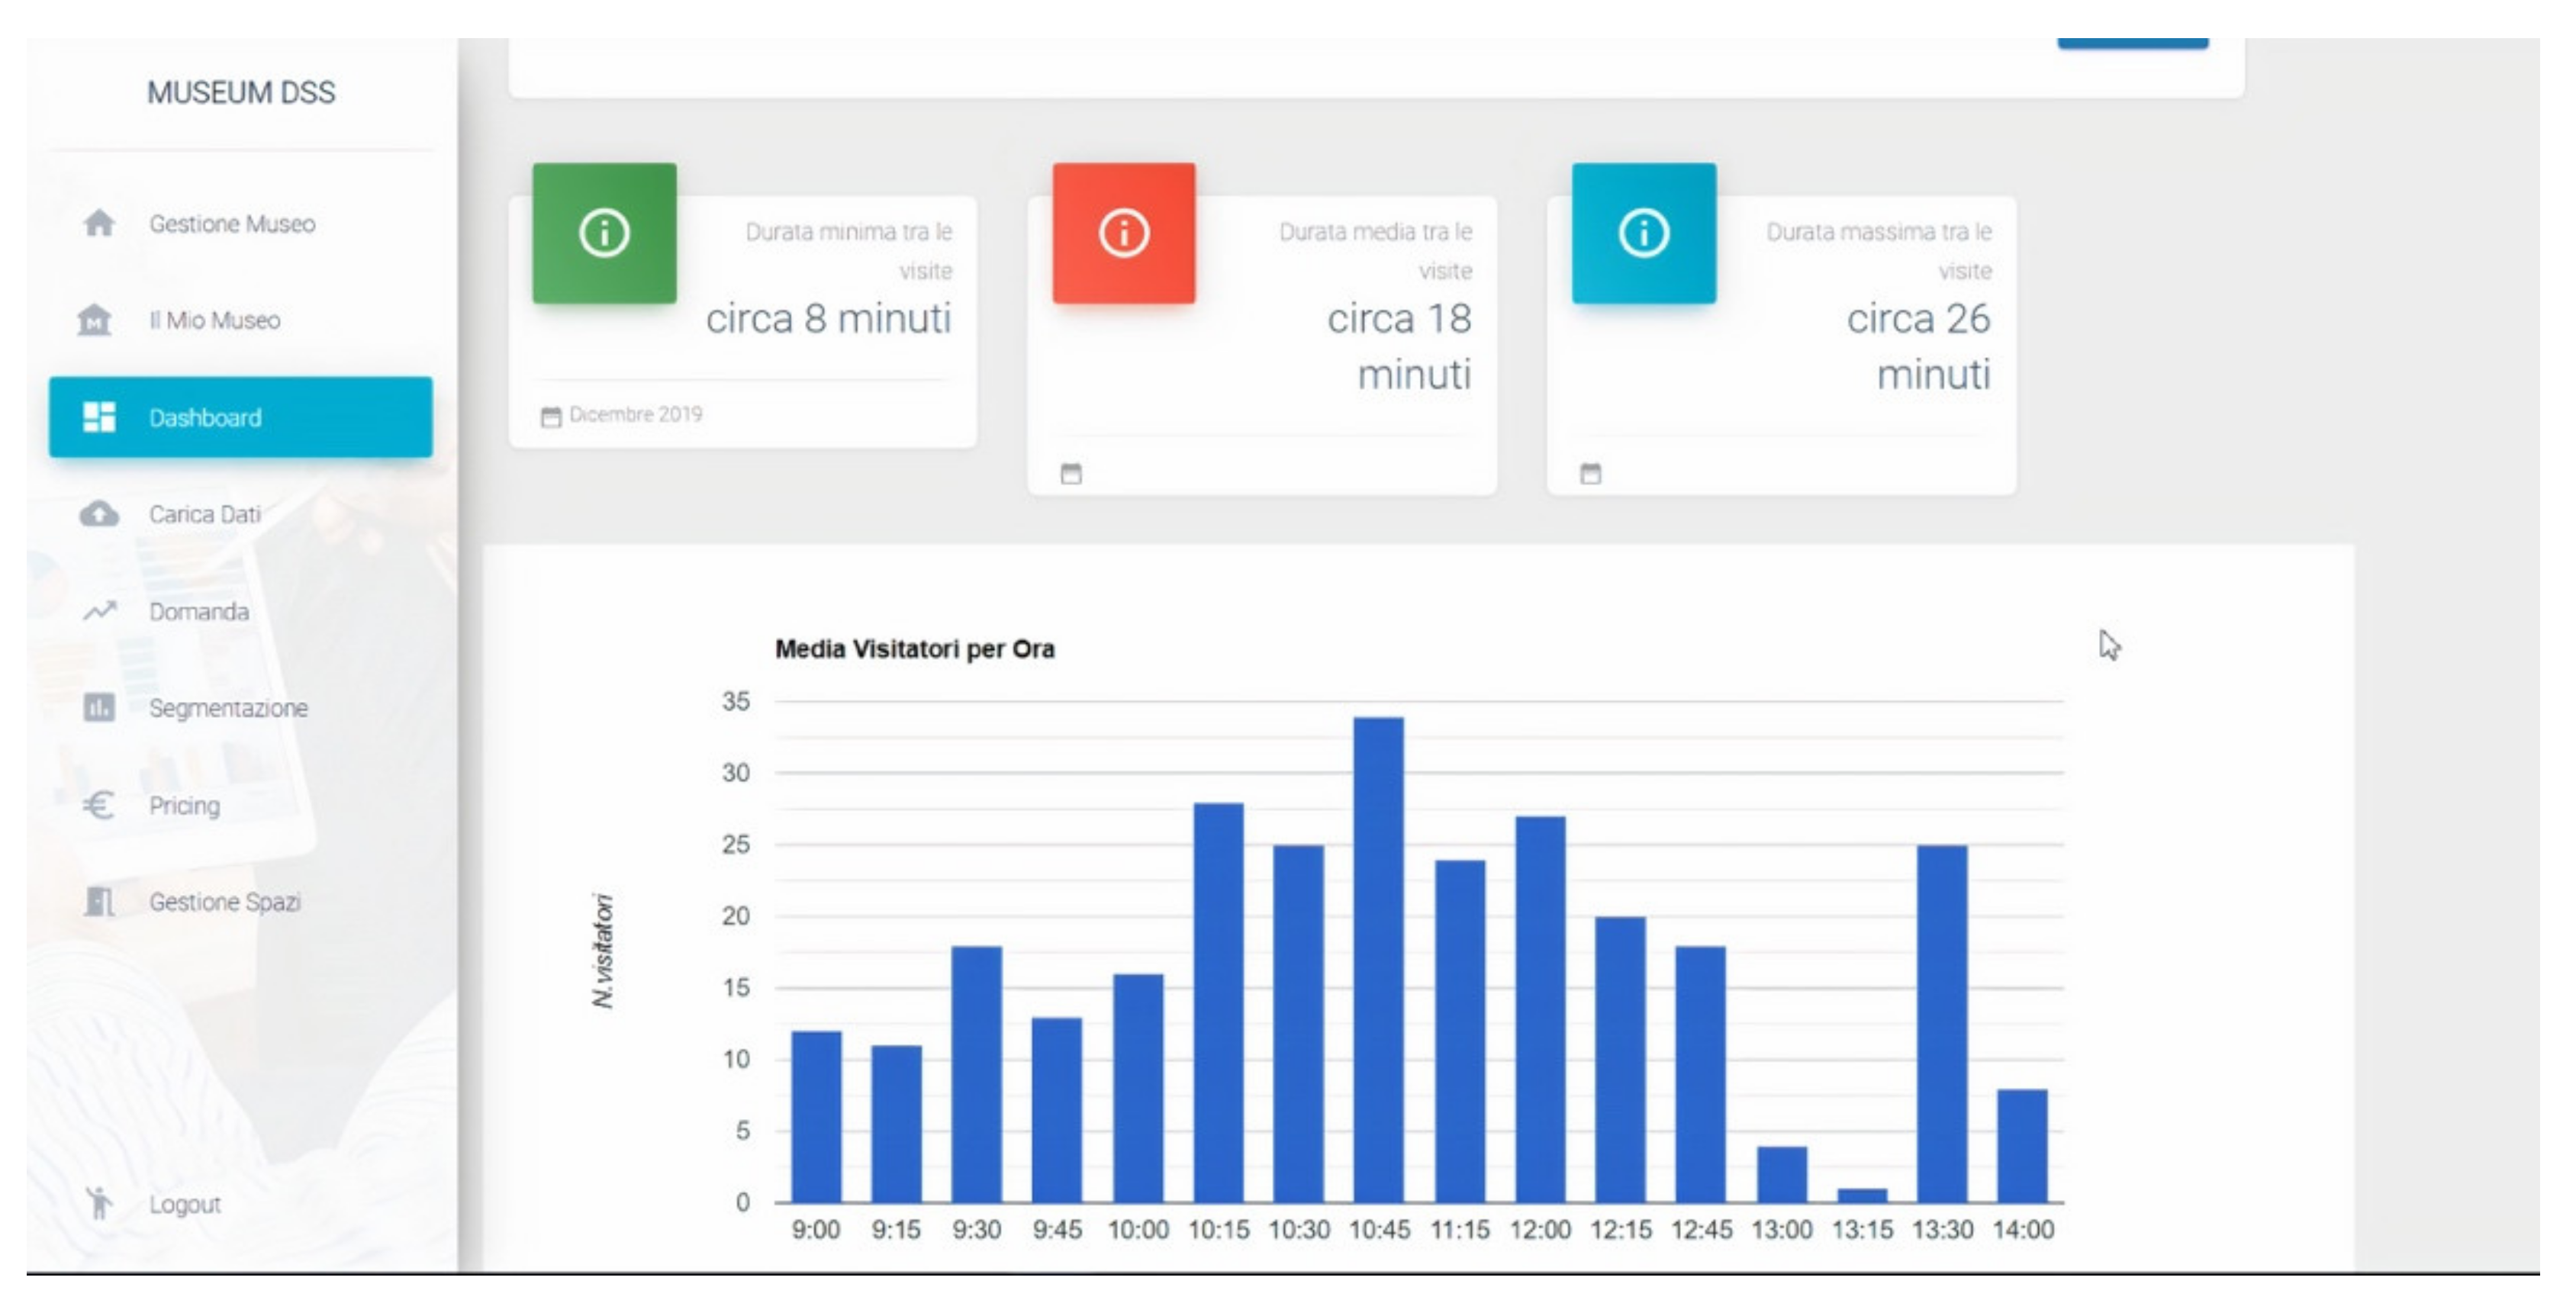
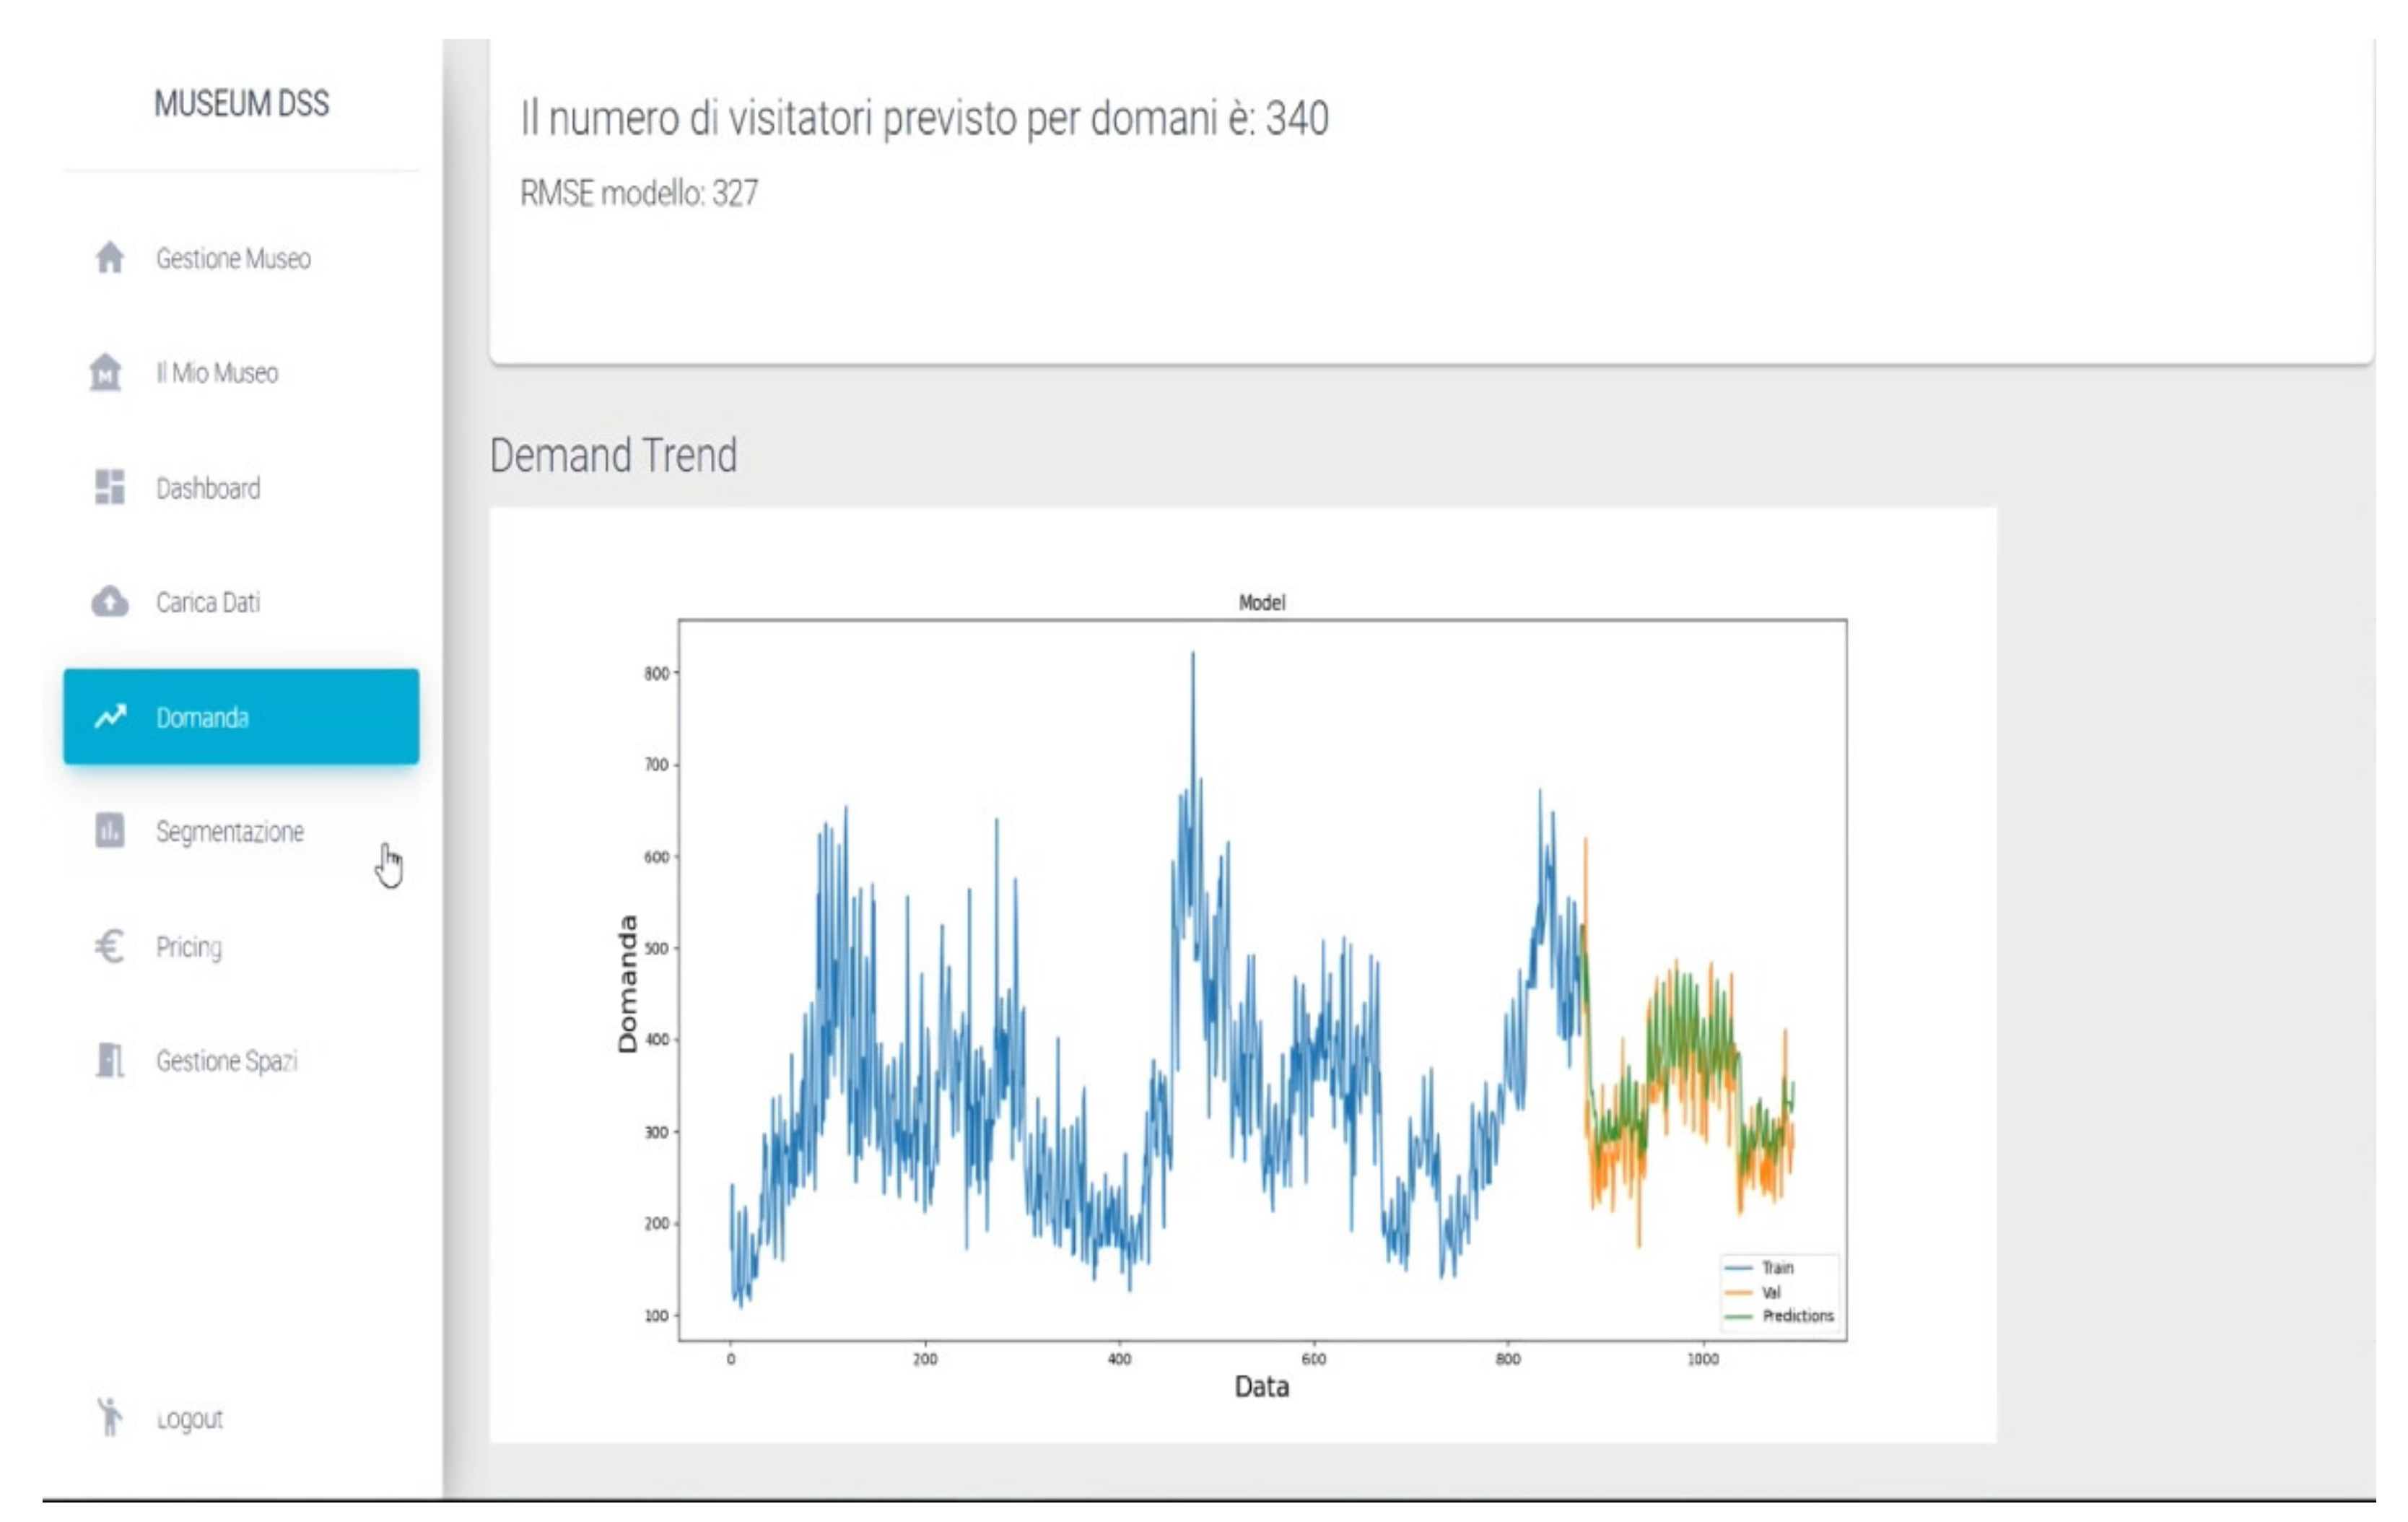
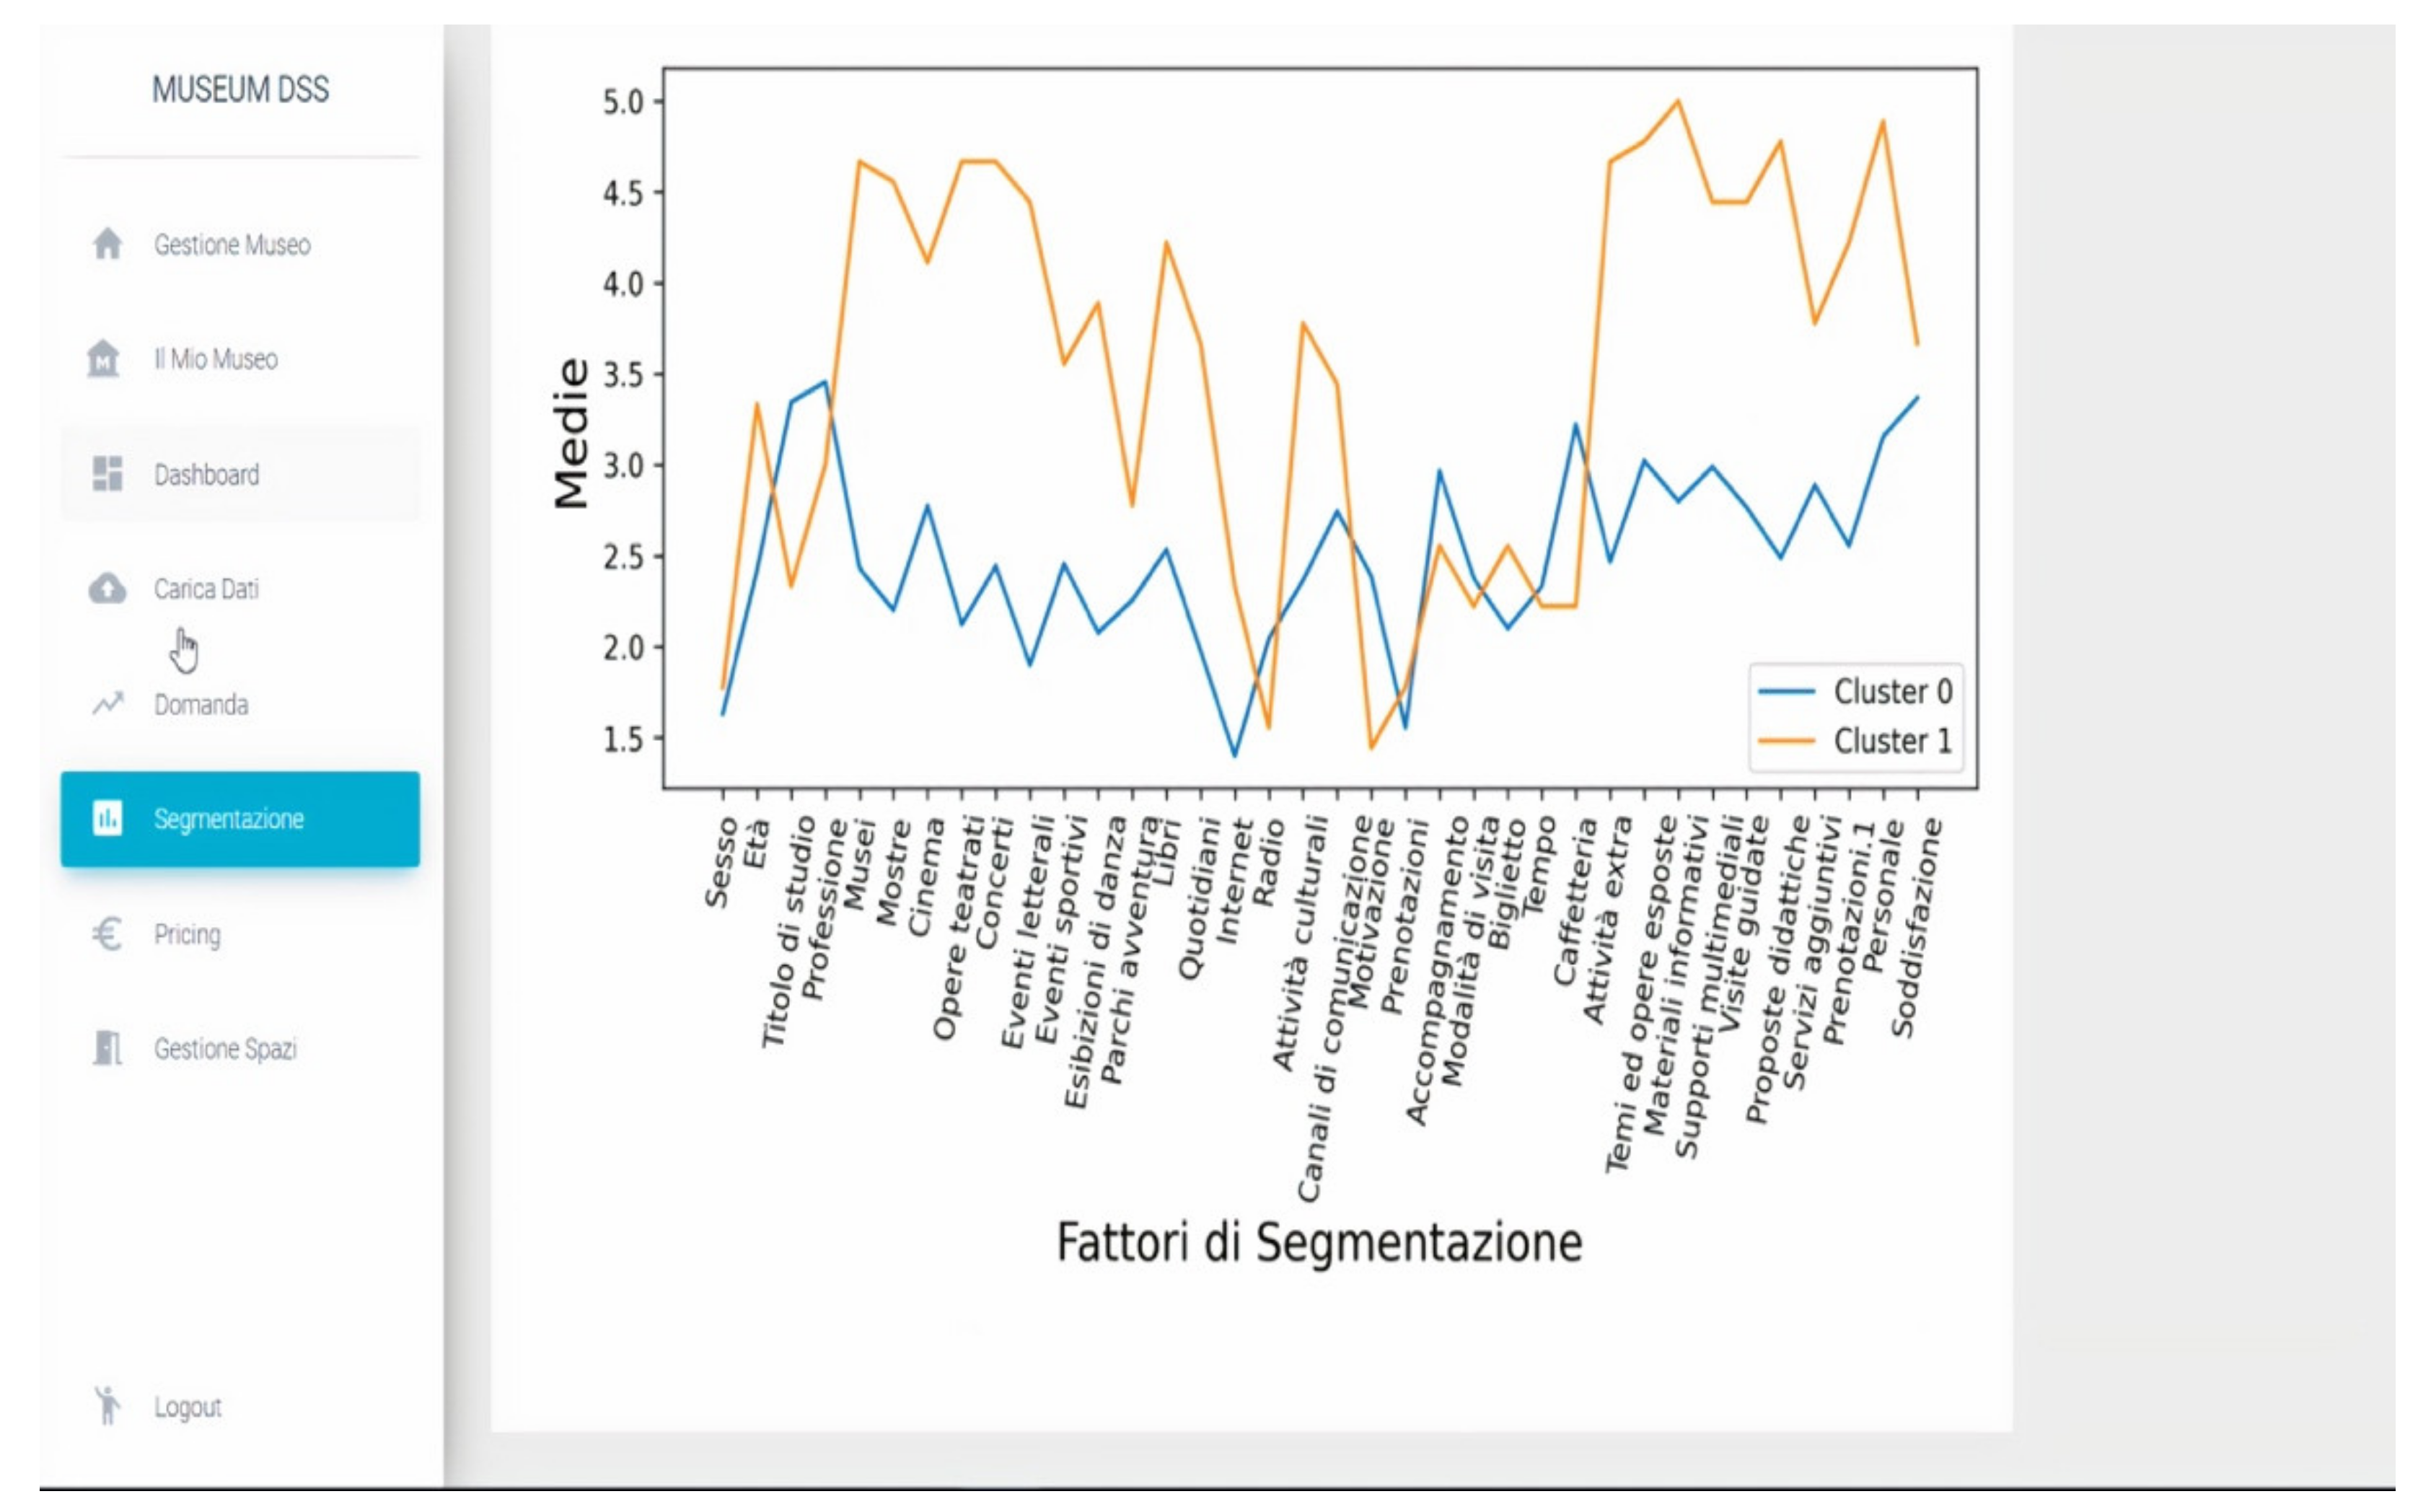
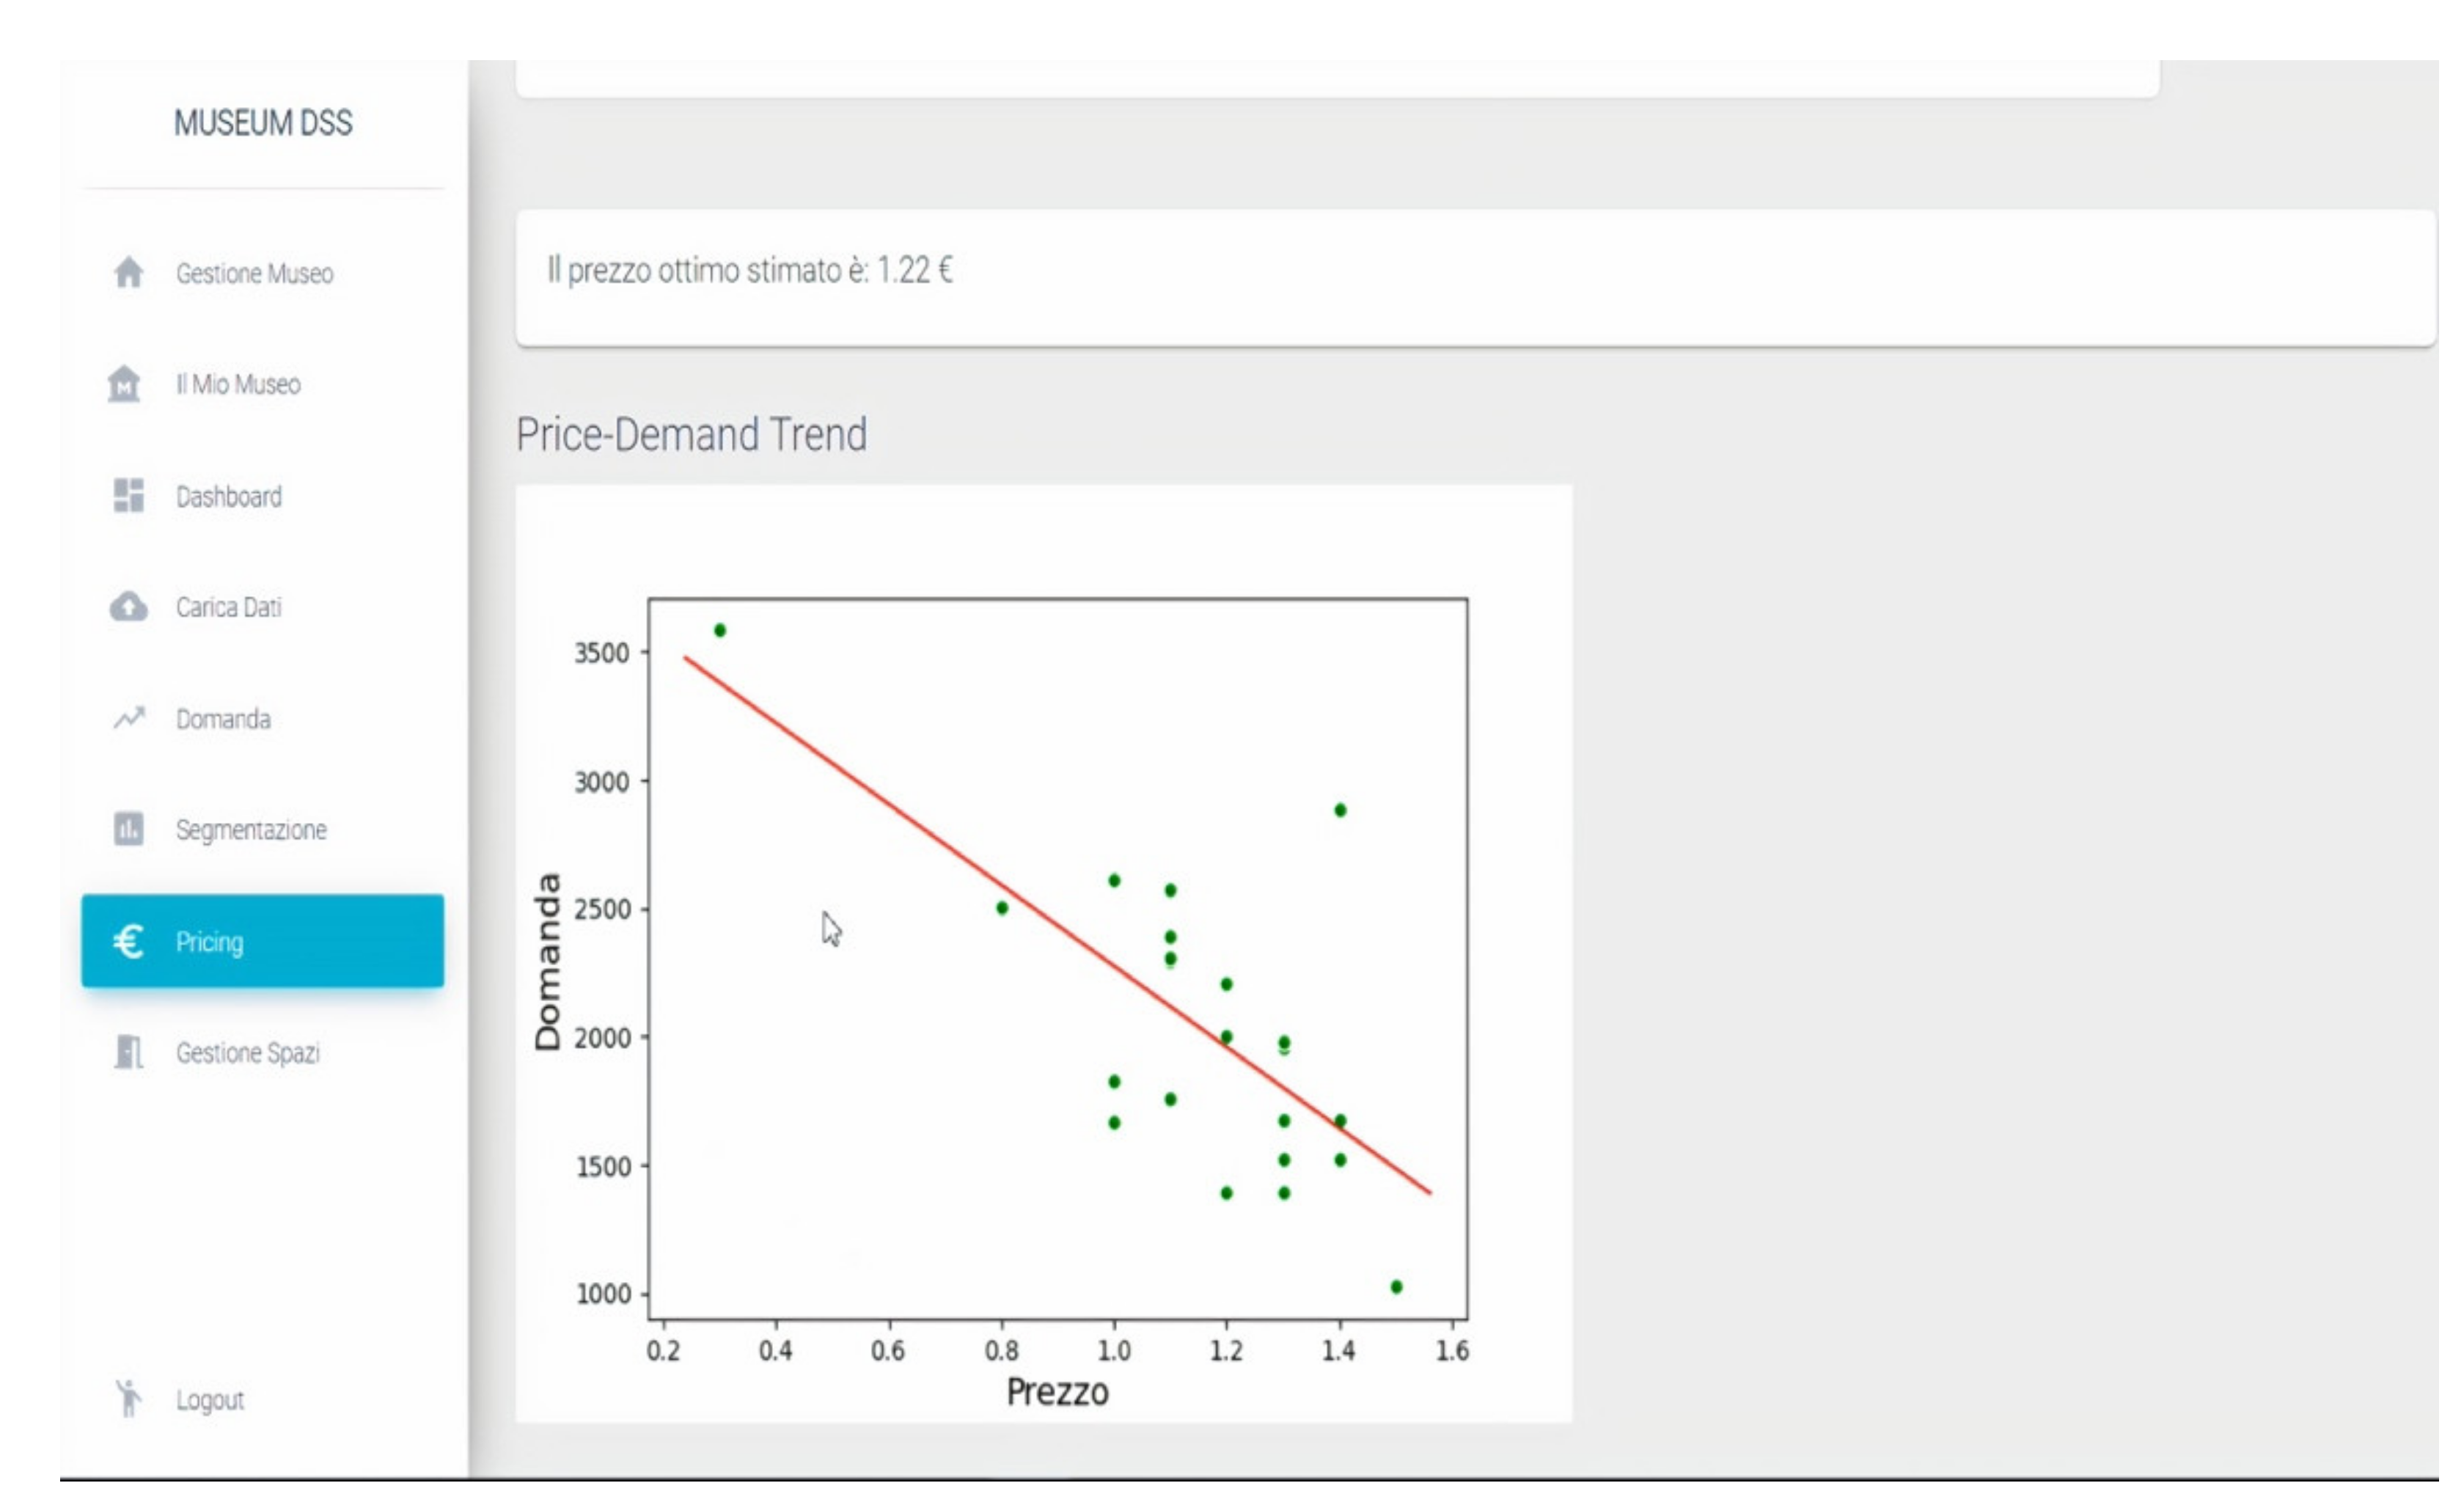
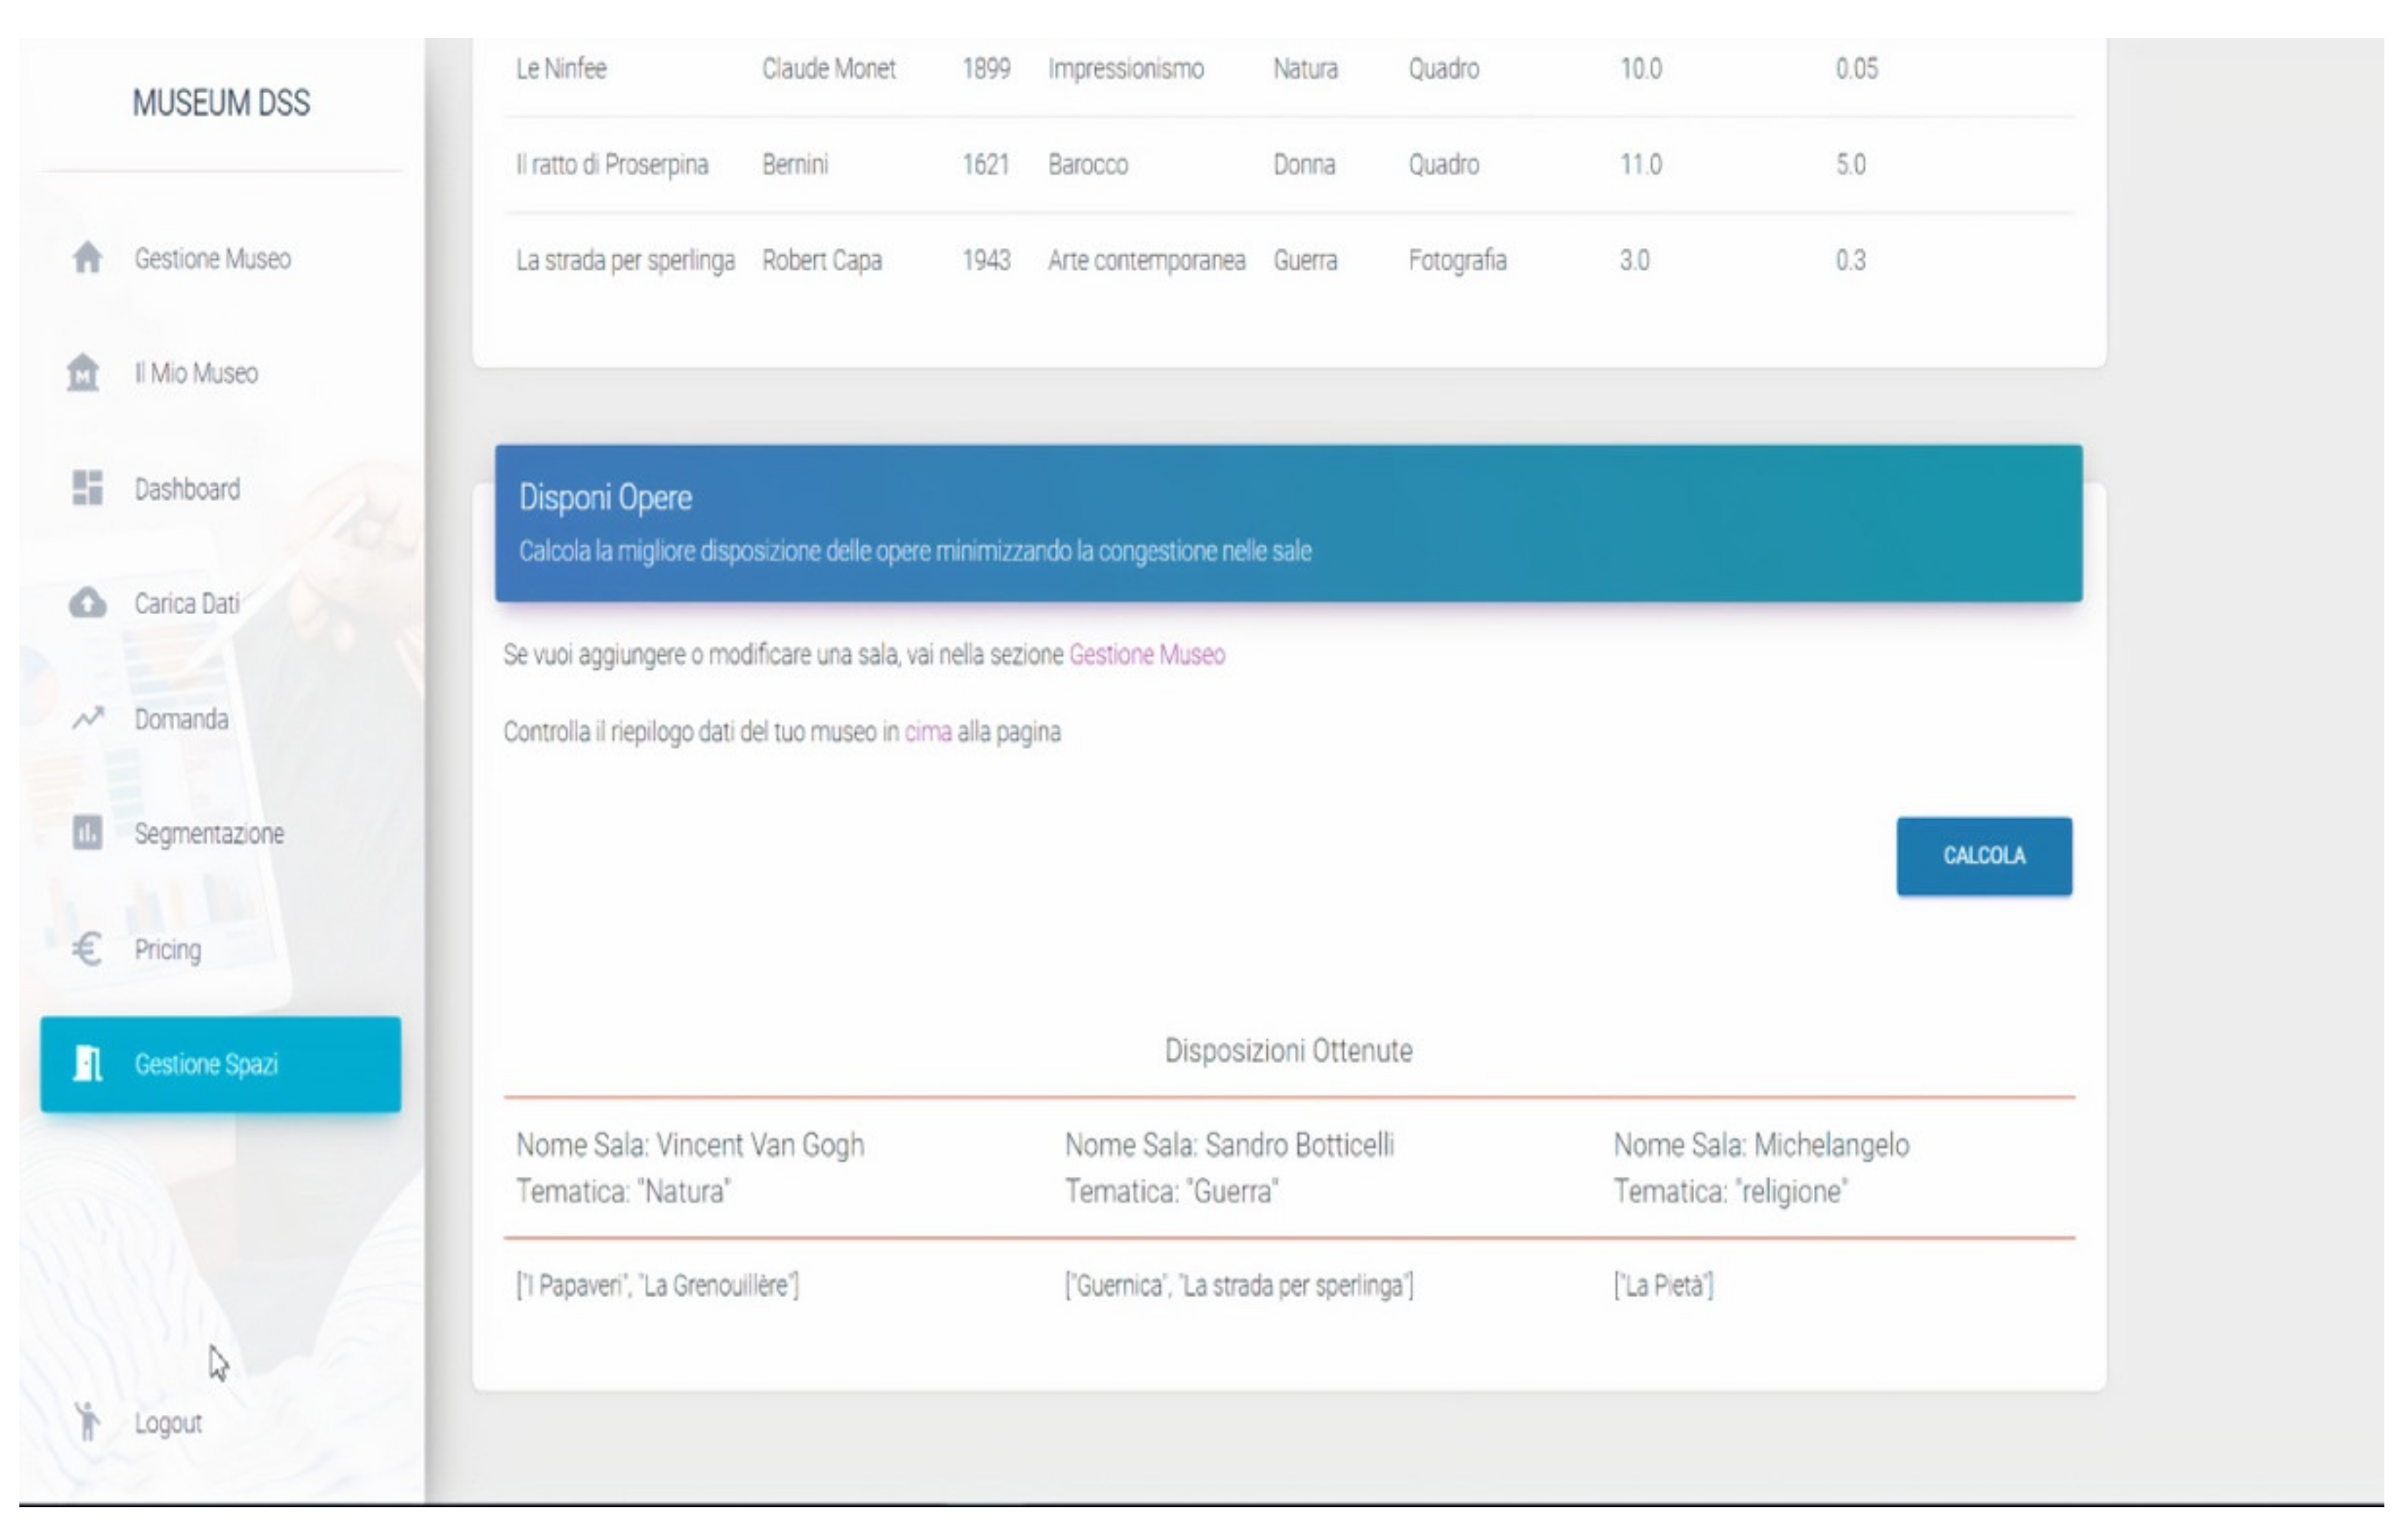
Table 1.
Annual visitor attendance and sample size.
| Annual Number of Visitors | Suggested Sample Size |
|---|---|
| 300–5000 | 100–300 |
| 5000–10,000 | 300–400 |
| 10,000–20,000 | 500–750 |
| >20.000 | >750 |
Publisher’s Note: MDPI stays neutral with regard to jurisdictional claims in published maps and institutional affiliations. |
© 2021 by the authors. Licensee MDPI, Basel, Switzerland. This article is an open access article distributed under the terms and conditions of the Creative Commons Attribution (CC BY) license (https://creativecommons.org/licenses/by/4.0/).
Share and Cite
MDPI and ACS Style
Di Matteo, E.; Roma, P.; Zafonte, S.; Panniello, U.; Abbate, L. Development of a Decision Support System Framework for Cultural Heritage Management. Sustainability 2021, 13, 7070. https://0-doi-org.brum.beds.ac.uk/10.3390/su13137070
AMA Style
Di Matteo E, Roma P, Zafonte S, Panniello U, Abbate L. Development of a Decision Support System Framework for Cultural Heritage Management. Sustainability. 2021; 13(13):7070. https://0-doi-org.brum.beds.ac.uk/10.3390/su13137070
Chicago/Turabian StyleDi Matteo, Eleonora, Paolo Roma, Santo Zafonte, Umberto Panniello, and Lorenzo Abbate. 2021. "Development of a Decision Support System Framework for Cultural Heritage Management" Sustainability 13, no. 13: 7070. https://0-doi-org.brum.beds.ac.uk/10.3390/su13137070
Note that from the first issue of 2016, this journal uses article numbers instead of page numbers. See further details here.