
An Examination of Green Credit Promoting Carbon Dioxide Emissions Reduction: A Provincial Panel Analysis of China


1
School of Economics, Yunnan University, Kunming 650500, China
2
School of Government, Yunnan University, Kunming 650500, China
3
School of Economics, Guizhou University, Guiyang 550000, China
*
Authors to whom correspondence should be addressed.
Sustainability 2021, 13(13), 7148; https://0-doi-org.brum.beds.ac.uk/10.3390/su13137148
Submission received: 12 May 2021
/
Revised: 14 June 2021
/
Accepted: 21 June 2021
/
Published: 25 June 2021
(This article belongs to the Special Issue The Economics of Greenhouse Gases Emission Reduction)
Abstract
:The implementation of green finance is a powerful measure to promote global carbon emissions reduction that has been highly valued by academic circles in recent years. However, the role of green credit in carbon emissions reduction in China is still lacking testing. Using a set of panel data including 30 provinces and cities, this study focused on the impact of green credit on carbon dioxide emissions in China from 2006 to 2016. The empirical results indicated that green credit has a significantly negative effect on carbon dioxide emissions intensity. Furthermore, after the mechanism examination, we found that the promotion impacts of green credit on industrial structure upgrading and technological innovation are two effective channels to help reduce carbon dioxide emissions. Heterogeneity analysis found that there are regional differences in the effect of green credit. In the western and northeastern regions, the effect of green credit is invalid. Quantile regression results implied that the greater the carbon emissions intensity, the better the effect of green credit. Finally, a further discussion revealed there exists a nonlinear correlation between green credit and carbon dioxide emissions intensity. These findings suggest that the core measures to promote carbon emission reduction in China are to continue to expand the scale of green credit, increase the technology R&D investment of enterprises, and to vigorously develop the tertiary industry.
1. Introduction
According to the Intergovernmental Panel on Climate Change (IPCC), there is about 1.0 °C of global warming above pre-industrial levels, and this is likely to reach 1.5 °C between 2030 and 2052 if it continues to increase at the current rate [1]. Greenhouse gas (GHG) emissions, especially carbon dioxide (CO2) emissions produced by human activities, are considered the main causes of climate change and global warming [2]. In 2016, global carbon emissions reached 33.819 billion tons, which is 3.67 times as much as the amount of global carbon emissions in 1960 [3]. Such a large amount of carbon emissions not only becomes a cause of extreme weather, but also brings about the melting of glaciers and permafrost, which destroys ecological balance. In the long run, it will also directly affect human health and quality of life [4]. Unsurprisingly, how to achieve carbon reduction and become carbon neutral has emerged as a global concern. The United Nations Framework Convention on Climate Change (UNFCCC) is an international mechanism for addressing climate change, which is established with the goal of “preventing dangerous human interference in the climate system”. The entry into force of the Paris Agreement also shows that the international community has reached such a consensus: multilateral cooperation to deal with the global challenge of climate change is necessary; global green, low-carbon, and sustainable development has become the general trend.
China, the largest developing country in the world, is also the world’s largest carbon emitter. According to the global carbon emission data released by the World Bank, the mainland of China emits about 10 billion tons CO2 each year, which accounts for 27–28% of global emissions [5]. Therefore, China shoulders an important task in global carbon emissions reduction. In the China–U.S. Joint Announcement on Climate Change issued in 2014, China set a target for its greenhouse gases output to peak “around 2030”, and intended to increase the share of non-fossil fuels in primary energy consumption to around 20% by 2030. In order to achieve these goals at an early date and promote the transformation of old and new economic kinetic energy, the Chinese government proposed the comprehensive concept of “green development” in the 13th Five Year Plan, which emphasized the development concept of “innovation, coordination, green, open and sharing”. Moreover, in the report to the 19th National Congress of the CPC, President Xi emphasized “to build a market-oriented green technology innovation system, develop green finance, and expand energy conservation and environmental protection industry, clean production industry, and clean energy industry” [6]. Recently, in the development proposal of nation’s 14th Five Year Plan, “green finance” was emphasized again.
Green finance is a broad concept. According to the research of Jiang et al. [7], in a narrow sense, green finance refers to the investment and financing activities serving green development, while in a broad sense, it generally refers to all kinds of financial services provided for green development. Green financial instruments include not only green credit, green bonds, green funds, and green insurance, but also carbon emission trading systems and green risk investment. Among them, green credit is a means of using financial leverage to achieve environmental regulation, which is undoubtedly one of the most useful means to promote carbon emissions reduction and green development, theoretically. For one, it sets up a strict loan access threshold and the ecological environment elements are included in the assessment scope of the credit application so as to avoid large-scale credit funds flowing into high emission enterprises; further, green credit aims to guide more funds to flow into green industries and projects, so as to feed the financial industry back with good ecological economic benefits in the future and promote a virtuous cycle of finance and ecology. In order to better exploit the role of green credit in carbon reduction and environmental regulation, from 2012 to 2016, the China Banking Regulatory Commission (CBRC) and the Central Government issued a number of targeted policies, such as Key Evaluation Indicators for the Implementation of Green Credit, Guidelines for Green Credit, Guiding Opinions on the Construction of a Green Financial System, etc. [8].
However, in the practice of China, has green credit contributed to the reduction of carbon emissions? What are the transmission mechanisms by which green credit contributes to carbon reduction? There is still a lack of empirical evidence to test whether green credit has a significant dampening effect on carbon emissions. Against this backdrop, by using a set of balanced panel data from 30 provinces (municipalities, autonomous regions) from 2006 to 2016 in China, this paper tests the carbon dioxide emissions reduction effect of green credit, analyzes its transmission mechanism, and discusses its robustness and substantial heterogeneity. Our contributions lie in the following. Firstly, this is one of the few systematic studies to empirically exam the correlation between the green credit scale and CO2 emissions of China, the relationship of which is proven by different econometric models in this paper. Compared with Jiang’s research [7], our analysis is more detailed and the conclusion is more robust. Further, we find that industrial structure upgrading and technological innovation input are two important medium mechanisms by which green credit exerts an influence on CO2 emissions that cannot be underestimated, thereby enriching the theoretical literature on the economic and environmental consequences of green credit. Last but not least, under the constraints of industrial structure and technological innovation, is the effect of green credit still linear? Through a threshold model test, we further verify the possible nonlinear relationship between green credit and carbon emissions, and this finding provides useful implications for policy makers.
The reminder of this paper is organized as follows: Section 2 reviews the relative literatures; Section 3 proposes a theoretical hypothesis; Section 4 and Section 5 analyzes the empirical design and results; Section 6 further discusses the nonlinear relationship between green credit and CO2 emissions; and Section 7 summarizes research conclusions and policy recommendation.
2. A Brief Review of Literature
The interaction between economic development and climate change has always been a focus of academic research. There are abundant research results on the influencing factors of carbon emissions in China and abroad from the perspective of economics, and key driving factors identified are economic growth, technological innovation, urbanization, industrial structure, financial development, energy consumption structure, and so on [9,10,11,12,13]. However, there is currently no consensus in the academic community on the impact of green finance, including green credit, on carbon emissions. After a systematic review of the literature, we find that relevant prior studies mainly focused on the following three aspects.
2.1. Financial Development and Carbon Emissions
At present, there is little literature focusing on the impact of green credit on carbon emissions, but there are more studies on the impact of financial development on carbon emissions. Green credit is essentially a financial tool, so it is necessary to learn from previous studies on financial development. Different conclusions have been drawn regarding the impact of financial development on carbon emissions. Alex O. et al. [14] carried out a comparative analysis of financial market development on CO2 emission intensity by using a comprehensive panel dataset of a total of 83 countries over the period 1980–2015 and found that in developed economies, financial market depth and efficiency help to reduce carbon emissions intensity; in contrast, in frontier financial economies, the overall financial market development and its sub-measures, financial market access, and efficiency increase the intensity of carbon emissions. Kunofiwa [15] argued that in West African countries, financial development can have both positive and negative effect on carbon emissions, and among the financial instruments, domestic credit provided by financial sectors resulted in the significant increase in carbon emissions. Mugableh [16] found that financial development has led to a decline in the amount of carbon emissions in Jordan in both the short and the long term. As for Malaysia and Pakistan, carbon emissions were found to have been lowered by financial development [17,18]. On the study of Chinese provinces, scholars also hold different views. Hao et al. [19] made the point that the impact of financial development on carbon emissions is constrained by the level of economic development. At low levels of economic growth, financial development reduced carbon emissions, but at high levels of economic growth, results are just the opposite. However, Xiong et al. [20] and Xing et al. [21] all supported the view that financial development contributes to carbon emissions reduction.
The impact mechanism of financial development on carbon emissions mainly focuses on several aspects. The financial market can help reduce carbon emissions intensity when it provides financial assistance including credit to domestic firms to acquire environmental and clean technology for manufacturing purposes [15]. However, financial development increases carbon emissions when it attracts foreign investors (FDI), because it boosts the amount of energy usage and the scale of economic activities in the host country, which is a double-edged sword that has a serious effect on China’s economic growth and environmental pollution [22]. Other scholars argued that financial development is conducive to reducing carbon emissions through green investment for the renewable energy sector [23].
2.2. Green Credit
Green credit is often referred to as sustainable financing or environmental financing, which refers to a series of policies, systems, and practices to promote energy conservation and emission reduction and prevent environmental risks by means of credit [24]. Specifically speaking, these principles include using appropriate credit policies and means to provide preferential loans for energy-saving and environmental protection projects; raising the loan threshold for high energy consumption and high emission projects; stopping various forms of new credit support for existing eliminated projects and taking measures to recover the loans already issued; and not providing credit support for new projects of restricted and eliminated categories.
In 2002, green credit loan criteria (now called the Equator Principles) was proposed by the World Bank’s International Financial Corporation (IFC) and the Bank of Holland [25]. The significance of Equator Principle is that it makes the fuzzy environmental and social standards in project financing clear and specific for the first time and provides an operational guide for banks to assess and manage environmental and social risks. By the end of 2007, there were 56 financial institutions adopting the Equator Principles. According to the Equator Principles, for corporations with environmental problems, banks should control the loan scale or shorten the loan period and raise interest rates to avoid risk. In China, the start of green credit was relatively late. In July 2007, the State Environmental Protection Administration, the People’s Bank of China, and the China Banking Regulatory Commission jointly issued “opinions on implementing environmental protection policies and regulations and preventing credit risks”, remarking that the economic means of green credit has entered the main battlefield of pollution reduction in China.
A number of previous studies primarily analyzed related issues on green credit, and thus, how to promote the related policies in China. For instance, Tan and Fu [26] made the point that, under the background of industrial structure upgrading, green credit can help commercial banks get profits from environmental protection industries and it is a powerful financial instrument for energy conservation and emission reduction. Zhang et al. [27] investigated the implementation of the green credit policy both at the national and provincial levels in China and found that although the green credit policy makes some efforts to control “two-high and one overcapacity” industries, it is still not fully implemented. By contrast, integrating green credit with environmental performance rating has better practicability. According to the proportion of loan balance of the four major state-owned banks, there is still very much room for China’s green credit development [28].
For the implementation effect of green credit, there is a great controversy in academic circles. Song et al. [29] used China’s inter-provincial panel data from 2007 to 2017 to examine the impact of green finance on the high-efficiency utilization of energy and pointed out that green credit has a positive impact on the high-efficiency utilization of energy in China. Research by Hu et al. [8] showed that green credit can influence industrial structure through capital and funding channels of enterprises, and on the whole, China’s green credit has significant effects on the transformation of the industrial structure. Moreover, both green credit policy and green credit development reduced the debt financing cost of green enterprises and were helpful to the development of environmentally friendly enterprises [30]. Nevertheless, some other scholars believe that the implementation effect of green credit is not optimistic, especially in developing countries. In India, although there are policies to develop green banks, commercial banks are not motivated enough to develop green credit. Similarly, in China, due to the competition of economic growth among provinces, the collusion between the government and commercial banks leads to false environmental information disclosure, and the effect of green credit policy will be greatly reduced [25,31].
2.3. Green Credit and Carbon Emissions
Many studies show that green credit affects energy efficiency, industrial structure, and resource allocations [29,32,33], but few studies directly analyze the impact of green credit on carbon emissions. From the perspective of the supply chain, green credit policy in South Korea enables manufacturers to reduce pollutions and carbon emissions by cooperating with suppliers [34]. Moreover, Simin An et al. [35] designed a GCF model for a supply chain by imposing a hard constraint on carbon emissions. They found that under a relatively strict carbon emission policy, the manufacturer can set an appropriate green investment range to achieve a win-win situation with the supplier, which implied that green credit can help manufacturers achieve green financing and meet the requirements of carbon emissions reduction. In the practice of China, Yan et al. [36] found that under the constraint of FDI, the impact of credit scale on China’s carbon dioxide intensity is an inverted U-shape. Jiang et al. [7] believe that green credit and green venture capital have a direct contribution to China’s carbon emissions reduction, but their research is too simple and lacks mechanism analysis.
In short, at present, academia does not pay much attention to the issue of green credit and carbon emissions in China, but the research on financial development and green credit development has been more comprehensive. Green credit started late in China, but its impact on the environment cannot be ignored. From the perspective of China’s provincial level, does green credit really contribute to carbon emission reduction? This is the question to be answered in this paper.
3. Mechanism Analysis and Hypothesis Formulation
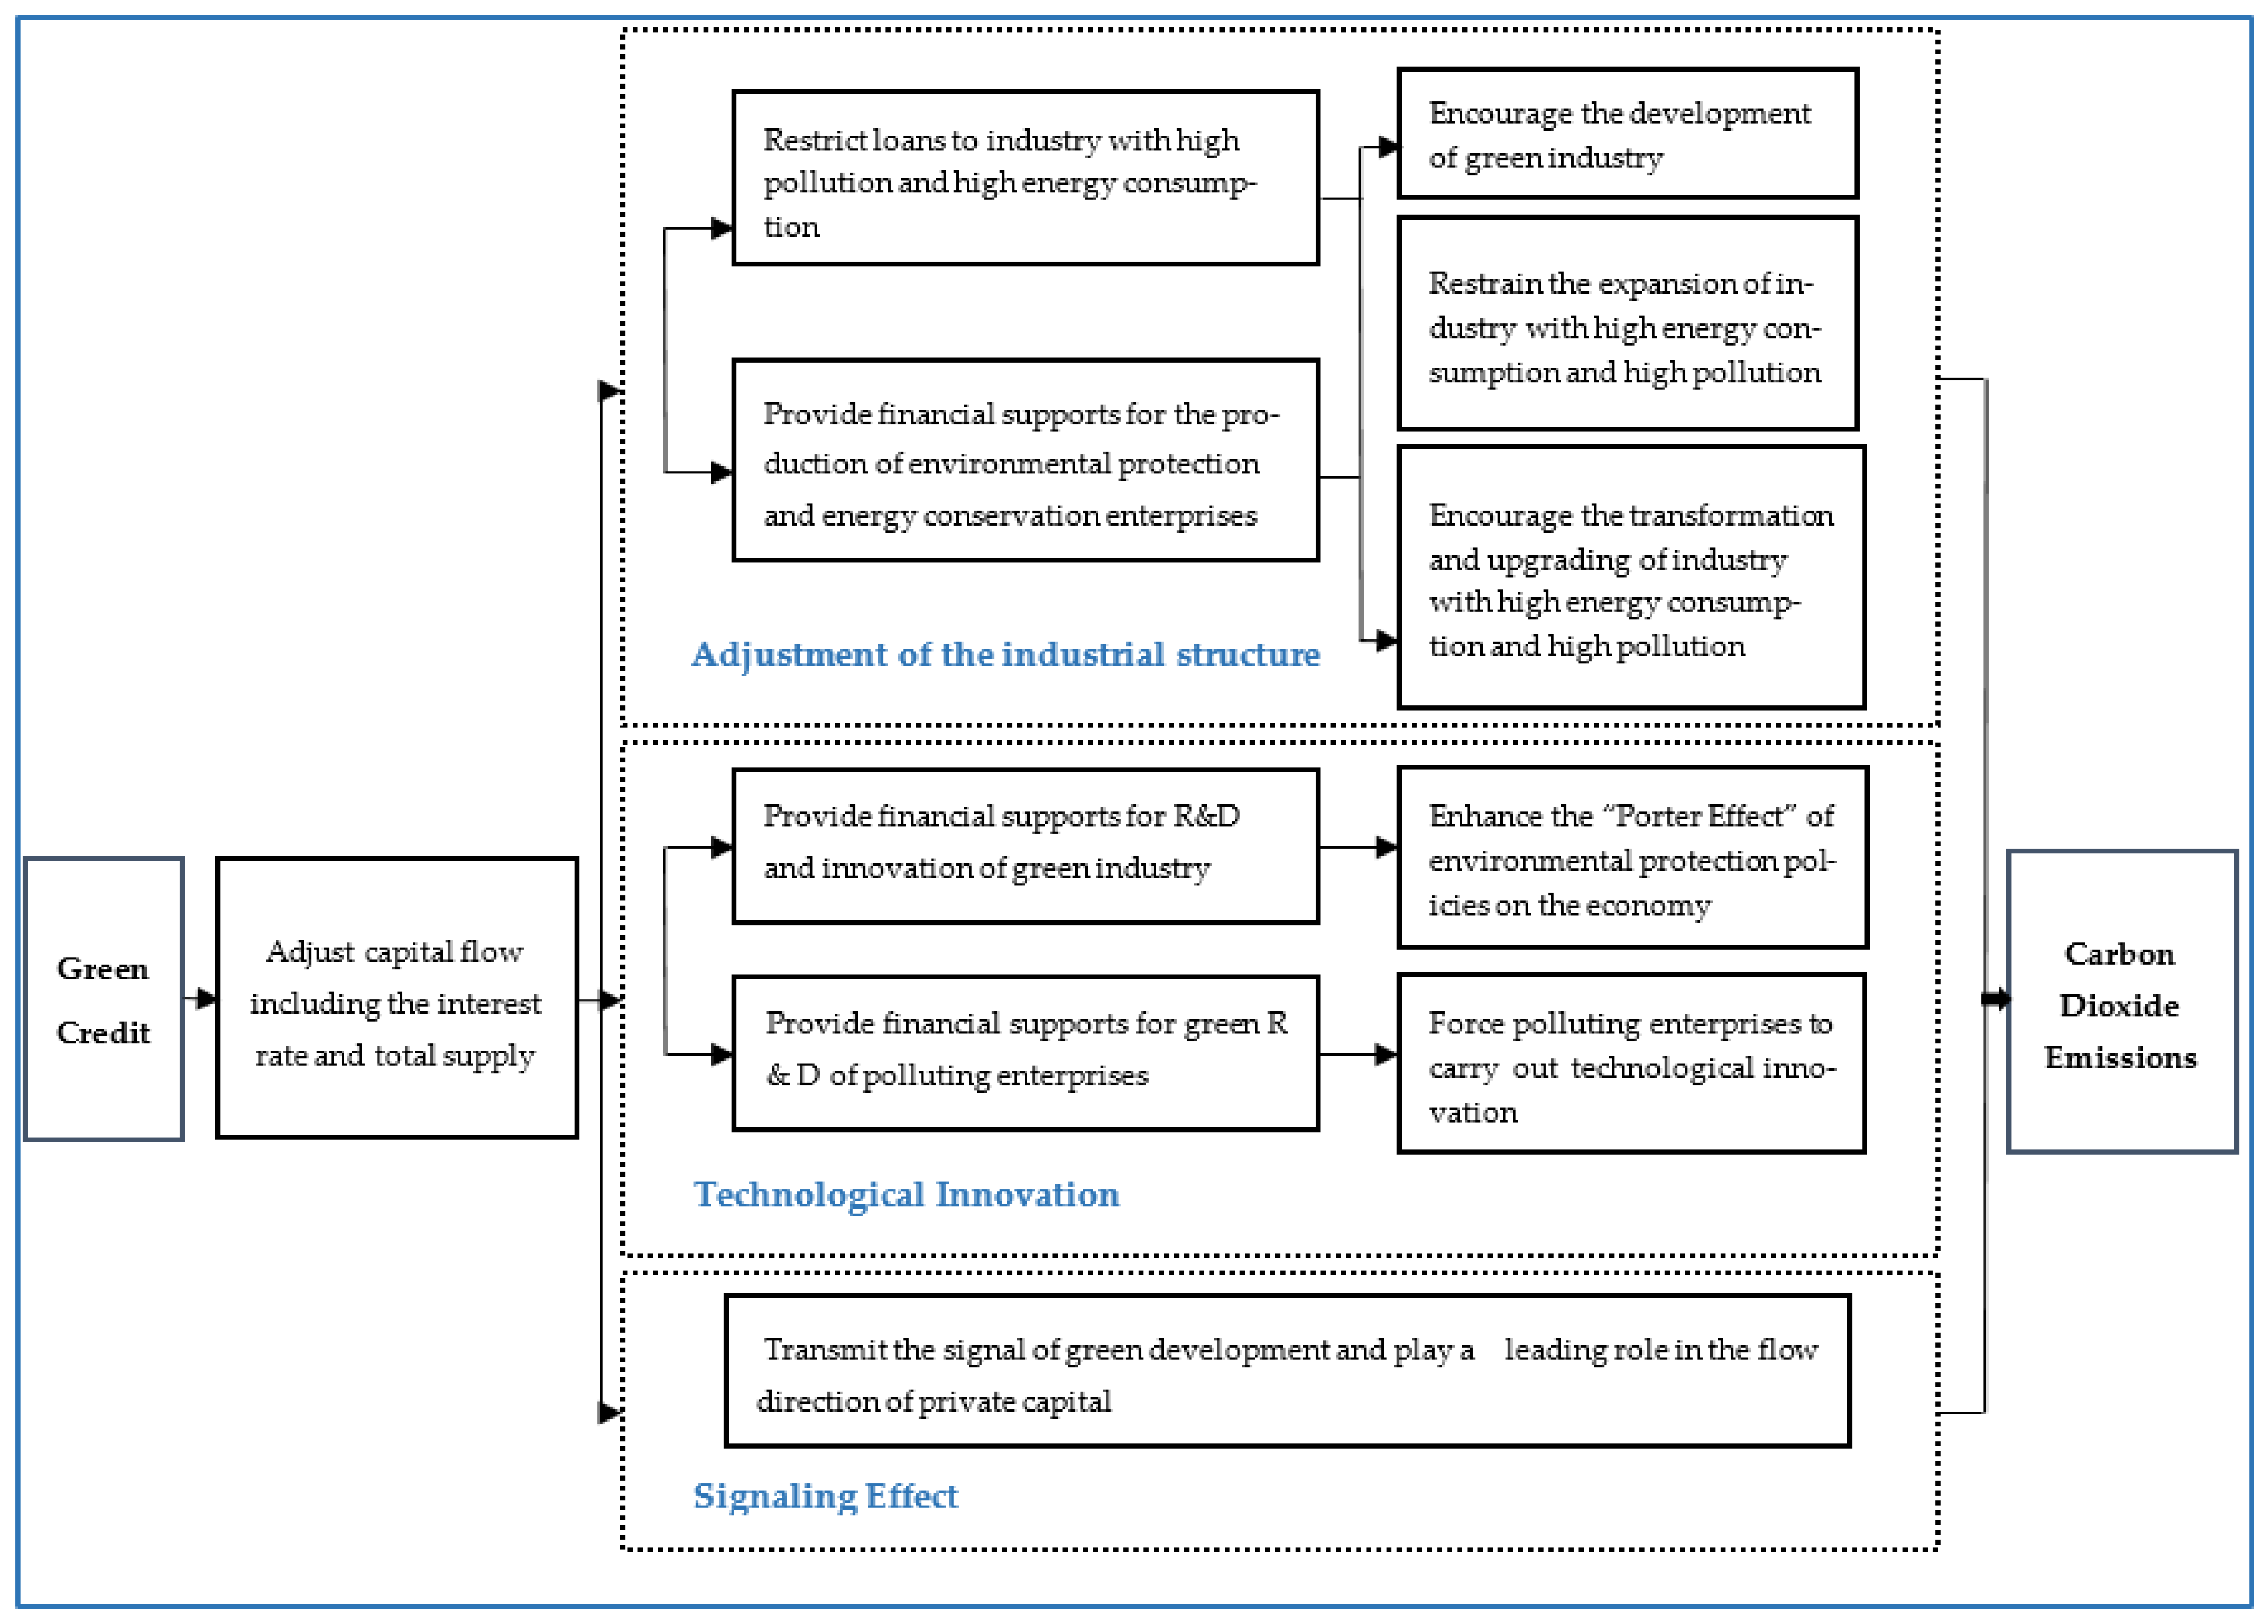
Under the current financial mode dominated by credit in China, green finance mainly affects the environment through the credit markets. As a new concept of finance instruments, green credit may exert indirect influence on carbon emissions intensity by following channels, including an industrial structure adjustment mechanism, a technology innovation mechanism and so on, which are exhibited in Figure 1.
First of all, from the national level, green credit guides the flow of capital through capital advocacy and correction mechanism, and then guides the adjustment of industrial structure, which implies capital flows to low emission industries under the guidance of financial policies, helping to reduce CO2 emission intensity. More precisely, due to banking/financial institutions being able to control the direction of credit and total supply, by using interest rate instruments, financial institutions provide credit with high interest rates for industry with high pollution, high energy consumption, and overcapacity. At the same time, they implement a low-interest loan policy to satisfy the fund demand of energy saving and environment protection companies [8]. This policy phenomenon includes two implicit goals. For one, when financing is constrained, the production capacity of heavy polluting enterprises will decrease; energy consumption and pollutant emissions will decrease, which will help reduce CO2 emissions. For another, due to the total amount of credit being relatively fixed, the flow of credit funds to “two low” industries will increase relatively, which is conducive to enterprises producing more low-carbon products or providing more low-carbon technologies and reducing CO2 emissions. Meanwhile, in order to maintain the market share in the future market competition, enterprises with high energy consumption and high pollution must carry out industrial transformation and restructuring, which is beneficial to optimize the industrial structure and will finally help to reduce CO2 emissions. In China, a typical case of green credit leading capital flow and making some polluting enterprises withdraw from the market due to lack of capital is the shutdown of several coking enterprises in Shanxi province. In 2007, in the list of the first batch of regulated enterprises, 117 high energy consuming enterprises in Shanxi Province were cut off from loans [37]. Due to the lack of cash flow, most enterprises were forced to stop production or even declare bankruptcy, while some enterprises sought new development in other industries. Green credit was beginning to bear fruit. It can be seen that green credit is conducive to the development of low emission industries, the adjustment of industrial structure, and the promotion of CO2 emissions reduction.
Secondly, green credit will directly or indirectly affect the technological innovation of enterprises through financing constraints, and then affect CO2 emissions. Specifically, on the one hand, enterprises need capital investment to carry out technological innovation, and the policy dividend brought by green financial policy to “two low” enterprises can ease their financing constraints. More R&D funds will help these enterprises improve their technological innovation ability and enhance the “Porter Effect” of environmental protection policies on the economy; on the other hand, green credit also provides financial support for the research and development of green technologies for the “two high” enterprises, helping them to reduce their negative impact on the environment through technological innovation and help to reduce carbon emissions intensity [38]. The ratio of R&D investment to GDP in China is increasing year by year. In 2006, R&D investment accounted for 1.42% of the GDP, in 2011 it was 1.84%, and in 2016 it rose to 2.1%. Part of the R&D investment comes from the support of green credit. A typical case of green credit promoting technological progress is that green credit provides financial support for the introduction and development of new energy technology in China. By the end of June 2016, the balance of green credit of 21 major financial institutions in China had exceeded RMB 7 trillion, and their main investment directions were the environmental protection industry and new energy industry, including new energy automobile manufacturing, green energy power generation, new energy heating, etc. The adoption of green energy technologies, such as new energy power generation and the use of clean coal, has greatly promoted carbon emissions reduction in northern China, which used to be the main area of thermal power generation. Furthermore, in the future, green energy power generation including nuclear power, hydropower, wind power, photovoltaic and biomass power generation will play an increasingly important role in the green economic development.
Last but not least, the leading role of green credit for capital cannot be ignored. Green credit in China has a policy-oriented effect, which provides a favorable signal for the flow of private capital. After understanding the state’s policy support for low emission enterprises, private capital will automatically flow into the green industry and its related R&D industry under the guidance of the decision-making of maximizing interests, which will undoubtedly contribute to CO2 emissions reduction.
On this basis, the following hypotheses can be obtained.
Hypothesis 1.
Green credit can cause an inhibiting impact on carbon dioxide emissions in China.
Hypothesis 2.
Green credit helps to reduce carbon dioxide emissions by promoting industrial structure upgrading.
Hypothesis 3.
Technological innovation is another mechanism for green credit to promote carbon dioxide emissions reduction.
4. Data and Methodology
4.1. Sample Selection and Data Resources
This paper aims to test whether China’s green credit is conducive to carbon emissions reduction from a macro perspective; thus, we adopt provincial panel data from 2006 to 2016 as the samples and obtained observations of 330 effective samples in total. All the main data are from China Statistical Yearbook (2007–2017), China Industry Statistical Yearbook (2007–2017), China Energy Statistical Yearbook (2007–2017), Finance Yearbook of China (2007–2017), National Bureau of Statistics, Wind Database, and statistical yearbooks of each province and city. Due to the availability of data, Tibet, Hong Kong, Macao, and Taiwan are not included in the samples of this study.
As for provincial data on carbon dioxide emissions, referring to Shan et al. [39,40,41], we validated the provincial CO2 emissions data based on energy consumption and carbon emission factors. The original data of carbon dioxide emissions is from CEADs database (Carbon Emission Accounts and Datasets: http:/www.ceads.net/, accessed on 20 April 2021). Furthermore, the data for the provincial EPU index are from the study of Yu et al [42]. The provincial marketization index of China comes from the research by Fan et al [43].
4.2. Empirical Model
To investigate the impact of green credit on CO2 emissions in a national economy, combined with the analysis above, we built the following linear regression model.
Further, considering the path dependence and inertia characteristics of CO2 emissions, and the endogenous problem that may exist in static panel model, we also constructed a dynamic panel data model in this study.
In order to test the intermediate mechanism role of industrial structure upgrading (ISS) and technological innovation (TI) separately, on the basis of model (1), referring to Baron and Kenny [44], the following models were established.
where i, t, and represent province (i = 1, 2, 3, …, 30), year, and the disturbance term varying with individual and time, respectively. CarbonIntensity and Greencredit represent the CO2 emission level and green credit level in different provinces. ISS and TI are two mediating variables, and Controls implies a set of control variables. α, β, γ, and θ are the parameters to be estimated.
4.3. Variable Definition
4.3.1. Explained Variable—CO2 Emissions Intensity
There are several ways to measure regional CO2 emissions. This paper uses carbon dioxide emissions intensity to measure China’s provincial CO2 emissions. Carbon dioxide emissions intensity is the ratio of carbon dioxide emission to real GDP, representing the carbon dioxide emission of each unit of economic output. According to the Environmental Kuznets Curve, CO2 emission is closely related to the development of national economy, thus we chose carbon dioxide emissions intensity as the dependent variable. In addition, compared with the total carbon emissions and average carbon emissions, the carbon dioxide emissions intensity index was more comparable to the samples of different economic scales. The carbon dioxide emissions intensity was logarithmically treated as the explained variable in our study.
In this equation, referring to the study by Shan et al. [38,39,40], the calculation formula of carbon dioxide emission in each province is:
where ADit (activity data) are the fossil fuels combusted within the province boundary measured in physical units (metric tons of fuel expressed as t fuel), and EFit are the emission factors for the relevant fossil fuels [39].
4.3.2. Core Explanatory Variable—Green Credit
In the previous studies of Chinese scholars, there are four ways to measure green credit: the proportion of green credit in total credit of all the banks; the proportion of loans for energy conservation and environmental projects; the “bank loans scale” in the industrial pollution control investment; and the reverse indicator of proportion of interest expenditure in six high energy consuming industries [45]. Considering that the interest expenditure can reflect the credit scale, inspired by Hu et al. [8] and Jiang et al. [7], in this paper, the proportion of interest expenditure of non six high energy consuming industries in the total industrial interest expenditure of each province was selected to represent green credit level. The calculation formula of green credit is:
where the six industries with highest energy consumption include: the production and supply of electricity and heat, ferrous metal smelting and rolling industry, nonferrous metal smelting and rolling industry, manufacture of nonmetallic mineral products, manufacture of chemical raw materials and products, and the petroleum processing coking and nuclear fuel processing industry.
4.3.3. Mediating Variables
In this study, in order to examine Hypothesis 2 and Hypothesis 3, we set the two variables of industrial structure upgrading (ISS) and technological innovation (TI) as the mediating variables.
Today, under the great impact of information technological revolution, the growth rate of the tertiary industry is faster than that of the secondary industry and the industrial structure presents a trend of tertiary industry development. Therefore, by referring to Gan et al. [46], the ratio of output values of the tertiary industry to the secondary industry was used as an indicator for measuring industrial structure upgrading.
Generally, technological innovation needs a lot of capital investment, so we chose the proportion of provincial R&D investment in GDP to measure technological innovation.
4.3.4. Other Control Variables
Referring to previous literature, the control variables included: (1) variables related to open economy: foreign direct investment (FDI); (2) variables related to government intervention: economic policy uncertainty (EPU), governmental environmental regulation input (ER), and degree of fiscal decentralization (FD); (3) an energy-related variable: energy consumption structure (ECS); and (4) a market variable: degree of marketization (ML).
Energy consumption structure (ECS) is a direct factor affecting carbon emissions. Although FDI can directly affect a country’s economic development and indirectly affect carbon emissions, the mechanism of FDI on carbon dioxide emissions is complex, so its impact is uncertain. Yu et al. pointed out that economic policy uncertainty (EPU) will increase the carbon emission of manufacturing industry, which is not conducive to China’s carbon emission reduction [42]. A higher degree of marketization (ML) and more environmental regulation input (ER) may help to control the carbon emissions. As for fiscal decentralization, it is a unique fiscal phenomenon in China. There is a certain competitive relationship among governments. For one, it helps local governments to provide public services more effectively and strengthen environmental regulation. For another, due to economic competition, it may lead to local governments focusing on short-term economic growth and ignoring environmental problems. Therefore, the impact of fiscal decentralization on regional carbon emissions is uncertain.
The definitions and measurements of all variables are shown in Table 1.
5. Empirical Findings and Analysis
5.1. Benchmark Regression Results
In order to facilitate comparison and improve the robustness of the estimation results, this paper uses a mixed OLS model, panel random effects model, panel fixed effects model, and DIFF-GMM model to estimate Formulas (1) and (2), and the estimation results are shown in Table 2. After the LM test, the results show that the random effect model is much better than the mixed OLS model. Since the Chi-square value in Hausman test report was 56.51, and its corresponding p value was 0.000, the two-way fixed effect model is much more suitable than random effect model. Thus, columns (3)–(5) in Table 2 are the final static panel regression results. The result of column (3) shows that green credit is significantly negatively correlated with the carbon dioxide emissions intensity. According to the results in column (4), after controlling a series of regional characteristic variables related to open economy and government intervention, the effect of green credit on carbon dioxide emissions intensity is still significantly negative. Considering energy consumption structure can directly affect the emission of greenhouse gases and the degree of regional marketization will indirectly affect regional green development, to avoid missing variables, we add these two contributing factors into column (5). Regression results in column (5) demonstrate that after controlling the impact of other factors on CO2 emissions, at the provincial level in China, green credit has a significant inhibitory effect on carbon dioxide emissions intensity.
Regarding control variables, FDI has a significant positive correlation with carbon dioxide emission, which may just verify the “pollution haven hypothesis” (PHH) [47]. Through trade and the transfer of production chains, developed countries may transfer high pollution and high energy consumption industries to developing countries, so as to reduce environmental costs. In addition, in order to attract foreign investment, developing countries will loosen the environmental regulation to introduce some industrial chains, causing environmental pollution. Therefore, foreign direct investment may lead to an increase in carbon dioxide emissions. The coefficient of fiscal decentralization is negative, which indicates that in China, fiscal decentralization helps the government to make full use of information advantages, provide efficient public services for local residents, and carry out environmental governance, which helps to control carbon emissions. Furthermore, the investment in environmental regulation also plays a positive role in promoting carbon emission reduction. The coefficient of ECS is significantly positive, implying that China’s coal-based energy consumption is still an important source of greenhouse gas emissions including carbon dioxide. Our research shows that a higher level of marketization process also contributes to carbon dioxide emissions reduction. The effect of economic policy uncertainty on carbon dioxide emissions intensity is not significant in our study.
Taking the endogeneity problem of green credit to carbon dioxide emissions intensity into consideration, due to the availability of provincial data, we failed to find an appropriate and effective tool variable, so we finally used the dynamic panel data model to control the possible endogenous problems. The differential GMM method was used to estimate the dynamic panel model (Formula (2)), and the estimated results are shown in column (6) in Table 2. In order to enhance the reliability of regression results, we tested the rationality of the model and the effectiveness of instrumental variables. Results in column (6) imply that there was first-order autocorrelation in the difference of the disturbance term, but there was no second-order autocorrelation; thus, the original assumption that the disturbance term has no autocorrelation is accepted. The corresponding p-value of the Sargan test was larger than 0.05, indicating that the original hypothesis that all instrumental variables are valid can be accepted. After controlling the endogenous problem, the regression coefficient of green credit on carbon dioxide emissions intensity was still negative at the 5% significance level, which is close to the estimated result of static panel data. The regression coefficients of FDI and ML changed, but the results were no longer significant. The possible reason is that the impact of FDI and marketization process on greenhouse gas emissions is more complex. After controlling the endogenous problems, the estimated results will change to some extent. In addition, results indicate that environmental regulation and fiscal decentralization are still important factors to restrain the intensity of carbon dioxide emissions.
All regression results in Table 2 suggest that after controlling for other variables, regional green credit policy significantly promotes the reduction of carbon dioxide emissions intensity, and our research Hypothesis 1 is confirmed.
5.2. Testing and Verification of the Intermediary Mechanism
The above empirical results reveal that green credit is conducive to carbon emissions reduction in China as a whole, but this macro analysis still lacks sufficient research depth. In the previous analysis of part 3, we proposed that the promotion effects of green credit on industrial structure upgrading and on technological innovation are perhaps two important intermediate mechanisms, and thus, in this part, the mediating effect Formulas (3)–(6) is tested in Table 3.
By referring to Baron and Kenny [44], we adopted a three-step regression method. Firstly, for comparison, column (1) reports the benchmark regression result, which regresses the dependent variable CarbonIntensity on the core independent variable Greencredit. Secondly, in column (2), we regressed the mediator on the independent variable. The dependent variable in column (2) is industrial structure upgrading and from the regression results, we found that, when the interference factors were controlled, the estimated coefficient of green credit was 0.6069, which was positive at a 5% significance level. This result proves that green credit has a significant positive role in promoting the upgrading of industrial structure. Thirdly, we regressed the dependent variable on both the independent variable and on the mediator. In column (3), by regressing carbon dioxide emissions intensity on both green credit and industrial structure upgrading, it was found that industrial structure upgrading has a significant negative effect on carbon dioxide emissions intensity. Moreover, although the estimated coefficient of green credit was still negative, the significance did not exist. Therefore, we have reasonable reasons to believe that one of the effective paths for green credit to promote the reduction of carbon dioxide emissions intensity is to promote the upgrading of industrial structure.
Similarly, columns (4) and (5) are examination results about the mediator variable TI. From column (4), it is apparent that green credit is beneficial to technological innovation. Estimation results in column (5) show that the estimated coefficient of technological innovation was −17.2667 with a 1% significance level, highlighting the obvious inhibitive influence of technological innovation on carbon dioxide emissions intensity. The estimated coefficient of green credit was still negative but no longer significant, which proves that technological innovation is another reliable intermediary factor in the effects of green credit on carbon dioxide emissions.
From the perspective of control variables, columns (3) and (5) illustrate once again that FDI and the coal-based energy consumption structure increase the intensity of carbon dioxide emissions. Fiscal decentralization, environmental regulation, and a higher degree of marketization are conducive to China’s regional carbon emission reduction. These results also confirm the Hypotheses 2 and 3 of this study, namely that green credit improves the reduction of carbon dioxide emissions intensity within regions through its effects on industrial structural upgrading and technological innovation.
5.3. Robustness Test for Changing Proxy Variables
To further guarantee the reliability of research conclusions, we also adopted a method of replacing the proxy variable to perform a robustness test. Table 4 details the corresponding results. In column (1), Greencredit was replaced by Greencredit1, which is the natural logarithm of total interest expenditure of non six high energy consumption and high pollution industries. Columns (2)–(5) display the test results of the intermediate mechanisms after the substitution of the intermediate variables. In columns (2) and (3), ISS was substituted by ISS1, which is the proportion of the output value of the tertiary industry in the regional GDP. In columns (4) and (5), TI1 was used to replace the role of TI, and TI1 was measured by the natural log of the number of patents granted in different provinces each year.
It can be seen from the column (1) that although the measurement method of core explanatory variables has changed, its effect on regional carbon dioxide emissions intensity is still negative at a 1% significance level. In the same way, after replacing the proxy variable of the intermediary variable, the test results of the intermediate mechanism were still similar to the original results. That is to say, green credit is helpful to reduce the intensity of carbon dioxide emissions. The upgrading of industrial structure and technological innovation are still the intermediate channels for green credit to promote carbon emission reduction, which proves that our empirical results are relatively robust.
5.4. Heterogeneity Analysis
5.4.1. Regional Comparative Analysis
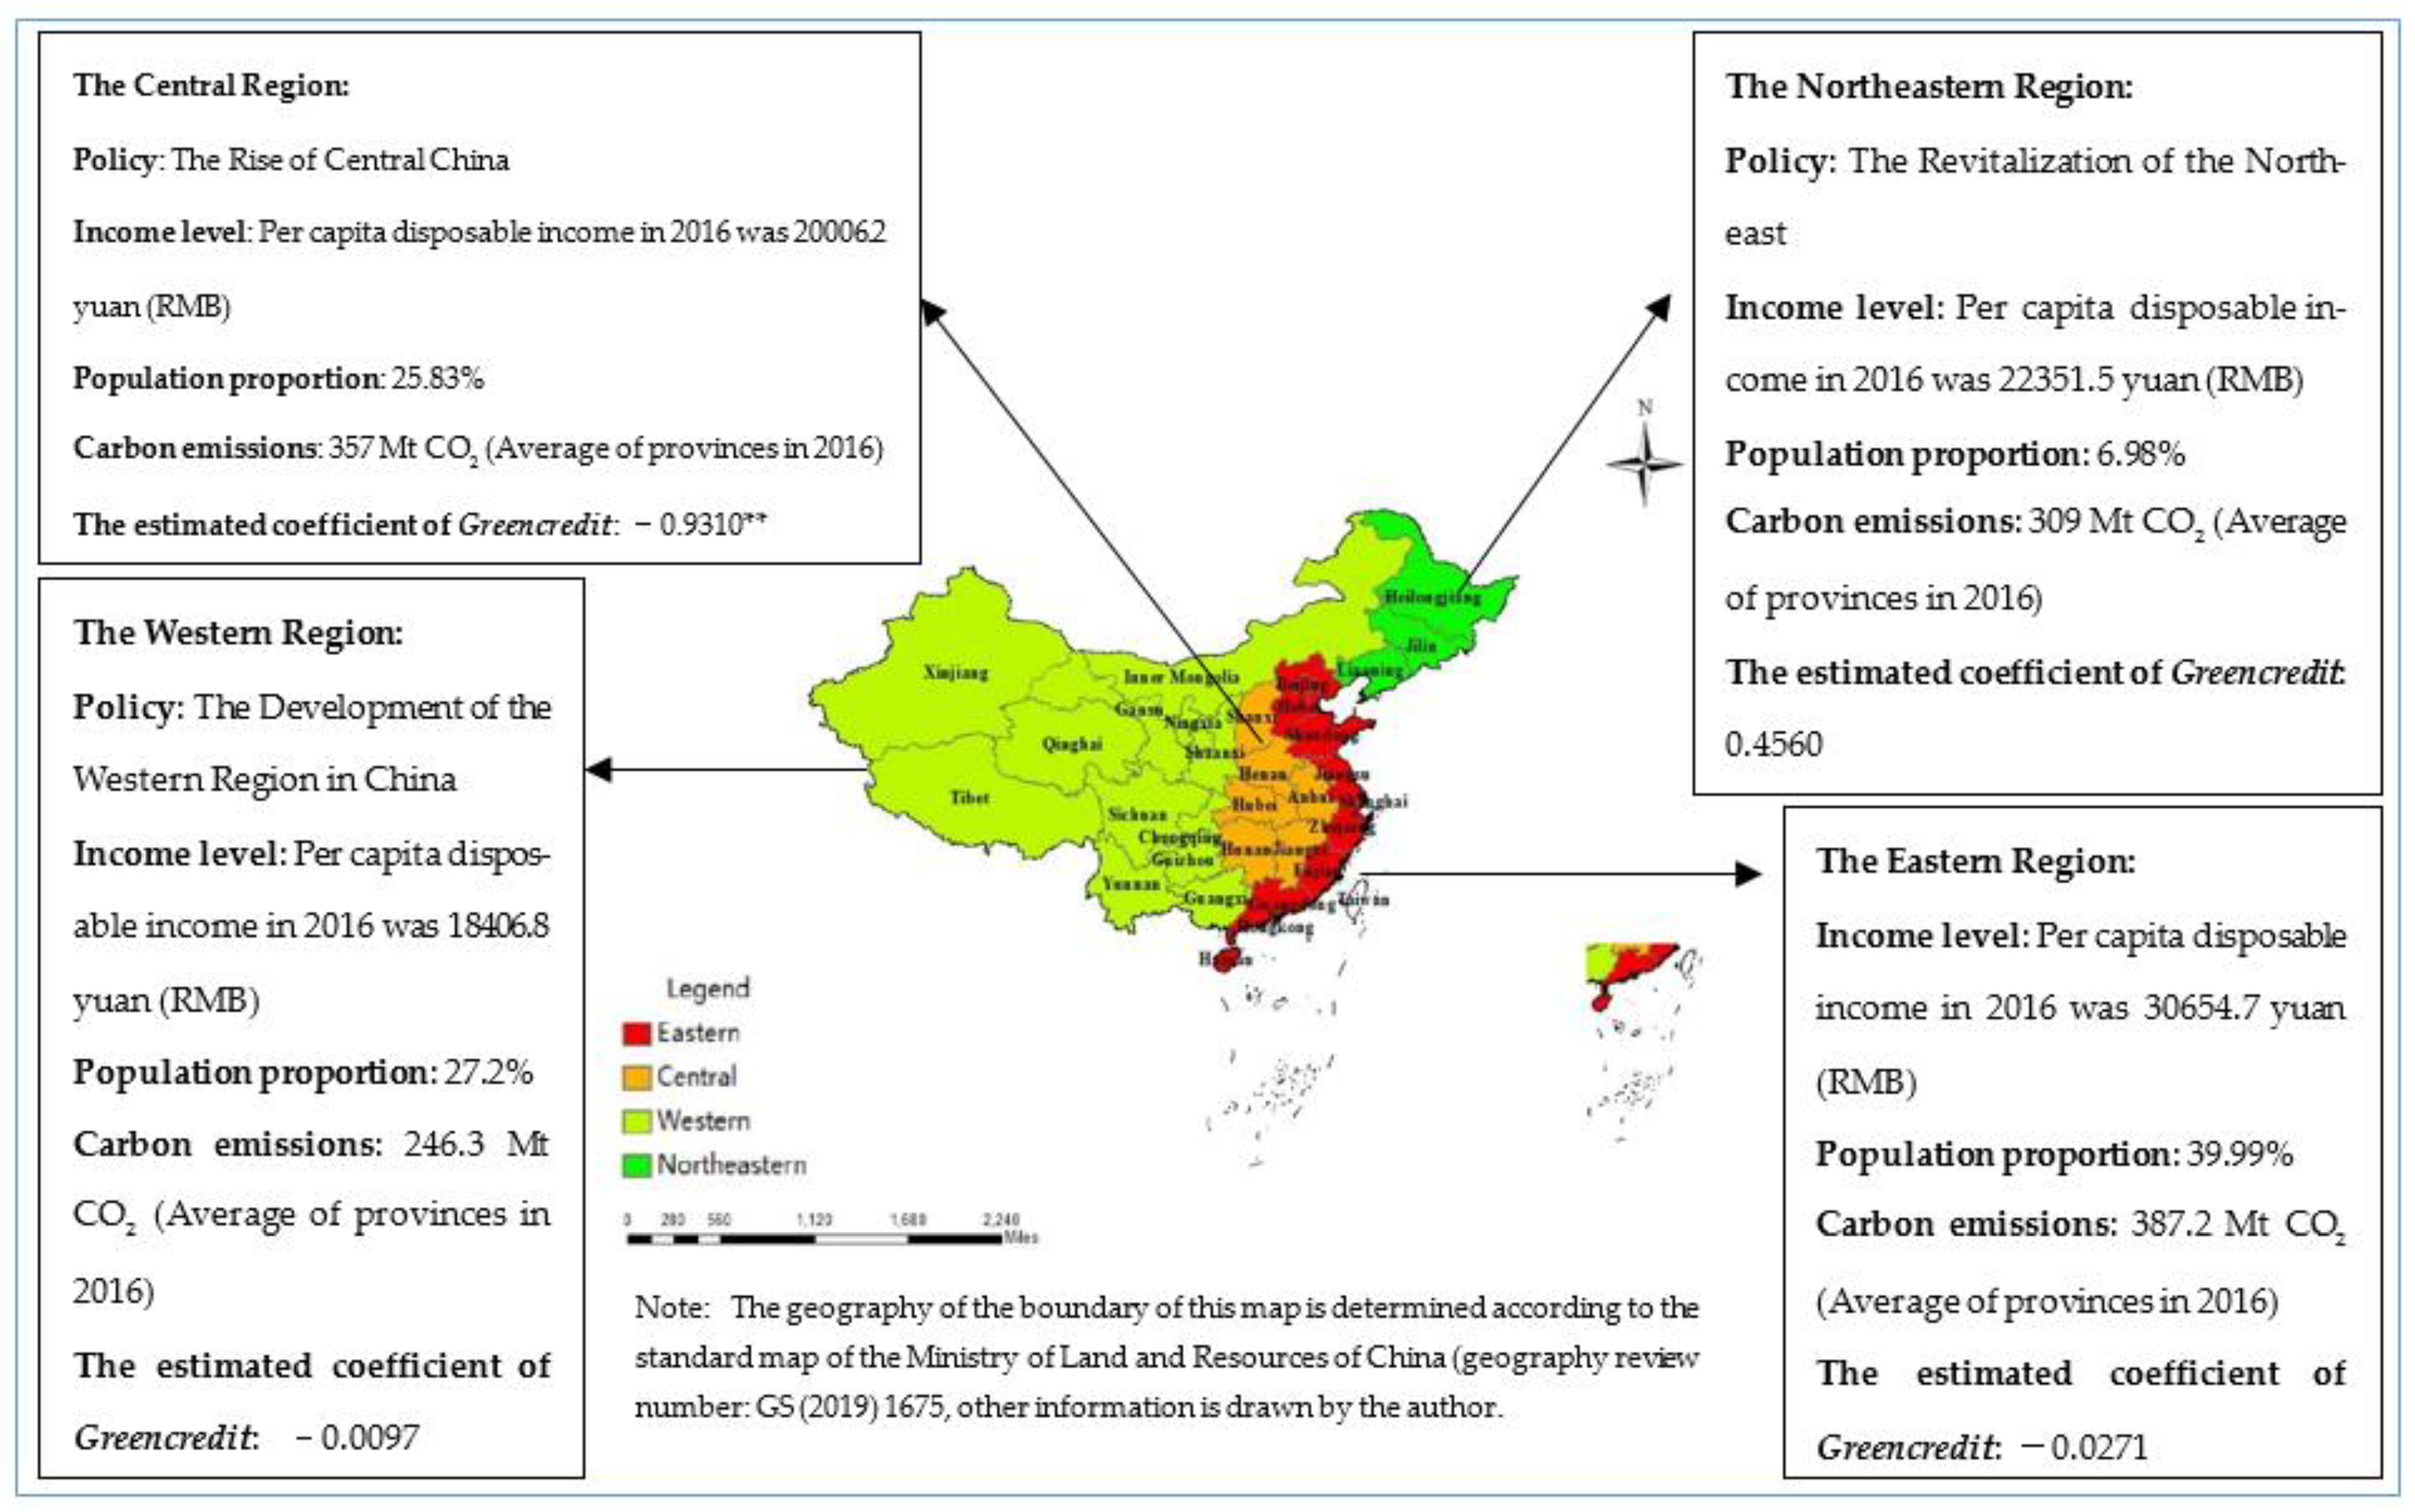
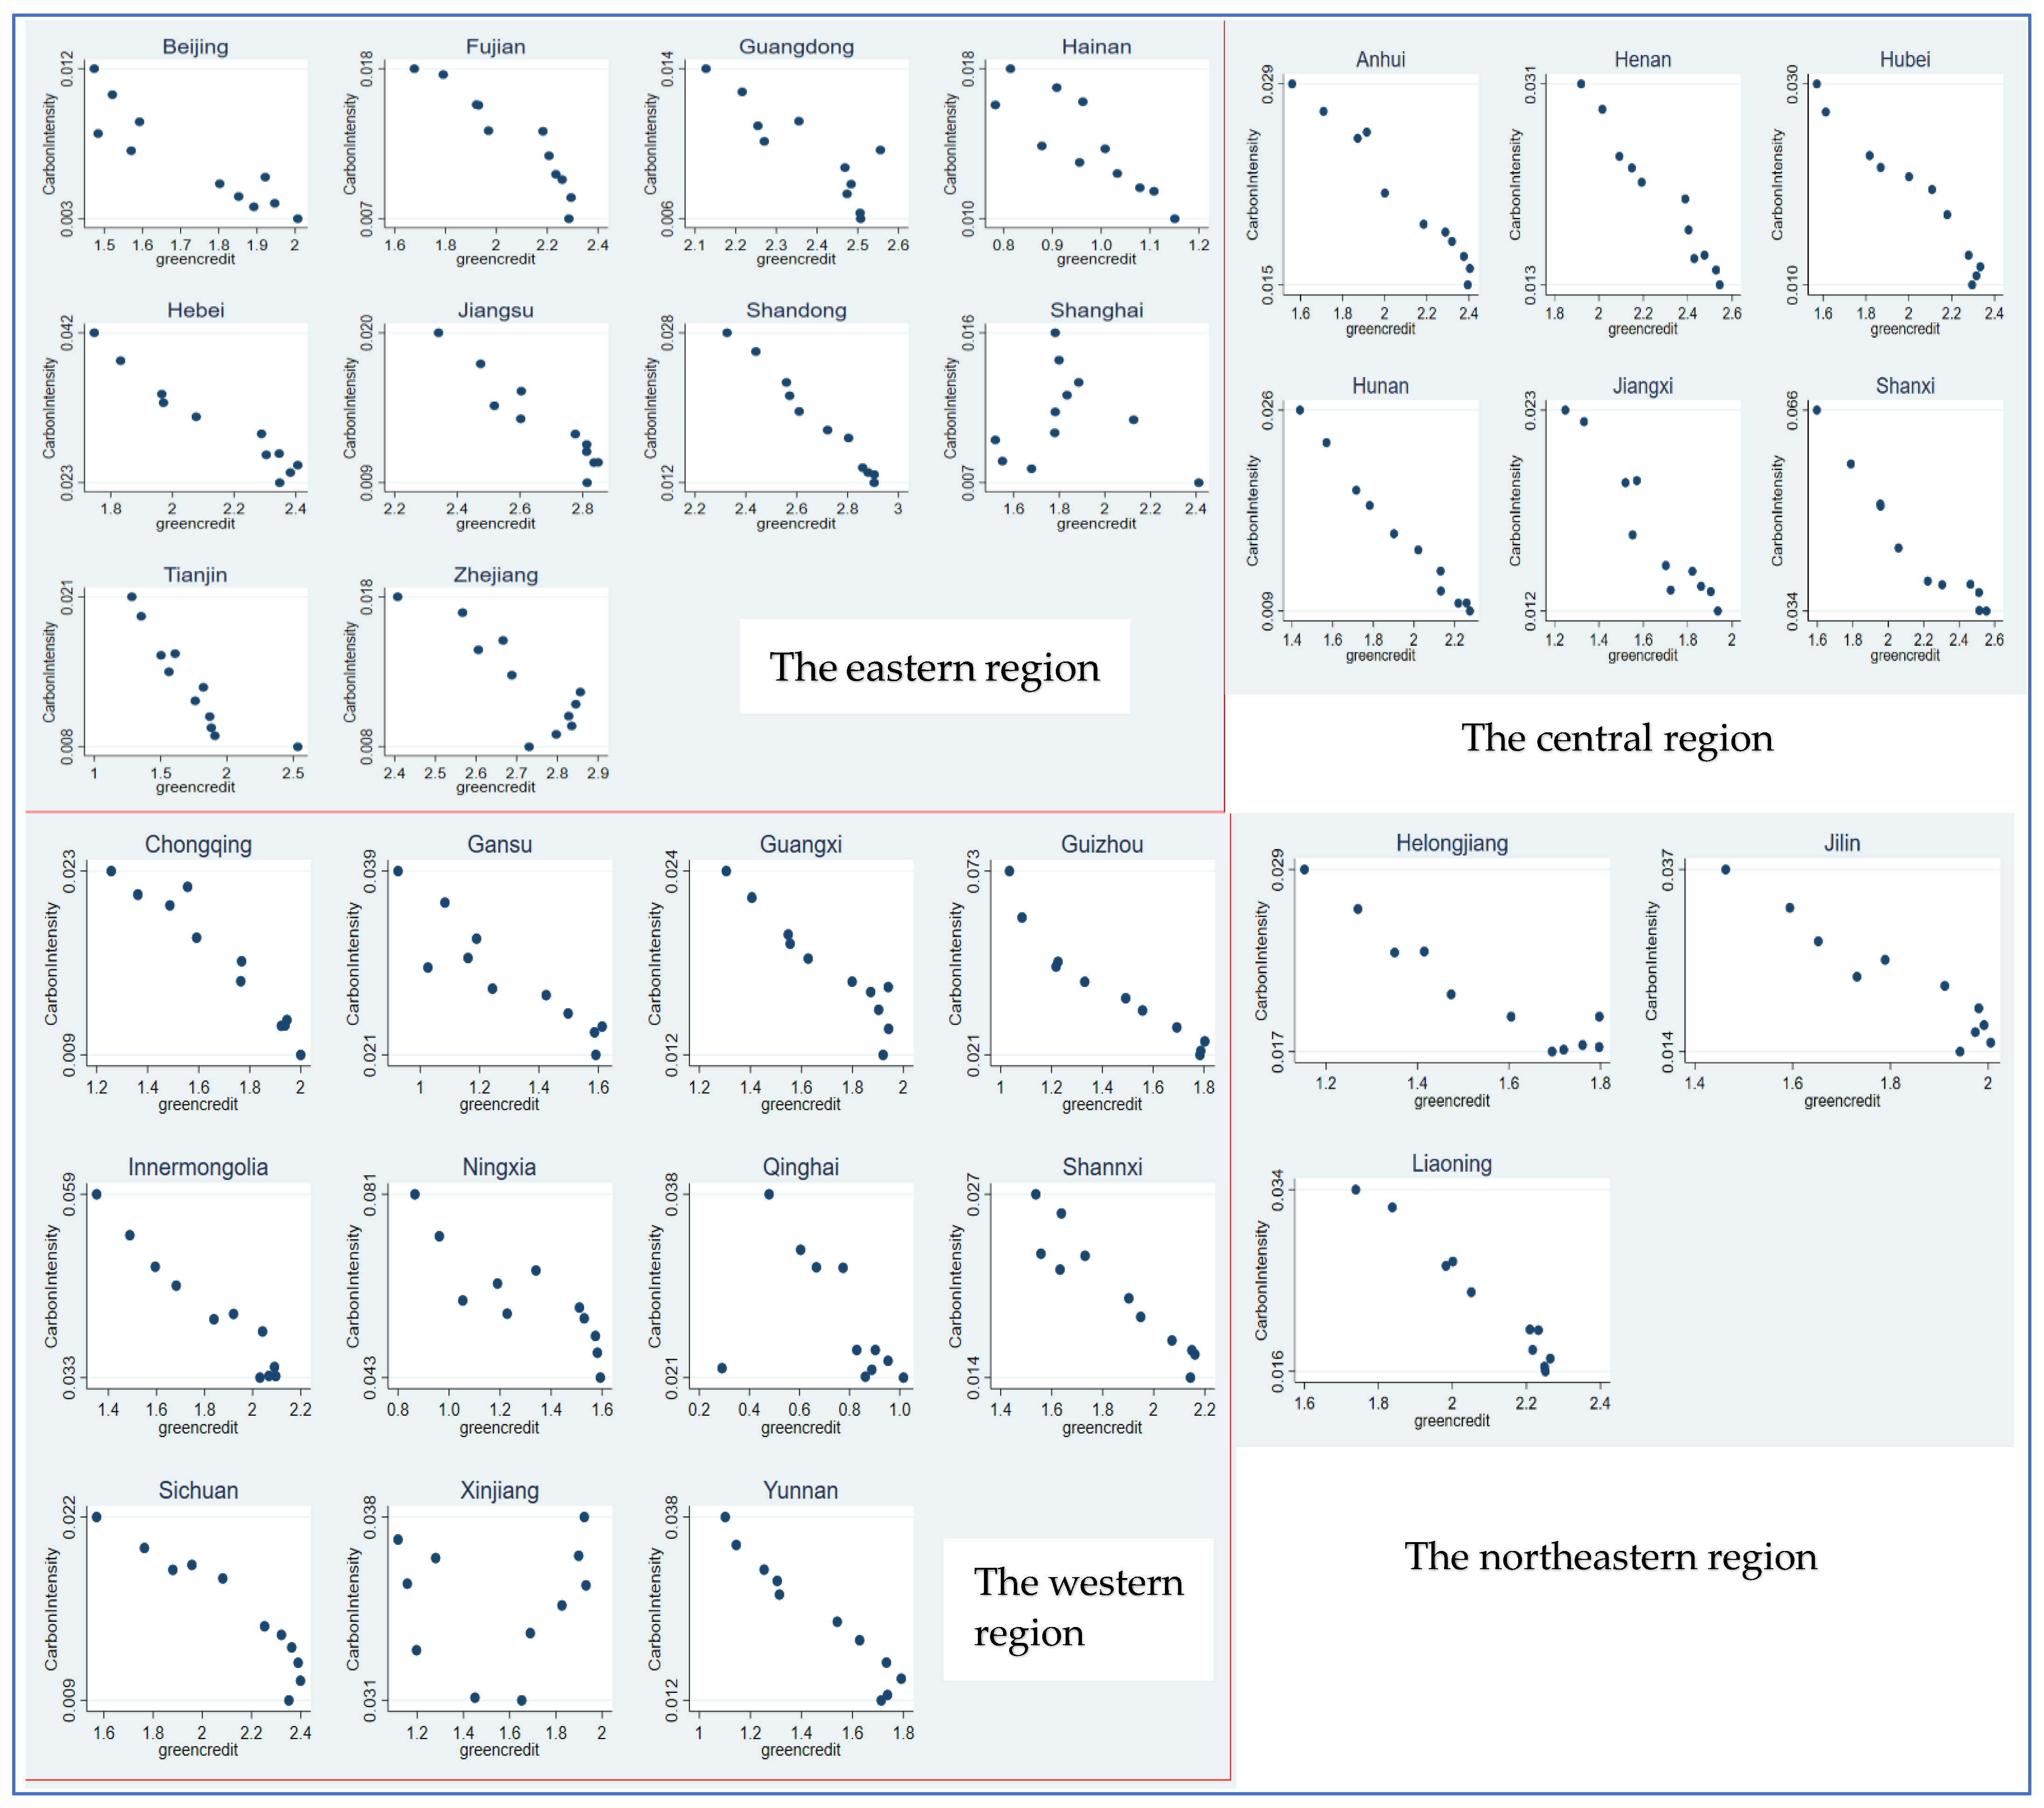
China is a country with an unbalanced regional economic development. In order to compare the impact of green credit on carbon dioxide emissions intensity in different economic zones, we divided China into four economic zones, namely eastern, central, western, and northeastern regions, according to the characteristics of carbon emission and the speed of economic development. The important basis for division is from the National Bureau of Statistics of China (http://www.stats.gov.cn, accessed on 20 April 2021). Panel regression results of the eastern, central, western, and northeastern regions are demonstrated in Table 5 and the regional division and the regression scatter diagram are demonstrated in Figure 2 and Figure 3.
The eastern region in China is a traditional economic developed area with an industrial structure dominated by the tertiary industry and the highest level of technological innovation, and is also a region where green credit policy is implemented earlier and faster. Several energy consuming and polluting provinces in China are mainly concentrated in the central and western regions. Industrial transformation in the central regions has achieved remarkable results in recent years, whose proportion of the secondary industry between 2004 and 2018 showed a trend of increasing first and then decreasing, while the proportion of the tertiary industry has continued to increase since 2012. However, compared with the eastern region, the green total factor productivity in central regions is still lower. Moreover, compared with the eastern region, the maturity of financial market development in the central and western regions still needs to be improved. The western region is economically backward, but due to the lag of economic development, the ecological environment is much better. As for the northeastern regions, at present, the traditional northeast industrial zone is facing a big development bottleneck. The transformation of industrial structure in the northeastern area is hindered and the development of financial industry lags behind. Based on this economic background, the role of green credit in environmental regulation is quite different in these four economic zones.
According to Table 5, green credit is beneficial to carbon dioxide emissions reduction in eastern, western, and central areas, but it has the opposite effect in the northeast region. It can be seen that the implementation effect of green credit policy in the central region is the best. The possible reason for this phenomenon is that the transformation of industrial structure in the central region has achieved remarkable results, for which the ratio of the tertiary industry to GDP has continuously increased since 2011, from 34.11% in 2011 to 49.76% in 2018. Green credit provides financial support for the upgrading of industrial structure and then promotes the reduction of carbon emissions in central regions. Due to the slow development of the financial market and the lag of technological innovation in the western and northeast regions, the effect of green credit policy is poor.
5.4.2. Comparison of Carbon Dioxide Emissions Intensity under Different Quantiles
Uematsu et al. [48] noted that quantile regression can reveal a more comprehensive stochastic relationship between variables and derive a more robust empirical analysis. Therefore, to capture the heterogeneous effects of the green credit on carbon dioxide emissions intensity at different quantiles of the explained variable, we use a conditional quantile regression (QR) approach. The results of QR are presented in Table 6.
The impact of green credit on carbon dioxide emissions intensity is negative for all the three quantiles, and overall, the absolute magnitude of the coefficient increased monotonically across quantiles. This means that green credit has a negatively larger effect on CO2 emissions intensity at the higher quantiles. In other words, in the case of high carbon dioxide emissions intensity, green credit plays a more significant role in promoting carbon emissions reduction. This phenomenon reminds us that in China’s provinces with high carbon emissions intensity, green credit policies should be vigorously implemented.
6. Further Discussion
Through the previous discussions, it can be found that in China’s practice during 2006 to 2016, green credit was helpful to promote carbon dioxide emissions reduction, and industrial structure upgrading and technological innovation are two important intermediate mechanisms. Furthermore, we tested the robustness and heterogeneous characteristics of this causality. However, there is still a question that deserved a deeper investigation for us, and that is, under the influence of industrial structure and technological innovation, do green credit and carbon dioxide emissions always keep a linear relationship? Does the higher the proportion of tertiary industry contribute more to the carbon emissions reduction effect of green credit? Similarly, is the higher investment in technological innovation more conducive to the carbon emissions reduction effect of green credit? Further discussion is needed.
Therefore, over the relevant context, we can use a panel threshold regression to look in detail into the nonlinear relationship of green credit and carbon dioxide emissions intensity caused by the level of industrial structure and technological innovation. The particular model is the following (a single threshold effect model was adopted as the initial model for the estimation) [49]:
where ISS1it and TIit are the threshold variables, I() is an indicator function, φ0 refers to the global intercept, and refers to the idiosyncratic error term.
The estimated results of threshold values are shown in Table 7 and Table 8. If the proportion of tertiary industry output in GDP (ISS1) was taken as the threshold variable, after 500 random sampling, we found one threshold value of about 0.41. If we used the proportion of R&D investment in GDP (TI) as the threshold variable, there were two threshold values, about 0.006 and 0.013, respectively. Obviously, we can prove that our conjecture is correct, that is, under the constraints of industrial structure or technological innovation, the inhibitory effect of China’s green credit on carbon dioxide emissions has certain nonlinear characteristics. The specific threshold regression results are shown in Table 9.
Column (1) in Table 9 reports the panel threshold regression results when ISS1 was used as the threshold variable. Regime1 and Regime2 report the estimated coefficients of Greencredit when ISS1 was <0.410 and when ISS1 was ≥0.410, respectively. Specifically, when the proportion of the tertiary industry output in regional GDP was smaller than 41%, the estimated coefficient of Greencredit was −0.1574, which was significant at a 10% significance level. If the proportion of the tertiary industry output in regional GDP was equal to or greater than 41%, the estimated coefficient of Greencredit was −0.3036. There was a phenomenon that the absolute magnitude of the coefficient increases, which implies that when the proportion of the tertiary industry in GDP exceeds the threshold value of 41%, green credit will have a greater reduction effect on the intensity of carbon dioxide emissions. This result shows that under the constraint of industrial structure, there is a nonlinear relationship between green credit and carbon dioxide emissions intensity, and it is reasonable to believe that promoting the upgrading of industrial structure and making the proportion of the tertiary industry reach a higher value is one of the key paths to play the role of green credit in carbon emission reduction.
Column (2) presents the threshold regression results when TI was used as a threshold variable. Regime1, Regime2, and Regime3 report the estimated coefficients of Greencredit when the value of TI was in three different intervals: TI < 0.006, 0.006 ≤ TI < 0.013, TI ≥ 0.013. According to the regression results, when the proportion of R&D investment in GDP (TI) was <0.6%, green credit had a significant positive effect on carbon dioxide emissions. When the proportion of R&D investment in regional GDP (TI) exceeded 0.6%, the estimated coefficient of Greencredit was negative, which became significantly negative when TI was greater than 1.3%. In detail, only when the proportion of R&D investment in regional GDP is greater than or equal to 1.3% can green credit play a significant role in reducing the intensity of carbon dioxide emissions. According to the threshold regression results of column (2), we can find three characteristics: firstly, under the constraint of technological innovation with R&D investment as the proxy variable, the impact of green credit on regional carbon dioxide emissions intensity has a nonlinear characteristic. Second, the proportion of R&D investment in regional GDP is equal to or greater than 0.6%, which is a necessary condition for green credit to play the role of carbon emissions reduction. Third, when R&D investment accounts for more than 1.3% of GDP, green credit can significantly promote regional carbon dioxide emissions reduction. This provides a certain carbon emissions reduction enlightenment for the government and enterprises, that is, to increase investment in technology research and development and accelerate innovation, which also verifies the intermediate mechanism role of the technological innovation.
7. Conclusions
Under the macro background of global climate change, it is urgent for the Chinese government to undertake the task of carbon emissions reduction. As one of the policy tools of green finance, green credit aims to guide capital flow, reduce environmental pollution, promote technological progress of enterprises, and help develop a green economy. This paper applied a panel data for 30 provinces and cities in China to measure the impact of green credit on carbon dioxide emissions in these regions. The conclusions of this study can be summed up as follows.
First, through the least square method, we found that the implementation of green credit policies can significantly help to reduce carbon dioxide emissions. The coefficient of green credit was −0.2963 at a 5% significance level. Since we failed to find a suitable instrumental variable, we used a DIFF-GMM method to deal with the endogenous problem, and the coefficient of green credit was −0.2096 at a 5% significance level, which means that our results are reliable.
Second, we investigated the influence mechanism of green credit as a driver of reduced emissions of carbon dioxide. Our findings implied that green credit helps to reduce carbon dioxide emissions intensity through its effects relating to industrial structure upgrading and technological innovation. On the one hand, green credit promotes the upgrading of industrial structure and technological innovation at 5% and 1% significant level, respectively. On the other hand, the upgrading of industrial structure and technological innovation both promote the reduction of carbon dioxide emissions intensity at a 1% significance level. As the proxy variables of the intermediary variables were replaced, the test results of the two intermediate mechanisms were still robust.
Third, due to the differences of regional economic levels, the inhibitory effect of green credit on carbon dioxide emissions intensity presents obvious regional heterogeneity. According to the standards of national development strategy, China was divided into eastern, central, western, and northeastern regions, and we tested the provincial data of each region separately. We found that in the central regions of China, green credit plays an important role in promoting carbon dioxide emissions intensity reduction. However, on the contrary, in the northeast zones, the role of green credit is ineffective. In the eastern and western regions, the estimated coefficient of green credit is also negative, but not significant. Another heterogeneity test showed that the higher the carbon dioxide emissions intensity, the greater the role of green credit in carbon emissions reduction. It indicated that the more serious the pollution is, the more strict the entry threshold system of green credit that should be implemented and the scale of green credit should be expanded, which is more beneficial to carbon emissions reduction.
Last, our further discussion revealed that nonlinear correlations may exist between green credit and carbon dioxide emissions intensity. With the constraints of different levels of industrial structure and R&D investment, there are threshold characteristics between the causal relationships of green credit and carbon dioxide emissions. Since the proportion of tertiary industry output in regional GDP accounts for more than 41% or R&D investment accounts for more than 1.3% of GDP, the impact of green credit on carbon dioxide emissions intensity is significantly negative at a 1% significance level.
There are several policy implications. First, as one of the effective policies to promote carbon emissions reduction, the scale of green credit still needs to be expanded, especially in the western and northeast regions of China where financial development is relatively backward. Second, using employment training and subsidy policies to improve the level of urbanization, realize the transfer of rural labor force to the city, the transfer of secondary industry employment population to the tertiary industry, and promote the upgrading of industrial structure is an important channel to help carbon emissions reduction. Third, to continuously strengthen the technology R&D investment of enterprises and improve the innovation level is not only conducive to carbon emissions reduction, but also conducive to the green and sustainable development of the economy.
There are still some limitations in our study. One is embodied in the research perspective. We studied the correlation between green credit and carbon dioxide emissions intensity at a macro provincial level, but ignored the impact at the micro enterprise levels. In addition, in the empirical study, we could not find an effective instrumental variable to deal with endogenous problems and the deep-seated reasons behind regional heterogeneity need to be further explored. In the future, we will conduct more in-depth research on this topic in order to provide some effective suggestions on climate change and low-carbon economic development.
Author Contributions
Conceptualization, W.Z. and M.H.; methodology, W.Z.; software, W.Z. and F.L.; validation, W.Z., M.H. and J.L.; formal analysis, W.Z. and F.L.; investigation, F.L.; resources, J.L.; data curation, F.L.; writing—original draft preparation, W.Z.; writing—review and editing, J.L.; supervision, M.H.; project administration, M.H. and J.L. All authors have read and agreed to the published version of the manuscript.
Funding
This research received no external funding.
Institutional Review Board Statement
Not applicable.
Informed Consent Statement
Not applicable.
Data Availability Statement
Publicly available datasets were analyzed in this study. The main data can be found here: China Statistical Yearbook (http://www.stats.gov.cn/english/Statisticaldata/AnnualData/, accessed on 29 April 2021).
Acknowledgments
We thank School of Economics of Yunnan University in China for support.
Conflicts of Interest
The authors declare no conflict of interest.
References
- Masson-Delmotte, V.; Zhai, P.; Pörtner, H.-O.; Roberts, D.; Skea, J.; Shukla, P.R.; Pirani, A.; Moufouma-Okia, W.; Péan, C.; Pidcock, R.; et al. Global Warming of 1.5 °C. An IPCC Special Report on the Impacts of Global Warming of 1.5 °C above pre-Industrial Levels and Related Global Greenhouse Gas Emission Pathways, in the Context of Strengthening the Global Response to the Threat of Climate Change, Sustainable Development, and Efforts to Eradicate Poverty. IPCC, 2018. Available online: https://www.ipcc.ch/sr15/download/ (accessed on 9 May 2021).
- Li, L.; Liu, D.; Hou, J.; Xu, D.; Chao, W. The Study of the Impact of Carbon Finance Effect on Carbon Emissions in Beijing-Tianjin-Hebei Region—Based on Logarithmic Mean Divisia Index Decomposition Analysis. Sustainability 2019, 11, 1465. [Google Scholar] [CrossRef] [Green Version]
- World Bank. CO2 Emissions [EB/OL]. Available online: https://data.worldbank.org/indicator/EN.ATM.CO2E.KT (accessed on 9 April 2021).
- Shi, Q.; Chen, J.; Shen, L. Driving Factors of the Changes in the Carbon Emissions in the Chinese Construction Industry. J. Clean. Prod. 2017, 166, 615–627. [Google Scholar] [CrossRef]
- World Bank. CO2 Emissions [EB/OL]. Available online: https://data.worldbank.org/indicator/EN.ATM.CO2E.KT?locations=CN (accessed on 24 June 2021).
- Xi, J. Secure a Decisive Victory in Building a Moderately Prosperous Society in All Respects and Strive for the Great Success of Socialism with Chinese Characteristics for a New Era—Delivered at the 19th National Congress of the Communist Party of China. 2017. Available online: http://www.gov.cn/zhuanti/2017-10/27/content_5234876.htm (accessed on 9 April 2021). (In Chinese)
- Jiang, H.; Wang, W.; Wang, L.; Wu, J. The Effects of the Carbon Emission Reduction of China’s Green Finance—An Analysis Based on Green Credit and Green Venture Investment. Financ. Forum 2020, 25, 39–48+80. [Google Scholar]
- Hu, Y.; Jiang, H.; Zhong, Z. Impact of Green Credit on Industrial Structure in China: Theoretical Mechanism and Empirical analysis. Environ. Sci. Pollut. Res. 2020, 27, 10506–10519. [Google Scholar] [CrossRef] [PubMed]
- Narayan, P.K.; Saboori, B.; Soleymani, A. Economic Growth and Carbon Emissions. Econ. Model. 2016, 53, 388–397. [Google Scholar] [CrossRef]
- Zhang, M.; Li, B.; Yin, S. Is Technological Innovation Effective for Energy Saving and Carbon Emissions Reduction? Evidence from China. IEEE Access 2020, 8, 83524–83537. [Google Scholar] [CrossRef]
- Zhang, Y. The Impact of Financial Development on Carbon Emissions: An Empirical Analysis in China. Energy Policy 2011, 39, 2197–2203. [Google Scholar] [CrossRef]
- Zhang, N.; Yu, K.; Chen, Z. How does Urbanization Affect Carbon Dioxide Emissions? A Cross-country Panel Data Analysis. Energy Policy 2017, 107, 678–687. [Google Scholar]
- Rauf, A.; Zhang, J.; Li, J.; Amin, W. Structural Changes, Energy Consumption and Carbon Emissions in China: Empirical Evidence from ARDL Bound Testing Model. Structure Chang. Econ. Dyn. 2018, 47, 194–206. [Google Scholar] [CrossRef]
- Acheampong, A.; Amponsah, M.; Boateng, E. Does Financial Development Mitigate Carbon Emissions? Evidence from Heterogeneous Financial Economies. Energy Econ. 2020, 88, 104768. [Google Scholar]
- Tsaurai, K. The Impact of Financial Development on Carbon Emissions in Africa. Int. Energy Econ. Policy 2019, 9, 144–153. [Google Scholar] [CrossRef]
- Mugableh, M.I. Economic Growth, CO2 Emissions, and Financial Development in Jordan: Equilibrium and Dynamic Causality Analysis. Int. J. Econ. Financ. 2015, 7, 98–105. [Google Scholar] [CrossRef] [Green Version]
- Shahbaz, M.; Solarin, S.A.; Mahmood, H.; Arouri, M. Dose Financial Development Reduce CO2 Emissions in Malaysian Economy? A Time Series Analysis. Econ. Model. 2013, 35, 145–152. [Google Scholar]
- Shahbaz, M.; Islam, F.; Butt, M.S. Financial Development, Energy Consumption and CO2 Emissions: Evidence from ARDL Approach for Pakistan. MPRA Paper 2011, 30138. Available online: https://mpra.ub.uni-muenchen.de/30138/ (accessed on 9 May 2021).
- Hao, Y.; Zhang, Z.; Liao, H.; Wei, Y.; Wang, S. Is CO2 Emission a Side Effect of Financial Development? An Empirical Analysis for China. Environ. Sci. Pollut. Res. 2016, 23, 21041–21057. [Google Scholar] [CrossRef] [PubMed]
- Xiong, L.; Qi, S. Financial Development and Carbon Emissions in Chinese Provinces: A Spatial Panel Data Analysis. Singap. Econ. Rev. 2018, 63, 447–464. [Google Scholar] [CrossRef]
- Xing, T.; Jiang, Q.; Ma, X. To Facilitate or Curb? The Role of Financial Development in China’s Carbon Emissions Reduction Process: A Novel Approach. Int. J. Environ. Res. Public Health 2017, 14, 1222. [Google Scholar] [CrossRef]
- Zhang, W.; Li, G.; Uddin, M.K.; Guo, S. Environmental Regulation, Foreign Investment Behavior, and Carbon Emissions for 30 Provinces in China. J. Clean. Prod. 2020, 248, 119208. [Google Scholar] [CrossRef]
- Huang, Y.; Xue, L.; Khan, Z. What Abates Carbon Emissions in China: Examining the Impact of Renewable Energy and Green Investment. Sustain. Dev. 2021, 1. Available online: https://www.researchgate.net/publication/349523727_What_abates_carbon_emissions_in_China_Examining_the_impact_of_renewable_energy_and_green_investment (accessed on 9 May 2021).
- Jiang, Q. Analysis on Development of International Green Credit and Its References. J. Shaanxi Coll. Commun. Technol. 2014, 3, 27–30. (In Chinese) [Google Scholar]
- Wang, F.; Yang, S.; Reisner, A.; Liu, N. Does Green Credit Policy Work in China? The Correlation between Green Credit and Corporate Environmental Information Disclosure Quality. Sustainability 2019, 11, 733. [Google Scholar] [CrossRef] [Green Version]
- Tan, X.; Fu, M. Thinking of Promoting the Green Credit Policy under the Background of the Industrial Structure Adjustment. Econ. Res. Guide 2010, 29, 94–97. (In Chinese) [Google Scholar]
- Zhang, B.; Yang, Y.; Bi, J. Tracking the Implementation of Green Credit Policy in China: Top-down Perspective and Bottom-up Reform. J. Environ. Manag. 2011, 92, 1321–1327. [Google Scholar] [CrossRef]
- Gong, X.; Chen, J. Research on Green Financial Supply under the Vision of Green Development. Fujian Trib. (Humanit. Soc. Sci. Mon.) 2018, 3. (In Chinese) [Google Scholar]
- Song, M.; Xie, Q.; Shen, Z. Impact of Green Credit on High-efficiency Utilization of Energy in China Considering Environmental Constraints. Energy Policy 2021, 153, 112267. [Google Scholar] [CrossRef]
- Xu, X.; Li, J. Asymmetric Impacts of the Policy and Development of Green Credit on the Debt Financing Cost and Maturity of Different Types of Enterprises in China. J. Clean. Prod. 2020, 264, 121574. [Google Scholar] [CrossRef]
- Biswas, N. Sustainable Green Banking Approach: The Need of the Hour. Bus. Spectrum. 2011, 1, 32–38. [Google Scholar]
- Wen, H.; Lee, C.; Zhou, F. Green Credit Policy, Credit Allocation Efficiency and Upgrade of Energy-intensive Enterprises. Energy Econ. 2021, 94, 105099. [Google Scholar] [CrossRef]
- Zhou, G.; Liu, C.; Luo, S. Resource Allocation Effect of Green Credit Policy: Based on DID Model. Mathematics 2021, 9, 159. [Google Scholar] [CrossRef]
- Kang, H.; Jung, S.; Lee, H. The Impact of Green Credit Policy on Manufacturers’ Efforts to Reduce Suppliers’ Pollution. J. Clean. Prod. 2020, 248, 119271. [Google Scholar] [CrossRef]
- An, S.; Li, B.; Song, D.; Chen, X. Green Credit Financing Versus Trade Credit Financing in a Supply Chain with Carbon Emission Limits. Eur. J. Oper. Res. 2021, 292, 125–142. [Google Scholar] [CrossRef]
- Yan, C.; Li, T.; Lan, W. Financial Development, Innovation and Carbon Emission. J. Financ. Res. 2016, 1, 14–30. (In Chinese) [Google Scholar]
- Li, W. Research on Green Financial Policy Support of Energy Transformation in China under the Background of Supply Side Reform. Master’s Thesis, Shaanxi University of Science and Technology, Xi’an, China, 2017. (In Chinese). [Google Scholar]
- Hong, M.; Li, Z.; Drakeford, B. Do the Green Credit Guidelines Affect Corporate Green Technology Innovation? Empirical Research from China. Int. J. Environ. Res. Public Health 2021, 18, 1682. [Google Scholar] [CrossRef]
- Shan, Y.; Liu, J.; Liu, Z.; Xu, X.; Shao, S.; Wang, P.; Guan, D. New Provincial CO2 Emission Inventories in China Based on Apparent Energy Consumption Data and Updated Emission Factors. Appl. Energy 2016, 184, 742–750. [Google Scholar] [CrossRef] [Green Version]
- Shan, Y.; Guan, D.; Zheng, H.; Ou, J.; Li, Y.; Meng, J.; Mi, Z.; Liu, Z.; Zhang, Q. China CO2 Emission Accounts 1997–2015. Sci. Data 2018, 5, 170201. [Google Scholar] [CrossRef] [Green Version]
- Shan, Y.; Huang, Q.; Guan, D.; Hubacek, K. China CO2 Emission Accounts 2016–2017. Sci. Data 2020, 7, 54. [Google Scholar] [CrossRef] [Green Version]
- Yu, J.; Shi, X.; Guo, D.; Yang, L. Economic Policy Uncertainty (EPU) and Firm Carbon Emissions: Evidence Using a China Provincial EPU Index. Energy Econ. 2021, 94, 105071. [Google Scholar] [CrossRef]
- Wang, X.; Fan, G.; Yu, W. Marketization Index of China’s Provinces: NERI Report 2016. Social Sciences; Academic Press: Beijing, China, 2017. [Google Scholar]
- Baron, R.M.; Kenny, D.A. The Moderator Mediator Variable Distinction in Social Psychological Research: Conceptual, Strategic and Statistical Considerations. J. Personal. Soc. Psychol. 1986, 51, 1173–1182. [Google Scholar] [CrossRef]
- Xie, T.; Liu, J. How Does Green Credit Affect China’s Green Economy Growth? China Popul. Resour. Environ. 2019, 29, 83–90. (In Chinese) [Google Scholar]
- Gan, C.; Zheng, R.; Yu, D. An Empirical Study on the Effects of Industrial Structure on Economic Growth and Fluctuations in the Case of China. Econ. Res. J. 2011, 5, 4–16+31. (In Chinese) [Google Scholar]
- Cole, M.A. Trade, the Pollution Haven Hypothesis and the Environmental Kuznets Curve: Examining the Linkages. Ecol. Econ. 2004, 48, 71–81. [Google Scholar] [CrossRef]
- Uematsu, H.; Khanal, A.R.; Mishra, A.K. The Impact of Natural Amenity on Farmland Values: A Quantile Regression Approach. Land Use Policy 2013, 33, 151–160. [Google Scholar] [CrossRef]
- Hansen, B.E. Threshold Effects in Non-Dynamic Panels: Estimation, Testing, and Inference. J. Econom. 1999, 93, 345–368. [Google Scholar] [CrossRef] [Green Version]
Figure 1.
Carbon emissions reduction mechanism of green credit.

Figure 2.
The division of Chinese regions. ** p < 0.05.

Figure 3.
Scatter diagram of green credit and carbon emission intensity in different provinces of four regions.
Figure 3.
Scatter diagram of green credit and carbon emission intensity in different provinces of four regions.


Table 1.
Variable Symbols and Definitions.
| Definition | Symbol | Measurement | |
|---|---|---|---|
| Explained Variable | Carbon dioxide emissions intensity | CarbonIntensity | CO2 emissions/GDP |
| Explanatory Variable | Green credit | Greencredit | |
| Control Variables | Foreign direct investment | FDI | Actual utilization of foreign investment/GDP |
| Economic policy uncertainty | EPU | EPU index [42] | |
| Environmental regulation | ER | Investment in pollution control/GDP | |
| Fiscal decentralization | FD | ||
| Energy consumption structure | ECS | Coal energy consumption/Total primary energy consumption | |
| Degree of marketization | ML | Marketization index [43] | |
| Mediating Variables | Industrial structure upgrading | ISS | |
| Technological Innovation | TI | R&D investment/GDP |
Table 2.
Benchmark regression results.
| Variable | (1) | (2) | (3) | (4) | (5) | (6) |
|---|---|---|---|---|---|---|
| Mixed OLS | Random Effect | Fixed Effect Fixed Effect | DIFF-GMM | |||
| Greencredit | −0.3736 *** | −0.4222 *** | −0.6289 *** | −0.5523 *** | −0.2963 ** | −0.2096 ** |
| (0.0758) | (0.1311) | (0.1738) | (0.1381) | (0.1348) | (0.0967) | |
| FDI | 1.4216 *** | 3.2976 *** | 3.9529 *** | 3.8530 *** | −0.2230 | |
| (0.4297) | (0.6423) | (0.8945) | (0.8723) | (0.6143) | ||
| EPU | −0.0015 *** | −0.0010 * | −0.0011 | −0.0010 | 0.0001 | |
| (0.0005) | (0.0005) | (0.0008) | (0.0006) | (0.0001) | ||
| ER | −0.3781 | −3.8947 ** | −2.3464 | −4.2611 *** | −0.8861 | |
| (1.5052) | (1.7110) | (1.7609) | (1.5011) | (0.8028) | ||
| FD | −0.1130 | −0.8682 *** | −1.6556 *** | −1.7284 *** | −0.0468 | |
| (0.0933) | (0.3010) | (0.5305) | (0.4779) | (0.0875) | ||
| ECS | 0.5264 *** | 0.5462 *** | 0.5793 ** | 0.1300 *** | ||
| (0.0336) | (0.1100) | (0.2163) | (0.0384) | |||
| ML | −0.0438 *** | −0.0368 *** | −0.0305 *** | 0.0026 | ||
| (0.0066) | (0.0096) | (0.0108) | (0.0021) | |||
| L. CarbonIntensity | 0.8994 *** | |||||
| (0.0305) | ||||||
| Constant | −1.5821 *** | −1.2662 *** | −1.4453 *** | −0.7298 ** | −0.9823 *** | −0.1807 *** |
| (0.0597) | (0.2199) | (0.0752) | (0.2718) | (0.3408) | (0.0483) | |
| AR(1) | −3.8806 *** | |||||
| AR(2) | −1.0287 | |||||
| Sargan Test (p value) | 0.2754 | |||||
| N | 330 | 330 | 330 | 330 | 330 | 270 |
| R2 | 0.722 | 0.096 | 0.372 | 0.505 | ||
Note: Standard errors in parentheses; * p < 0.1, ** p < 0.05, *** p < 0.01.
Table 3.
Transmission mechanism test results.
| (1) | (2) | (3) | (4) | (5) | |
|---|---|---|---|---|---|
| CarbonIntensity | ISS | CarbonIntensity | TI | CarbonIntensity | |
| Greencredit | −0.2963 ** | 0.6069 ** | −0.2100 | 0.0091 *** | −0.1393 |
| (0.1348) | (0.2376) | (0.1322) | (0.0031) | (0.1055) | |
| ISS | −0.1422 *** | ||||
| (0.0337) | |||||
| TI | −17.2677 *** | ||||
| (5.1879) | |||||
| FDI | 3.8530 *** | −6.7172 ** | 2.8979 *** | −0.1170 *** | 1.8322 ** |
| (0.8723) | (2.6989) | (0.7803) | (0.0335) | (0.6877) | |
| EPU | −0.0010 | 0.0015 | −0.0008 | 0.0000 | −0.0004 |
| (0.0006) | (0.0014) | (0.0005) | (0.0000) | (0.0006) | |
| ER | −4.2611 *** | 7.6472 | −3.1738 ** | 0.0853 * | −2.7887 * |
| (1.5011) | (5.1923) | (1.4332) | (0.0421) | (1.6182) | |
| FD | −1.7284 *** | −1.8909 * | −1.9972 *** | 0.0166 | −1.4414 *** |
| (0.4779) | (1.1091) | (0.3946) | (0.0106) | (0.4079) | |
| ECS | 0.5793 ** | −0.5269 | 0.5043 ** | −0.0083 * | 0.4359 ** |
| (0.2163) | (0.3703) | (0.1925) | (0.0045) | (0.1980) | |
| ML | −0.0305 *** | 0.0738 ** | −0.0200 * | 0.0008 * | −0.0163 |
| (0.0108) | (0.0286) | (0.0101) | (0.0005) | (0.0112) | |
| Constant | −0.9823 *** | 1.5353 ** | −0.7640 ** | 0.0043 | −0.9084 *** |
| (0.3408) | (0.5609) | (0.3106) | (0.0069) | (0.2987) | |
| Fixed-effects | Yes | Yes | Yes | Yes | Yes |
| N | 330 | 330 | 330 | 330 | 330 |
| R2 | 0.505 | 0.230 | 0.572 | 0.308 | 0.653 |
Note: Standard errors in parentheses; * p < 0.1, ** p < 0.05, *** p < 0.01.
Table 4.
Robustness test for changing proxy variables.
| (1) | (2) | (3) | (4) | (5) | |
|---|---|---|---|---|---|
| CarbonIntensity | ISS1 | CarbonIntensity | TI1 | CarbonIntensity | |
| Greencredit1 | −0.3642 *** | ||||
| (0.0311) | |||||
| Greencredit | 0.1274 ** | −0.2391 * | 0.8433 ** | −0.0381 | |
| (0.0474) | (0.1288) | (0.3971) | (0.0719) | ||
| ISS1 | −0.4490 *** | ||||
| (0.1061) | |||||
| TI1 | −0.3062 *** | ||||
| (0.0260) | |||||
| Constant | −1.1578 *** | 0.5680 *** | −0.7272 ** | 0.9759 | −0.6834 *** |
| (0.1834) | (0.1097) | (0.3224) | (0.8818) | (0.1453) | |
| Controls | Yes | Yes | Yes | Yes | Yes |
| Fixed-effects | Yes | Yes | Yes | Yes | Yes |
| N | 330 | 330 | 330 | 330 | 330 |
| R2 | 0.796 | 0.119 | 0.551 | 0.544 | 0.836 |
Note: Standard errors in parentheses; * p < 0.1, ** p < 0.05, *** p < 0.01.
Table 5.
Regional comparative analysis.
| (1) | (2) | (3) | (4) | |
|---|---|---|---|---|
| Eastern | Central | Western | Northeastern | |
| Greencredit | −0.0271 | −0.9310 ** | −0.0097 | 0.4560 |
| (0.1265) | (0.2356) | (0.2185) | (1.0861) | |
| FDI | 5.6468 ** | −1.1705 | 0.2789 | 5.2483 |
| (1.7789) | (2.5844) | (1.8295) | (4.5124) | |
| EPU | −0.0002 | 0.0002 | −0.0011 | 0.0010 |
| (0.0005) | (0.0008) | (0.0008) | (0.0010) | |
| ER | −1.8037 | −1.9419 | −0.5318 | 0.3221 |
| (1.6938) | (2.3784) | (1.9597) | (6.9189) | |
| FD | 0.3629 | −2.4323 *** | −2.7918 *** | −3.3458 |
| (0.6616) | (0.3603) | (0.3196) | (4.0958) | |
| ECS | 1.0929 *** | 0.6639 ** | 0.2802 | 0.3928 |
| (0.2583) | (0.1763) | (0.1858) | (1.9224) | |
| ML | −0.0227 ** | 0.0129 | −0.0592 *** | −0.0557 |
| (0.0086) | (0.0092) | (0.0147) | (0.0590) | |
| Constant | −2.6213 *** | −0.8657 | −0.1203 | −0.3853 |
| (0.4249) | (0.2644) | (0.1810) | (2.4749) | |
| Fixed-effects | Yes | Yes | Yes | Yes |
| N | 110 | 66 | 121 | 33 |
| R2 | 0.697 | 0.907 | 0.683 | 0.186 |
Note: Standard errors in parentheses; * p < 0.1, ** p < 0.05, *** p < 0.01.
Table 6.
Quantile regression estimates of factors affecting CO2 emissions.
| (1) | (2) | (3) | |
|---|---|---|---|
| Q10 | Q50 | Q90 | |
| Greencredit | −0.0942 | −0.3590 *** | −0.7332 *** |
| (0.1614) | (0.0912) | (0.1920) | |
| FDI | 2.4869 ** | 1.2662 ** | 0.7474 |
| (1.0388) | (0.6167) | (1.1043) | |
| EPU | −0.0015 | −0.0019 *** | 0.0000 |
| (0.0011) | (0.0006) | (0.0012) | |
| ER | −1.8066 | 0.2791 | −1.2667 |
| (2.7966) | (1.5824) | (3.7081) | |
| FD | 0.0567 | −0.0139 | −0.0352 |
| (0.2166) | (0.1309) | (0.1563) | |
| ECS | 0.5005 *** | 0.5567 *** | 0.5464 *** |
| (0.0815) | (0.0381) | (0.0911) | |
| ML | −0.0644 *** | −0.0428 *** | −0.0185 |
| (0.0118) | (0.0075) | (0.0142) | |
| Constant | −1.7904 *** | −1.6698 *** | −1.4830 *** |
| (0.1527) | (0.0844) | (0.1257) | |
| Fixed-effects | Yes | Yes | Yes |
| N | 330 | 330 | 330 |
Note: Standard errors in parentheses; * p < 0.1, ** p < 0.05, *** p < 0.01.
Table 7.
Estimation results of the threshold level of ISS1.
| Critical Values | |||||||
|---|---|---|---|---|---|---|---|
| Threshold Value | Confidence Interval of 0.95 | F-Value | p-Value | 1% | 5% | 10% | |
| Single | 0.410 ** | [0.401,0.424] | 37.602 | 0.042 | 47.494 | 35.976 | 33.078 |
| Double | 0.687 | [0.341,0.797] | 1.877 | 0.164 | 10.946 | 5.064 | 3.538 |
Note: Standard errors in parentheses; ** p < 0.05.
Table 8.
Estimation results of the threshold level of TI.
| Critical Values | |||||||
|---|---|---|---|---|---|---|---|
| Threshold Value | Confidence Interval of 0.95 | F-Value | p-Value | 1% | 5% | 10% | |
| Single | 0.013 *** | [0.010, 0.013] | 40.229 | 0.004 | 36.373 | 27.315 | 22.234 |
| Double | 0.006 *** | [0.006, 0.010] | 69.975 | 0.000 | 16.640 | 0.937 | −5.395 |
| Triple | 0.008 | [0.007, 0.023] | 0.000 | 0.172 | 0.000 | 0.000 | 0.000 |
Note: Standard errors in parentheses; *** p < 0.01.
Table 9.
Threshold regression results of the whole sample.
| (1) | (2) | |
|---|---|---|
| Threshold Variable: ISS1 | Threshold Variable: TI | |
| Greencredit # Regime1 | −0.1574 * | 0.4973 *** |
| (0.0886) | (0.0984) | |
| Greencredit # Regime2 | −0.3036 *** | −0.0547 |
| (0.0853) | (0.0814) | |
| Greencredit # Regime3 | −0.2813 *** | |
| (0.0772) | ||
| FDI | 3.1296 *** | 1.8731 *** |
| (0.5618) | (0.5557) | |
| EPU | −0.0007 * | −0.0004 |
| (0.0004) | (0.0005) | |
| ER | −4.5010 *** | −2.0913 * |
| (1.0775) | (1.0872) | |
| FD | −1.6375 *** | −0.2948 *** |
| (0.1790) | (0.0894) | |
| ECS | 0.5495 *** | 0.5153 *** |
| (0.0701) | (0.0320) | |
| ML | −0.0311 *** | −0.0194 *** |
| (0.0071) | (0.0066) | |
| Constant | −1.0155 *** | −1.7636 *** |
| (0.1109) | (0.0618) | |
| Fixed-effects | Yes | Yes |
| N | 330 | 330 |
Note: Standard errors in parentheses; * p < 0.1, ** p < 0.05, *** p < 0.01.
Publisher’s Note: MDPI stays neutral with regard to jurisdictional claims in published maps and institutional affiliations. |
© 2021 by the authors. Licensee MDPI, Basel, Switzerland. This article is an open access article distributed under the terms and conditions of the Creative Commons Attribution (CC BY) license (https://creativecommons.org/licenses/by/4.0/).
Share and Cite
MDPI and ACS Style
Zhang, W.; Hong, M.; Li, J.; Li, F. An Examination of Green Credit Promoting Carbon Dioxide Emissions Reduction: A Provincial Panel Analysis of China. Sustainability 2021, 13, 7148. https://0-doi-org.brum.beds.ac.uk/10.3390/su13137148
AMA Style
Zhang W, Hong M, Li J, Li F. An Examination of Green Credit Promoting Carbon Dioxide Emissions Reduction: A Provincial Panel Analysis of China. Sustainability. 2021; 13(13):7148. https://0-doi-org.brum.beds.ac.uk/10.3390/su13137148
Chicago/Turabian StyleZhang, Wenjie, Mingyong Hong, Juan Li, and Fuhong Li. 2021. "An Examination of Green Credit Promoting Carbon Dioxide Emissions Reduction: A Provincial Panel Analysis of China" Sustainability 13, no. 13: 7148. https://0-doi-org.brum.beds.ac.uk/10.3390/su13137148
Note that from the first issue of 2016, this journal uses article numbers instead of page numbers. See further details here.