Article

Measuring the Impact of Physical Geographical Factors on the Use of Coastal Zones Based on Bayesian Networks

by
Eglė Baltranaitė
*,
Loreta Kelpšaitė-Rimkienė
,
Ramūnas Povilanskas
,
Ilona Šakurova
and
Vitalijus Kondrat
Marine Research Institute, Klaipėda University, Universiteto Ave. 17, LT-92294 Klaipėda, Lithuania
*
Author to whom correspondence should be addressed.
Sustainability 2021, 13(13), 7173; https://0-doi-org.brum.beds.ac.uk/10.3390/su13137173
Submission received: 13 May 2021 / Revised: 17 June 2021 / Accepted: 21 June 2021 / Published: 25 June 2021
(This article belongs to the Special Issue Sustainable Coastal and Marine Management)

Abstract

:
Coastal regions of the Baltic Sea are among the most intensively used worldwide, resulting in a need for a holistic management approach. Therefore, there is a need for strategies that even out the seasonality, which would ensure a better utilization of natural resources and infrastructure and improve the social and economic conditions. To assess the effectiveness of coastal zone planning processes concerning sustainable tourism and to identify and substantiate significant physical geographical factors impacting the sustainability of South Baltic seaside resorts, several data sets from previous studies were compiled. Seeking to improve the coastal zone’s ecological sustainability, economic efficiency, and social equality, a qualitative study (content analysis of planning documents) and a quantitative survey of tourists’ needs expressed on a social media platform and in the form of a survey, as well as long-term hydrometeorological data, were used. Furthermore, a Bayesian Network framework was used to combine knowledge from these different sources. We present an approach to identifying the social, economic, and environmental factors influencing the sustainability of coastal resorts. The results of this study may be used to advise local governments on a broad spectrum of Integrated Coastal Management matters: planning the development of the beaches and addressing the seasonality of use, directing investments to improve the quality of the beaches and protect them from storm erosion, and maintaining the sand quality and beach infrastructure. The lessons learned can be applied to further coastal zone management research by utilizing stakeholders and expert opinion in quantified current beliefs.

1. Introduction

A growing population and intensified human activities are causing increasing pressures on the environment; this is very true for urban areas, especially those located at coasts and relying on the ecosystem services of coastal systems around the world [1,2,3,4].
Coastal areas with well-developed tourism infrastructure and strategies in place are accustomed to tourist flows and associated tendencies. However, urban areas located at the coasts need to adapt more to the ever-increasing tourism demand as they become more popular destinations. The cities that receive the most significant tourist flows are large multifunctional systems where tourists can be easily absorbed and become physically and economically invisible [5]. This is especially true concerning the local residents of urban areas; they are rarely considered as users of tourism services. Therefore, holistic approach strategies that even out the seasonality, which would ensure a better utilization of natural resources and infrastructure and improve the social and economic conditions, are needed for the sustainable development of both coastal and urban tourism.
The process of marine environment governance is very complex and challenging [6] and is complicated by the Baltic Sea being among the most intensively used coastal regions worldwide [7] and one of the busiest and most polluted regional seas in Europe [8]. Even though the Baltic Sea is referred to as having the best management in place, in spite of its good governance system, it is still affected by severe environmental problems and risks as a result of shortcomings of that governance [9]. Therefore, attempting to meet the environmental objectives of reaching Good Environmental Status by 2021 in the HELCOM Baltic Sea Action Plan (BSAP) and by 2020 in the EU Marine Strategy Framework Directive (MSFD) has been a struggle [6]. Nevertheless, as of today, about 71% of the joint regional actions and 29% of the national efforts of the Baltic Sea Action Plan have been reported as fully implemented.
The present study aims to identify and substantiate significant physical geographical factors impacting the sustainability of South Baltic coastal resorts by applying Bayesian Networks, relying on the study area’s socioeconomic and long-term observation data.
Our central argument is that physical geographical factors, such as location, beach type, water, and air temperature, play a significant role in the sustainability of coastal resorts and are the main reasons why tourists want to visit a particular resort and why they are chosen as places of residence. Moreover, we aim to assess how well reflected this aspect is in regional-level planning documents.
To demonstrate this argument and to discuss its implications, this paper is organized as follows: It begins with an introduction to the methods and materials and descriptions of the South Baltic region, the study area, and Klaipėda, a case study area. In the results section, first, we analyze the outputs of the Bayesian Network modeling, aiming to elicit and discuss the principal components that identify and substantiate significant physical geographical factors impacting the sustainability of South Baltic coastal resorts based on the variables from the socioeconomic and long-term observation data. We then present the implications and opportunities for improved predictions as well as regional adaptation options.

2. Materials and Methods
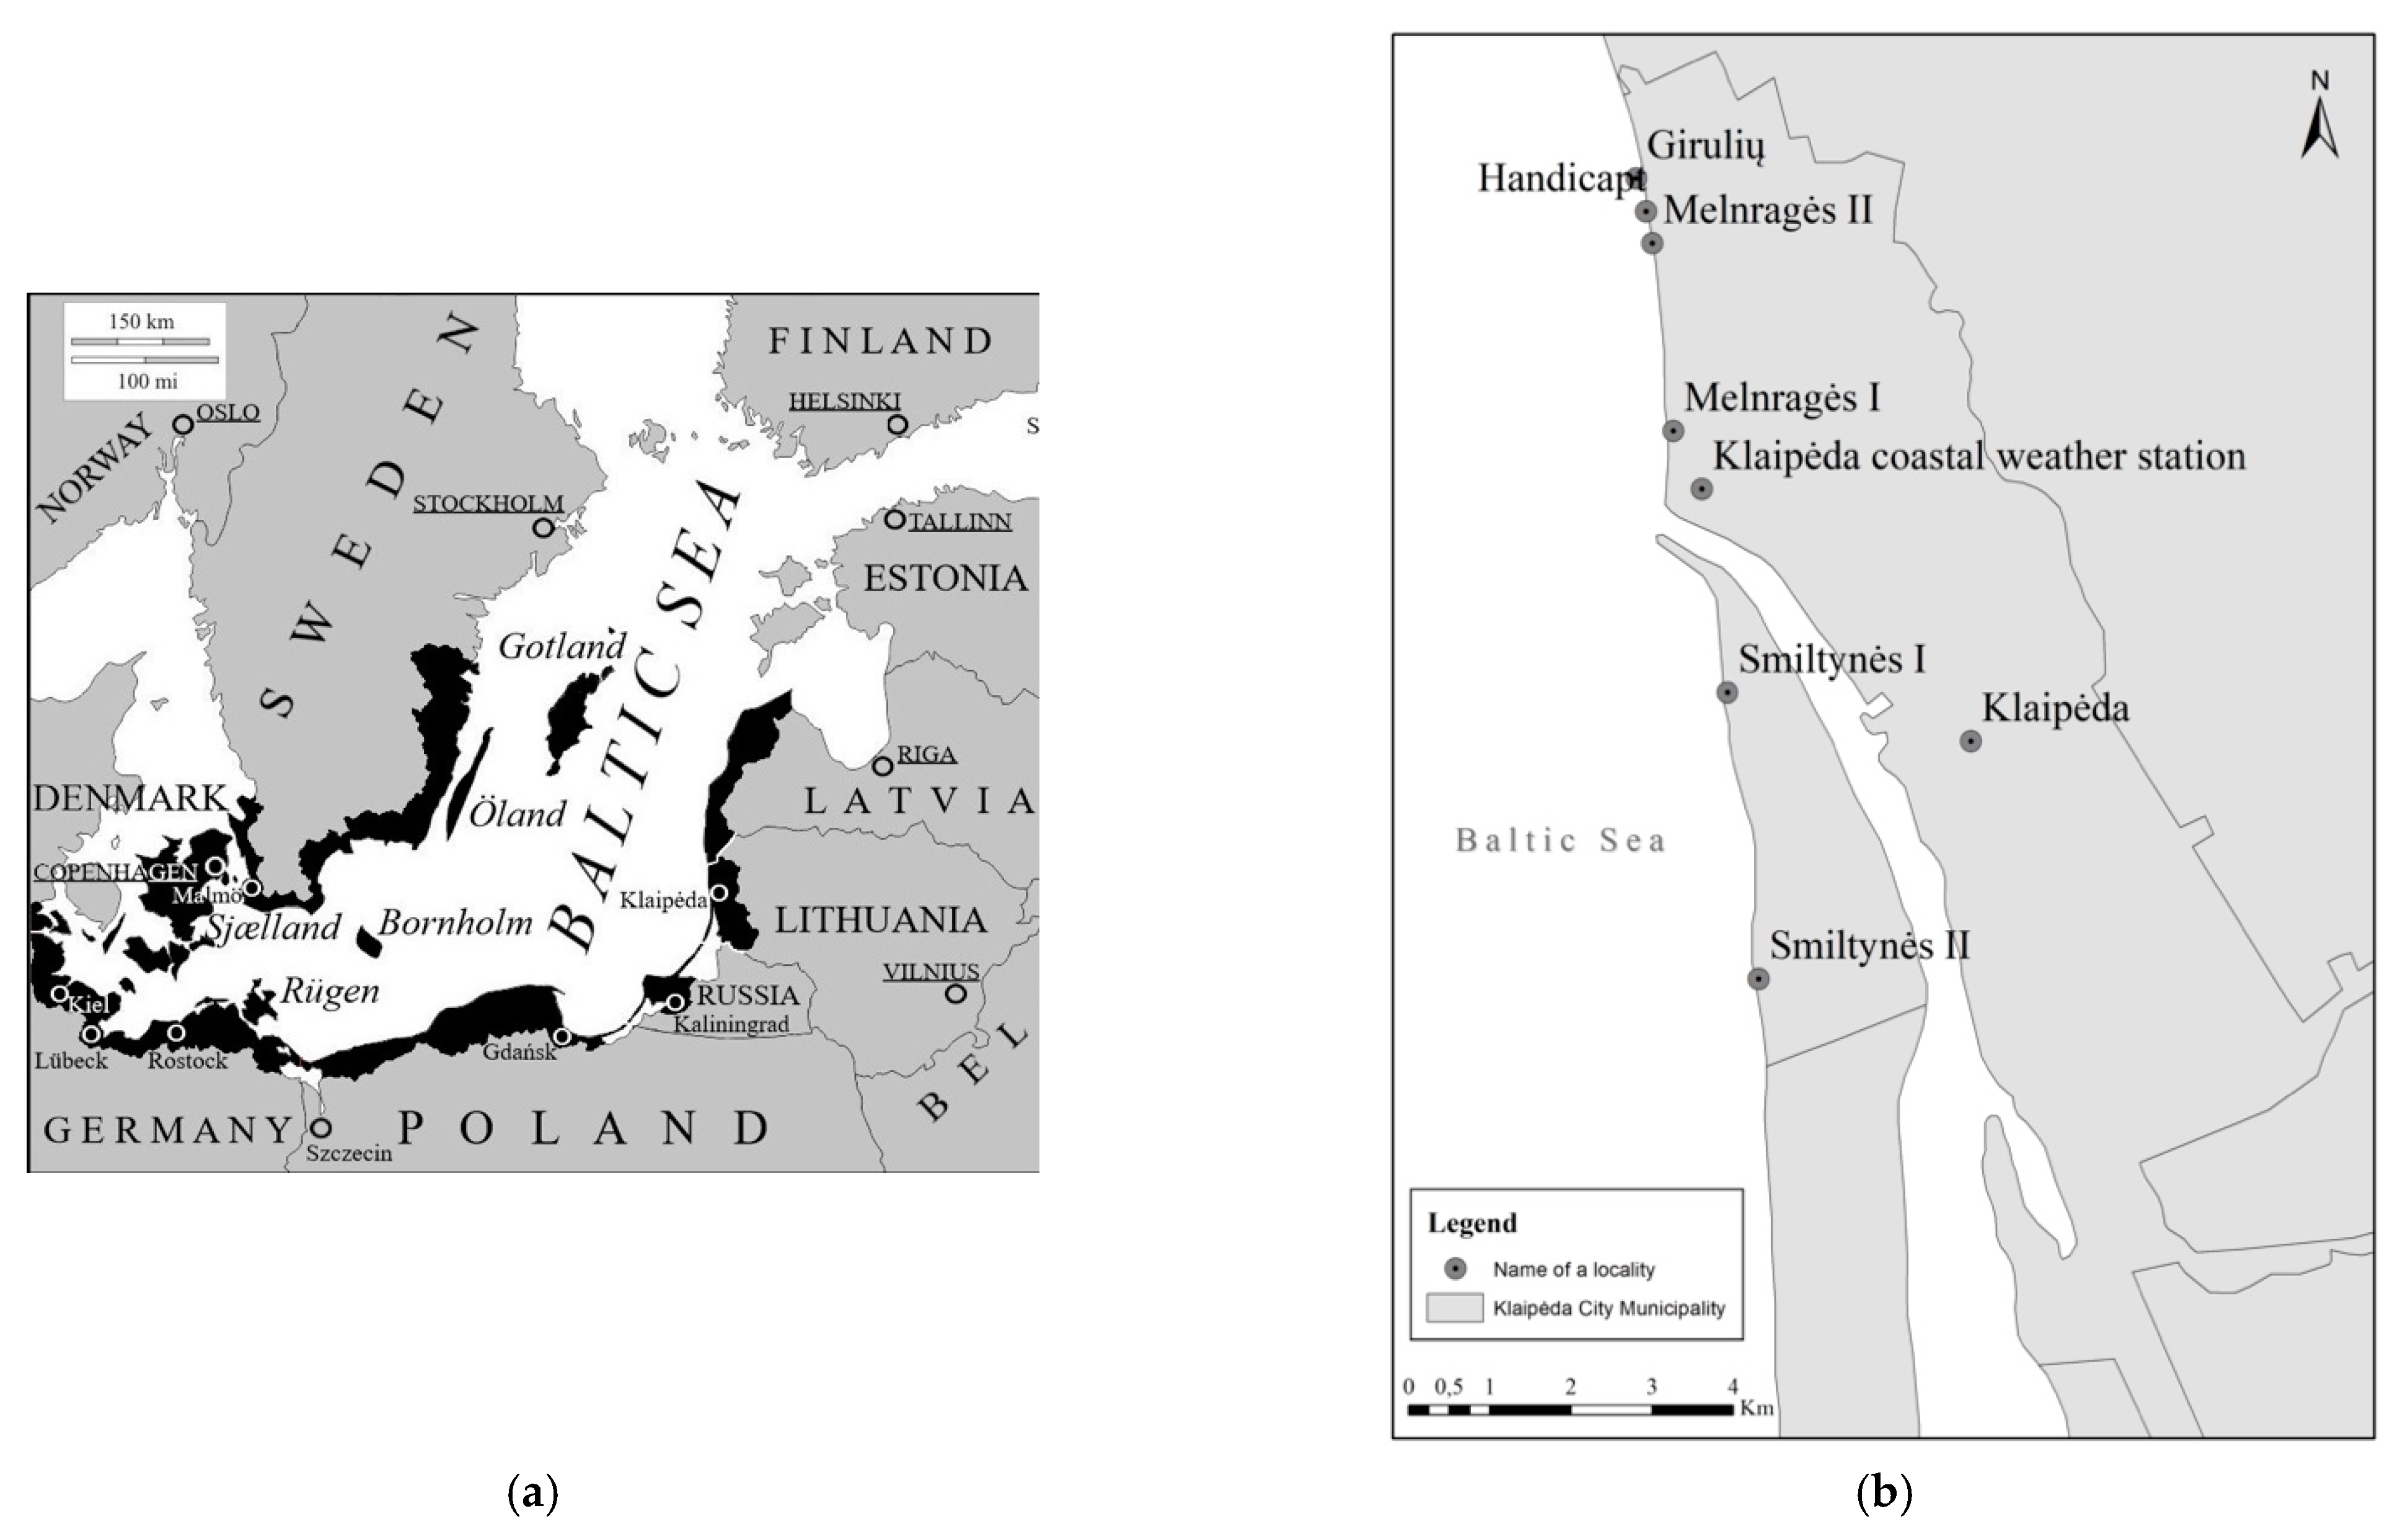
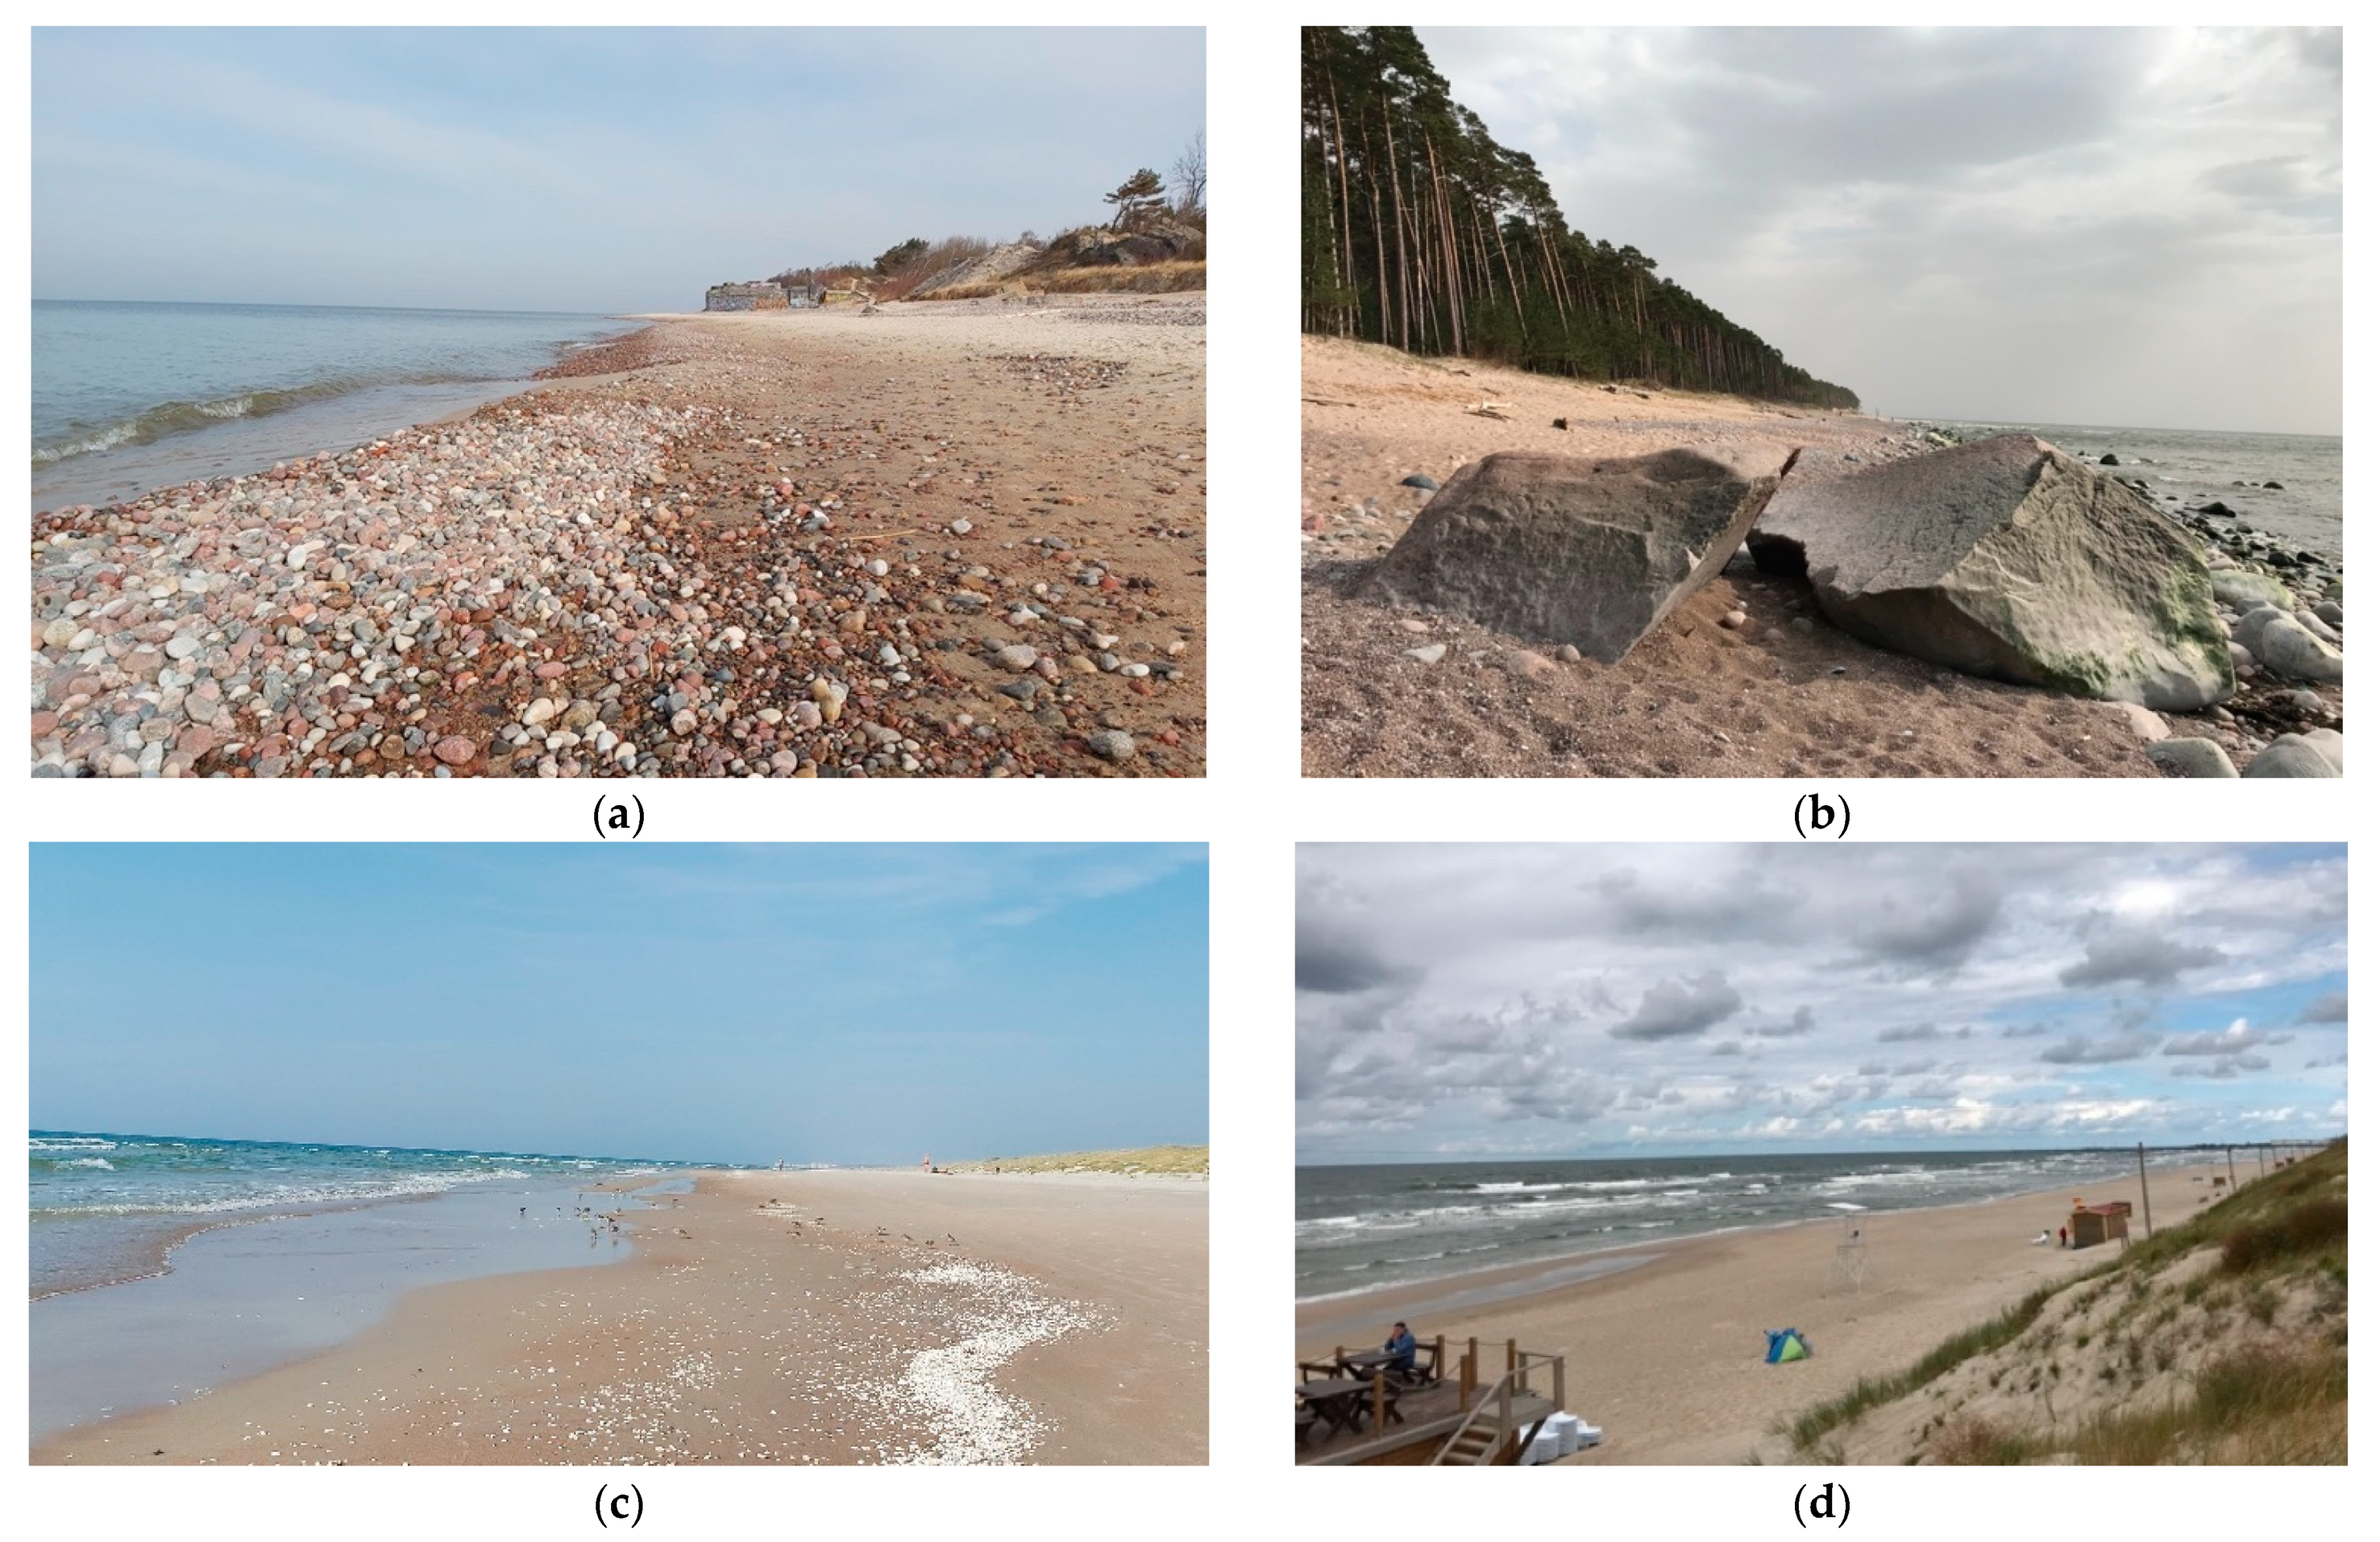
2.1. Study Area

For this study, the South Baltic Sea coastal region was selected with the spotlight on a case study area in Klaipėda, Lithuania.
The Baltic Sea presents large variability in the coastal types: stable rocky cliffs at the northern end and, at the southern end, sandy coasts, vulnerable to coastal erosion and human pressure [10]. In this study, the authors define the South Baltic region with the boundary between the Northern Baltic proper. Both the Eastern and Western Gotland basins serve as the physical boundary as described in the SEAPLANSPACE General Knowledge Manual [11]. The study area stretches over 79,838 sq. km in seven countries: Sweden (28,694 sq. km), Denmark (10,596 sq. km), Germany (19,771 sq. km), Poland (9293 sq. km), Russian Federation (2173 sq. km), Lithuania (4298 sq. km), and Latvia (5013 sq. km) (Figure 1a).
Coastal regions of the Baltic Sea are among the most intensively used worldwide. Tourism, predominantly “Sun, Sand & Sea”, plays an important economic role at the South Baltic coast but poses a challenge to sustainability, as this tourism relies on seasonality-bound resources. Tourism seasonality, combined with the increasing threat of coastal erosion, urges an in-depth evaluation of the strengths and weaknesses of the South Baltic seaside resorts influenced by the physical factors [12]. Most planning documents of the territorial entities in the study area consider sandy beaches as the key seaside tourism amenity [12].
We selected a case study area in Klaipėda, Lithuania (Figure 1b) for an in-depth look. This area is identified as a hot spot on the Lithuanian Baltic Sea coast due to its vulnerability to natural and anthropogenic influence because it is located in an extremely high-energy and rapidly developing environment [13,14]. The municipality of Klaipėda has about 11.2 km of sandy coastline, open to the predominant wind directions [15,16]. The town of Klaipėda covers 6.3 km of the Curonian Lagoon’s shore in the territory of the Curonian Spit and is about 16 km away from the Klaipėda strait and the northern part of the Curonian lagoon.
Tourism is a growing sector for the area, aided by the cruise ship terminal opened in 2003. The number of overnight stays in 2019 totaled over 250,000 [17]. Klaipėda is also the northernmost ice-free port on the eastern coast of the Baltic Sea and has a deep-water harbor with an annual port cargo handling capacity of up to 70 million tons and an annual turnover exceeding 47 million tons [18].
Being one of the most rapidly developing cities in the country and due to its coastal disposition, Klaipėda is increasing in popularity among tourists from Lithuania and abroad. As a result, a home-sharing service tendency is on the rise, especially during the warm summer months, causing an ever-growing pressure while creating a constantly increasing demand for good quality services and environmental solutions.
Klaipėda municipality administrates seven beaches (Table 1, Figure 1b) located on two morphologically different coasts, separated by the Klaipėda strait. The port of Klaipėda is situated at the entrance channel that interrupts the natural longshore sediment transport path [19,20].
The Curonian Spit coast is home to the Klaipėda residents’ beaches of preference [21]. Located there are the Smiltynės I and Smiltynės II beaches (Figure 2) (total length 3400 m): an accumulative coast with fine sand and a well-developed dune system [22,23]. On the opposite side of the Klaipėda strait, at the mainland coast, a geomorphologically different [23] coast is located. The Melnragės I and Melnragės II beaches (Figure 2) are in the vicinity of the Port of Klaipėda and have suffered from significant erosion in the last few years; more coarse sediments and narrow beaches [15,23,24] are typical in this part of the territory. Girulių Beach, situated more to the north of the Port of Klaipėda jetties, is wider and with finer sediments than the Melnragės beaches (Figure 2). Handicapped Beach, located at the moraine cliff coast, is very popular among Klaipėda‘s residents [23].
The Smiltynės I and Melnragės II beaches (Figure 2) were awarded Blue Flag certificates for the years 2018–2021 [25], proving that important environmental, educational, safety-related, and access-related criteria have been met.

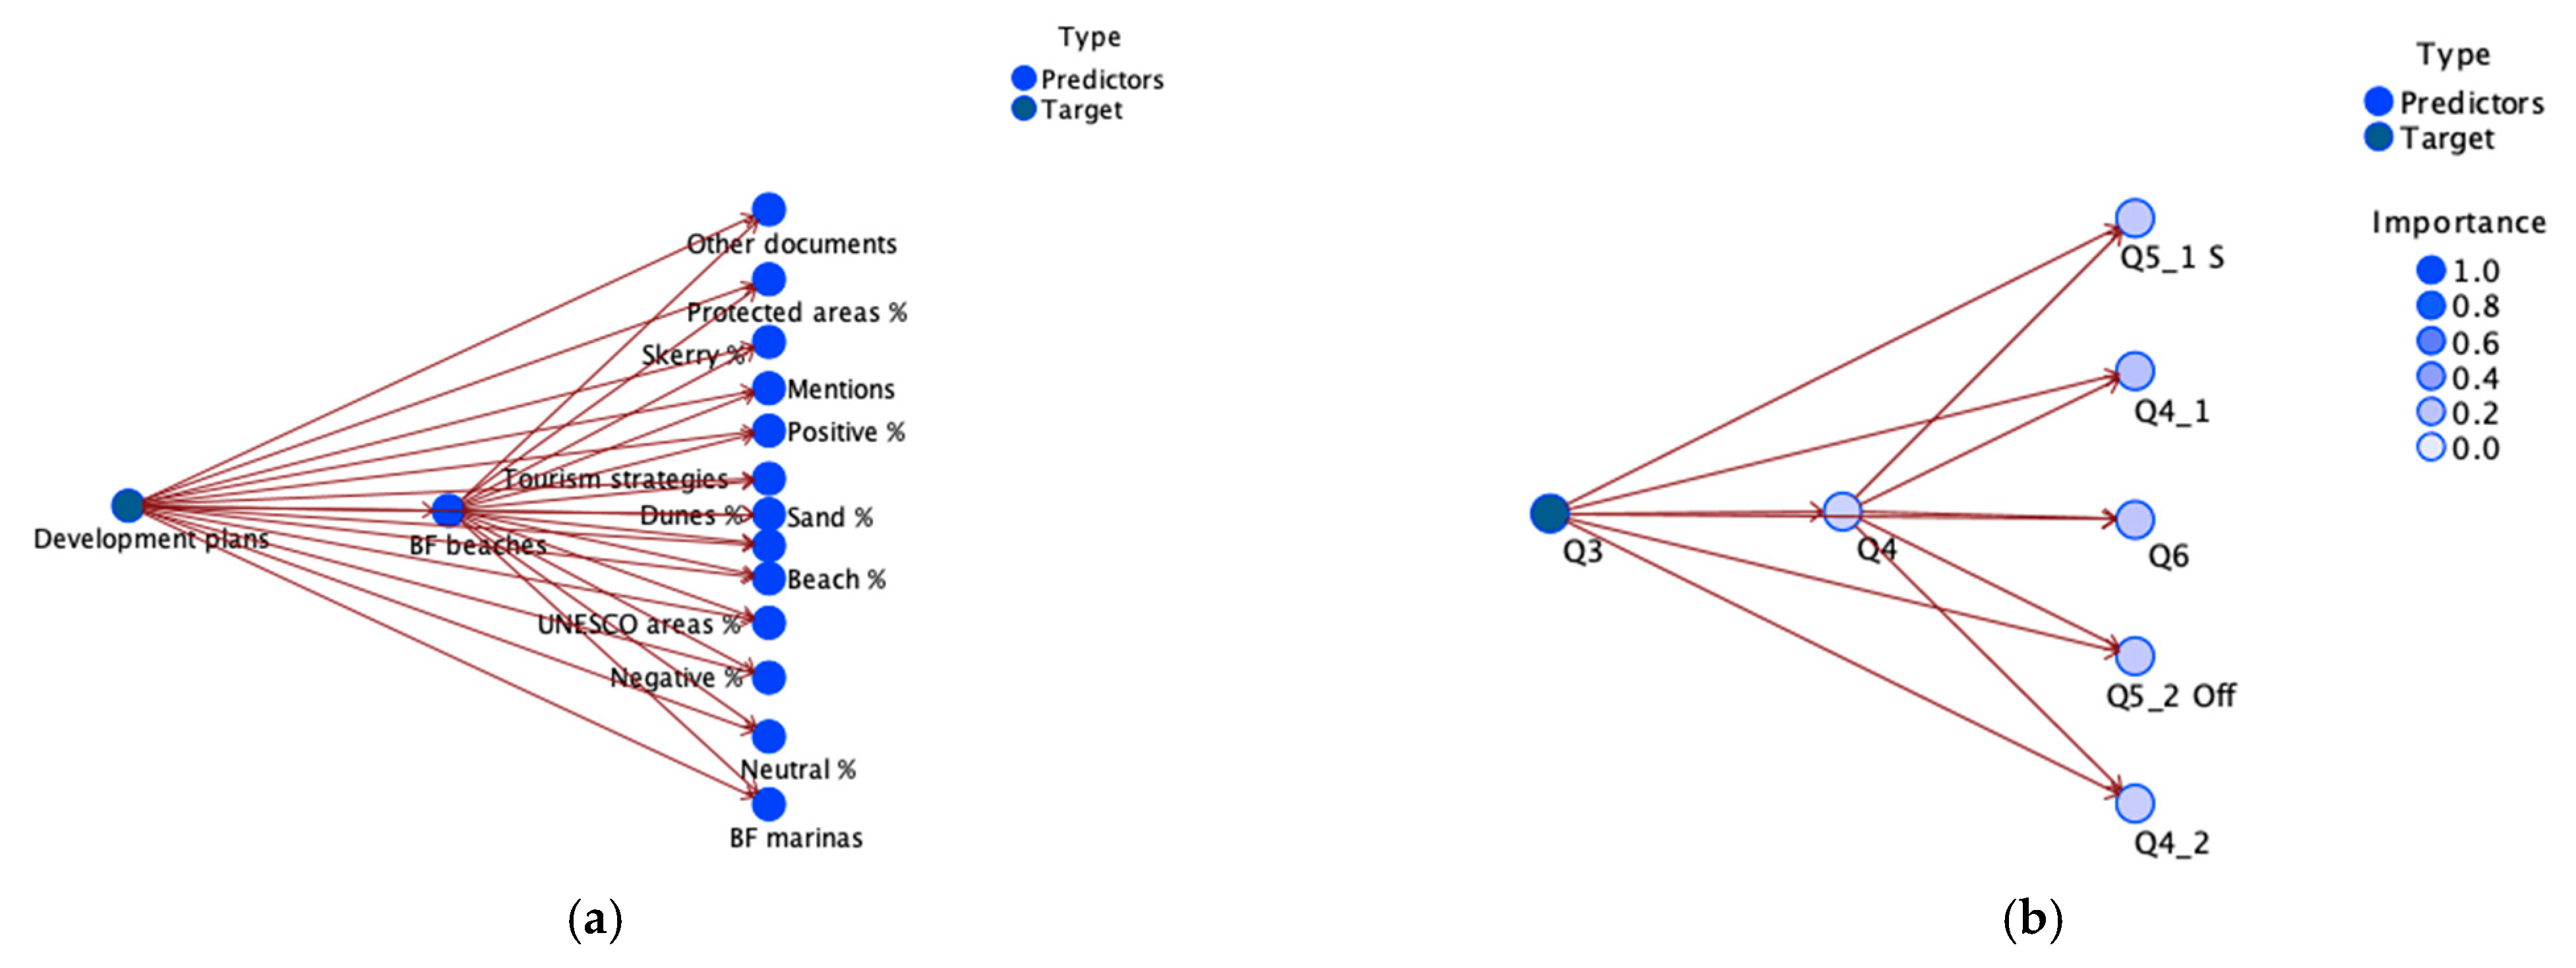
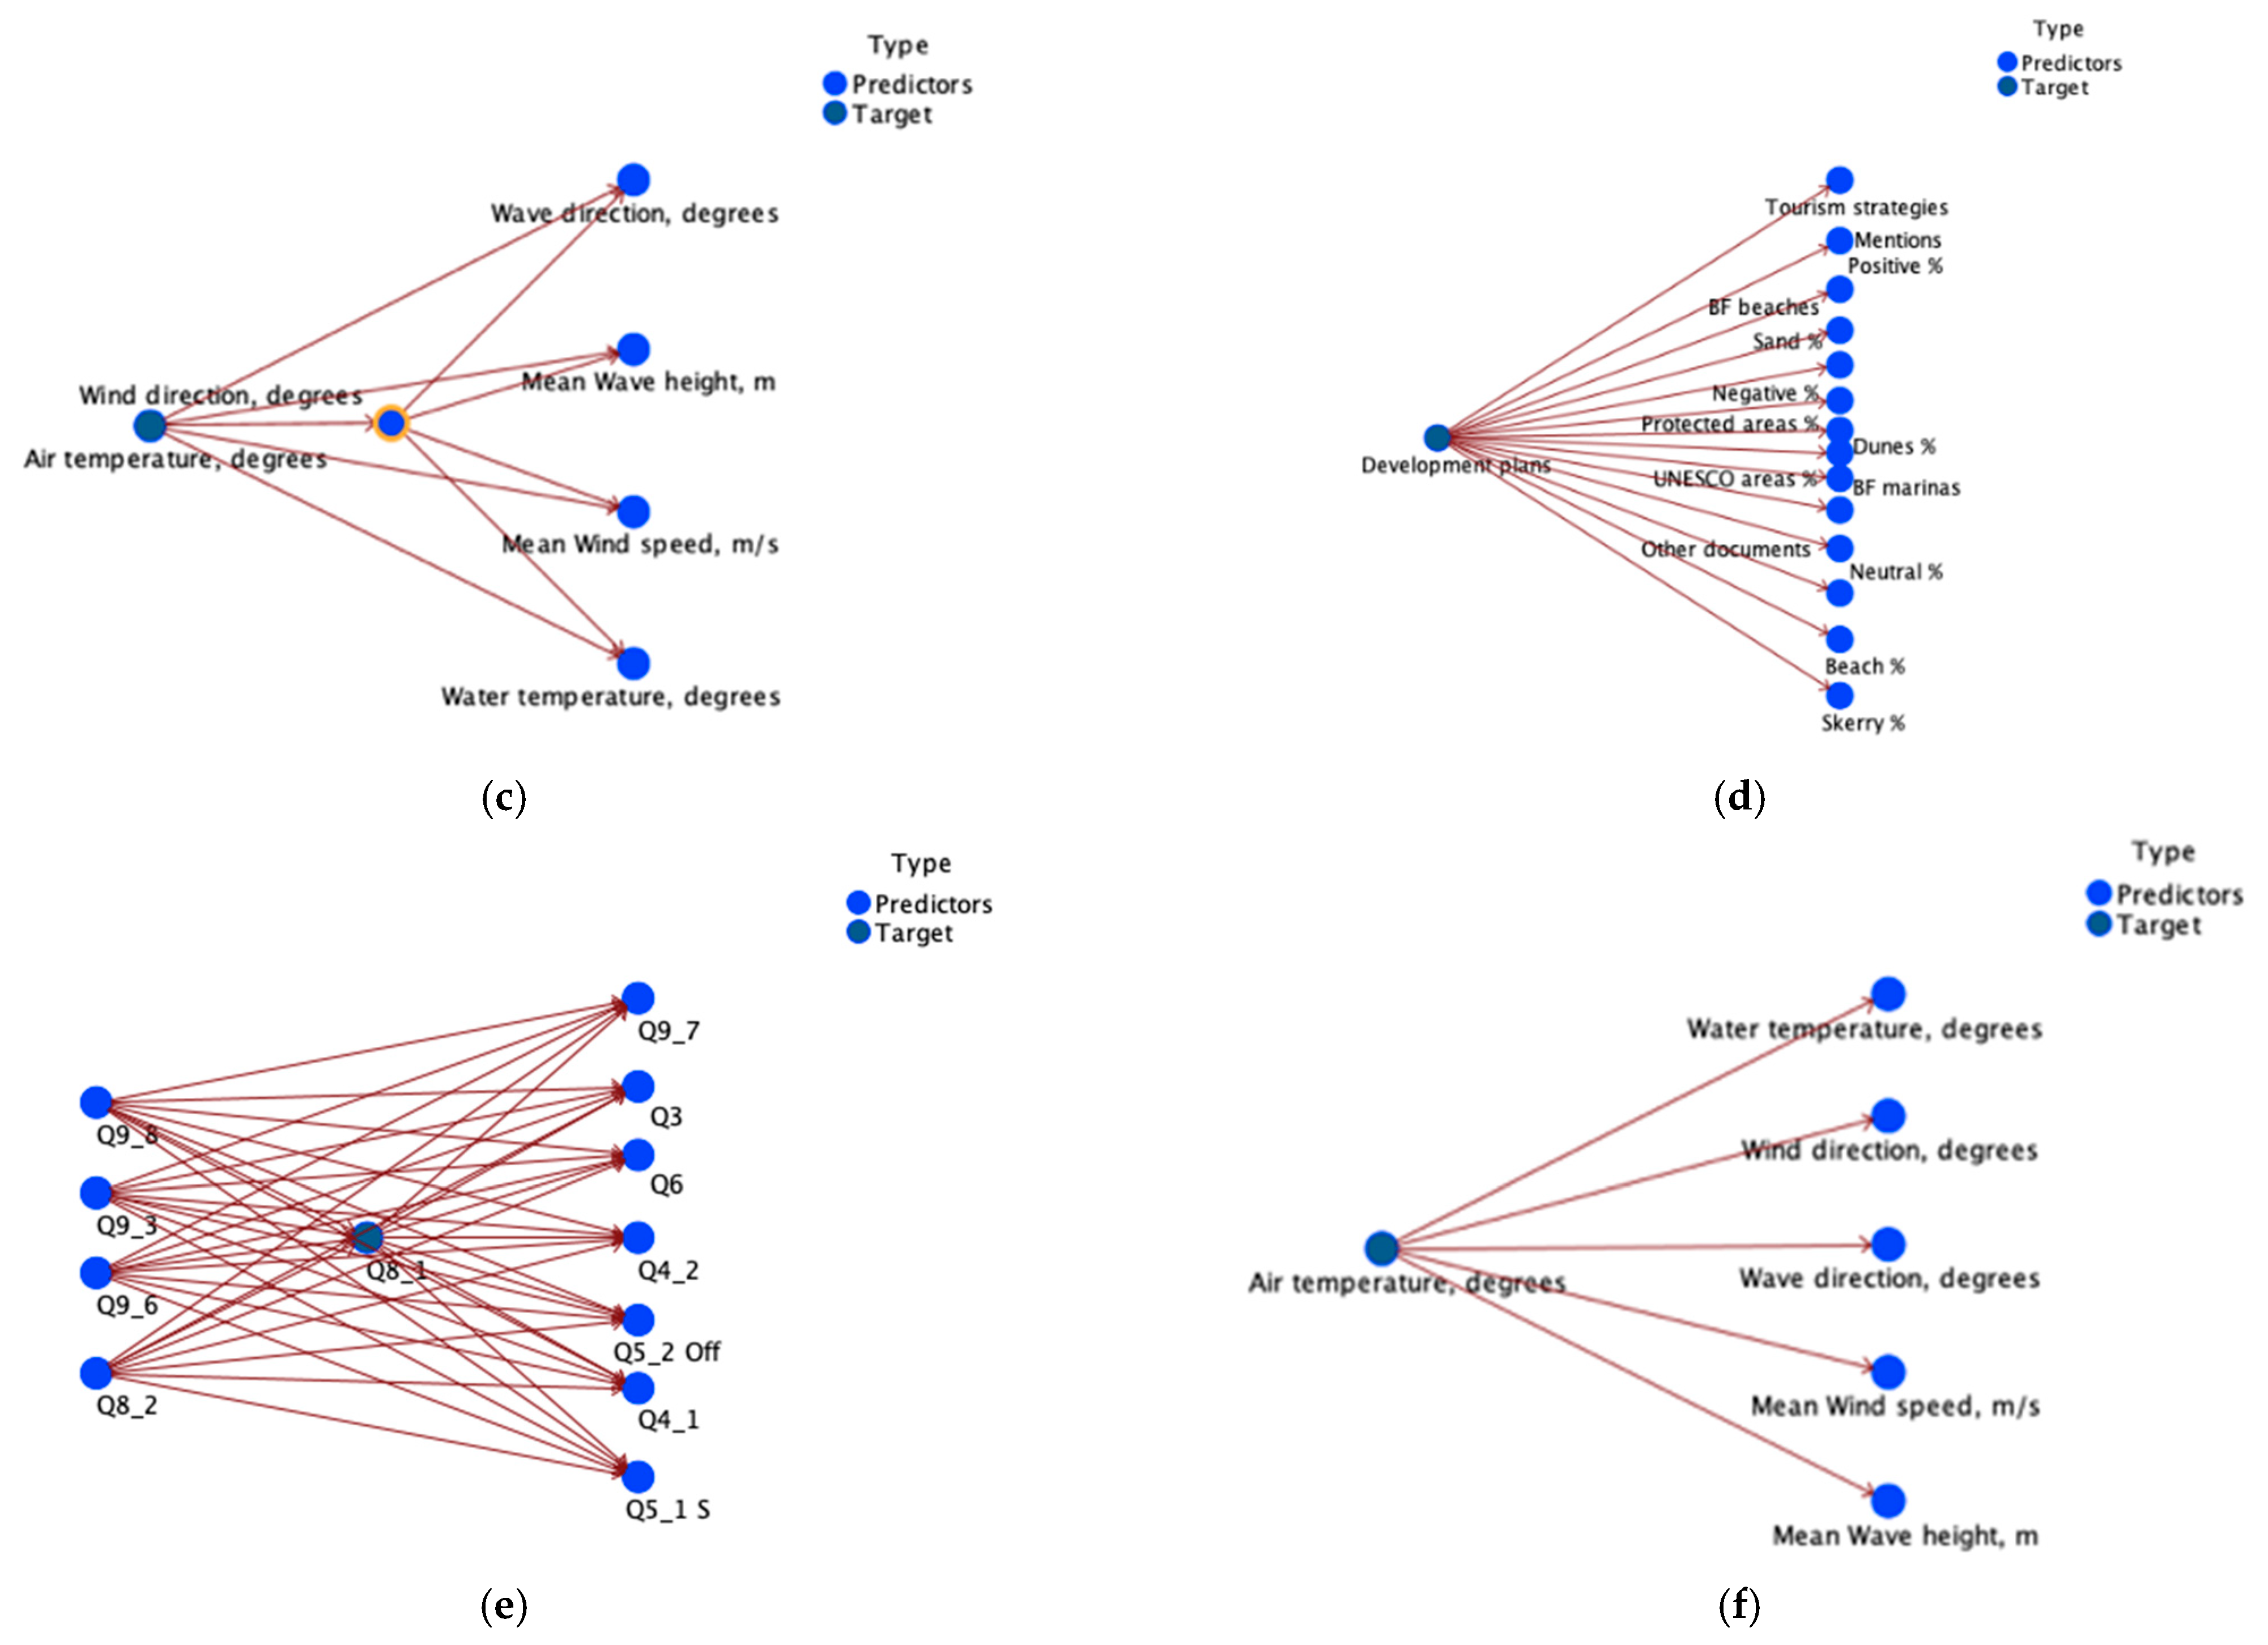
2.2. Background of the Methodology Used—Bayesian Networks for Influence Factors

There are two main philosophies of probability and statistics, Bayesian and Frequentist [26,27]. The Bayesian probabilistic paradigm is one of personal perspective with tools to update our beliefs about random events by considering new data about those events. Specifically, Bayesian approach allows researchers to incorporate background knowledge into analysis, including the lessons of previous studies. The basic steps of the Bayesian analysis are: (1) quantifying current beliefs via a prior distribution, (2) quantifying information provided by new data via the likelihood, (3) using Bayes’ Theorem to update beliefs and form the posterior distribution [28,29].
The Bayesian approach is becoming more common in many scientific fields. The increase in Bayesian applications is taking place not only in social sciences but also in humanities research [30,31]. This increase is related to the availability of Bayesian computation methods in various popular software packages [32].
The Bayesian formula is universal in its theory as well as in its application [28]. As the Bayesian belief networks allow, we used a combination of objective and subjective information. Where hard data were absent, we performed calculations based on specialists’ estimations, as per the authors of [33]. A numerical value was attributed to all qualitative data in a format that is complementary to the quantitative data.
P ( H / E ) = P ( E / H ) * P ( H ) P ( H ) .
Here, P is the probability, H is the hypothesis, and E is the event, where P (H) is a prior probability and P(H/E) a posterior one.
By applying Bayesian Networks (BNs), we did not reach a final conclusion but performed a continuous evaluation of understanding as new information occurs, each time updating the probability that something is true.
P ( H / E ) = P ( E / H ) * P ( H ) P ( H ) * P ( E / H ) + P ( H ) * P ( E / H ) .
BN modeling methodology helps to represent the causal relationships of a system in the context of variability, uncertainty, and subjectivity; elicits subjective expert opinion; and provides a framework for model improvement as new data and knowledge become available [34].
It also provides a systems thinking framework for combining knowledge/data from different sources and of different accuracy levels [35], including the capacity to integrate social, economic, and environmental variables within a single model [36].

2.3. Data Sources

2.3.1. Physical Gfeographical Factors of Klaipėda

The hydrometeorological data (Table 2) used in this research was obtained from the Marine Environment Assessment Division of the Environmental Protection Agency (EPA), Lithuanian Hydrometeorological Service, under the Ministry of Environment, the Palanga Aviation Meteorological Station, and the National Oceanic and Atmospheric Administration. The data were initially collected at the Klaipėda Meteorological Station on the Baltic Sea coast in Lithuania and processed by the authors. The Klaipėda Meteorological Station is located near the Klaipėda Sea Gate (Figure 1b). As buildings surround it, there is no direct access to the Baltic Sea. The height above sea level is 6.2 m.
The recommended, decadally updated 30-year averages in the data sets of the period 1960–2019 were used as the standard World Meteorological Organization (WMO) climate normals [37].
The selection of the following physical geographical factors withiFn this study was made with regard to sustainability and was based on their conclusive influence on tourism and shoreline changes [16,38,39].

2.3.2. Klaipėda Survey Data

A questionnaire survey identifying local residents’ perceptions of the physical parameters of bathing water quality, beach quality, beach location, and water temperature preferences was conducted from fall 2019 to winter 2020 in the Klaipėda Municipality (Table 2). Altogether, 220 respondents participated. The questionnaire (Appendix A) was provided in the Lithuanian language only and focused on local inhabitants of Klaipėda Municipality who visited the seaside territory.
The results were significant in providing local knowledge and a perspective of the local community, so that, through Integrated Coastal Management, development planning of the beaches could be improved, and questions such as the seasonality of use, where to direct investments to improve the quality of beaches and protect them from storm erosion, and the sand quality and beach infrastructure could be addressed.
On average, a beachgoer spent up to 2–3 h on the beach. The minimum temperature considered acceptable for the Baltic Sea bathing season to begin, according to Klaipėda area locals, was 17 °C, but optimal bathing water temperature was 21 °C.
Most of the respondents found information about weather conditions and bathing water quality online or at beach information boards, which was especially the case for water and air temperature (57%).
Beaches located on the Curonian Spit (in the south part; Table 1) tended to be used mostly as summer beaches for bathing and sun-bathing. This area is a part of a national park and has a ferry connection that restricts its accessibility.
Bathing water quality concerns regarding Klaipėda beaches were not as highly prioritized by locals as they were in the neighboring Neringa resort, where a study was conducted on tourists in 2016 [7].
Sixty-five percent of the respondents that owned dogs took them to the beach, and their beach choices were usually influenced by the season. Dog owners mostly (77.3% of the time) chose to visit beaches on the mainland (in the north area; Table 1).
Benford’s law was applied to assess the data set, as it could be used to test for data abnormalities, including respondent distortions, and could serve as a valuable tool for evaluating and testing survey data integrity [40,41,42]. In addition, it has been frequently used in forensic accounting and gaining momentum in testing elections for potential fraud detection, popular social networking websites, and other fields [40,41].
Benford’s law states that all systems that occur naturally follow the tendency to distribute first digits unevenly, but their frequency follows a first digit phenomenon. Numbers beginning with the number 1 are far more common than numbers starting with the number 9. Numbers begin with a 1 more than six times as often. The exact frequency P predicted for a digit is given by the following formula [41]:
P(x) = log 10(1 + 1/x).

2.3.3. South Baltic Management Variables

The authors of this study compiled a data set of seven selected socioeconomic variables based on the demand for physical geographical resources (Table 3, Figure 3) and the influencing competitiveness and sustainability of the South Baltic seaside resorts to allow for a comparison of different areas to assess the sustainability and competitiveness of the study area.
To assess the effectiveness of coastal area planning processes concerning sustainable tourism, a qualitative study (content analysis of planning documents) and a quantitative survey of tourists’ needs expressed on a social media platform were applied to a South Baltic seaside. Content analysis of comprehensive plans and development strategies was applied using a “nuts-and-bolts” [43] approach to obtain insight into the planning of the Baltic seaside sustainability.
Images of tourist attraction sites are some of the most common subjects in tourism research [44,45], but qualitative analysis of tourist feedback on social networks (user-generated content) has rarely been done. Increasingly, information communication technologies have a decisive influence on the competitiveness of tourism organizations and destinations and on the tourism system itself. They enable tourists to exchange information about tourist attractions and services, thus influencing other tourists’ decisions about where to go and which services to choose [46,47,48,49,50].
For establishing which factors were important to the tourists of the South Baltic seaside resorts, consumer-generated content, i.e., public photos and videos that were tagged with specific hashtags and posted on the social media site Instagram, was used. Gathered data were processed using content analysis software (KH Coder 2.0) for quantitative content analysis and text mining [51]. Using KH Coder, hierarchical cluster analysis was undertaken to elicit topical co-occurrence networks for nouns, verbs, and adjectives occurring in the reviews.

2.4. Quantitative and Qualitative Analysis

To assess the significant physical geographical factors impacting the sustainability of South Baltic coastal resorts, data from a qualitative study (a content analysis of planning documents), a quantitative survey of residents’ needs, and long-term hydrometeorological observation data were used.
Via correlation statistics, an initial view of the inter-relation of variables was obtained, which was necessary for the subsequent multilinear analysis phase, which is an important factor in selecting parameters entering the analysis.
IBM SPSS Statistics, SPSS Modeler, and Watson Studio Modeler Flows software were used for the data analysis.

3. Results

3.1. Benford’s Law for Survey Accuracy

Information provided by survey data often plays a significant role in policy decisions. Therefore, it is essential to have a basis for identifying the quality of the reported data.
The Klaipėda residents survey data set was created by attributing numerical values to all qualitative data in a format that was complementary to the quantitative data. To evaluate the data set’s integrity after coding and to select data for further use, Benford’s law was applied (Table 4, Figure 4).
As we can see, the distribution of actual digits deviated from Benford’s law. However, such deviation does not necessarily imply a problem with the data set and may not be related to the analysis performed. Although it suggested that the subjects did not reflect an expected distribution, it may be explained by the absence of numbers starting with a 9. The received results followed the established principle as shown in Figure 4 and were supported by the cumulative difference (K-S test) values shown in Table 4.
Benford’s law was applied to the data set each time data were added to ensure continuous compliance to the established principle.

3.2. South Baltic Seaside Sustainability

The following sequential process was used to develop the Bayesian Network models for the study areas: a Bayesian approach using Gibbs sampling [52] was applied as part of the Markov chain Monte Carlo algorithm steps. Step 1 used the entire record to determine candidate change points, and Step 2 determined the posterior distributions of the data before and after the candidate change point [53].
In the first stage, separate prior distributions (presumed probabilities) were applied individually to the quantitative and qualitative data. The Bayes factor for the related sample t test was performed, and a posterior distribution characterization for the related sample mean difference was compared and combined when 95% confidence intervals overlapped.
The second stage of the model’s development process involved using the system conceptualization as a mechanism for identifying three dimensions of sustainability—environmental/ecological, economic, and social (representing an adaptive capacity of the system)—and the variables influencing them (determinants of adaptive capacity). Variables presented in Table 2 and Table 3 were distributed in the three pillars of sustainability accordingly, as shown in Figure 3.
A BN is well suited for explicitly integrating both prior knowledge and information obtained from the data [54]. After performing the first step, each modeled node was attributed a conditional probabilistic table (CPT) showing relations between each node and its parents. Part of the CPT for nodes is illustrated in Figure 5. The left side of the network shows different combinations of parent nodes. The right side shows the conditional probability distribution of the nodes given different combinations of their parent nodes.
The greater conditional probability received for a specific value of predictors is indicative of the greater importance of that variable with a precise specific value. Air temperature and wind direction were shown to be of greater importance in relation to other physical geographical factors, as their conditional probability was higher compared to other variables (Figure 5c). The most influential predictors of the physical factors were temperature and the bathing water temperature that were acceptable and preferable for bathing according to Klaipėda’s residents (Figure 5b,e).
When it came to the choice of beach for recreation, the most important predictor was not one that had to do with physical factors; the highest rankings were attributed to the distance to the beach. Other essential factors were the perceived positive change in the beach quality and the type of beach (common area, women’s areas, etc.). In the off-season, the highest conditional probability was shown in the Melnragės I and Girulių beaches, as well as other, nonofficial beaches. Furthermore, the off-season probabilities correlated most with the duration of stay at the beach (Figure 5b, Appendix A Q3) as well as bathing temperature preferences (Figure 5b, Appendix A Q4).
Overall, for the South Baltic seaside, the existence of a Blue Flag award was a significant predictor concerning development plans and the number of plans in place at a specific location (Figure 5a,d). The presence of sandy beaches and dunes were shown to be the highest influential predictors in both TAN (Tree Augmented Naïve Bayes Network) structure and Markov Blanket structure.

4. Discussion

Nowadays, coastal municipalities face a combination of urban industrial development and the recreational needs of the residents [55,56]. Coastal municipalities aiming to sustainably manage beaches and attract tourism worldwide are utilizing the benefits provided by the Blue Flag award scheme. Such eco-labels play an important role in increasing the competitiveness of recreational areas [57,58]. The Klaipėda municipality has met and maintained the level of environmental, educational, safety-related, and access-related criteria in the Smiltynės I and Melnragės II beaches in order to keep in line with the Blue Flag certificate requirements. Meanwhile, our study showed that locals prefer recreational areas that have not been awarded the Blue Flag. The Smiltynės I and Smiltynės II beaches appear to be preferred during the summer months of the high season to the other beaches in the Klaipėda municipality. As stated earlier, these beaches feature finer sediments and wider beaches (Figure 2). In the off-season, Melnragės I and Girulių become more popular. It is clear that the higher probability rankings are mainly attributed to the distance to the beach; the easier accessibility of these beaches is explained by their favorable geographical location. The beaches located on the mainland are more easily accessible throughout the year and provide free parking in the off-season. Meanwhile, beaches in the southern part of Klaipėda (Figure 1b, Table 1) are a part of a national park and have a ferry connection that restricts their accessibility. These insights will be valuable in the sustainable planning of these recreational areas and the further adaptation to growing tourism and climate change.
Climate factors and especially temperature are the main factors for consistent tourism sector development [59,60,61]. Daily air and water temperature and seasonality are key components to consider for non-local and international tourist attraction and the further strategic planning of tourism [60]. The BN showed that wind direction also plays an essential role among the local communities in deciding whether to visit a beach. Walking along the sea and amber picking in the breaking wave zone are the visitors’ main activities during the stormy season; this information was supported by the Melnragės I beach supervisor (expert judgment). Amber picking requires moderate westerly winds in the study area; meanwhile, the dominant wind directions are south and southwesterly, and the most comfortable walks along the shore can be done during easterly winds.
The appearance of tourist attraction sites is one of the most common subjects in tourism research [44,45]. Still, qualitative analysis of tourist feedback on social networks (user-generated content) is rarely used. Increasingly, information communication technologies have a decisive influence on the competitiveness of tourism organizations and destinations and on the tourism system itself. They enable tourists to exchange information about tourist attractions and services, thus influencing other tourists’ decisions about where to go and which services to choose [46,47,48,49,50]. Evidently, the BN monthly user-generated content about the South Baltic sites plays an important role and therefore should be utilized in the sustainable management strategies. The highest numbers of monthly mentions were found in Germany’s Schleswig-Holstein and Denmark’s Zealand Region, which have the highest concentration of Blue-Flag-awarded sites in the region.
Social media is perceived as a central platform for opinion formation, public participation, and triggering political and societal change [62,63]. The user-generated data provide a unique perspective as they are based on the voluntarily shared opinions of users. These data complement the local perspective obtained via the questionnaire survey. Therefore, social media data are of great value to social researchers and decision makers [64] in the context of sustainability.
The Bayesian approach application in stakeholder involvement has been broadly applied in the research [36,65,66] and expert judgment implied in the paradigm. However, different experiences result in different prior knowledge and different priors in the Bayesian Network model. Therefore, the Bayesian approach moderates the prior beliefs by the actual data and incorporates the information gaps [67].
As a tool for Environmental Risk Assessment, the Bayesian paradigm can synthesize different data types and account for the probabilities of different scenarios [33,68]. In addition, one of the significant benefits of the Bayesian approach is the ability to incorporate prior information [69,70] and extract qualitatively new knowledge from the available data with the help of machine learning techniques.
This study presents Benford’s law to be a valuable instrument for evaluating the accuracy of qualitative survey data and shows that the Bayesian Network framework can be used as a tool to support coastal management in focusing on sustainability and incorporating environmental/ecological, social, and economic aspects. Furthermore, it is helpful in modeling and analyzing the potential impact on future management scenarios.

5. Conclusions

Physical geographical factors and many other environmental/ecological factors are more affected by factors of the other two pillars of sustainability—the economy and society—than by the system itself.
The Bayesian approach provides valuable tools that have a wide range of applications and levels of difficulty. We are confident that it can be broadly applied in the advancement of sustainability research to understand human interactions with the environment, recognize, interpret, project, and model environmental change and its impacts, and provide a spatial perspective. By selecting the variables to use in this study, we found it evident that the prior knowledge associated with the long-term observation data is essential to collect and assess the available data and its comparability.
The main advantage of the tool is that it can be continuously used for decision making on sustainable management strategies that ensure the non-declining well-being of the coastal and urban population.
It is essential to move toward quantitative approaches and link all available scientific knowledge with physical geographical factors and their socioeconomic benefits, and these should be some of the priorities in efforts to understand the current knowledge status and identify future research directions. In addition, further research can be conducted in an effort to predict management decision outcomes by running further simulations.
The approach used in this work can be applied to the other sectors of the rapidly developing coastal areas of the entire Baltic Sea and similar water bodies, which can help decision makers select the most appropriate coastline stretches to adapt to recreation, thus avoiding confrontation between industry and citizens.
Rethinking our current efforts and evaluating whether they are sufficient for achieving environmental and sustainability targets in the South Baltic region are the next steps for this research team.
With the present study, we aimed to identify and substantiate significant physical geographical factors impacting the sustainability of South Baltic coastal resorts. With the help of Bayesian Network modeling, we identified that physical geographical factors such as location, beach type (sandy beaches and dunes), acceptable bathing water temperature, and air temperature play a significant role. We can also state that the significance of the sandy beaches and dunes is widely reflected in the planning documents at the regional level.
By applying the Bayesian approach, we can learn how effective the system is and how the different variables in the sustainability dimensions interact and make governance adjustments accordingly.

Author Contributions

Conceptualization, E.B. and R.P.; methodology, E.B., L.K.-R., and R.P.; formal analysis, E.B.; investigation, E.B.; data curation, E.B., I.Š., and V.K.; writing—original draft preparation, E.B.; writing—review and editing, E.B., L.K.-R., and R.P.; visualization, E.B., I.Š. and V.K.; supervision, R.P. and L.K.-R. All authors have read and agreed to the published version of the manuscript.

Funding

This research was partly funded by Baltic Research Programme (EEA Financial Mechanisms 2014–2021) project “Solutions to current and future problems on natural and constructed shorelines, eastern Baltic Sea” (EMP480).

Institutional Review Board Statement

Not applicable.

Informed Consent Statement

Not applicable.

Data Availability Statement

The data presented in this study are available on request from the corresponding author.

Conflicts of Interest

The authors declare no conflict of interest.

Appendix A

The Klaipėda survey (translation)
 
What is this research all about?
This research aims to understand whether Klaipeda residents visit beaches, what activities they enjoy doing, what they value and the benefits they enjoy.
The study is part of an independent study conducted by Klaipeda University.
 
Who will be involved?
The research study area is Klaipeda municipality, and the adjacent territory, so more than 350 respondents using the infrastructure of Klaipeda beaches will be interviewed.
 
What are your rights?
Participants are invited to contribute voluntarily to this study and further research. You are also free to withdraw from participating at any time. The information you provide is anonymous and will be treated as confidential. The data gained from this research will be stored at Klaipeda University, and data relating to your individual answers will not be shared with any other organizations. Once your answers are entered into data files, your personal details will not be linked to your answers. When the research based on this survey is published, all information will be presented in an aggregated form that does not identify individuals.
 
Q1. Do you visit the beach? *
Mark only one option.
Yes
No
 
If so, how many times a year? *_______________
 
When was the last time? (how many months/ days ago?) *_______________
 
Q2. Do you visit Klaipėda beaches during the offseason? *
Mark only one option.
Yes
No
 
Q3. How much time do you usually spend on the beach? (hours) *_______________
 
Q4. Do you take baths in the sea? *
Mark only one option.
Yes
No
 
At what water temperature do you start the bathing season? *_______________
 
What water temperature is most suitable for your bathing in the sea? *_______________
 
Q5. Which Klaipeda beach do you visit most often?
Mark all the suitable options.
During the Summer Holiday SeasonOffseason
Smiltynės ISmiltynės I
Smiltynės IISmiltynės II
Melnragės IMelnragės I
Melnragės IIMelnragės II
NeįgaliųjųNeįgaliųjų
GiruliųGirulių
Other:__________Other:__________
 
Q5.1. If you usually visit Other beach in Klaipeda, which one is it? _______________
 
Q6. What part of the beach do you visit most often? *
Mark only one option.
Common
Women’s
Men’s
Nudist
Handicap
Pet
Other: _______________
 
Q7. Which of the following activities do you practice during your time on the beach?
Mark all the suitable options.
During the Summer Holiday SeasonOffseason
SunbathingSunbathing
Bathing at the seaBathing at the sea
JoggingJogging
Taking walksTaking walks
Spending time in the recreational areas of the beach (volleyball/ football/ surfing/ kiting)Spending time in the recreational areas of the beach (volleyball/ football/ surfing/ kiting)
Wellness treatmentsWellness treatments
FishingFishing
Amber, seashell, stone pickingAmber, seashell, stone picking
ReadingReading
Other: ____________________Other: ____________________
 
The following questions are about your leisure in general (not only in Klaipeda):
 
Q8. How important are the following factors when choosing a location for your vacation? *
Mark only one option in each row.
Very importantImportantModerately importantSlightly importantNot important
Water quality
Beach quality
 
Q9. How important are the following factors when choosing a beach for your vacation? *
 
Mark only one option in each row.
Very importantImportantModerately importantSlightly importantNot important
Water transparency
High water temperature (18 °C)
Absence of bacterial contamination
Absence of micro-algae
Absence of jellyfish
Absence of dead fish
Absence of oil marks
Absence of seaweed
Absence of foam in the water\on the beach
Shallow slope
Absence of foreign odour
Crowding f the beach
Distance from the city
Beach infrastructure (WC,
changing rooms, lifeguards,
eateries, parking spaces)
 
The following questions are about the Baltic Sea and Klaipeda beaches:
 
Q10. How would you rate: *
Mark only one option in each row.
Extremely poorBelow averageAverageAbove averageExcellent
Water quality
Beach quality
 
Q11. Would you agree that the Baltic Sea bathing water condition improved over the last 5 years? *
Mark only one option.
Strongly agreeAgree UndecidedDisagreeStrongly disagree
 
Q12. Would you agree with the statement that the condition of Klaipeda beaches has improved in the last 5 years? *
Mark only one option in each row.
Strongly agreeAgree UndecidedDisagreeStrongly disagree
Smiltynės I
Smiltynės II
Melnragės I
Melnragės II
Neįgaliųjų
Girulių
Other
 
Q13. Where do you find information about:
Mark all the suitable options.
The Quality of Bathing Water in Your Place of LeisureAir and Water Temperature of the Klaipėda Beaches
From friends/relativesFrom friends/relatives
Tourist Information CenterTourist Information Center
At the Travel Agency/GuideBeach information boards Beach information boards
On the InternetOn the Internet
In the mobile appIn the mobile app
In Newspapers/TV/RadioIn Newspapers/TV/Radio
I’m not looking for such informationI’m not looking for such information
Other: _______________Other: _______________
 
Q14. If you use a mobile app, which one?
Mark all the suitable options.
Standard, available on mobile phone
meteo.lt
gismeteo
WindGuru
Weather Live
AccuWeather
Other: _______________
 
Q15. Where do you think other beaches/bathing places in the territory of Klaipeda municipality could be established? *
___________________________________________________________________________
_
 
The final questions are to ensure we have a good cross-section of the community.
 
Q16. How many years have you lived in Klaipeda? *_______________
 
Q17. You are? *
Mark only one option.
Male
Female
 
Q18. What is your age? *
 
Q19. How many people live in your household, including you? *
Preschool-age _______________
Young people (17 years or younger) _______________
Adults (18 years or older) _______________
 
Q20. Do you have a dog? *
Mark only one option.
Yes
No
 
If you have a dog, then please answer questions 21–23 as well.
 
Q21. Are you taking your dog (s) to the beach?
Mark only one option.
Yes
No
 
Q22. If yes, which beach?
Mark only one option.
Smiltynės I
Smiltynės II
Melnragės I
Melnragės II
Handicapt
Girulių
Other: _______________
 
Q23. Whether you take your dog (s) to the beach, do you choose a different beach than when you go without the dog (s)?
Mark only one option.
Yes
No
 
ALL INFORMATION PROVIDED BY YOU IS CONSIDERED CONFIDENTIAL
 
Q24. You are welcome to make extra comments or suggestions on any issue in the space below
 
Thank you for your time
 
Who do I contact for more information?
If you have any questions about the survey or the research project or any concerns, please contact the research leader.
dr. Loreta Kelpšitė-Rimkienė
Klaipėda University
 
Prof. dr. habil. Ramūnas Povilanskas
Klaipėda University
 
Eglė Baltranaitė
Klaipėda University
 
Research results will be available from Eglė after April 2020.
 

References

  1. Karnauskaitė, D.; Schernewski, G.; Støttrup, J.G.; Kataržytė, M. Indicator-Based Sustainability Assessment Tool to Support Coastal and Marine Management. Sustainability 2019, 11, 3175. [Google Scholar] [CrossRef] [Green Version]
  2. Schlacher, T.; Dugan, J.; Schoeman, D.S.; Lastra, M.; Jones, A.; Scapini, F.; McLachlan, A.; Defeo, O. Sandy beaches at the brink. Divers. Distrib. 2007, 13, 556–560. [Google Scholar] [CrossRef] [Green Version]
  3. Defeo, O.; McLachlan, A.; Schoeman, D.S.; Schlacher, T.; Dugan, J.; Jones, A.; Lastra, M.; Scapini, F. Threats to sandy beach ecosystems: A review. Estuar. Coast. Shelf Sci. 2009, 81, 1–12. [Google Scholar] [CrossRef]
  4. Yu, J.; Zhou, D.; Yu, M.; Yang, J.; Li, Y.; Guan, B.; Wang, X.; Zhan, C.; Wang, Z.; Qu, F. Environmental threats induced heavy ecological burdens on the coastal zone of the Bohai Sea, China. Sci. Total Environ. 2021, 765, 142694. [Google Scholar] [CrossRef]
  5. Ashworth, G.; Page, S. Urban tourism research: Recent progress and current paradoxes. Tour. Manag. 2011, 32, 1–15. [Google Scholar] [CrossRef]
  6. Gilek, M.; Karlsson, M.; Linke, S.; Smolarz, K. Environmental Governance of the Baltic Sea; Springer: Cham, Switzerland, 2016; ISBN 9783319270050. [Google Scholar]
  7. Schernewski, G.; Baltranaitė, E.; Katarzyte, M.; Balčiūnas, A.; Čerkasova, N.; Mėžinė, J. Establishing new bathing sites at the Curonian Lagoon coast: An ecological-social-economic assessment. J. Coast. Conserv. 2019, 23, 899–911. [Google Scholar] [CrossRef] [Green Version]
  8. Inácio, M.; Karnauskaitė, D.; Baltranaitė, E.; Kalinauskas, M.; Bogdzevič, K.; Gomes, E.; Pereira, P. Ecosystem services of the Baltic Sea: An assessment and mapping perspective. Geogr. Sustain. 2020, 1, 256–265. [Google Scholar] [CrossRef]
  9. HELCOM. State of the Baltic Sea-Second HELCOM Holistic Assessment, 2011–2016; HELCOM: Helsinki, Finland, 2018; Volume 155. [Google Scholar]
  10. Łabuz, T.A. Environmental Impacts—Coastal Erosion and Coastline Changes. In Second Assessment of Climate Change for the Baltic Sea Basin; Springer: Cham, Switzerland, 2015; pp. 381–396. [Google Scholar] [CrossRef] [Green Version]
  11. Pyć, D.; Stoll, F. SEAPLANSPACE General Knowledge Manual Marine Spatial Planning Instruments for Sustainable Marine Governance; SEAPLANSPACE: Gdańsk, Poland, 2021; ISBN 9788388445170. [Google Scholar]
  12. Baltranaitė, E.; Jurkus, E.; Povilanskas, R. Impact of physical geographical factors on sustainable planning of South Baltic seaside resorts. Baltica 2018, 30, 119–131. [Google Scholar] [CrossRef]
  13. Bagdanavičiūtė, I.; Kelpšaitė, L.; Soomere, T. Multi-criteria evaluation approach to coastal vulnerability index development in micro-tidal low-lying areas. Ocean Coast. Manag. 2015, 104, 124–135. [Google Scholar] [CrossRef]
  14. Bagdanavičiūtė, I.; Umgiesser, G.; Vaičiūtė, D.; Bresciani, M.; Kozlov, I.; Zaiko, A. GIS-based multi-criteria site selection for zebra mussel cultivation: Addressing end-of-pipe remediation of a eutrophic coastal lagoon ecosystem. Sci. Total Environ. 2018, 634, 990–1003. [Google Scholar] [CrossRef] [PubMed]
  15. Bagdanavičiūtė, I.; Kelpšaitė, L.; Daunys, D. Assessment of shoreline changes along the Lithuanian Baltic Sea coast during the period 1947–2010. Baltica 2012, 25, 171–184. [Google Scholar] [CrossRef] [Green Version]
  16. Kelpšaite, L.; Dailidiene, I. Influence of wind wave climate change on coastal processes in the eastern Baltic Sea. J. Coast. Res. 2011, 64, 220–224. [Google Scholar]
  17. Portal of Official Statistics. Available online: https://osp.stat.gov.lt (accessed on 10 May 2021).
  18. Port of Klaipeda. Available online: https://www.portofklaipeda.lt/about-the-port (accessed on 10 May 2021).
  19. Žilinskas, G.; Janušaitė, R.; Jarmalavičius, D.; Pupienis, D. The impact of Klaipėda Port entrance channel dredging on the dynamics of coastal zone, Lithuania. Oceanologia 2020, 62, 489–500. [Google Scholar] [CrossRef]
  20. Viška, M.; Soomere, P.D.T. Sediment Transport Patterns along the Eastern Coasts of the Baltic Sea. Ph.D. Thesis, Tallin University of Technology, Tallinn, Estonia, 2014. ISBN 978-9949-23-6398. [Google Scholar]
  21. Baltranaite, E.; Kelpsaite-Rimkiene, L.; Kondrat, V.; Sakurova, I.; Povilanskas, R. Klaipėda case of the Baltic Sea beaches: Perception, acceptance and perspectives. In Ocean Sciences Meeting 2020; AGU; Available online: https://agu.confex.com/agu/osm20/meetingapp.cgi/P (accessed on 10 May 2021).
  22. Urbonienė, R.; Kelpšaitė, L.; Borisenko, I. Vegetation impact on the dune stability and formation on the lithuanian coast of the baltic sea. J. Environ. Eng. Landsc. Manag. 2015, 23, 230–239. [Google Scholar] [CrossRef]
  23. Bitinas, A.; Žaromskis, R.; Gulbinskas, S.; Damušyte, A.; Žilinskas, G.; Jarmalavičius, D. The results of integrated investigations of the Lithuanian coast of the Baltic Sea: Geology, geomorphology, dynamics and human impact. Geol. Q. 2005, 49, 355–362. [Google Scholar]
  24. Jarmalavičius, D.; Satkunas, J.; Žilinskas, G.; Pupienis, D. Dynamics of beaches of the Lithuanian coast (the Baltic Sea) for the period 1993–2008 based on morphometric indicators. Environ. Earth Sci. 2011, 65, 1727–1736. [Google Scholar] [CrossRef]
  25. Klaipėda Municipality Site. Available online: http://www.klaipeda.lt (accessed on 10 May 2021).
  26. Trafimow, D. Philosophical or empirical incommensurability of frequentist versus Bayesian thinking. Econometrics 2021, 25, 25–48. [Google Scholar] [CrossRef]
  27. Reich, S.; Cotter, C. Probabilistic Forecasting and Bayesian Data Assimilation; Cambridge University Press: Cambridge, UK, 2015. [Google Scholar]
  28. Bayes, P. LII. An essay towards solving a problem in the doctrine of chances. By the late Rev. Mr. Bayes, FRS communicated by Mr. Price, in a letter to John Canton, AMFR S. Philos. Trans. R. Soc. Lond. 1763, 53, 370–418. [Google Scholar] [CrossRef]
  29. Turner, D.P.; Deng, H.; Houle, T.T. Bayesian Approaches to Statistical Inferences. Headache J. Head Face Pain 2020, 60, 1879–1885. [Google Scholar] [CrossRef] [PubMed]
  30. Van De Schoot, R.; Kaplan, D.; Denissen, J.; Asendorpf, J.B.; Neyer, F.J.; Van Aken, M.A. A Gentle Introduction to Bayesian Analysis: Applications to Developmental Research. Child Dev. 2014, 85, 842–860. [Google Scholar] [CrossRef]
  31. Kruschke, J.K. Bayesian Assessment of Null Values Via Parameter Estimation and Model Comparison. Perspect. Psychol. Sci. 2011, 6, 299–312. [Google Scholar] [CrossRef]
  32. Hoegh, A. Why Bayesian Ideas Should Be Introduced in the Statistics Curricula and How to Do So. J. Stat. Educ. 2020, 28, 222–228. [Google Scholar] [CrossRef]
  33. Li, M.; Hong, M.; Zhang, R. Improved Bayesian Network-Based Risk Model and Its Application in Disaster Risk Assessment. Int. J. Disaster Risk Sci. 2018, 9, 237–248. [Google Scholar] [CrossRef] [Green Version]
  34. Geurts, L. An overview of the B programming language or B without tears. ACM SIGPLAN Not. 1982, 17, 49–58. [Google Scholar] [CrossRef]
  35. Galán, C.O.; Matías, J.M.; Rivas, T.; Bastante, F.G. Reforestation planning using Bayesian networks. Environ. Model. Softw. 2009, 24, 1285–1292. [Google Scholar] [CrossRef]
  36. Richards, R.; Sanó, M.; Roiko, A.; Carter, R.; Bussey, M.; Matthews, J.; Smith, T. Bayesian belief modeling of climate change impacts for informing regional adaptation options. Environ. Model. Softw. 2013, 44, 113–121. [Google Scholar] [CrossRef] [Green Version]
  37. Arguez, A.; Vose, R.S. The Definition of the Standard WMO Climate Normal: The Key to Deriving Alternative Climate Normals. Bull. Am. Meteorol. Soc. 2011, 92, 699–704. [Google Scholar] [CrossRef]
  38. Povilanskas, R.; Riepšas, E.; Armaitienė, A.; Dučinskas, K.; Taminskas, J. Shifting dune types of the Curonian spit and factors of their development. Balt. For. 2011, 17, 215–226. [Google Scholar]
  39. Povilanskas, R.; Armaitienė, A. Seaside resort-hinterland Nexus: Palanga, Lithuania. Ann. Tour. Res. 2011, 38, 1156–1177. [Google Scholar] [CrossRef]
  40. Judge, G.; Schechter, L. Detecting Problems in Survey Data Using Benford’s Law. J. Hum. Resour. 2009, 44, 1–24. [Google Scholar] [CrossRef]
  41. Golbeck, J. Benford’s Law Applies to Online Social Networks. PLoS ONE 2015, 10, e0135169. [Google Scholar] [CrossRef]
  42. Kaiser, M. Benford’s law as an indicator of survey reliability—Can we trust our data? J. Econ. Surv. 2019, 33, 1602–1618. [Google Scholar] [CrossRef]
  43. Bowen, G.A. Document Analysis as a Qualitative Research Method. Qual. Res. J. 2009, 9, 27–40. [Google Scholar] [CrossRef] [Green Version]
  44. Gallarza, M.G.; Saura, I.G.; García, H.C. Destination Image towards a Conceptual Framework Martina. Acta Physiol. Hung. 1989, 73, 357–362. [Google Scholar]
  45. Kladou, S.; Mavragani, E. Assessing destination image: An online marketing approach and the case of TripAdvisor. J. Destin. Mark. Manag. 2015, 4, 187–193. [Google Scholar] [CrossRef] [Green Version]
  46. Ganzaroli, A.; De Noni, I.; van Baalen, P. Vicious advice: Analyzing the impact of TripAdvisor on the quality of restaurants as part of the cultural heritage of Venice. Tour. Manag. 2017, 61, 501–510. [Google Scholar] [CrossRef]
  47. Filieri, R.; Acikgoz, F.; Ndou, V.; Dwivedi, Y. Is TripAdvisor still relevant? The influence of review credibility, review usefulness, and ease of use on consumers’ continuance intention. Int. J. Contemp. Hosp. Manag. 2021, 33, 199–223. [Google Scholar] [CrossRef]
  48. Dickinger, A. The Trustworthiness of Online Channels for Experience- and Goal-Directed Search Tasks. J. Travel Res. 2010, 50, 378–391. [Google Scholar] [CrossRef]
  49. Fotis, J.; Buhalis, D.; Rossides, N. Social Media Use and Impact during the Holiday Travel Planning Process. Inf. Commun. Technol. Tour. 2012, 2012, 13–24. [Google Scholar] [CrossRef] [Green Version]
  50. Sparks, B.A.; Perkins, H.E.; Buckley, R. Online travel reviews as persuasive communication: The effects of content type, source, and certification logos on consumer behavior. Tour. Manag. 2013, 39, 1–9. [Google Scholar] [CrossRef] [Green Version]
  51. Higuchi, K. New Quantitative Text Analytical Method and KH Coder Software. Jpn. Sociol. Rev. 2017, 68, 334–350. [Google Scholar] [CrossRef] [Green Version]
  52. Elsner, J.B.; Niu, X.; Jagger, T.H. Detecting Shifts in Hurricane Rates Using a Markov Chain Monte Carlo Approach. J. Clim. 2004, 17, 2652–2666. [Google Scholar] [CrossRef]
  53. Rodionov, S. A Brief Overview of the Regime Shift Detection Methods. In Large-Scale Disturbances (Regime Shifts) and Recovery in Aquatic Ecosystems: Challenges for Management toward Sustainability; Unesco-Roste/BAS Workshop on Regime Shifts: Varna, Bulgaria, 2005; pp. 17–24. [Google Scholar]
  54. Chu, Z.; Wang, W.; Wang, B.; Zhuang, J. Research on Factors Influencing Municipal Household Solid Waste Separate Collection: Bayesian Belief Networks. Sustainability 2016, 8, 152. [Google Scholar] [CrossRef] [Green Version]
  55. Palmer, B.J.; Hill, T.R.; McGregor, G.K.; Paterson, A.W. An Assessment of Coastal Development and Land Use Change Using the DPSIR Framework: Case Studies from the Eastern Cape, South Africa. Coast. Manag. 2011, 39, 158–174. [Google Scholar] [CrossRef]
  56. García-Frapolli, E.; Ayala-Orozco, B.; Oliva, M.; Smith, R.J. Different Approaches Towards the Understanding of Socio-Environmental Conflicts in Protected Areas. Sustainability 2018, 10, 2240. [Google Scholar] [CrossRef] [Green Version]
  57. Dodds, R.; Holmes, M.R. Is Blue Flag certification a means of destination competitiveness? A Canadian context. Ocean Coast. Manag. 2020, 192, 105192. [Google Scholar] [CrossRef]
  58. Bernini, C.; Cerqua, A. Are eco-labels good for the local economy? Pap. Reg. Sci. 2020, 99, 645–661. [Google Scholar] [CrossRef]
  59. Kreilkamp, E.; von Bergner, N.M.; Mauser, C. Socio-economic Impacts—Recreation Edgar. In North Sea Region Climate Change Assessment; Springer: Cham, Switzerland, 2016; 528p. [Google Scholar] [CrossRef] [Green Version]
  60. Scott, D.; Gössling, S.; Hall, C.M. International tourism and climate change. Wiley Interdiscip. Rev. Clim. Chang. 2012, 3, 213–232. [Google Scholar] [CrossRef]
  61. Rutty, M.; Scott, D. Thermal range of coastal tourism resort microclimates. Tour. Geogr. 2014, 16, 346–363. [Google Scholar] [CrossRef]
  62. Boyd, D.; Golder, S.; Lotan, G. Tweet, Tweet, Retweet: Conversational Aspects of Retweeting on Twitter. In Proceedings of the 2010 43rd Hawaii International Conference on System Sciences, Kauai, HI, USA, 5–8 January 2010. [Google Scholar] [CrossRef] [Green Version]
  63. Shirky, C. The political power of social media: Technology, the public sphere, and political change. Foreign Aff. 2011, 90, 28–41. [Google Scholar]
  64. Lazer, D.; Pentland, A.; Adamic, L.; Aral, S.; Barabási, A.; Brewer, D.; Christakis, N.; Contractor, N.; Fowler, J.; Gutmann, M.; et al. Computational Social Science. Science 2009, 323, 721–724. [Google Scholar] [CrossRef] [Green Version]
  65. Vasudev, D.; Goswami, V. A Bayesian hierarchical approach to quantifying stakeholder attitudes toward conservation in the presence of reporting error. Conserv. Biol. 2020, 34, 515–526. [Google Scholar] [CrossRef] [PubMed]
  66. Yu, T.; Man, Q.; Wang, Y.; Shen, G.Q.; Hong, J.; Zhang, J.; Zhong, J. Evaluating different stakeholder impacts on the occurrence of quality defects in offsite construction projects: A Bayesian-network-based model. J. Clean. Prod. 2019, 241, 118390. [Google Scholar] [CrossRef]
  67. Kaplan, D.; Depaoli, S. Bayesian statistical methods. In Oxford Library of Psychology. The Oxford Handbook of Quantitative Methods; Little, T.D., Ed.; Oxford University Press: Oxford, UK, 2013; Volume 1. [Google Scholar]
  68. Kaikkonen, L.; Parviainen, T.; Rahikainen, M.; Uusitalo, L.; Lehikoinen, A. Bayesian Networks in Environmental Risk Assessment: A Review. Integr. Environ. Assess. Manag. 2021, 17, 62–78. [Google Scholar] [CrossRef]
  69. Walters, C.; Ludwig, D. Calculation of Bayes Posterior Probability Distributions for Key Population Parameters. Can. J. Fish. Aquat. Sci. 1994, 51, 713–722. [Google Scholar] [CrossRef]
  70. Adkison, M.D.; Peterman, R.M. Results of Bayesian methods depend on details of implementation: An example of estimating salmon escapement goals. Fish. Res. 1996, 25, 155–170. [Google Scholar] [CrossRef]
Figure 1. (a) Study area: the South Baltic Region (© E. Jurkus [12]); (b) case study site: Klaipėda, Lithuania (© I. Šakurova).
Sustainability 13 07173 g001
Figure 2. Klaipėda beaches: (a) Melnragės II (© I. Šakurova); (b) Girulių (© E. Baltranaitė); (c) Smiltynės I (© E. Baltranaitė); (d) Smiltynės II (© V. Kondrat).
Sustainability 13 07173 g002
Figure 3. Bayesian Network conceptual model for factors influencing sustainability.
Sustainability 13 07173 g003
Figure 4. Initial distribution of leading digits.
Sustainability 13 07173 g004
Figure 5. Bayesian Networks. Conditional probabilities of a set of variables in every dimension of sustainability. TAN (Tree Augmented Naïve Bayes Network) structure: (a) South Baltic data, (b) Klaipėda survey, and (c) hydrometeorological data; Markov Blanket structure: (d) South Baltic data, (e) Klaipėda survey, (f) hydrometeorological data.
Sustainability 13 07173 g005aSustainability 13 07173 g005b
Table 1. Klaipėda municipality beaches.
Beaches and BoundariesLength, m
NorthMelnragės I, Melnragės II, Handicapped and Girulių beaches4420
SouthSmiltynės I and Smiltynės II beaches3400
Total:7820
Table 2. Variables used in the Bayesian Network. Klaipėda.
VariablesData SourceTime Scale
Air temperature, °CMarine Environment Assessment Division of the Environmental Protection Agency (EPA)
Lithuanian Hydrometeorological Service under the Ministry of Environment
Palanga Aviation Meteorological Station
The National Oceanic and Atmospheric Administration
1960–2019
Atmospheric pressure, mm1960–2019
Wind direction, degrees1961–2019
Mean wind speed, m/s1961–2019
Wave direction, degrees1961–2019
Mean wave height, m1961–2019
Water temperature, °C1991–2019
Klaipėda surveyResidents survey data2020
Table 3. Variables used in the Bayesian Network. South Baltic seaside.
VariablesData SourceTime Scale
Planning, management, development documentsLocal government entities2017
Dominant seaside featuresHELCOM map and data service2017
Protected areasHELCOM map and data service2017
UNESCO World Heritage sites and Biosphere reserveswhc.unesco.org2017
Number of monthly mentions—user-generated contentInstagram API2019–2020
Sentiment ratio—emotion symbolsInstagram API2019–2020
Blue flag sitesblueflag.global2021
Table 4. Leading digit distribution in survey data. Benford’s law.
Leading DigitCOUNTActual DistributionBenford’s LawCumulative Difference
136440.4180.30100.1168
220970.2400.17610.0644
315770.1810.12490.0559
47270.0830.0969−0.0135
55100.0580.0792−0.0207
6690.0080.0669-0.0590
7570.0070.0580−0.0515
8400.0050.0512−0.0466
900.0000.0458−0.0458
Total87211.000
Here COUNT—the number of numerical values with the certain leading number; Actual Distribution of the leading number in the data set; Benford’s law—leading number distribution following Benford’s law; Cumulative Difference—the difference between Benford’s law and Actual Distribution columns.
Publisher’s Note: MDPI stays neutral with regard to jurisdictional claims in published maps and institutional affiliations.

