
The Coupling between Urban Expansion and Population Growth: An Analysis of Urban Agglomerations in China (2005–2020)

School of Geography and Remote Sensing, Guangzhou University, Guangzhou 510006, China
*
Author to whom correspondence should be addressed.
Sustainability 2021, 13(13), 7250; https://0-doi-org.brum.beds.ac.uk/10.3390/su13137250
Submission received: 28 April 2021
/
Revised: 12 June 2021
/
Accepted: 25 June 2021
/
Published: 29 June 2021
Abstract
:Exploring the coordinated development process of people–land allocation in the urbanization process of urban agglomerations is of great significance to promote improvement of the urbanization development level and quality and realize the healthy development of urbanization. We took nine urban agglomerations in China as the research object and the coupling between urban expansion and population growth as the entry point. The overall coupling and the spatial coupling were used to reveal the people–land coupling relationship of nine urban agglomerations at different time periods. We found that both construction land and population within each urban agglomeration were in the stage of continuous growth, and the increase of both was similar and synchronous. The overall and spatial coupling between urban expansion and population growth is increasing. The expansion rate of construction land is a factor that influences the overall and spatial coupling between urban expansion and population growth, i.e., the greater the expansion rate of construction land, the higher the overall and spatial coupling between urban expansion and population growth. This study provides a new perspective for exploring the coupling between urban expansion and population growth and offers a new approach for studying the relationship between the two.
1. Introduction
The development of cities is reflected not only in accelerated urbanization and rapid economic growth, but also in urban expansion and growth of urban population [1,2]. Urbanization is a driving factor for urban expansion and also contributes to rapid growth of urban population [3,4]. With the booming economic activities within cities, more people are attracted and concentrated there [5]. In addition, the strong demand for land resources by population and economic activity inevitably lead to urban expansion [6,7]. Therefore, the process of urbanization is also a development process of population urbanization [8]. However, there are problems of uncontrolled spatial expansion, disorderly expansion of land use, and an increasing tension between the people and the land in the urbanization process [9,10,11]. This has also led to problems in the people–land relations and a tendency to spread and develop in cities [12,13,14]. Therefore, the study of urban expansion and population growth is very important for the healthy development of urbanization.
The causes of urban expansion and population growth have been extensively explored separately. Economic development and urbanization are considered to be the driving factors of urban expansion [6,15]. Natural resources and urbanization are considered to be important factors of population growth [16,17]. Moreover, studies that explore the relationship between urban expansion and population growth or that combine urban expansion and population growth are also a hot topic of research [18]. At present, studies on urban expansion and population growth have focused on the drivers of urban land expansion, i.e., on the population as an important driver of land expansion [19,20]. There are also studies on the interrelationship between urban land expansion and urban population which empirically investigate the anisotropic growth relationship between urban population growth and urban land use by constructing a model [21,22], as well as a study on the coordinated matching, influencing factors, and coordinated development strategies between population urbanization and land urbanization from the perspective of urbanization [23,24].
However, the existing studies focused more on the driving force of population growth on urban land expansion [25], the validation of the model of heterogeneous growth of urban population and the land [21], and the spatial pattern of coordinated development of population and land urbanization [26]. That is, they mainly considered population as an important driver of urban expansion or treated urban expansion and population growth as two aspects, separating the two, and did not fully integrate urban land expansion with urban population growth. These studies paid less attention to the dynamics of the coupling between land expansion and population growth in the urbanization process and the driving mechanisms that cause changes in the coupling between the two. However, exploring the coupling between urban expansion and population growth is the way to more effectively reveal the people–land coupling relationship and the problems in the urban development process. Therefore, it is important to understand the coupling between urban expansion and population growth.
Urban agglomerations are areas of rapid urbanization and hotspots of dramatic urban land changes and rapid population accumulation [27,28,29]. In other words, urban agglomerations are the most important and typical regions for urban expansion and population growth. Unlike individual cities, urban agglomerations are formed by the combination of several cities. Moreover, each urban agglomeration has its own characteristics and is the best developed area within each region. Therefore, urban agglomerations are suitable study areas to explore the coupling between urban expansion and population growth. It is important to explore the coordinated development process, the spatial pattern, and the driving mechanism of people–land allocation in the urbanization process of urban agglomerations in order to promote the urbanization construction of urban agglomerations and improvement of the urbanization development level and quality, as well as to realize the healthy development of urbanization.
In this study, we took nine urban agglomerations in China as the research object and the coupling between urban expansion and population growth as the entry point. The overall coupling and the spatial coupling were used to reveal the people–land coupling relationship of nine urban agglomerations in China at different time periods. Specifically, the objectives of this study were to (1) investigate the spatial and temporal processes of urban expansion and population growth within urban agglomerations; (2) explore the overall coupling between urban expansion and population growth within urban agglomerations; and (3) explore the spatial coupling between urban expansion and population growth within urban agglomerations. This study can provide a reference basis for formulating reasonable land policies and population control policies, coordinating the rational allocation of regional land resources, promoting the coordinated development of people and the land, and realizing the healthy development of urbanization.
2. Materials and Methods
2.1. Study Areas
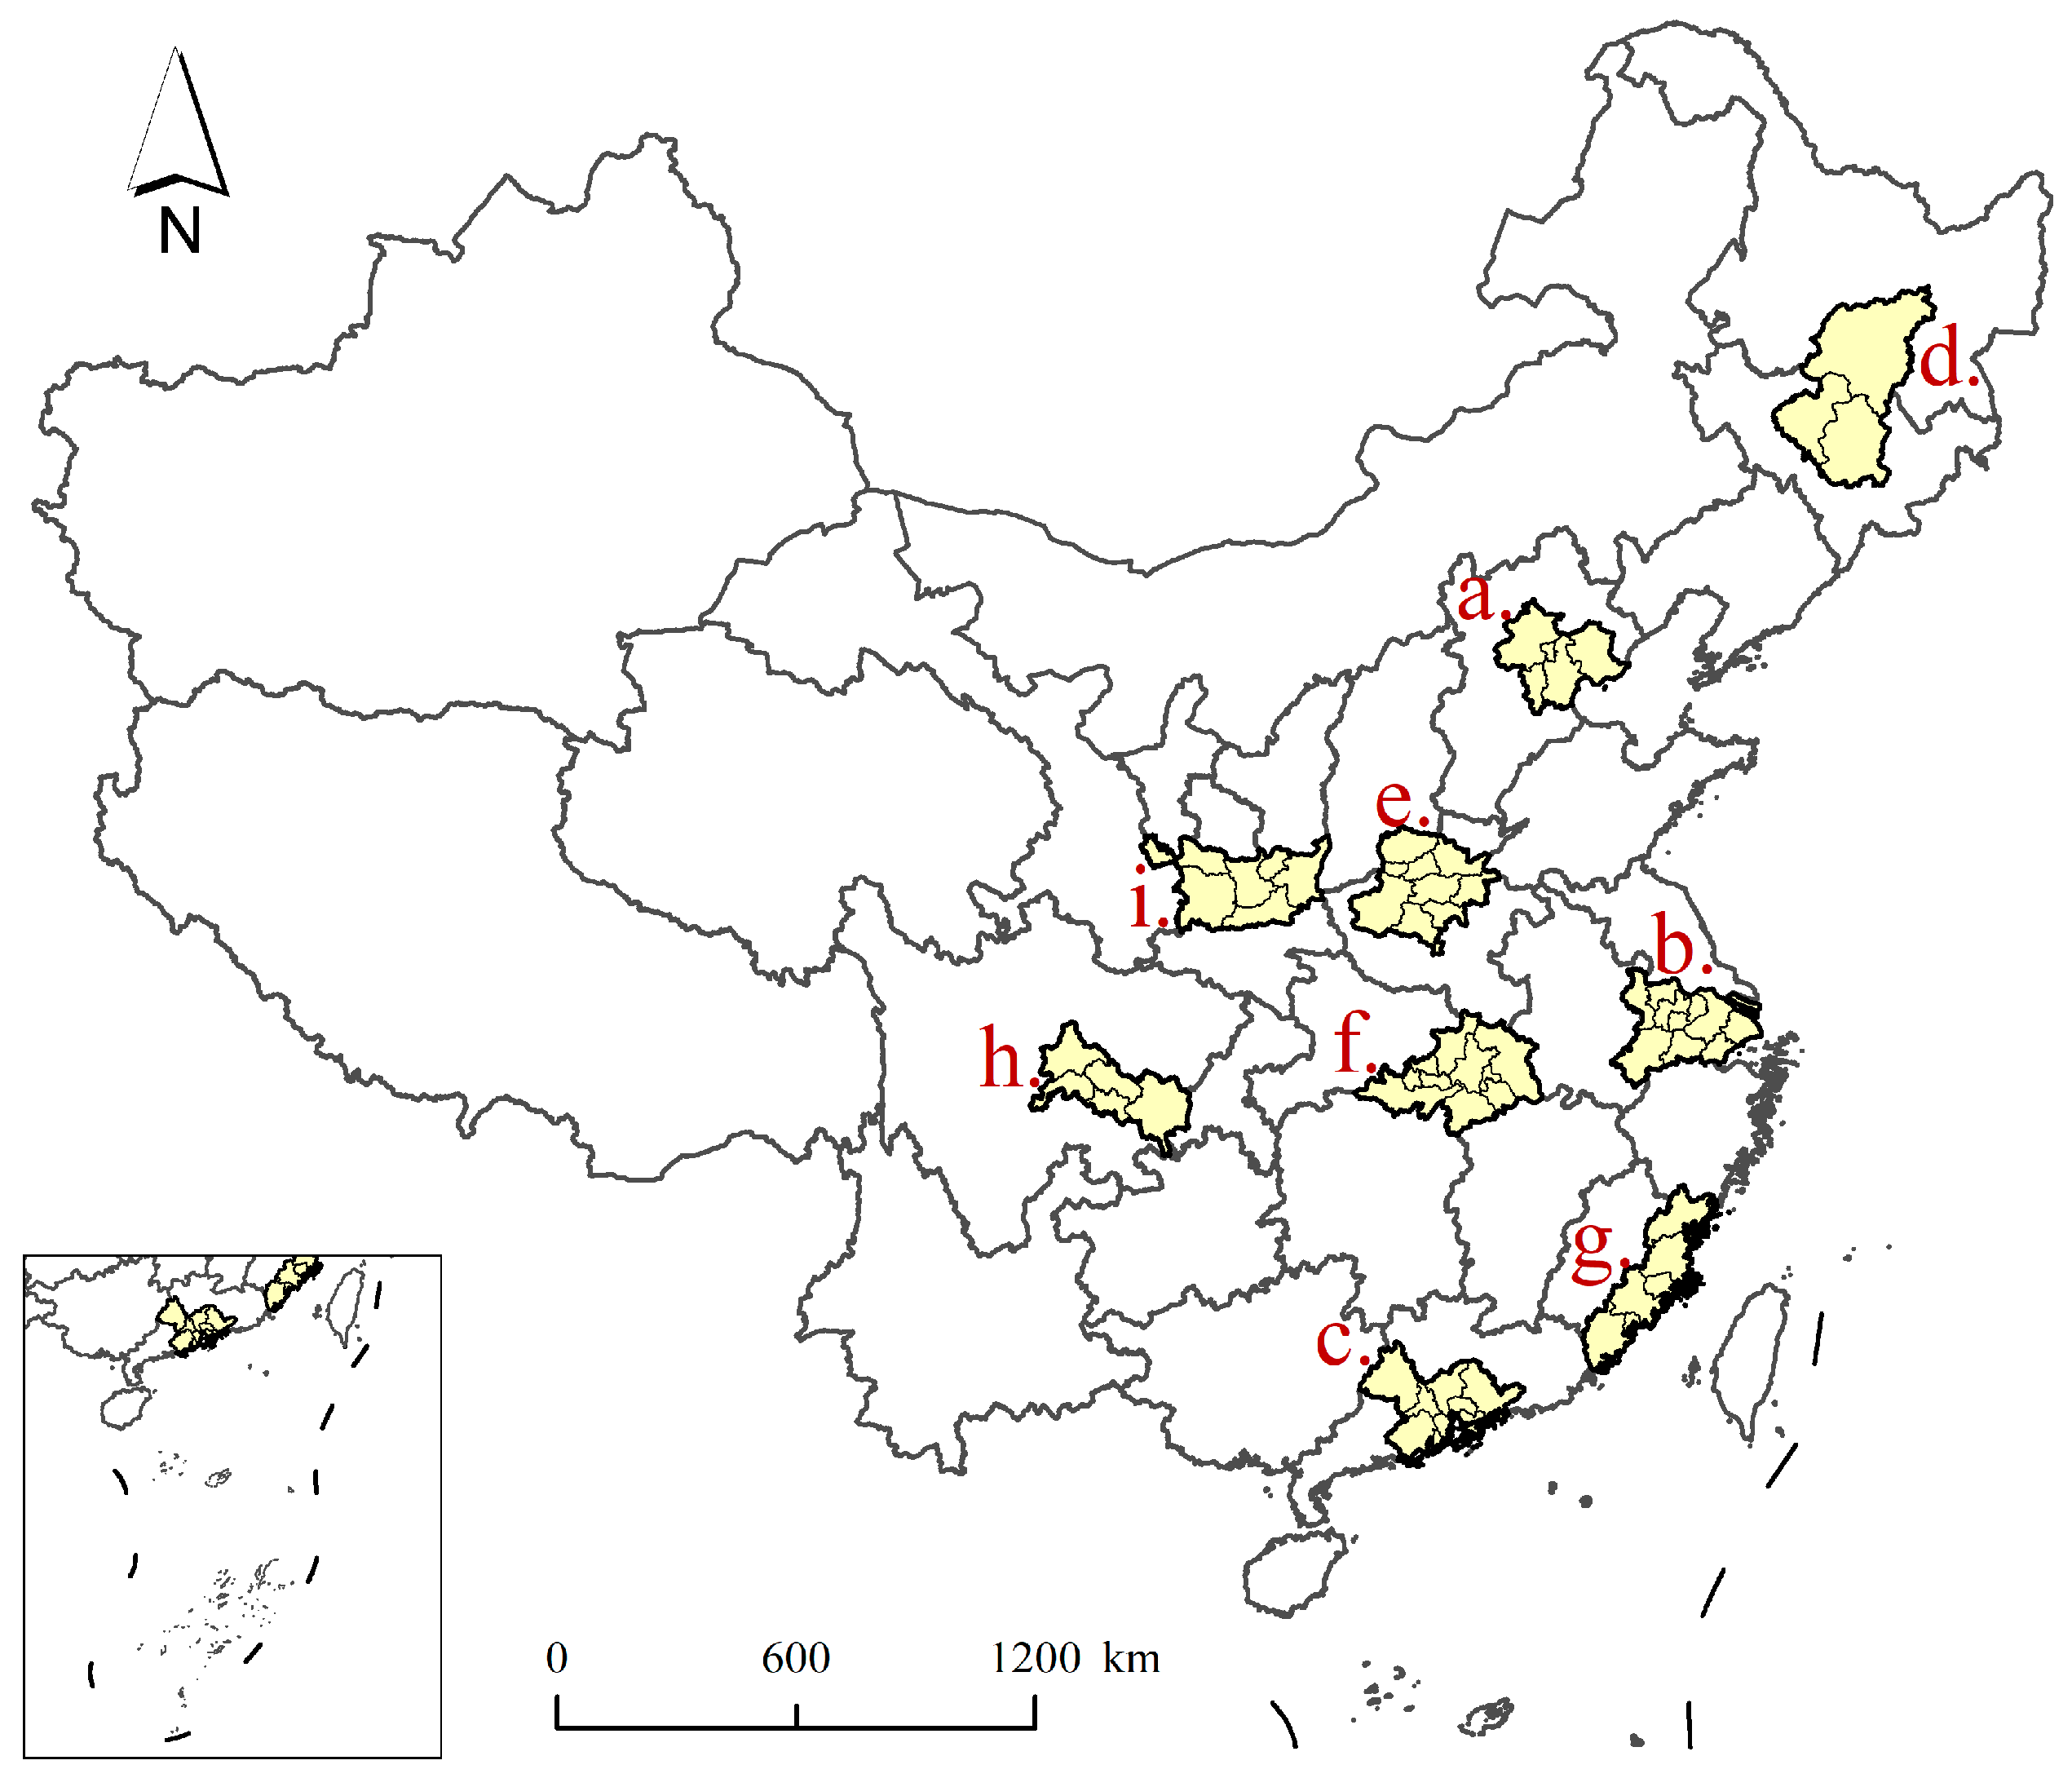
Nine urban agglomerations in China were selected as the study areas (Figure 1). These nine urban agglomerations are located in various regions in China.
Four are located in the coastal region: Beijing–Tianjin–Tangshan (BTT), Yangtze River Delta (YRD), Pearl River Delta (PRD), and West Side of the Straits (WSS); BTT is over 48,000 km2 and includes parts of the cities of Hebei, Beijing, and Tianjin; YRD includes parts of Shanghai, Zhejiang, Jiangsu, and Anhui, covering an area of over 57,000 km2; PRD is located in the Guangdong Province and covers an area of over 55,000 km2; WSS is over 54,000 km2 and is located on the eastern coast of Fujian. One is in the northeast region: Harbin–Changchun–Jilin (HCJ) (includes parts of Jilin and Heilongjiang, covering an area of over 100,000 km2). Two are in the central region: Central Plains (CP) and Triangle of Central China (TCC); CP includes parts of Henan and Shanxi, covering an area of over 65,000 km2; TCC is located in the Hubei Province, covering an area of over 72,000 km2. Two are in the western region: Chengdu–Chongqing (CC) and Guanzhong Plain (GP); CC includes parts of Sichuan and Chongqing and covers an area of over 51,000 km2; GP is over 66,000 km2, including parts of Gansu and Ningxia.
These nine urban agglomerations are all areas with high levels of urbanization. Moreover, the urban population of these urban agglomerations has increased significantly in the last two decades, and significant urban expansion has occurred.
2.2. Data Sources and Preprocessing
The data we used include land cover data and population data. Land cover data were obtained from the Resource and Environmental Science Data Center (http://www.resdc.cn (accessed on 15 February 2021)). These land cover data include six primary land types, such as arable land, forest land, grassland, water, and construction land, and 25 secondary types (further classification of the primary types). The type classification of these land cover data follows the classification standard set by the Ministry of Housing and Urban–Rural Development of China. These land cover data have high accuracy and are widely used in various studies [30,31,32]. We characterized urban expansion using changes in construction land (including residential, commercial, public service, and industrial land (secondary types in the land cover data)). Therefore, we extracted the construction land within the nine urban agglomerations from the land cover dataset, specifically for the years 2005, 2010, 2015, and 2020.
We used Worldpop (https://www.worldpop.org (accessed on 15 February 2021)) for the population data. Worldpop is a dataset characterizing population density with a spatial resolution of 1 km [33,34]. High accuracy and the huge coverage area make Worldpop widely used in various population studies [35,36,37]. Worldpop data for the nine urban agglomerations were extracted, i.e., the population density data for 2005, 2010, 2015, and 2020. We calculated population growth by comparing changes in Worldpop in the study areas over a long time series.
2.3. Overall Coupling Model
We used the barycenter model to calculate the overall coupling between urban expansion and population growth. The barycenter is the geometric center of an element in space. The shift of the barycenter reflects the change in the spatial distribution of the elements [38,39]. The calculation of the construction land’s barycenter and the population’s barycenter was based on the construction land data and the population data within the grids. We selected 10 km × 10 km grids as the evaluation units, referring to the size of the grid used in previous studies of Chinese urban agglomerations [30]. Each urban agglomeration was considered separately as a whole and was divided into several 10 km × 10 km grids.
For the spatially separated construction land’s and population’s barycenters, the spatial distance between the two was used to measure the overall coupling between urban expansion and population growth. Specifically, the smaller the spatial distance between the construction land’s barycenter and the population’s barycenter, the better the overall coupling between urban expansion and population growth [40]. The formulae for calculating the construction land’s and population’s barycenters are as follows [30,41,42]:
whereand denote the coordinates of the construction land’s barycenter and the population’s barycenter, respectively. and are the areas of the construction land and the population in grid , respectively. refers to the coordinates of the geometric center of grid.
The formula for calculating the spatial distance between the construction land’s barycenter and the population’s barycenter () is as follows [27,38,39]:
where represents the spatial distance between the construction land’s barycenter and the population’s barycenter. and are the -axis and the -axis of the coordinates of the construction land’s barycenter, respectively. and are the -axis and the -axis of the coordinates of the population’s barycenter, respectively.
2.4. Spatial Coupling Model
We used the elasticity coefficient to measure the spatial coupling between urban expansion and population growth. The elasticity coefficient is the ratio of the growth rates of two types of factors [43]. However, the traditional elasticity coefficient only characterizes the relationship between the growth rates of two types of factors, but does not effectively reflect the relationship between urban expansion and population growth. Therefore, in this study, we used the coordination coefficient modified by the traditional elasticity coefficient to analyze the degree of spatial coupling and the spatial coupling process of two types of factors. Using the coordination coefficient, the spatial coupling between urban expansion and population growth can be effectively quantified [44]. The formula for the coordination coefficient is as follows [30,45,46]:
where is the coordination coefficient (i.e., the spatial coupling between urban expansion and population growth). and are the average annual growth rates of the construction land and the population in grid , respectively. The value range of is 0–1. The spatial coupling between urban expansion and population growth is strongest when and are the same. The spatial coupling between urban expansion and population growth is weakest when and are opposite numbers. In addition, we classified the types of spatial coupling between urban expansion and population growth into five categories based on (Table 1).
3. Results
3.1. Quantifying Urban Expansion and Population Growth
We obtained the construction land and population data of nine urban agglomerations in China for 2005, 2010, 2015, and 2020 (Table 2). In addition, we visualized the changes in the construction land (Figure 2) and the population (Figure 3) of the nine urban agglomerations, respectively.
From 2005 to 2020, all the nine urban agglomerations experienced continuous urban expansion, and the area of the construction land within the urban agglomerations expanded. However, the changes of the construction land within each urban agglomeration varied, and the expansion area of the construction land within the same urban agglomeration varied in different periods. Urban expansion within BTT was relatively significant, with the most significant expansion of its construction land from 2005 to 2010 and the largest construction land area among the nine urban agglomerations. YRD had the most construction land expansion among the nine urban agglomerations between 2005 and 2020. Moreover, in 2015, it surpassed BTT to have the largest construction land area among the nine urban agglomerations. The increase in the construction land area in PRD remained stable in each time period, and a more significant urban expansion occurred. No significant urban expansion occurred in HCJ, and the construction land area remained stable in each time period, and the area increase was smaller. Urban expansion of CP was not as significant as that of the three major urban agglomerations in China (BTT, YRD, and PRD), but the construction land area increased considerably in each period. The urban expansion that occurred in WSS and CC was also significant in each period. The construction land within GP increased more between 2015 and 2020, but the overall urban expansion between 2005 and 2020 was less significant.
Overall, the construction land area within the nine urban agglomerations in China continued to increase from 2005 to 2020, but the magnitude of construction land expansion within the urban agglomerations varied. Among them, the increase in the construction land within BTT, YRD, PRD, and WSS was more pronounced. In HCJ and GP in northeast and western China, the expansion of the construction land was more stable.
The population within China’s nine urban agglomerations was also in the process of increasing from 2005 to 2020. Among them, the population growth was the most significant within the three major urban agglomerations in China (BTT, YRD, and PRD), and the population growth trends were similar among these three urban agglomerations. YRD has the largest population among the nine urban agglomerations, while PRD and BTT have the second and third largest populations among the nine urban agglomerations, respectively. The population in HCJ kept growing from 2005 to 2020, but the population growth was smaller and more stable. The population in CP grew year by year, and its population growth rate was higher than that of HCJ, but lower than that of the three major urban agglomerations in China. The population in TCC grew more slowly, with almost no significant population growth from 2005 to 2020. The population within WSS increased year by year, and the population growth trend was more significant. The population within CC grew less between 2005 and 2015 but had a more significant growth trend from 2015 to 2020. The population within GP maintained a trend of increasing year by year, but the overall growth rate was smaller.
Overall, the population of the nine urban agglomerations grew between 2005 and 2020, but the magnitude of population growth varied widely among the urban agglomerations. They can be divided into urban agglomerations with rapid population growth, represented by BTT, YRD, and PRD, and urban agglomerations with slow population growth, represented by TCC and GP.
From 2005 to 2020, the construction land area and population of the nine urban agglomerations in China were continuously increasing. However, there were differences in the magnitude of urban expansion and population growth in each urban agglomeration. In some urban agglomerations, the construction land area and population increased year by year, and the growth rate was large. In contrast, urban expansion and population growth in some urban agglomerations were smaller between 2005 and 2020, and the increase in the construction land area and population was not significant. In addition, the trends of the changes in the construction land area and population within the nine urban agglomerations were similar within the same period, i.e., they were all in the stage of continuous growth. Moreover, the rates of construction land expansion and population growth within each urban agglomeration were similar and synchronous.
3.2. Overall Coupling between Urban Expansion and Population Growth
We used the barycenter model to calculate the construction land’s and population’s barycenters for nine urban agglomerations in China in 2005, 2010, 2015, and 2020. Moreover, we visualized the trajectory of the construction land’s barycenter and the population’s barycenter for each of the nine urban agglomerations from 2005 to 2020 (Figure 4 and Figure 5). To understand the overall coupling between urban expansion and population growth in each urban agglomeration, we calculated the spatial distance between the construction land’s barycenter and the population’s barycenter for each urban agglomeration using the coordinates of the construction land’s barycenter and the population’s barycenter for each urban agglomeration in each period (Table 3).
From 2005 to 2020, there were significant changes in the spatial location of the construction land’s and population’s barycenters in each urban agglomeration. The construction land’s barycenter in BTT generally moved from east to west, where it moved the largest distance from 2005 to 2010, and the direction of movement shifted from 2010 to 2015. The population’s barycenter in BTT generally moved from northwest to southeast. The construction land’s barycenter in YRD generally moved from the northwest to the southeast direction, but the direction of movement shifted several times, and the distance of movement was the largest between 2005 and 2010. The population’s barycenter in YRD generally moved from east to west. The construction land’s barycenter in PRD generally moved from southwest to northeast, but the direction of movement shifted once between 2010 and 2015, and the distance of movement between 2005 and 2010 was the largest. The population’s barycenter in PRD generally shifted from northwest to southeast.
The construction land’s barycenter in HCJ generally moved from northeast to southwest, where it moved the largest distance from 2015 to 2020, and the shift in the direction of movement occurred from 2010 to 2015. The population’s barycenter in HCJ generally moved from northeast to southwest. The construction land’s barycenter in CP generally moved from the southeast to the northwest direction, but the direction of movement underwent several changes, and the distance of movement was the largest in 2005–2010 and in 2015–2020. The population’s barycenter in CP generally shifted from southwest to northeast. The construction land’s barycenter in TCC generally moved from southwest to northeast, but the direction of movement shifted several times, and the distance of movement was the largest between 2015 and 2020. The population’s barycenter in TCC generally moved from northeast to southwest.
The construction land’s barycenter in WSS generally moved from southeast to northwest, but the direction of movement shifted several times, and it moved the largest distance from 2015 to 2020. The population’s barycenter of WSS generally moved from northeast to southwest. The construction land’s barycenter in CC moved from northwest to southeast in general, while the shift in the direction of movement occurred from 2005 to 2010, and the distance of movement was the largest between 2015 and 2020. The population’s barycenter in CC generally shifted from southeast to northwest. The construction land’s barycenter in GP generally moved from northwest to southeast, but the direction of movement shifted once between 2010 and 2015, and the distance of movement was the largest between 2005 and 2010. The population’s barycenter in GP generally moved from southeast to northwest.
From 2005 to 2020, the construction land’s barycenter and the population’s barycenter of the nine urban agglomerations were spatially close to each other, and the overall coupling between urban expansion and population growth of each urban agglomeration was increasing, but there were also significant differences between the urban agglomerations. The distance between the construction land’s barycenter and the population’s barycenter in BTT decreased from 29.43 km to 19.03 km, most significantly between 2005 and 2010. The distance between the construction land’s barycenter and the population’s barycenter in YRD decreased from 29.53 km to 13.80 km; it decreased by more than 10 km between 2005 and 2010 and did not change significantly between 2010 and 2015. The distance between the construction land’s barycenter and the population’s barycenter in PRD decreased from 5.38 km to 3.33 km; it decreased by more than 2 km between 2005 and 2010 but increased slightly between 2010 and 2020.
The distance between the construction land’s barycenter and the population’s barycenter in HCJ decreased from 21.89 km to 17.09 km; it remained relatively stable, with a small decrease. The distance between the construction land’s barycenter and the population’s barycenter in CP decreased from 15.35 km to 13.53 km, most obviously between 2015 and 2020 and less so in the other periods. The distance between the construction land’s barycenter and the population’s barycenter in TCC decreased from 21.19 km to 14.26 km, most significantly in the periods of 2005–2010 and 2015–2020.
The distance between the construction land’s barycenter and the population’s barycenter in WSS decreased from 39.73 km to 27.86 km, most significantly between 2015 and 2020. The distance between the construction land’s barycenter and the population’s barycenter in CC decreased significantly, from 64.42 km to 11.22 km, and shortened by more than 20 km between 2015 and 2020. The distance between the construction land’s barycenter and the population’s barycenter in GP decreased from 8.21 km to 6.23 km; it remained relatively stable, with a smaller decrease.
From 2005 to 2020, the spatial distance between the construction land’s barycenter and the population’s barycenter in the nine urban agglomerations was decreasing as both the construction land’s barycenter and the population’s barycenter moved closer together in the process of construction land expansion and population growth. Although there were differences in the distance between the construction land’s barycenter and the population’s barycenter within the nine urban agglomerations, the overall decreasing spatial distance between them indicates that the overall coupling between urban expansion and population growth was increasing in the nine urban agglomerations.
3.3. Spatial Coupling between Urban Expansion and Population Growth
We applied the spatial coupling model (the coordination coefficient modified by the traditional elasticity coefficient), used 10 km × 10 km grids of each urban agglomeration as the evaluation units, and calculated the coefficient reflecting the spatial coupling between construction land expansion and population growth in each grid. The spatial coupling between urban expansion and population growth within the grid of each urban agglomeration was classified into five categories (very strong, strong, moderate, weak, and very weak) based on the value of this coefficient in each grid. We visualized the distribution of spatial coupling categories between urban expansion and population growth within the grids for each urban agglomeration in different periods (Figure 6). Moreover, we calculated the number and proportion of different spatial coupling categories of grids within each urban agglomeration from 2005 to 2020 (Table 4).
The grids of different categories of spatial coupling between urban expansion and population growth, “very strong” (VSC grids), “strong” (SC grids), “moderate” (MC grids), “weak” (WC grids), and “very weak” (VWC grids), were distributed within each urban agglomeration. The distribution of each category of grids varied considerably within each urban agglomeration. However, a large number of MC, SC, and VSC grids were generally distributed in each urban agglomeration and accounted for a high proportion of the total grids in each urban agglomeration.
The distribution of MC, SC, and VSC grids within BTT were increasing. The distribution of SC and VSC grids in the BTT’s center was expanding, and the MC grids in southeast and northwest BTT were gradually being replaced by SC and VSC grids. Most of the grids in YRD were MC, SC, and VSC grids. The scope of SC and VSC grids in the northern part of YRD was expanding, and the former MC grids in the southeastern region were transforming into SC and VSC grids, while many MC grids continued to exist in the southwestern part of YRD. MC, SC, and VSC grids were the main grids in PRD. The original MC grid in the central part of PRD was gradually being replaced by SC and VSC grids, and a cluster of SC and VSC grids was being formed in the central part of PRD, while the number of MC grids in PRD was decreasing.
The distribution of MC, SC, and VSC grids within HCJ was increasing. The distribution of SC grids and VSC grids in the eastern part of HCJ was further expanding, and the MC grids in the southern and central parts of HCJ were being gradually replaced by SC and VSC grids. Most of the grids in CP were MC, SC, and VSC grids. The extent of SC and VSC grids in the central and southern parts of CP was further expanding, and the former MC grids in the western part of CP were partially transforming into SC and VSC grids, while many MC grids continued to exist in the southwestern and northwestern parts of CP. MC, SC, and VSC grids were the main grids in TCC. However, clusters of MC grids were being formed in the central and northern parts of TCC.
The distribution of MC, SC, and VSC grids within WSS was increasing. The distribution of SC and VSC grids in the southern part of WSS was further expanding, and the MC grids in the southeastern and eastern parts of WSS were gradually being replaced by SC and VSC grids. Most of the grids in CC were MC, SC, and VSC grids. The scope of SC and VSC grids in the western part of CC was further expanding, and some of the original MC grids in the central region were also being transformed into SC and VSC grids, while many MC grids continued to exist in the eastern part of CC. MC, SC, and VSC grids were the main grids in GP. In the central part of GP, there are clusters of SC and VSC grids.
Overall, from 2005 to 2020, the grids within each urban agglomeration were dominated by MC, SC, and VSC grids. In addition, the number and proportion of VSC grids within the urban agglomerations continued to increase in general with time. Although the proportion of different spatial coupling categories of grids within each urban agglomeration varied. However, in general, the number of VSC grids was increasing and their extent was expanding. There was a consistency in the trend between construction land expansion and population growth in the grids of each urban agglomeration that occurred between 2005 and 2020. The changes in coordination coefficients within the grids reflected the increasing spatial coupling between urban expansion and population growth within each urban agglomeration.
4. Discussion
From 2005 to 2020, the spatial distance between the construction land’s barycenter and the population’s barycenter of the nine urban agglomerations in China was decreasing. In other words, the overall coupling between urban expansion and population growth within the nine urban agglomerations was increasing. In addition, the grid of each urban agglomeration had a consistent trend of changes in the construction land area and population between 2005 and 2020, and the spatial coupling between urban expansion and population growth within each urban agglomeration was increasing. However, within the nine urban agglomerations, the overall coupling between urban expansion and population growth was significantly different, and the spatial coupling between urban expansion and population growth varied. Therefore, we need to further explore the factors that influence the overall coupling and the spatial coupling between urban expansion and population growth within urban agglomerations.
The changes in construction land and population are directly related to the overall and spatial coupling between urban expansion and population growth within an urban agglomeration. Therefore, we conjecture that the expansion rate of the construction land and the growth rate of population in urban agglomerations during the study period affected the overall and spatial coupling between urban expansion and population growth. To test this conjecture, we calculated the growth rates of the construction land and population, the rate of change in the overall coupling (the rate of change in the distance between the construction land’s barycenter and the population’s barycenter within an urban agglomeration), and the rate of change in spatial coupling (the rate of change in the number of VSC grids within an urban agglomeration) for the nine urban agglomerations between 2005 and 2020 (Table 5). In addition, we visualized the overall coupling between urban expansion and population growth in each urban agglomeration compared with the growth rates of the construction land and population (Figure 7) and the spatial coupling between urban expansion and population growth compared with the growth rates of the construction land and population (Figure 8).
We can understand from Figure 7 that there was a significant positive correlation between the overall coupling between urban expansion and population growth and the growth rate of the construction land within the nine urban agglomerations. In other words, the greater the expansion rate of the construction land between 2005 and 2020 was, the higher the overall coupling between urban expansion and population growth in the urban agglomerations was. However, there was no significant correlation between the overall coupling between urban expansion and population growth and the growth rate of population. As we can see from Figure 8, there was also a significant positive correlation between the spatial coupling between urban expansion and population growth and the growth rate of the construction land in the nine urban agglomerations. In other words, the greater the expansion rate of the construction land between 2005 and 2020 was, the higher the spatial coupling between urban expansion and population growth in the urban agglomerations was. However, there was no significant correlation between the spatial coupling between urban expansion and population growth and the growth rate of population.
Overall, the expansion rate of the construction land was a factor that influenced the overall and spatial coupling between urban expansion and population growth within the urban agglomerations, i.e., the greater the expansion rate of the construction land was, the higher the overall and spatial coupling between urban expansion and population growth was.
Although we obtained some valuable results in exploring the coupling between urban expansion and population growth, we acknowledge that there are still some shortcomings. First, we did not explore the coupling between the expansion of different subtypes of construction land and population growth. Different relationships exist between different types of construction land and population. For example, more people are clustered on residential and commercial land than on industrial land. Therefore, exploring the relationship between different types of construction land and population will help to improve the study of the coupling between urban expansion and population growth. Second, the study period of this study was long. The coupling between construction land expansion and population growth is dynamic, and changes in a short period of time can reflect more detailed trends. However, the research interval of this study was 5 years. It is difficult to effectively support a more in-depth study of the coupling between construction land expansion and population growth. Third, the driving factors of the coupling between construction land expansion and population growth need to be studied in depth. Our qualitative analysis confirmed that the expansion rate of construction land within urban agglomerations is a factor influencing the overall and spatial coupling between urban expansion and population growth within urban agglomerations. However, it is also necessary to identify the influencing factors quantitatively. Therefore, in future studies, we will explore the coupling between the expansion of different subtypes of construction land and population growth, shorten the study interval, and examine the driving factors of the coupling between construction land expansion and population growth.
5. Conclusions
We took nine urban agglomerations in China as the research object and the coupling between urban expansion and population growth as the entry point. The overall coupling and the spatial coupling were used to reveal the people–land coupling relationship of nine urban agglomerations in China at different time periods. This study provides a new perspective for exploring the coupling between urban expansion and population growth and offers a new approach for studying the relationship between the two.
- (1)
- The process of urban expansion led to a further concentration of population in urban agglomerations. The trends of the changes in the construction land area and population within the nine urban agglomerations were similar within the same period, i.e., they were all in the stage of continuous growth. Moreover, the rates of construction land expansion and population growth within each urban agglomeration were similar and synchronous.
- (2)
- In the process of construction land expansion and population growth, the spatial distance between the construction land’s barycenter and the population’s barycenter in the nine urban agglomerations was decreasing. Although there were variations in the distance between the construction land’s barycenter and the population’s barycenter within the nine urban agglomerations, the overall decreasing spatial distance between them indicates that the overall coupling between urban expansion and population growth was increasing in the nine urban agglomerations.
- (3)
- Although the proportion of different spatial coupling categories of grids within each urban agglomeration varied, the number of VSC grids was increasing and their extent was expanding. There was a consistency in the trend between construction land expansion and population growth in the grids of each urban agglomeration that occurred between 2005 and 2020. The changes of the coordination coefficients within the grids reflected the increasing spatial coupling between urban expansion and population growth within each urban agglomeration.
- (4)
- There was a significant positive correlation between the overall and spatial coupling between urban expansion and population growth and the growth rate of construction land. The expansion rate of construction land within urban agglomerations is a factor that influences the overall and spatial coupling between urban expansion and population growth, i.e., the greater the expansion rate of construction land, the higher the overall and spatial coupling between urban expansion and population growth.
Author Contributions
Conceptualization, Q.H. and Y.L.; methodology, Q.H.; investigation, Q.H.; resources, Y.L.; data curation, Q.H.; writing—original draft preparation, Q.H.; writing—review and editing, Y.L.; funding acquisition, Y.L. All authors have read and agreed to the published version of the manuscript.
Funding
This research was funded by the National Natural Science Foundation of China (grant No. 41771096) and the Special Project of Philosophy and Social Science Planning in the Guangdong Province (grant No. GD20SQ03).
Institutional Review Board Statement
Not applicable.
Informed Consent Statement
Not applicable.
Data Availability Statement
Data are available upon request.
Conflicts of Interest
The authors declare no conflict of interest.
References
- Yang, Z.; Chen, Y.; Wu, Z.; Qian, Q.; Zheng, Z.; Huang, Q. Spatial heterogeneity of the thermal environment based on the urban expansion of natural cities using open data in Guangzhou, China. Ecol. Indic. 2019, 104, 524–534. [Google Scholar] [CrossRef]
- Tan, Y.; Xu, H.; Zhang, X. Sustainable urbanization in China: A comprehensive literature review. Cities 2016, 55, 82–93. [Google Scholar] [CrossRef]
- Ji, Y.; Guo, X.; Zhong, S.; Wu, L. Land financialization, uncoordinated development of population urbanization and land urbanization, and economic growth: Evidence from China. Land 2020, 9, 481. [Google Scholar] [CrossRef]
- Wang, X.R.; Hui, E.C.M.; Sun, J.X. Population migration, urbanization and housing prices: Evidence from the cities in China. Habitat Int. 2017, 66, 49–56. [Google Scholar] [CrossRef]
- Meng, X.; Han, J. Roads, economy, population density, and CO2: A city-scaled causality analysis. Resour. Conserv. Recycl. 2018, 128, 508–515. [Google Scholar] [CrossRef]
- Li, G.; Sun, S.; Fang, C. The varying driving forces of urban expansion in China: Insights from a spatial-temporal analysis. Landsc. Urban Plan. 2018, 174, 63–77. [Google Scholar] [CrossRef]
- Yang, Z.; Chen, Y.; Wu, Z. How urban expansion affects the thermal environment? A study of the impact of natural cities on the thermal field value and footprint of thermal environment. Ecol. Indic. 2021, 126, 107632. [Google Scholar] [CrossRef]
- Liu, H.; Fang, C.; Miao, Y.; Ma, H.; Zhang, Q.; Zhou, Q. Spatio-temporal evolution of population and urbanization in the countries along the Belt and Road 1950–2050. J. Geogr. Sci. 2018, 28, 919–936. [Google Scholar] [CrossRef] [Green Version]
- Yu, J.; Zhou, K.; Yang, S. Land use efficiency and influencing factors of urban agglomerations in China. Land Use Policy 2019, 88. [Google Scholar] [CrossRef]
- Kuang, B.; Lu, X.; Han, J.; Fan, X.; Zuo, J. How urbanization influence urban land consumption intensity: Evidence from China. Habitat Int. 2020, 100, 102103. [Google Scholar] [CrossRef]
- Yang, Z.; Chen, Y.; Guo, G.; Zheng, Z.; Wu, Z. Using nighttime light data to identify the structure of polycentric cities and evaluate urban centers. Sci. Total Environ. 2021, 780, 146586. [Google Scholar] [CrossRef]
- Hu, S.; Fan, Y.; Zhang, T. Assessing the effect of land use change on surface runoff in a rapidly urbanized city: A case study of the central area of Beijing. Land 2020, 9, 17. [Google Scholar] [CrossRef] [Green Version]
- Yang, Z.; Chen, Y.; Zheng, Z.; Huang, Q.; Wu, Z. Application of building geometry indexes to assess the correlation between buildings and air temperature. Build. Environ. 2020, 167, 106477. [Google Scholar] [CrossRef]
- Gwan, A.S.; Kimengsi, J.N. Urban expansion and the dynamics of farmers’ livelihoods: Evidence from Bamenda, Cameroon. Sustainability 2020, 12, 5788. [Google Scholar] [CrossRef]
- Yan, Y.; Ju, H.; Zhang, S.; Jiang, W. Spatiotemporal patterns and driving forces of urban expansion in coastal areas: A study on urban agglomeration in the Pearl River Delta, China. Sustainability 2020, 12, 191. [Google Scholar] [CrossRef] [Green Version]
- Khan, I.; Hou, F.; Le, H.P. The impact of natural resources, energy consumption, and population growth on environmental quality: Fresh evidence from the United States of America. Sci. Total Environ. 2021, 754, 142222. [Google Scholar] [CrossRef]
- Shang, J.; Li, P.; Li, L.; Chen, Y. The relationship between population growth and capital allocation in urbanization. Technol. Forecast. Soc. Chang. 2018, 135, 249–256. [Google Scholar] [CrossRef]
- Halbac-Cotoara-Zamfir, R.; Egidi, G.; Mosconi, E.M.; Poponi, S.; Alhuseen, A.; Salvati, L. Uncovering demographic trends and recent urban expansion in metropolitan regions: A paradigmatic case study. Sustainability 2020, 12, 3937. [Google Scholar] [CrossRef]
- You, H.; Yang, X. Urban expansion in 30 megacities of China: Categorizing the driving force profiles to inform the urbanization policy. Land Use Policy 2017, 68, 531–551. [Google Scholar] [CrossRef]
- Salem, M.; Tsurusaki, N.; Divigalpitiya, P. Analyzing the driving factors causing urban expansion in the peri-urban areas using logistic regression: A case study of the greater Cairo region. Infrastructures 2019, 4, 4. [Google Scholar] [CrossRef] [Green Version]
- Zhang, Y.; Xie, H. Interactive relationship among urban expansion, economic development, and population growth since the reform and opening up in China: An analysis based on a Vector Error Correction Model. Land 2019, 8, 153. [Google Scholar] [CrossRef] [Green Version]
- Khan, A.A.; Arshad, S.; Mohsin, M. Population growth and its impact on urban expansion: A case study of Bahawalpur, Pakistan. Univers. J. Geosci. 2014, 2, 229–241. [Google Scholar] [CrossRef]
- El Garouani, A.; Mulla, D.J.; El Garouani, S.; Knight, J. Analysis of urban growth and sprawl from remote sensing data: Case of Fez, Morocco. Int. J. Sustain. Built Environ. 2017, 6, 160–169. [Google Scholar] [CrossRef]
- Sharifi, A.; Hosseingholizadeh, M. The effect of rapid population growth on urban expansion and destruction of green space in Tehran from 1972 to 2017. J. Indian Soc. Remote Sens. 2019, 47, 1063–1071. [Google Scholar] [CrossRef]
- Zhou, L.; Dang, X.; Mu, H.; Wang, B.; Wang, S. Cities are going uphill: Slope gradient analysis of urban expansion and its driving factors in China. Sci. Total Environ. 2021, 775, 145836. [Google Scholar] [CrossRef]
- Li, Y.; Kong, X.; Zhu, Z. Multiscale analysis of the correlation patterns between the urban population and construction land in China. Sustain. Cities Soc. 2020, 61, 102326. [Google Scholar] [CrossRef]
- Li, C.; He, J.; Duan, X. Modeling the collaborative evolution of urban land considering urban interactions under intermediate intervention, in the urban agglomeration in the middle reaches of the Yangtze river in China. Land 2020, 9, 184. [Google Scholar] [CrossRef]
- Tang, Y.; Yuan, Y.; Zhong, Q. Evaluation of land comprehensive carrying capacity and spatio-temporal analysis of the Harbin-Changchun urban agglomeration. Int. J. Environ. Res. Public Health 2021, 18, 521. [Google Scholar] [CrossRef] [PubMed]
- Wan, J.; Zhang, L.; Yan, J.; Wang, X.; Wang, T. Spatial–temporal characteristics and influencing factors of coupled coordination between urbanization and eco-environment: A case study of 13 urban agglomerations in China. Sustainability 2020, 12, 8821. [Google Scholar] [CrossRef]
- Yang, Z.; Chen, Y.; Qian, Q.; Wu, Z.; Zheng, Z.; Huang, Q. The coupling relationship between construction land expansion and high-temperature area expansion in China’s three major urban agglomerations. Int. J. Remote Sens. 2019, 40, 6680–6699. [Google Scholar] [CrossRef]
- Hu, Y.; Batunacun; Zhen, L.; Zhuang, D. Assessment of land-use and land-cover change in Guangxi, China. Sci. Rep. 2019, 9, 1–13. [Google Scholar] [CrossRef] [PubMed] [Green Version]
- Yang, Y.; Xiao, P.; Feng, X.; Li, H. Accuracy assessment of seven global land cover datasets over China. ISPRS J. Photogramm. Remote Sens. 2017, 125, 156–173. [Google Scholar] [CrossRef]
- Tatem, A.J. WorldPop, open data for spatial demography. Sci. Data 2017, 4, 2–5. [Google Scholar] [CrossRef]
- Lloyd, C.T. High resolution global gridded data for use in population studies. Int. Arch. Photogramm. Remote Sens. Spat. Inf. Sci. ISPRS Arch. 2017, 42, 117–120. [Google Scholar] [CrossRef] [Green Version]
- Liu, P.; Wang, Q.; Zhang, D.; Lu, Y. An improved correction method of nighttime light data based on EVI and WorldPop data. Remote Sens. 2020, 12, 3988. [Google Scholar] [CrossRef]
- Bratley, K.; Ghoneim, E. Modeling urban encroachment on the agricultural land of the Eastern Nile Delta using remote sensing and a GIS-based Markov Chain Model. Land 2018, 7, 114. [Google Scholar] [CrossRef] [Green Version]
- Tu, Y.; Chen, B.; Zhang, T.; Xu, B. Regional mapping of essential urban land use categories in China: A segmentation-based approach. Remote Sens. 2020, 12, 1058. [Google Scholar] [CrossRef] [Green Version]
- Zhou, L.; Yuan, B.; Mu, H.; Dang, X.; Wang, S. Coupling relationship between construction land expansion and PM 2.5 in China. Environ. Sci. Pollut. Res. 2021, 1–13. [Google Scholar]
- Wu, Z.; Li, Z.; Zeng, H. Using remote sensing data to study the coupling relationship between urbanization and eco-environment change: A case study in the Guangdong-Hong Kong-Macao Greater Bay Area. Sustainability 2020, 12, 7875. [Google Scholar] [CrossRef]
- Tang, C.; Fan, J.; Sun, W. Distribution characteristics and policy implications of territorial development suitability of the Yangtze River Basin. J. Geogr. Sci. 2015, 25, 1377–1392. [Google Scholar] [CrossRef]
- Wang, Y.; Chen, Y.; Li, Z. Evolvement characteristics of population and economic gravity centers in Tarim River Basin, Uygur Autonomous Region of Xinjiang, China. Chin. Geogr. Sci. 2013, 23, 765–772. [Google Scholar] [CrossRef] [Green Version]
- Luo, Y.; Yu, H.; Liu, S.; Liang, Y.; Liu, S. Spatial heterogeneity and coupling of economy and population gravity centres in the Hengduan mountains. Sustainability 2019, 11, 1508. [Google Scholar] [CrossRef] [Green Version]
- Fricker, T.; Elsner, J.B.; Jagger, T.H. Population and energy elasticity of tornado casualties. Geophys. Res. Lett. 2017, 44, 3941–3949. [Google Scholar] [CrossRef]
- Qi, Y.; Yang, Y.; Jin, F. China’s economic development stage and its spatio-temporal evolution: A prefectural-level analysis. J. Geogr. Sci. 2013, 23, 297–314. [Google Scholar] [CrossRef]
- Liu, N.; Liu, C.; Xia, Y.; Da, B. Examining the coordination between urbanization and eco-environment using coupling and spatial analyses: A case study in China. Ecol. Indic. 2018, 93, 1163–1175. [Google Scholar] [CrossRef]
- Ma, L.; Chen, M.; Fang, F.; Che, X. Research on the spatiotemporal variation of rural-urban transformation and its driving mechanisms in underdeveloped regions: Gansu Province in western China as an example. Sustain. Cities Soc. 2019, 50. [Google Scholar] [CrossRef]
Figure 1.
The distribution of nine urban agglomerations in China: (a) Beijing–Tianjin–Tangshan (BTT); (b) Yangtze River Delta (YRD); (c) Pearl River Delta (PRD); (d) Harbin–Changchun–Jilin (HCJ); (e) Central Plains (CP); (f) Triangle of Central China (TCC); (g) West Side of the Straits (WSS); (h) Chengdu–Chongqing (CC); (i) Guanzhong Plain (GP).

Figure 2.
Changes in the construction land of nine urban agglomerations in China, 2005–2020.

Figure 3.
Changes in population of nine urban agglomerations in China, 2005–2020.

Figure 4.
Spatial distribution of the construction land’s barycenter in the nine urban agglomerations from 2005 to 2020: (a) BTT; (b) YRD; (c) PRD; (d) HCJ; (e) CP; (f) TCC; (g) WSS; (h) CC; (i) GP.
Figure 4.
Spatial distribution of the construction land’s barycenter in the nine urban agglomerations from 2005 to 2020: (a) BTT; (b) YRD; (c) PRD; (d) HCJ; (e) CP; (f) TCC; (g) WSS; (h) CC; (i) GP.

Figure 5.
Spatial distribution of the population’s barycenter in the nine urban agglomerations from 2005 to 2020: (a) BTT; (b) YRD; (c) PRD; (d) HCJ; (e) CP; (f) TCC; (g) WSS; (h) CC; (i) GP.
Figure 5.
Spatial distribution of the population’s barycenter in the nine urban agglomerations from 2005 to 2020: (a) BTT; (b) YRD; (c) PRD; (d) HCJ; (e) CP; (f) TCC; (g) WSS; (h) CC; (i) GP.

Figure 6.
Distribution of spatial coupling categories of construction land expansion and population growth within nine urban agglomerations: 2005–2010 ((a1) BTT; (b1) YRD; (c1) PRD; (d1) HCJ; (e1) CP; (f1) TCC; (g1) WSS; (h1) CC; (i1) GP); 2010–2015 ((a2) BTT; (b2) YRD; (c2) PRD; (d2) HCJ; (e2) CP; (f2) TCC; (g2) WSS; (h2) CC; (i2) GP); 2015–2020 ((a3) BTT; (b3) YRD; (c3) PRD; (d3) HCJ; (e3) CP; (f3) TCC; (g3) WSS; (h3) CC; (i3) GP).

Figure 7.
Overall coupling between urban expansion and population growth compared with the growth rates of the construction land and population: (a) overall coupling and the growth rate of the construction land; (b) overall coupling and the growth rate of population.
Figure 7.
Overall coupling between urban expansion and population growth compared with the growth rates of the construction land and population: (a) overall coupling and the growth rate of the construction land; (b) overall coupling and the growth rate of population.

Figure 8.
Spatial coupling between urban expansion and population growth compared with the growth rates of the construction land and population: (a) spatial coupling and the growth rate of the construction land; (b) spatial coupling and the growth rate of population.
Figure 8.
Spatial coupling between urban expansion and population growth compared with the growth rates of the construction land and population: (a) spatial coupling and the growth rate of the construction land; (b) spatial coupling and the growth rate of population.


Table 1.
The spatial coupling categories between urban expansion and population growth.
| Coupling Categories | ||
|---|---|---|
| Very strong | ||
| Strong | ||
| Moderate | ||
| Weak | ||
| [0, 0.5] | Very weak |
Table 2.
Statistics of the construction land and the population in nine urban agglomerations in China, 2005–2020.
Table 2.
Statistics of the construction land and the population in nine urban agglomerations in China, 2005–2020.
| Area | Construction Land (km2) | Population (106) | ||||||
|---|---|---|---|---|---|---|---|---|
| 2005 | 2010 | 2015 | 2020 | 2005 | 2010 | 2015 | 2020 | |
| BTT | 7246 | 8254 | 8565 | 9000 | 38.8 | 44.3 | 50.6 | 58.1 |
| YRD | 6501 | 8020 | 9493 | 10,370 | 59.0 | 66.5 | 75.1 | 85.1 |
| PRD | 5204 | 6114 | 6808 | 7233 | 48.7 | 55.0 | 62.3 | 70.7 |
| HCJ | 4505 | 4583 | 4659 | 4912 | 22.6 | 23.5 | 24.5 | 25.5 |
| CP | 5925 | 6367 | 6514 | 6886 | 39.2 | 41.0 | 42.9 | 45.1 |
| TCC | 3685 | 3895 | 4114 | 4511 | 34.9 | 35.1 | 35.4 | 35.9 |
| WSS | 2250 | 2769 | 3150 | 3332 | 27.3 | 28.9 | 30.9 | 33.3 |
| CC | 1876 | 2289 | 2520 | 3276 | 38.2 | 38.6 | 39.3 | 40.2 |
| GP | 2727 | 2946 | 3005 | 3547 | 25.2 | 26.0 | 26.9 | 27.9 |
Table 3.
Distance between the construction land’s barycenter and the population’s barycenter in nine urban agglomerations, 2005–2020.
Table 3.
Distance between the construction land’s barycenter and the population’s barycenter in nine urban agglomerations, 2005–2020.
| Area | Distance (km) | |||
|---|---|---|---|---|
| 2005 | 2010 | 2015 | 2020 | |
| BTT | 29.43 | 24.96 | 21.70 | 19.03 |
| YRD | 29.53 | 18.55 | 17.42 | 13.80 |
| PRD | 5.38 | 3.12 | 3.28 | 3.33 |
| HCJ | 21.89 | 19.99 | 17.84 | 17.09 |
| CP | 15.35 | 14.71 | 14.28 | 13.53 |
| TCC | 21.19 | 18.40 | 17.55 | 14.26 |
| WSS | 39.73 | 37.85 | 35.30 | 27.86 |
| CC | 64.42 | 55.70 | 39.55 | 11.22 |
| GP | 8.21 | 7.40 | 6.80 | 6.23 |
Table 4.
Number and percentage of evaluation units of different spatial coupling categories of construction land expansion and population growth in nine urban agglomerations.
Table 4.
Number and percentage of evaluation units of different spatial coupling categories of construction land expansion and population growth in nine urban agglomerations.
| Period | Type | Index | Urban Agglomeration | ||||||||
|---|---|---|---|---|---|---|---|---|---|---|---|
| BTT | YRD | PRD | HCJ | CP | TCC | WSS | CC | GP | |||
| 2005–2010 | Moderate | No. | 113 | 170 | 274 | 386 | 192 | 236 | 448 | 345 | 308 |
| % | 21.24 | 26.81 | 45.44 | 34.22 | 27.04 | 29.95 | 67.88 | 59.28 | 42.48 | ||
| Strong | No. | 73 | 113 | 86 | 140 | 68 | 191 | 53 | 134 | 128 | |
| % | 13.72 | 17.82 | 14.26 | 12.41 | 9.58 | 24.24 | 8.03 | 23.02 | 17.66 | ||
| Very strong | No. | 346 | 348 | 243 | 602 | 450 | 361 | 159 | 103 | 288 | |
| % | 65.04 | 54.89 | 40.30 | 53.37 | 63.38 | 45.81 | 24.09 | 17.70 | 39.72 | ||
| 2010–2015 | Moderate | No. | 89 | 155 | 178 | 361 | 170 | 233 | 298 | 322 | 297 |
| % | 16.73 | 24.45 | 29.52 | 32.00 | 23.94 | 29.57 | 45.15 | 55.33 | 40.97 | ||
| Strong | No. | 47 | 71 | 53 | 103 | 18 | 55 | 46 | 17 | 21 | |
| % | 8.83 | 11.20 | 8.79 | 9.13 | 2.54 | 6.98 | 6.97 | 2.92 | 2.90 | ||
| Very strong | No. | 396 | 405 | 372 | 664 | 522 | 500 | 316 | 243 | 406 | |
| % | 74.44 | 63.88 | 61.69 | 58.87 | 73.52 | 63.45 | 47.88 | 41.75 | 56.00 | ||
| 2015–2020 | Moderate | No. | 85 | 121 | 178 | 334 | 175 | 328 | 293 | 374 | 340 |
| % | 15.98 | 19.09 | 29.52 | 29.61 | 24.65 | 41.62 | 44.39 | 64.26 | 46.90 | ||
| Strong | No. | 27 | 35 | 59 | 122 | 17 | 37 | 115 | 23 | 27 | |
| % | 5.08 | 5.52 | 9.78 | 10.82 | 2.39 | 4.70 | 17.42 | 3.95 | 3.72 | ||
| Very strong | No. | 420 | 475 | 366 | 672 | 518 | 423 | 252 | 185 | 357 | |
| % | 78.95 | 74.92 | 60.70 | 59.57 | 72.96 | 53.68 | 38.18 | 31.79 | 49.24 | ||
Table 5.
Changes in indicators within the nine urban agglomerations, 2005–2020.
| Area | Rate of Change between 2005 and 2020 (%) | |||
|---|---|---|---|---|
| Construction Land | Population | Overall Coupling | Spatial Coupling | |
| BTT | 24.21 | 49.74 | 35.33 | 21.38 |
| YRD | 59.51 | 44.24 | 53.27 | 36.49 |
| PRD | 38.98 | 45.17 | 38.1 | 50.62 |
| HCJ | 9.03 | 12.83 | 21.93 | 11.63 |
| CP | 16.22 | 15.05 | 11.86 | 15.11 |
| TCC | 22.42 | 2.86 | 32.7 | 17.17 |
| WSS | 48.09 | 21.97 | 29.88 | 58.49 |
| CC | 74.63 | 5.24 | 82.58 | 79.61 |
| GP | 30.07 | 10.71 | 24.12 | 23.96 |
Publisher’s Note: MDPI stays neutral with regard to jurisdictional claims in published maps and institutional affiliations. |
© 2021 by the authors. Licensee MDPI, Basel, Switzerland. This article is an open access article distributed under the terms and conditions of the Creative Commons Attribution (CC BY) license (https://creativecommons.org/licenses/by/4.0/).
Share and Cite
MDPI and ACS Style
Huang, Q.; Liu, Y. The Coupling between Urban Expansion and Population Growth: An Analysis of Urban Agglomerations in China (2005–2020). Sustainability 2021, 13, 7250. https://0-doi-org.brum.beds.ac.uk/10.3390/su13137250
AMA Style
Huang Q, Liu Y. The Coupling between Urban Expansion and Population Growth: An Analysis of Urban Agglomerations in China (2005–2020). Sustainability. 2021; 13(13):7250. https://0-doi-org.brum.beds.ac.uk/10.3390/su13137250
Chicago/Turabian StyleHuang, Qingyao, and Yihua Liu. 2021. "The Coupling between Urban Expansion and Population Growth: An Analysis of Urban Agglomerations in China (2005–2020)" Sustainability 13, no. 13: 7250. https://0-doi-org.brum.beds.ac.uk/10.3390/su13137250
Note that from the first issue of 2016, this journal uses article numbers instead of page numbers. See further details here.