Article

Environmental, Economical and Technological Analysis of MQL-Assisted Machining of Al-Mg-Zr Alloy Using PCD Tool

1
Department of Mechanical and Production Engineering, Ahsanullah University of Science and Technology, Dhaka 1208, Bangladesh
2
School of Mechanical Engineering, Lovely Professional University, Phagwara 144411, Punjab, India
3
Department of Mechanical Engineering, National University of Singapore, Singapore 119077, Singapore
4
Department of Mechanical Engineering, Guru Nanak Dev Engineering College, Ludhiana 141006, Punjab, India
5
Department of Mechanical Engineering, North Eastern Regional Institute of Science and Technology, Nirjuli 791109, India
6
Department of Mechanical Engineering, Imperial College London, Exhibition Road, London SW7 2AZ, UK
7
Department of Design, Manufacturing & Engineering Management, University of Strathclyde, Glasgow G1 1XJ, Scotland, UK
*
Authors to whom correspondence should be addressed.
Sustainability 2021, 13(13), 7321; https://0-doi-org.brum.beds.ac.uk/10.3390/su13137321
Submission received: 8 March 2021 / Revised: 10 June 2021 / Accepted: 21 June 2021 / Published: 30 June 2021
(This article belongs to the Special Issue Sustainable and Advanced Remanufacturing Processes)

Abstract

:
Clean technological machining operations can improve traditional methods’ environmental, economic, and technical viability, resulting in sustainability, compatibility, and human-centered machining. This, this work focuses on sustainable machining of Al-Mg-Zr alloy with minimum quantity lubricant (MQL)-assisted machining using a polycrystalline diamond (PCD) tool. The effect of various process parameters on the surface roughness and cutting temperature were analyzed. The Taguchi L25 orthogonal array-based experimental design has been utilized. Experiments have been carried out in the MQL environment, and pressure was maintained at 8 bar. The multiple responses were optimized using desirability function analysis (DFA). Analysis of variance (ANOVA) shows that cutting speed and depth of cut are the most prominent factors for surface roughness and cutting temperature. Therefore, the DFA suggested that, to attain reasonable response values, a lower to moderate value of depth of cut, cutting speed and feed rate are appreciable. An artificial neural network (ANN) model with four different learning algorithms was used to predict the surface roughness and temperature. Apart from this, to address the sustainability aspect, life cycle assessment (LCA) of MQL-assisted and dry machining has been carried out. Energy consumption, CO2 emissions, and processing time have been determined for MQL-assisted and dry machining. The results showed that MQL-machining required a very nominal amount of cutting fluid, which produced a smaller carbon footprint. Moreover, very little energy consumption is required in MQL-machining to achieve high material removal and very low tool change.

1. Introduction

Alloys have wide applications, such as for use as turbine and furnace components, and in the aerospace and petroleum industries [1]. Aluminum-based alloys have been most widely used in automotive industries due to their excellent formability [2]. There is a growing trend in Al-based alloy-based metal matrix composites (MMCs) in automotive applications, particularly for engine block manufacturing [3]. The Al/Mg base alloy, combining corrosion resistance with appreciable strength and ductility, is of interest in light-weight structural applications in the transportation industry [4]. Machining of MMC-based composites is challenging compared to conventional steels, so they are often identified as difficult-to-cut materials [5,6]. Some strategies, such as the design of cutting tools, incorporating an appropriate cutting environment, and tool change, are needed to make machining operations more convenient. Sustainable manufacturing is the only solution for developing products via environmentally-friendly, non-polluting, energy-efficient, and economical machining processes to ensure socio-economic wellbeing, safety, and health [7]. According to the Environmental Protection Association (EPA), the use of new cooling/lubrication techniques, such as dry-cutting, MQL, cryogenic cooling, and hybrid cooling techniques in machining, has been acknowledged as a cleaner sustainable machining production approach. Further works from the literature are collected in the following sections.
A number of inserts have been developed to machine hard-to-machine materials. Polycrystalline diamond (PCD) was found to be suitable for machining hardened metals and super-alloys under higher cutting speed conditions [8,9]. To strengthen the efficacy of the PCD tool, an investigation was conducted on Al alloy-based MMC with 20 wt.% of SiC particles, using WC, PCBN, and PCD tools, resulting in PCD providing the best performance as a cutting insert [10]. Furthermore, considering that the hardness of PCD is higher than that of SiC, the efficiency of different tool materials was analyzed while machining Al-based SiC alloy and it was concluded that PCD was superior to the PCBN tool, a coated ceramic tool, and cemented carbide instruments [11].
The PCD inserts with particle SiC and B4C-reinforced MMCs have also been examined for short fibrous Al2O3. Based on the wear rates and morphology of worn surfaces, abrasion by dislodged diamond grains and microcracking caused the wear of PCD. [12]. PCD and chemical vapor deposition (CVD) diamond-coated tools were investigated for tool life, and the initial flank wear on both the tools was generated by abrasion [13]. Chip–tool interface temperature is another important parameter associated with many machining operations. Inherently, high steel production machining offers a high temperature in the cutting area, which leads to substantial deviations and premature failure of cutting tools [14]. High cuts that negatively influence the lifespan of the tool, dimensional precision, and product surface integrity unavoidably characterize high-speed workmanship. However, a high-pressure oil jet can lower the cutting temperature and extend the lifetime of tools to the same extent as the chip–tool interface [15,16].
Rabiei [17] focused on the importance of cutting fluids to facilitate certain benefits during machining, such as improved tool life and a good surface finish. In some applications, between dry machining and flood cooling, an ideal lubrication solution can be found in the form of MQL, which is a viable solution to address the drawbacks of dry and flood-cooling processes [18,19]. Abhang and Hameedullah investigated the effectiveness of the MQL technique depending on the level of the process parameters and the work material, resulting in a reduction of chip-tool interface temperature as high as 30% compared to conventional cooling [20]. The studied effect of MQL on surface roughness in CNC turning determined that a minimal quantity of lubrication could significantly reduce the resultant output when compared with the traditional flood-cooling method [21]. Karim et al. investigated the effect of MQL in turning Al alloy composite using the Taguchi–PCA approach and determined the issue of the beneficial impact of MQL over the conventional cooling method [22,23]. MQL integrated into the turning of AISI 4140 steel could improve the cutting temperature and surface integrity. Adding special additives to the coolant and lubricant systems may also enhance the base fluid’s tribological properties by minimizing machining forces and decreasing chip–tool interface temperature [24,25].
While focusing on improving tool life, cutting force, and surface roughness, Lin explored the use of Taguchi analysis during the turning of S45C steel bar using P20 tungsten carbide. They found that the Taguchi method was a multiple performance optimization solver [26]. In an attempt to predict response parameters, Temel et al. [27] concluded that ANN is an effective method for predicting output variable with a minimum error for identifying mechanical and physical characteristics of Al2024-B4C MMC. Bachy and Franke [28] used ANN and RSM to develop laser process mathematical models, and resulted in generating the lowest errors using an artificial neural network, which justified ANN’s high precision response concerning surface methodology. Various researcher reported the use of artificial intelligence in the processing of Al-alloys [29,30,31]. Reddy compared RSM and ANFIS predicted surface roughness values, and the ANFIS results were superior to those of RSM [32]. A fuzzy model was developed using three different sets of process parameters and it was concluded that the ANFIS-based hybrid model was best suited to accurately predict surface roughness, with a MAPE value of 0.113542% compared to the developed ANN model [33].
Energy consumption evaluation is an integral part of life cycle assessment (LCA) and sustainability. Energy consumption varies with the machining stages and depends on the utilization of instruments assisting the machining [34,35]. The utilization of cooling and lubrication systems raised the power produced by the machine [36]. However, an analysis of electric energy usage is not sufficient to determine the sustainability of the machining process. Therefore, consumed resources’ incarnated energy has been introduced into research in recent years [37,38]. Carbon (CO2) emission and carbon footprint analysis is also a key indicator of LCA and sustainability. Ic et al. [39] optimized the processing parameters of a machine to turn Al-7075 alloy to minimize the emission of CO2 and to produce a low surface roughness. It was reported that the proper selection of coolant reduced the generation of CO2 emissions and was better for the environment. CO2 emissions have been found to be approximately zero in the MQL and cryogenically assisted machining process. Production costs are also essential for LCA and sustainability. The production costs of machined components were computed using Taylor’s cost method. The model comprised tool cost, machine cost, and tool change cost, but this model does not include a coolant effect on the production costs [40]. Jamil et al. proposed a cost model for dry, MQL, and LN2-assisted cooling of machining of Ti-alloy, and it was found that the production cost was reduced significantly [41].
The necessity for environmentally friendly machining has always been the motivating factor regarding cutting-fluid-usage reduction techniques. MQL is amongst the most promising machining strategies, allowing for a 90% reduction in cutting fluid consumption, although it also preserves surface quality and tool life. The prominence of MQL in machining necessitates an analysis of MQL progress. During machining operations, flood cooling is a popular method for extracting heat from the cutting field; however, it has negative consequences, such as it can cause respiratory illnesses among employees, environmental issues, and cutting fluid processing and disposal. As a result, environmentally sustainable lubrication solutions must be implemented to address flood lubrication issues. The MQL strategy can also help with machining issues like chip pressure welding to the cutting edge, which is the main reason for tool failure. Additionally, MQL improves the surface quality of machined parts. However, MQL is mainly concerned with reducing friction, rather than removing as much heat as possible by regulating heat generation at its source.
A detailed literature survey has revealed that there is a complete dearth of literature on life cycle assessment (LCA) and sustainability analyses of MQL-assisted machining of Al-Mg-Zr alloy. The sustainability aspect of the machining area requires a great deal of attention and needs to be comprehended in a structured manner in comparative studies. Unfortunately, most academics and manufacturing industries are still focused only on traditional methods. However, insincere efforts have been made in understanding the effects of environmental, economic, and technological analyses of MQL-assisted machining of Al-Mg-Zr Alloy. The present study has created another endeavor, to fill the gap due to the already-stated theoretical research gaps. The current research on MQL-assisted machining of Al-Mg-Zr alloy using a PCD tool has created the following objectives:
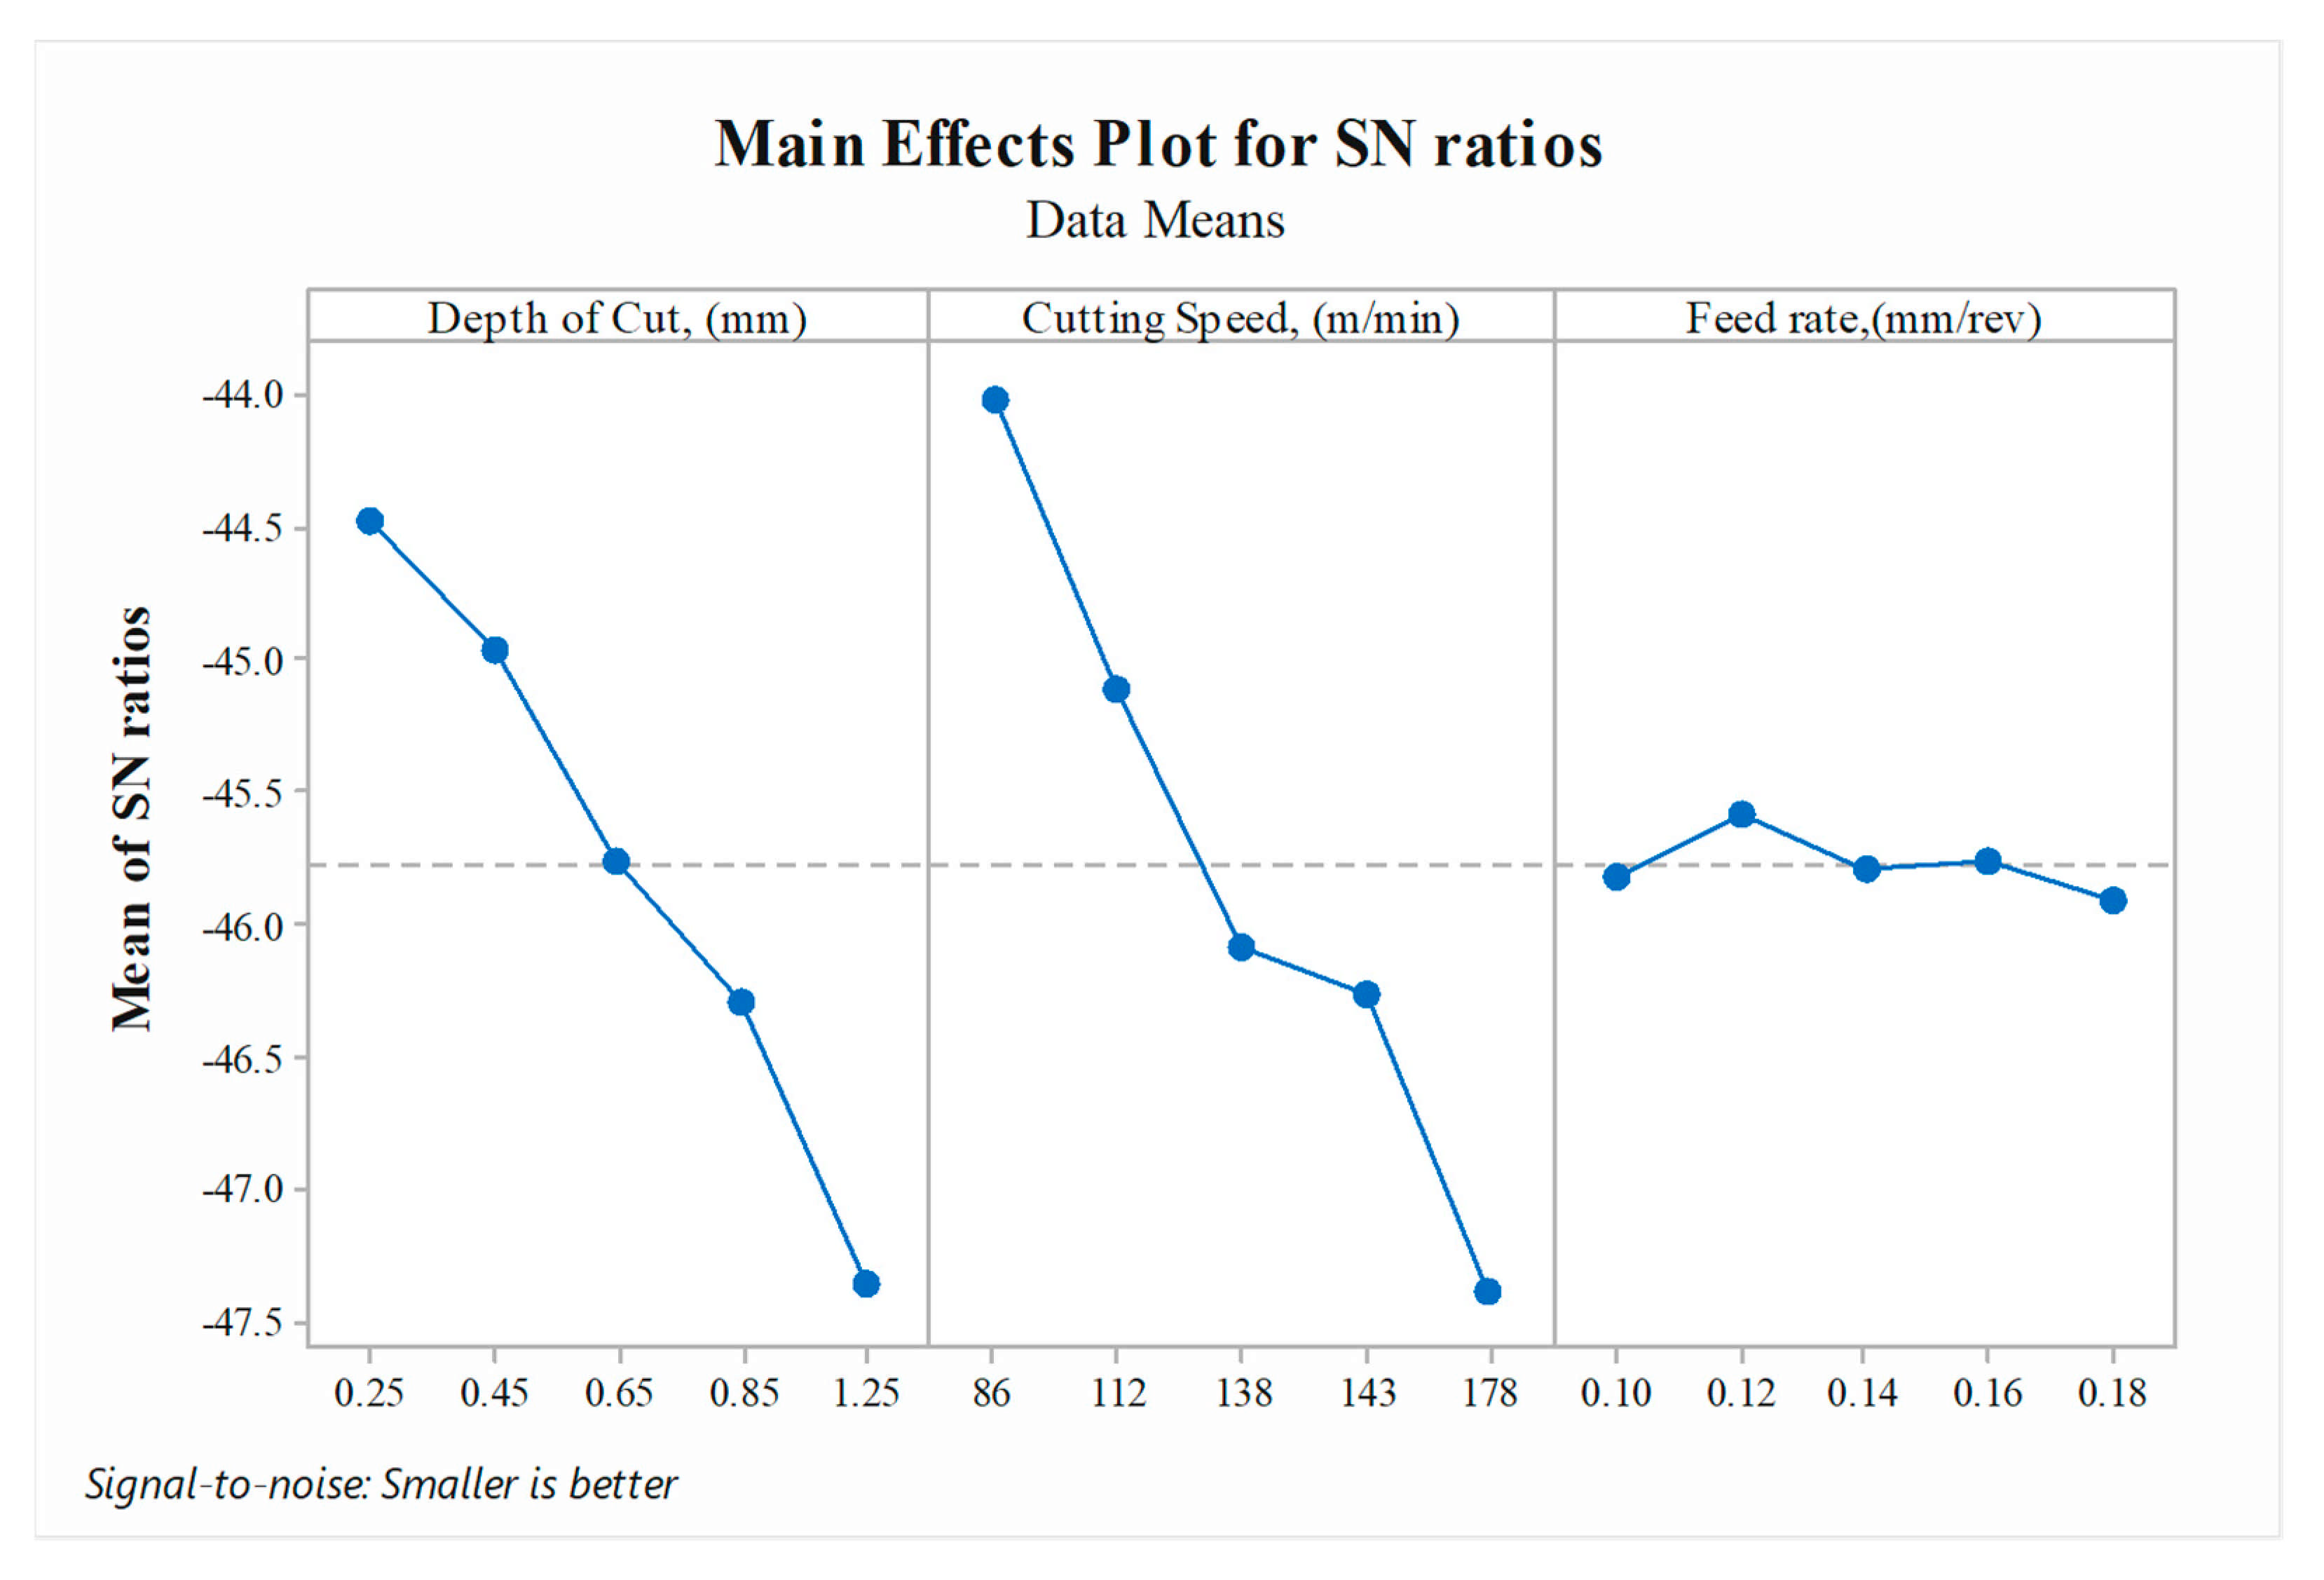
  • To determine the influence of cutting parameters on sustainable responses, viz. surface roughness and cutting temperature using ANOVA and the main effect of plots using the PCD tool;
  • To achieve optimal cutting parameters with the Taguchi method and multi-objective optimization with desirability function analysis (DFA);
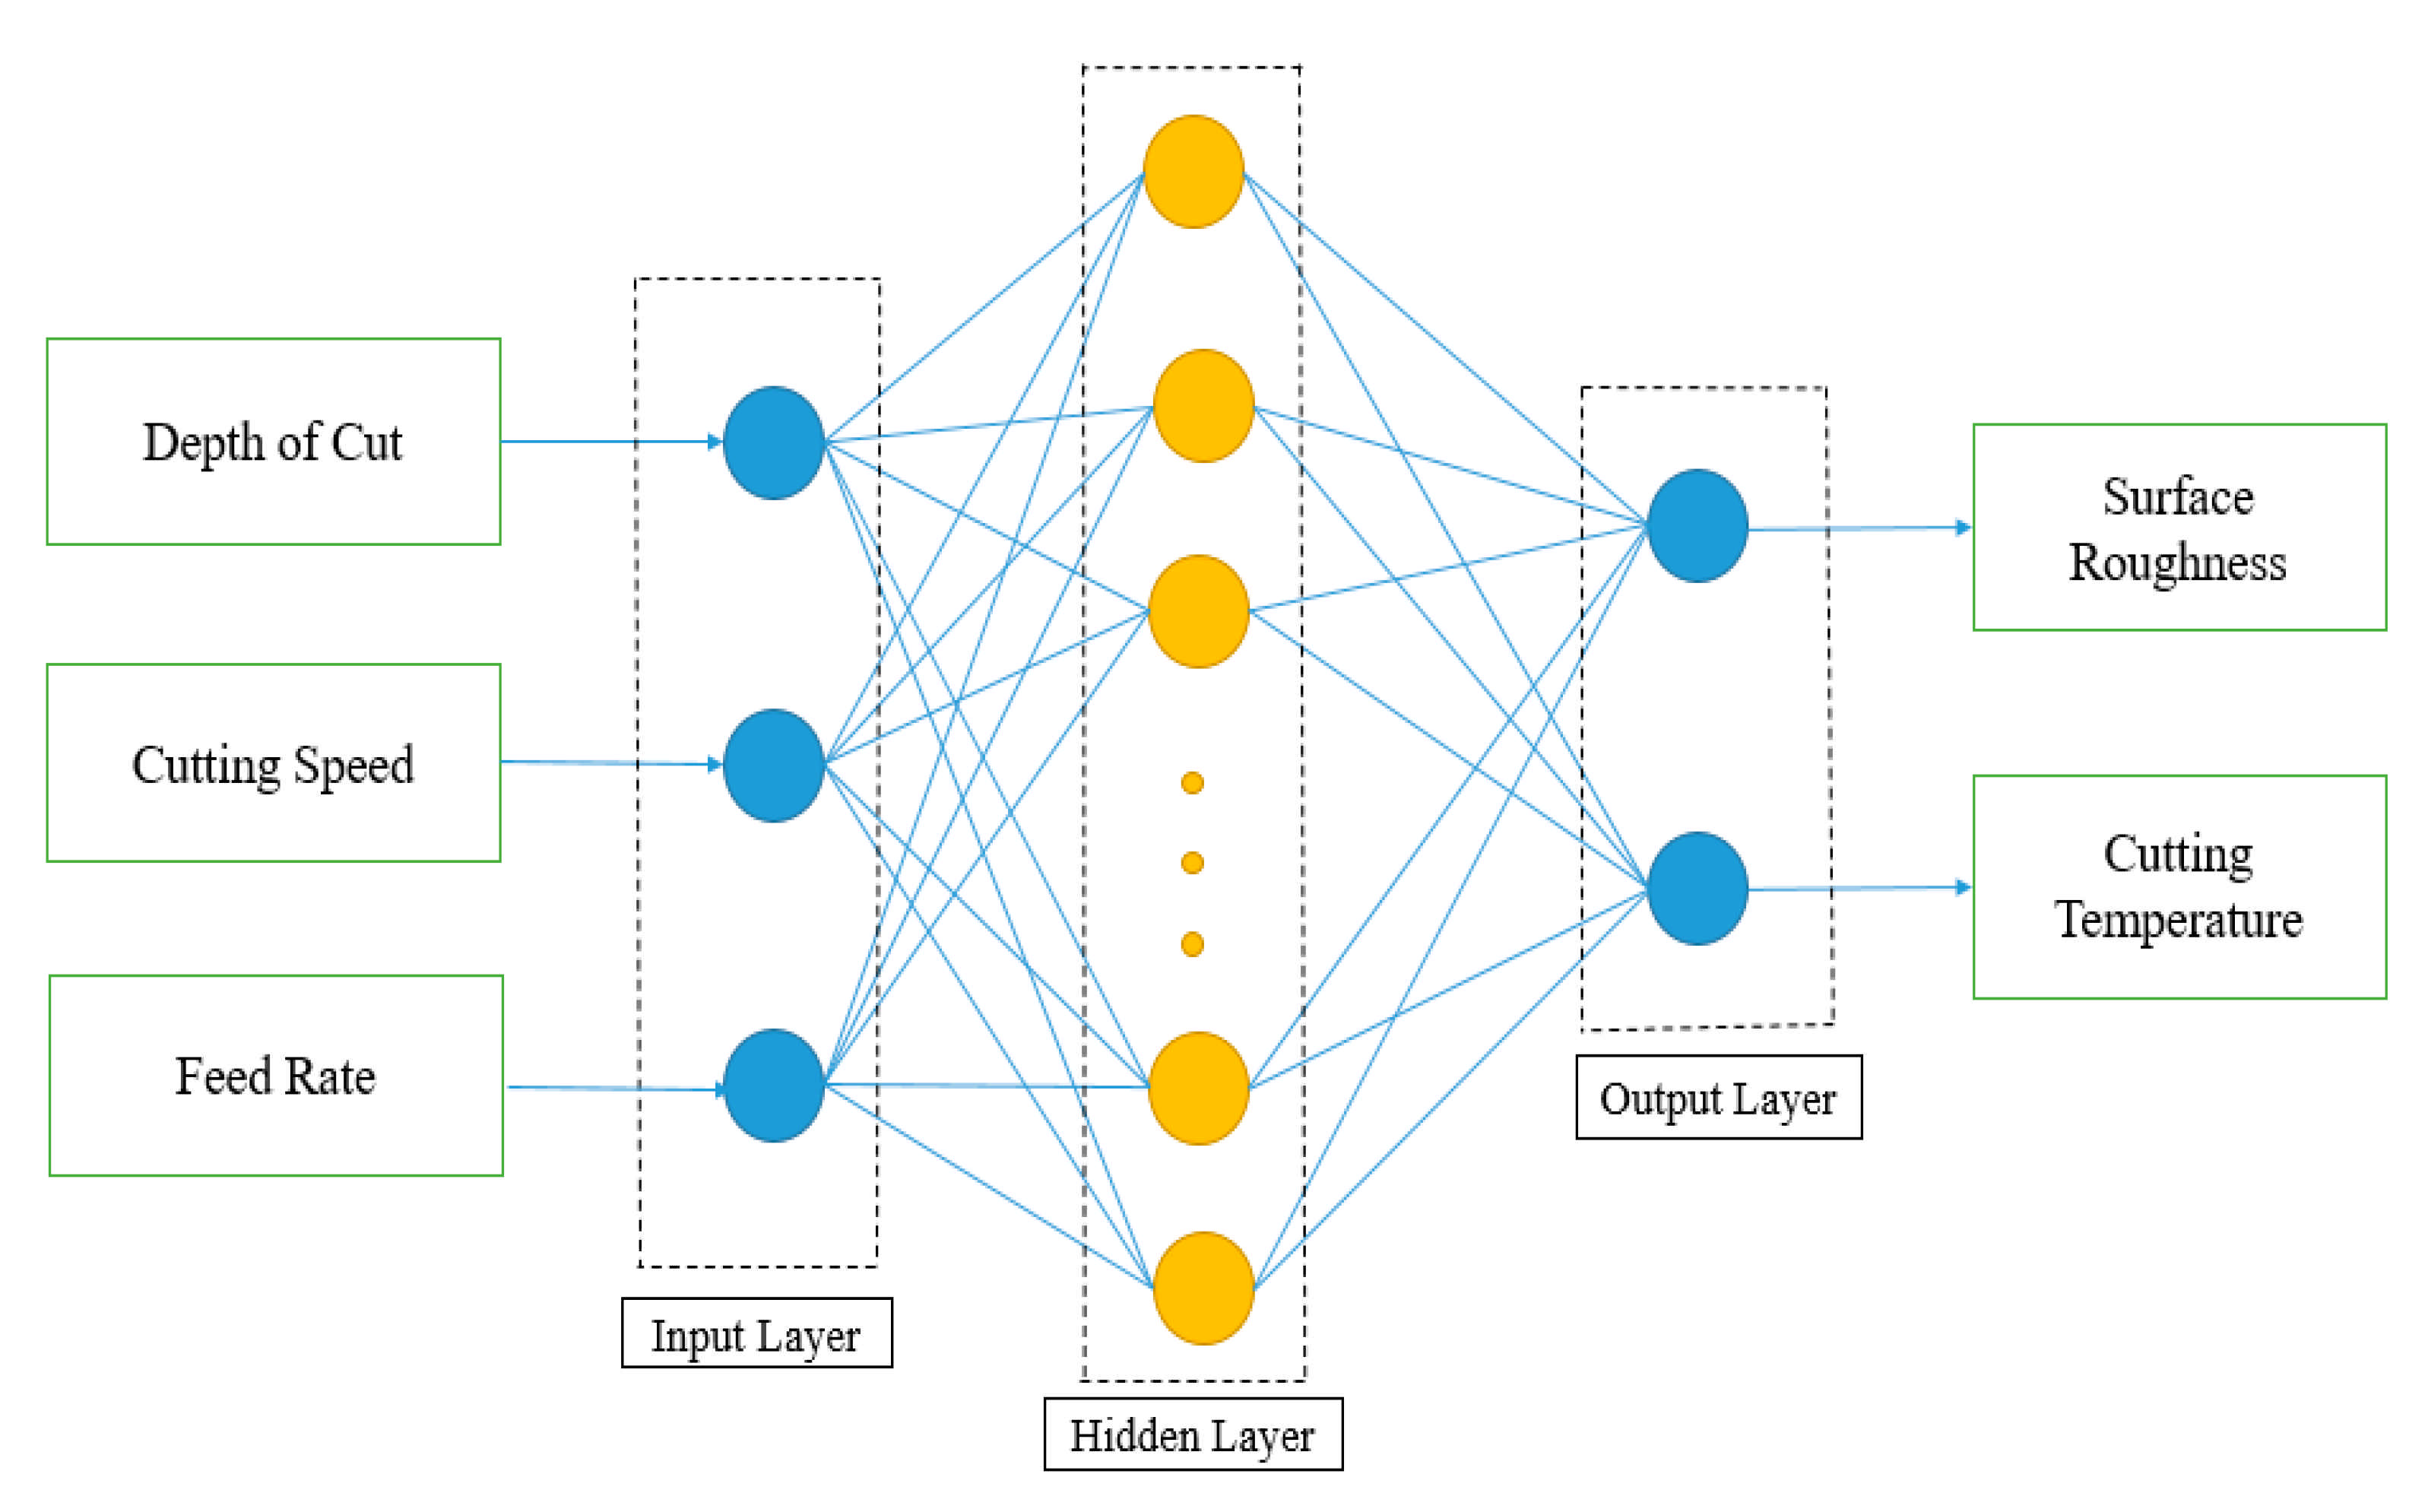
  • To model cutting parameters with ANN and ANFIS;
  • To analyze life cycle and sustainability aspects of MQL-assisted machining of Al-Mg-Zr alloy.
To understand the extent of sustainability analysis on MQL-assisted machining of Al-Mg-Zr alloy, the present study was based on a fundamental analysis of three research questions:
  • Q1: Do cutting parameters significantly affect sustainable responses or not?
  • Q2: Do the cutting parameters differ from optimal settings?
  • Q3: Does a statistically significant interrelationship between parameters contribute to “sustainable machining”?
The rest of the paper is organized as follows: Section 2 details the materials and methods utilized for modeling and optimization, workpiece material, equipment and the instruments used as well as the design of the experiments. Section 3 describes the analysis of results using ANOVA, optimization with the Taguchi method, and multi-objective optimization with DFA, ANN, and ANFIS modeling. Section 4 displays a comparative analysis, including ANN and ANFIS results and life cycle and sustainability analysis, followed by conclusions, limitations, and the future scope of research, in Section 5.

2. Materials and Methods

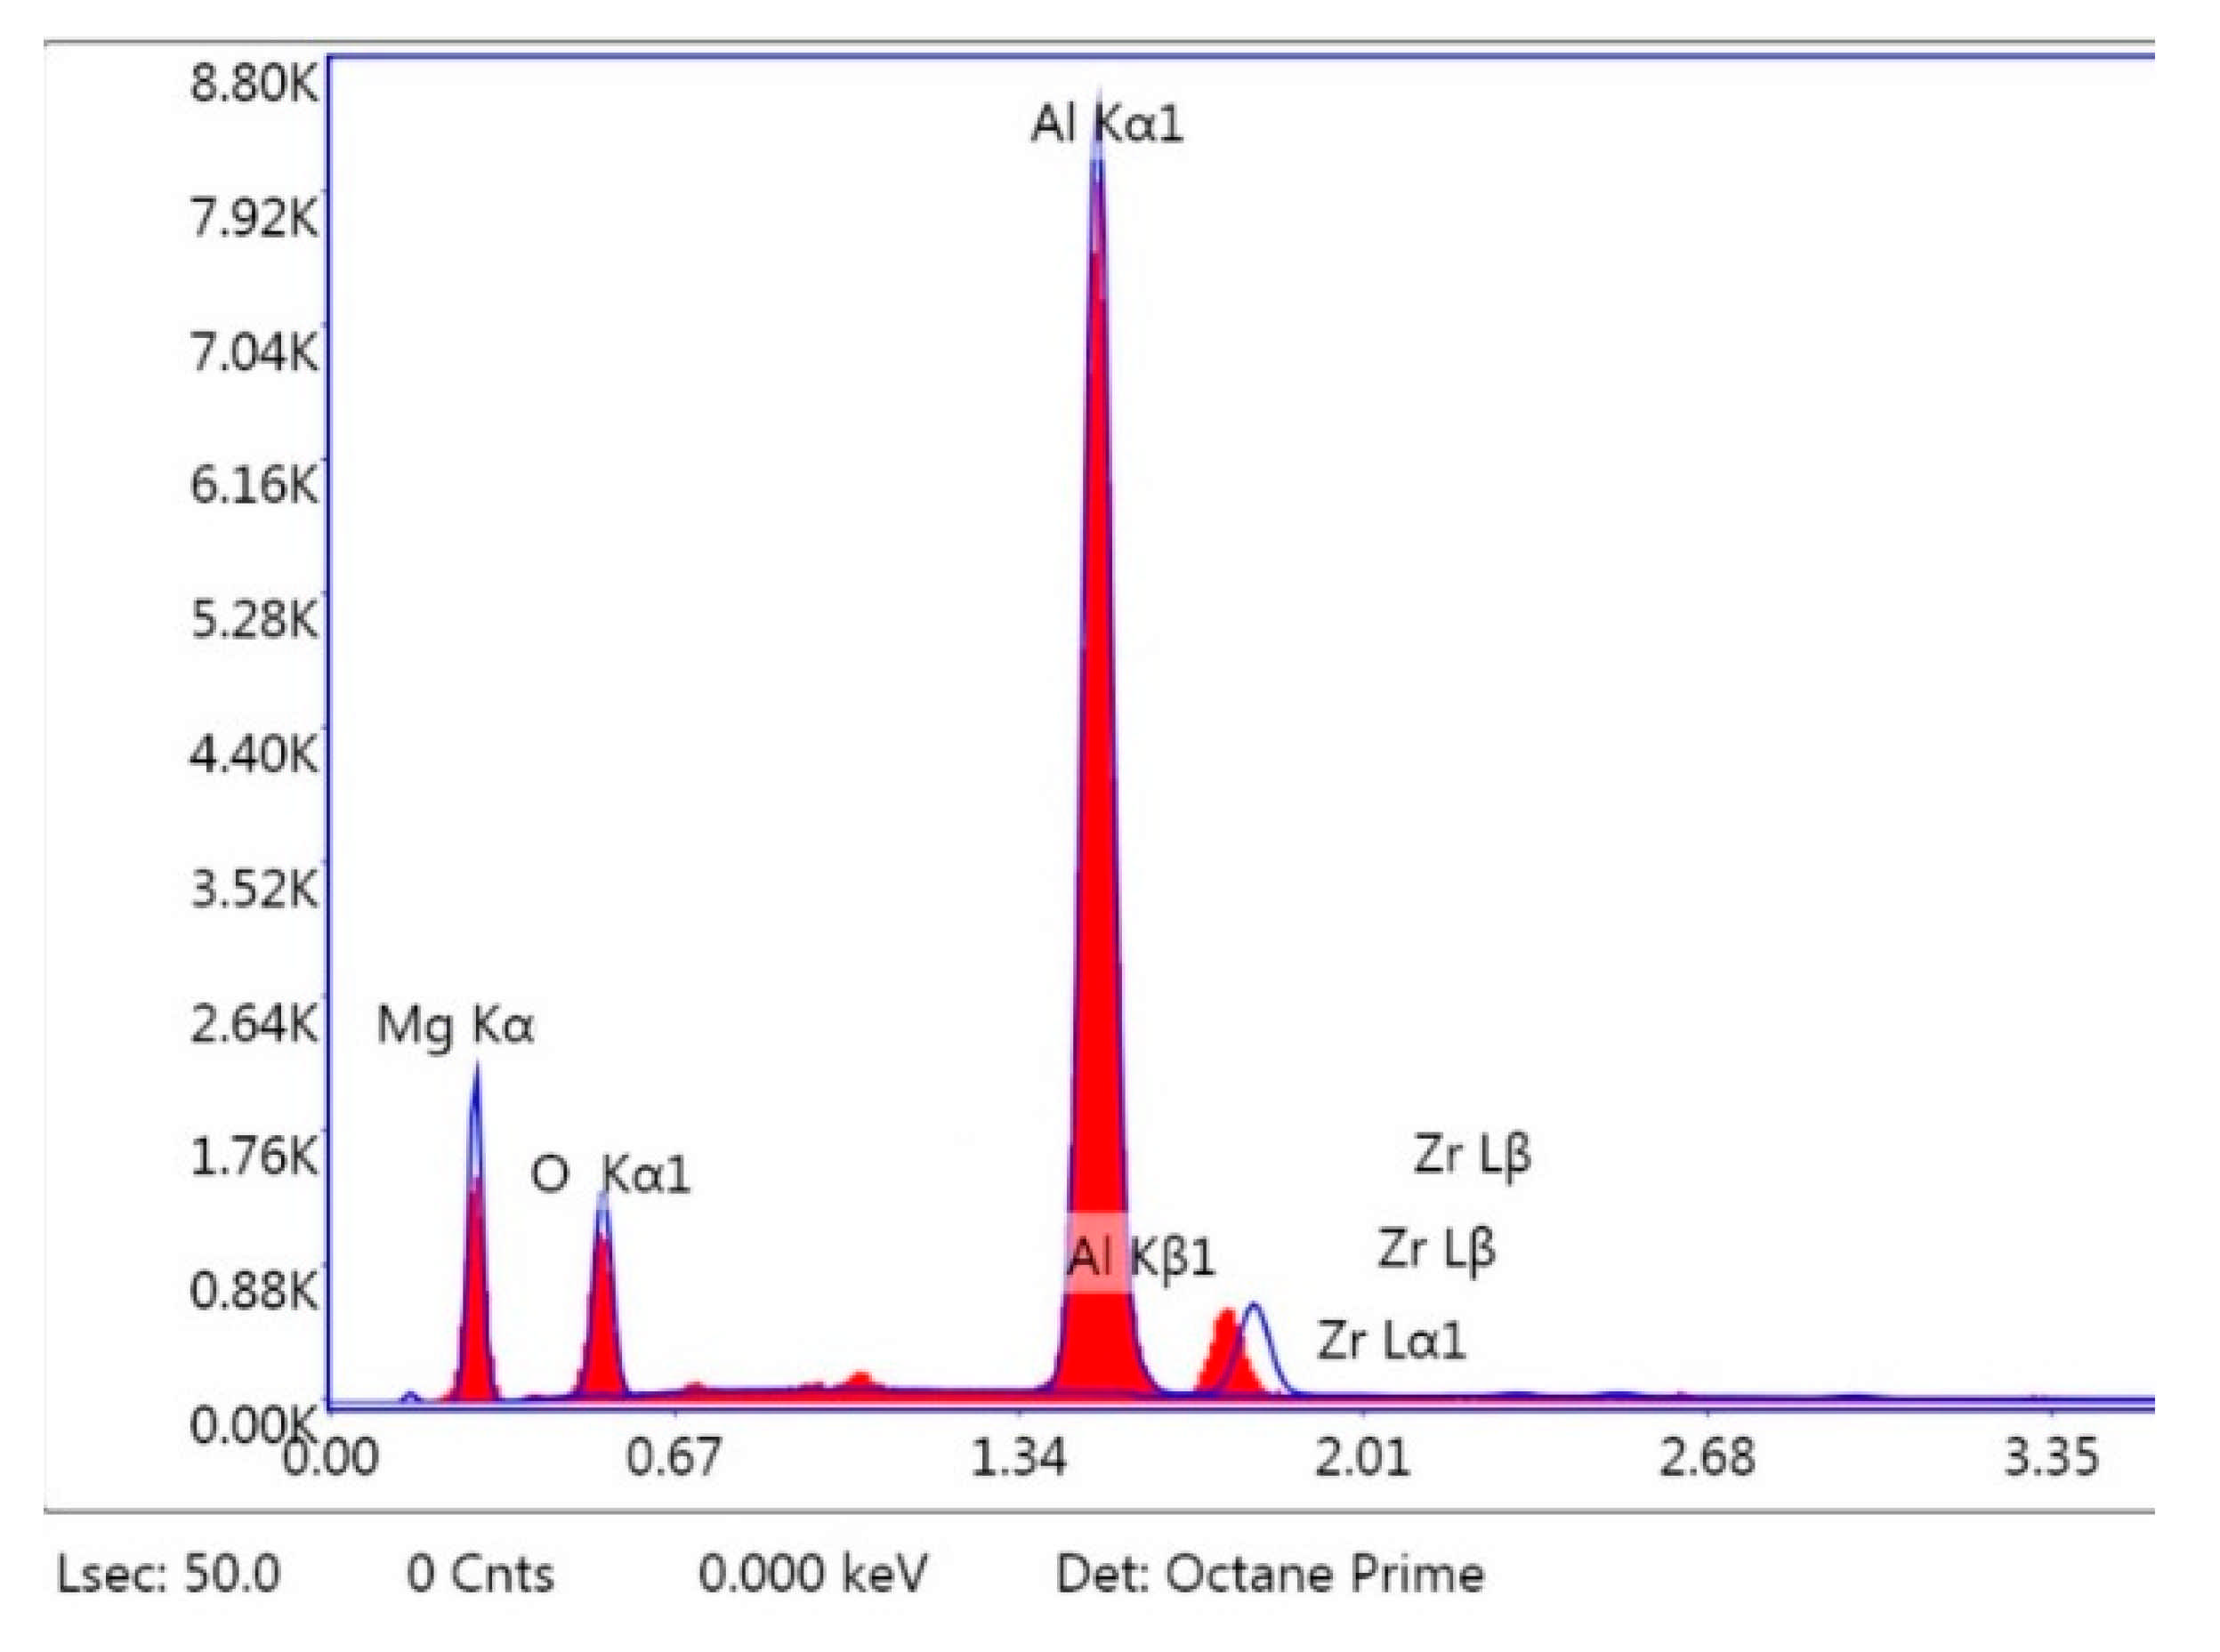
2.1. Workpiece Material and Dimensions

Aluminum, magnesium, and zirconium were used in this work. A stir casting process with an RPM of 600 was used to prepare the alloy. EDX analysis was carried out to obtain the developed alloy composition, as shown in Table 1 and Figure 1. A cylindrical-shaped alloy was prepared for turning operations, with a length of 305 mm and a diameter of 70 mm.

2.2. Cutting Inserts

An SNMG 120408 polycrystalline diamond (PCD) cutting insert with a nose radius of 0.8 mm under minimum quantity lubricant (MQL) cutting conditions was used in the turning process using a center lathe.

2.3. Equipment and Instruments

The roughness was measured using an optical surface profilometer. Each measurement was repeated three time to reduce the error and the mean arithmetic average value was collected.
During the experiments, a thermocouple was used to monitor the cutting temperature. In addition, a digital multi-meter was used to record the electromotive force (emf) in millivolts, with one end of the multi-meter attached to the workpiece and the other end to the tool. The thermocouple calibration maintained the temperature measuring accuracy using comparison techniques. The calibration procedure was achieved according to the ASTM E220 standard test method by trained lab technicians [42].

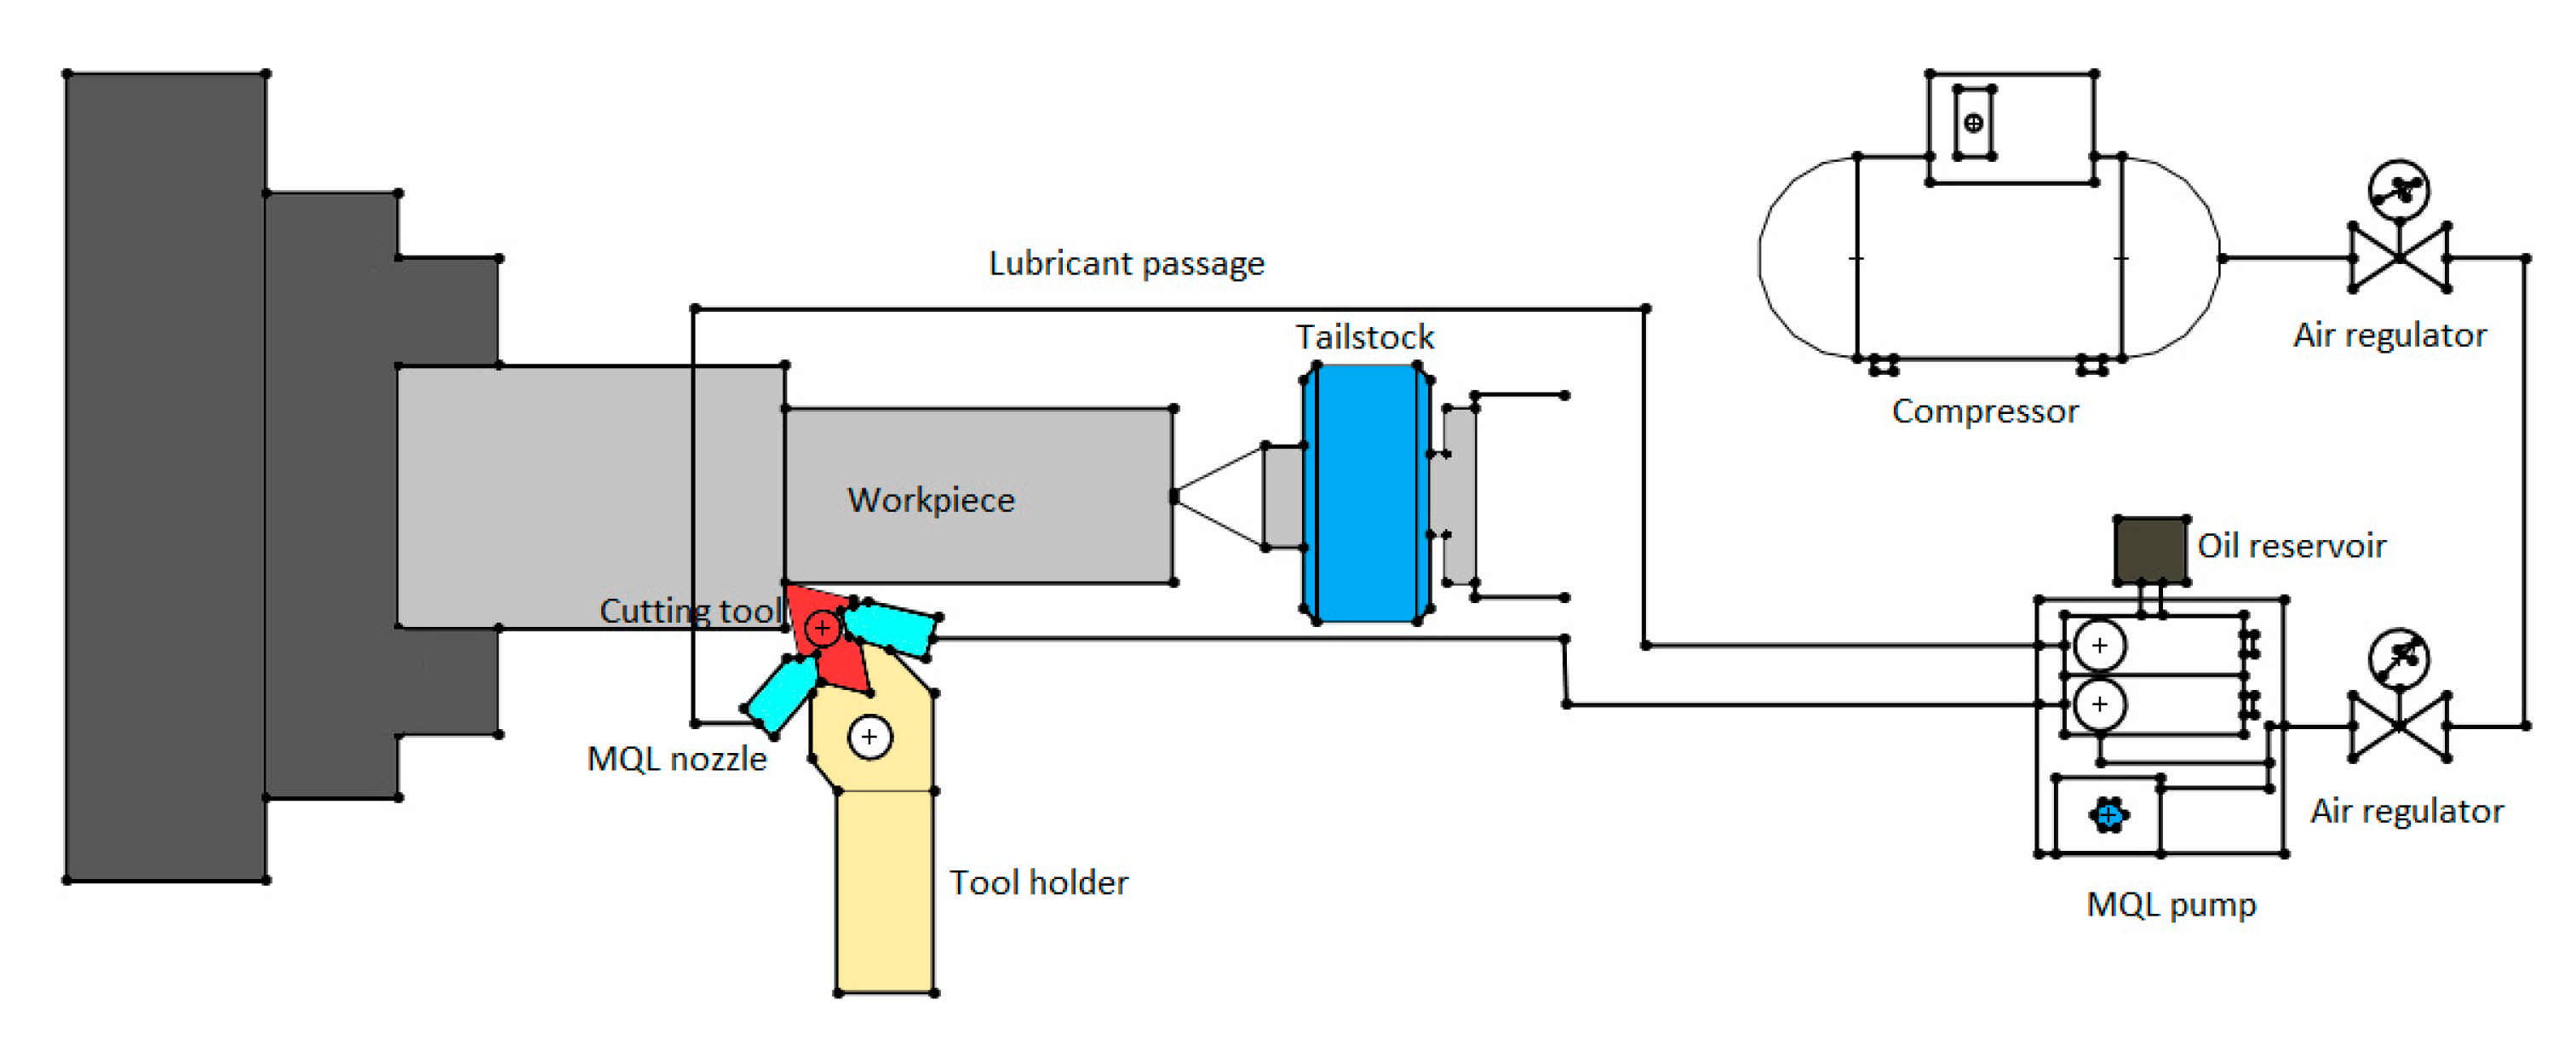
2.4. Experimental Setup and Design of Experimentation

Experiments were performed according to Taguchi’s methodology [43]. The cutting parameters, such as cutting speed (Vc), feed rate (S0), and cutting depth (t), using five different levels, were considered. The experiments were conducted to decide the cutting parameter levels along with the tool manufacturing suggestions and the machine tool capacity using an L-25 OA array. The optimization was performed using desirability function analysis, as reported in previous research [44]. The cutting parameters and the allocation of the different levels are shown in Table 1. The standard L25 OA as per the cutting parameters levels is shown in Table 2. Each experiment was repeated three times as designed, and the average values of the responses for surface roughness (Ra) and cutting temperature cutting (θ) are shown in Table 3. Figure 2 presents the experimental setup and the method used for the study. The pressure was kept at 8 bar, and the flow rate during machining was kept constant at 120 mL/h.

2.5. ANFIS and ANN Based Predictive Modelling

The adaptive fuzzy inference system (ANFIS)-based network is a hybrid architecture comprising neural and fuzzy logic systems. An information-based technique is used in a neural network stage to provide function-approximation problems [33]. First, a fuzzy inference method with an initial fuzzy model is established, taking into account the fuzzy rules extracted from the input–output data. Then, the neural network is used to fine-tune the built-up original fuzzy model’s rules in the next step.
A Sugeno (output is linear or constant) type ANFIS model is used in the present work. The experiment takes three input parameters (depth of cut, cutting speed, and feed rate) and two output parameters (surface roughness and cutting temperature) into consideration. The ANFIS model is constructed using a Gaussian membership function (Gaussmf) with three membership functions for all input parameters and a linear membership function for the output parameter. The hybrid approach is used to maximize parameter performance.
ANN is a common prediction tool that helps to calculate various outputs from different parameters. ANN has three interconnected layers, and core features of the artificial neural network are its learning ability and the various learning algorithms [33]. To get a minimal variance between the experimental values and the output values, it is essential to decide the best learning algorithm and the optimum number of neurons.

2.6. Data Collection for Sustainability Analysis

PPC-3 power meter load controls were utilized to calculate energy consumption during different phases of machine tooling. In order to obtain the electrical energy consumption in various process stages (functional states of the machine tool), the estimated power was compounded by a known time frame. In the measurement of the lubrication capacity, a smart meter was used. The intelligent meter consisted of Raspberry Pi-3 and a Smart-Pi, keyboard and mouse, an HDMI adapter and a micro SD card. In addition, the proposed uniform approach calculates carbon emissions, as reported in a previous study [45].

3. Results and Discussion

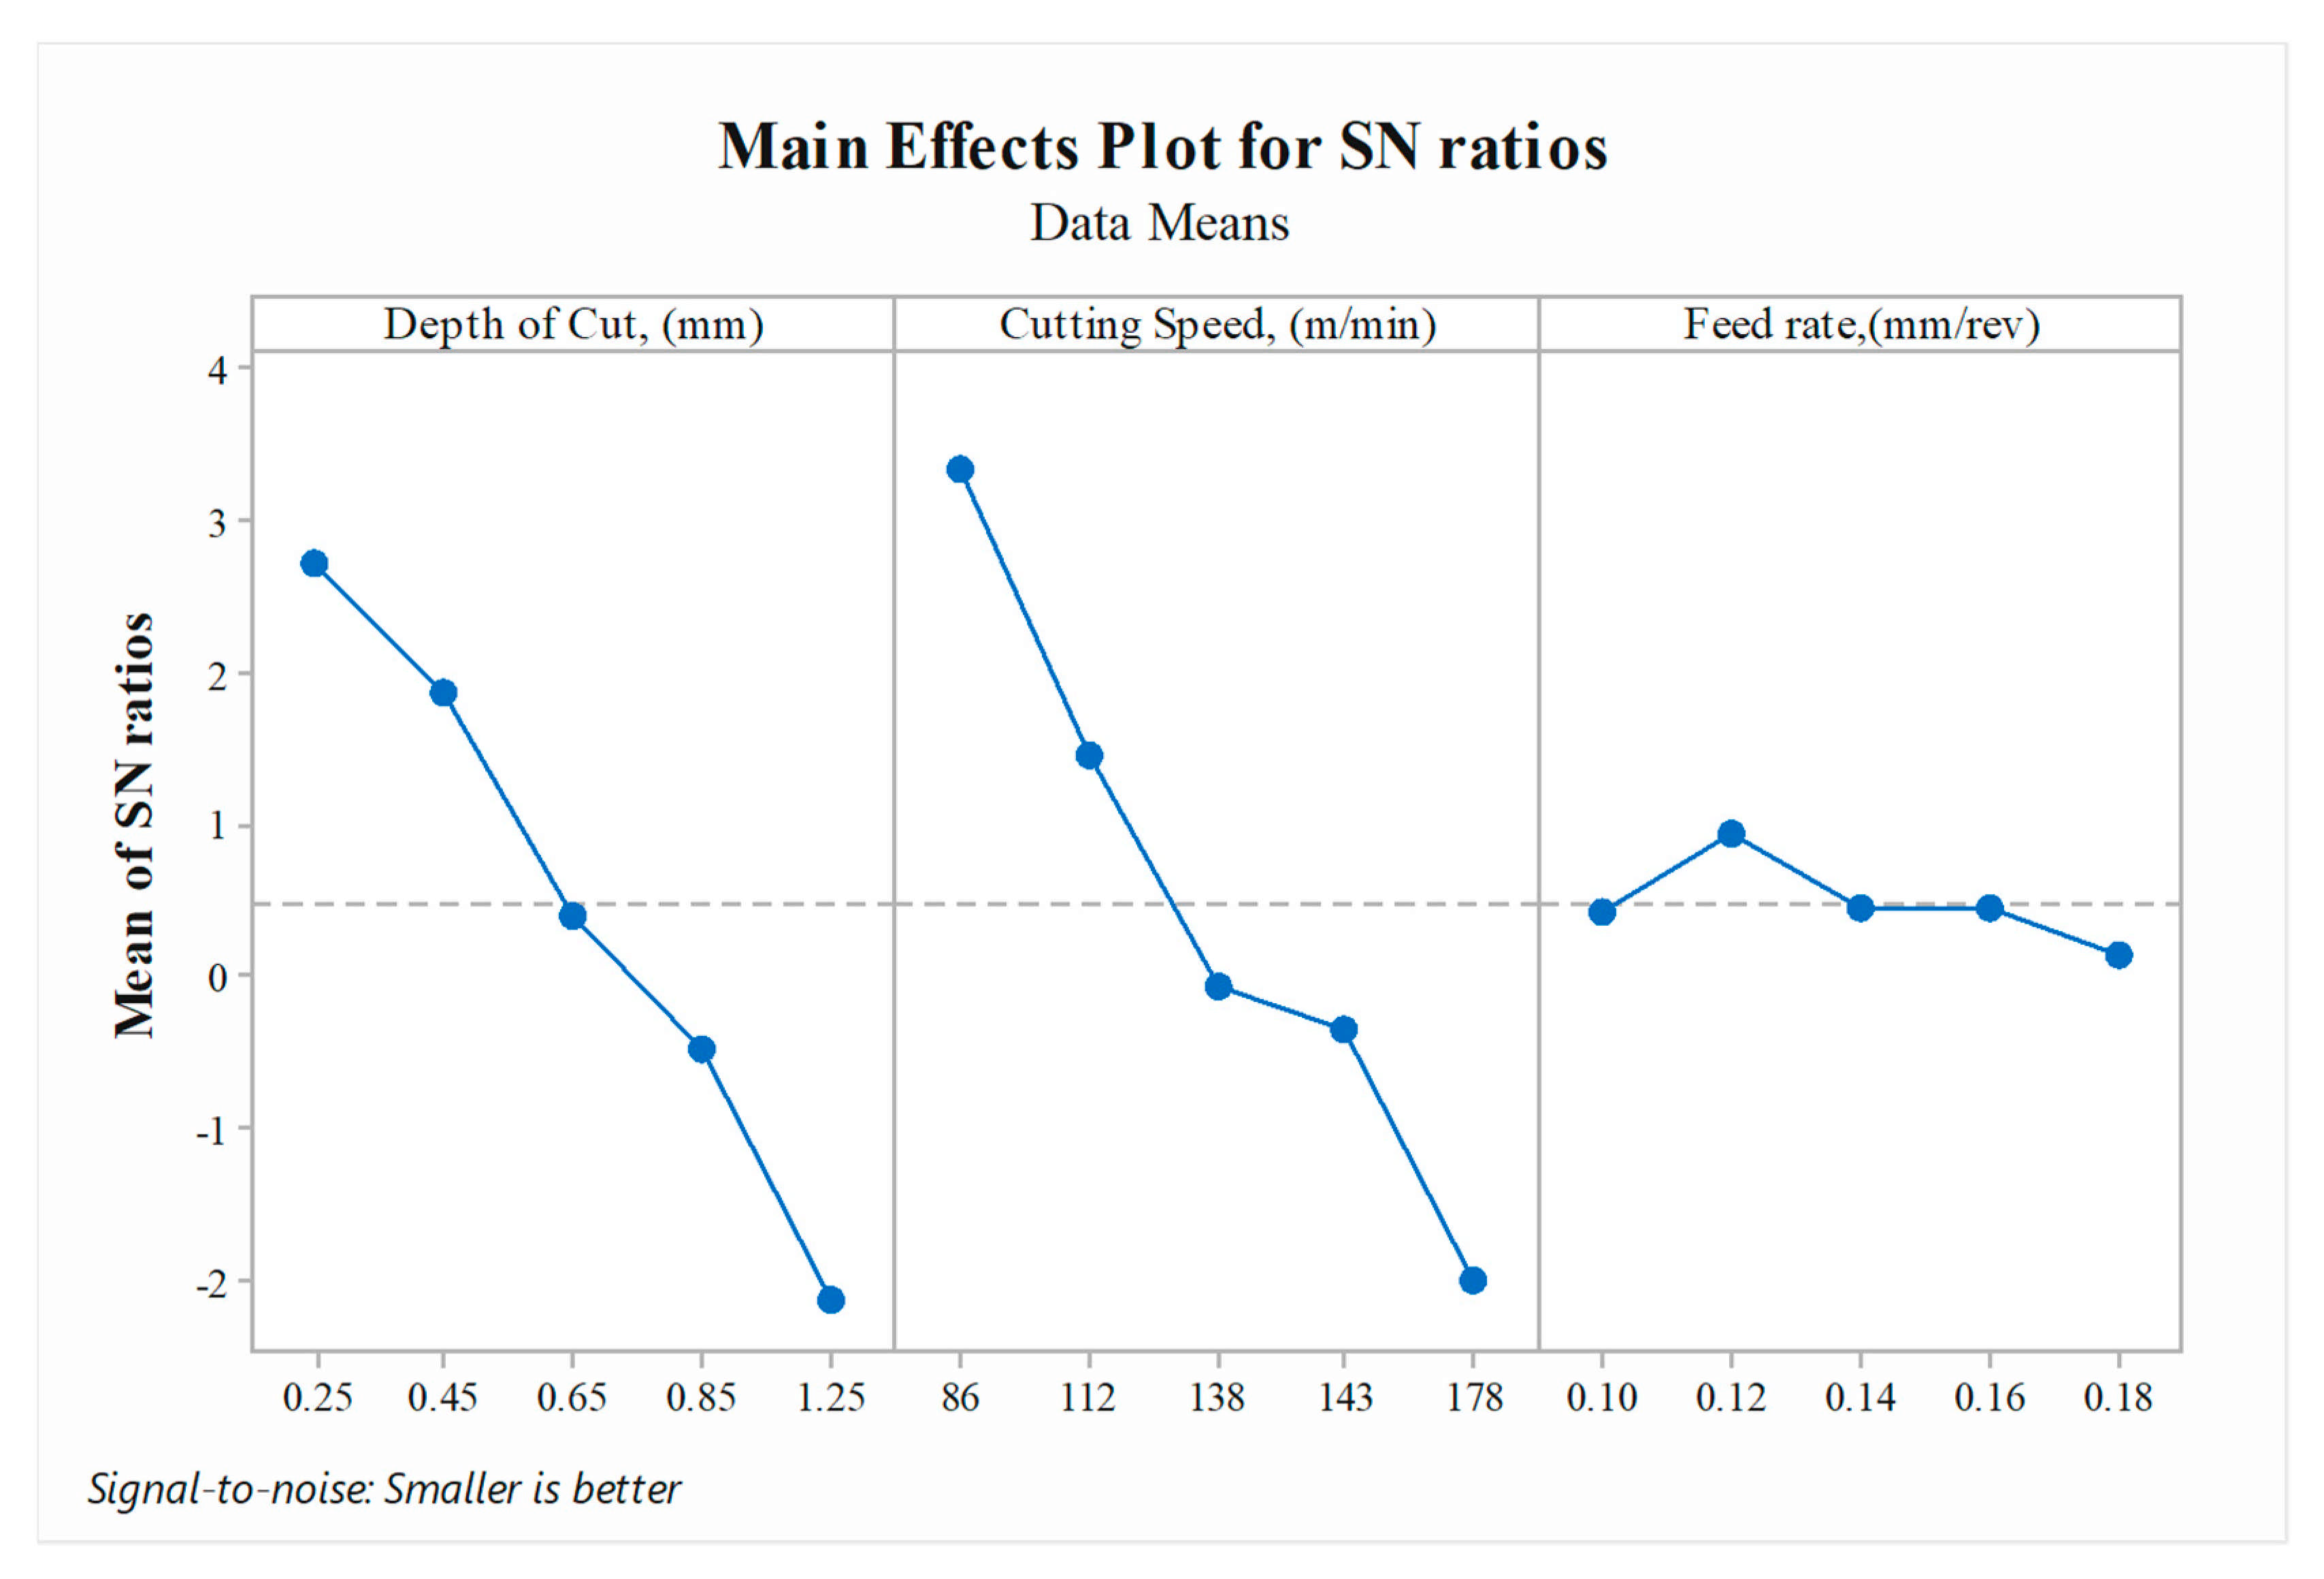
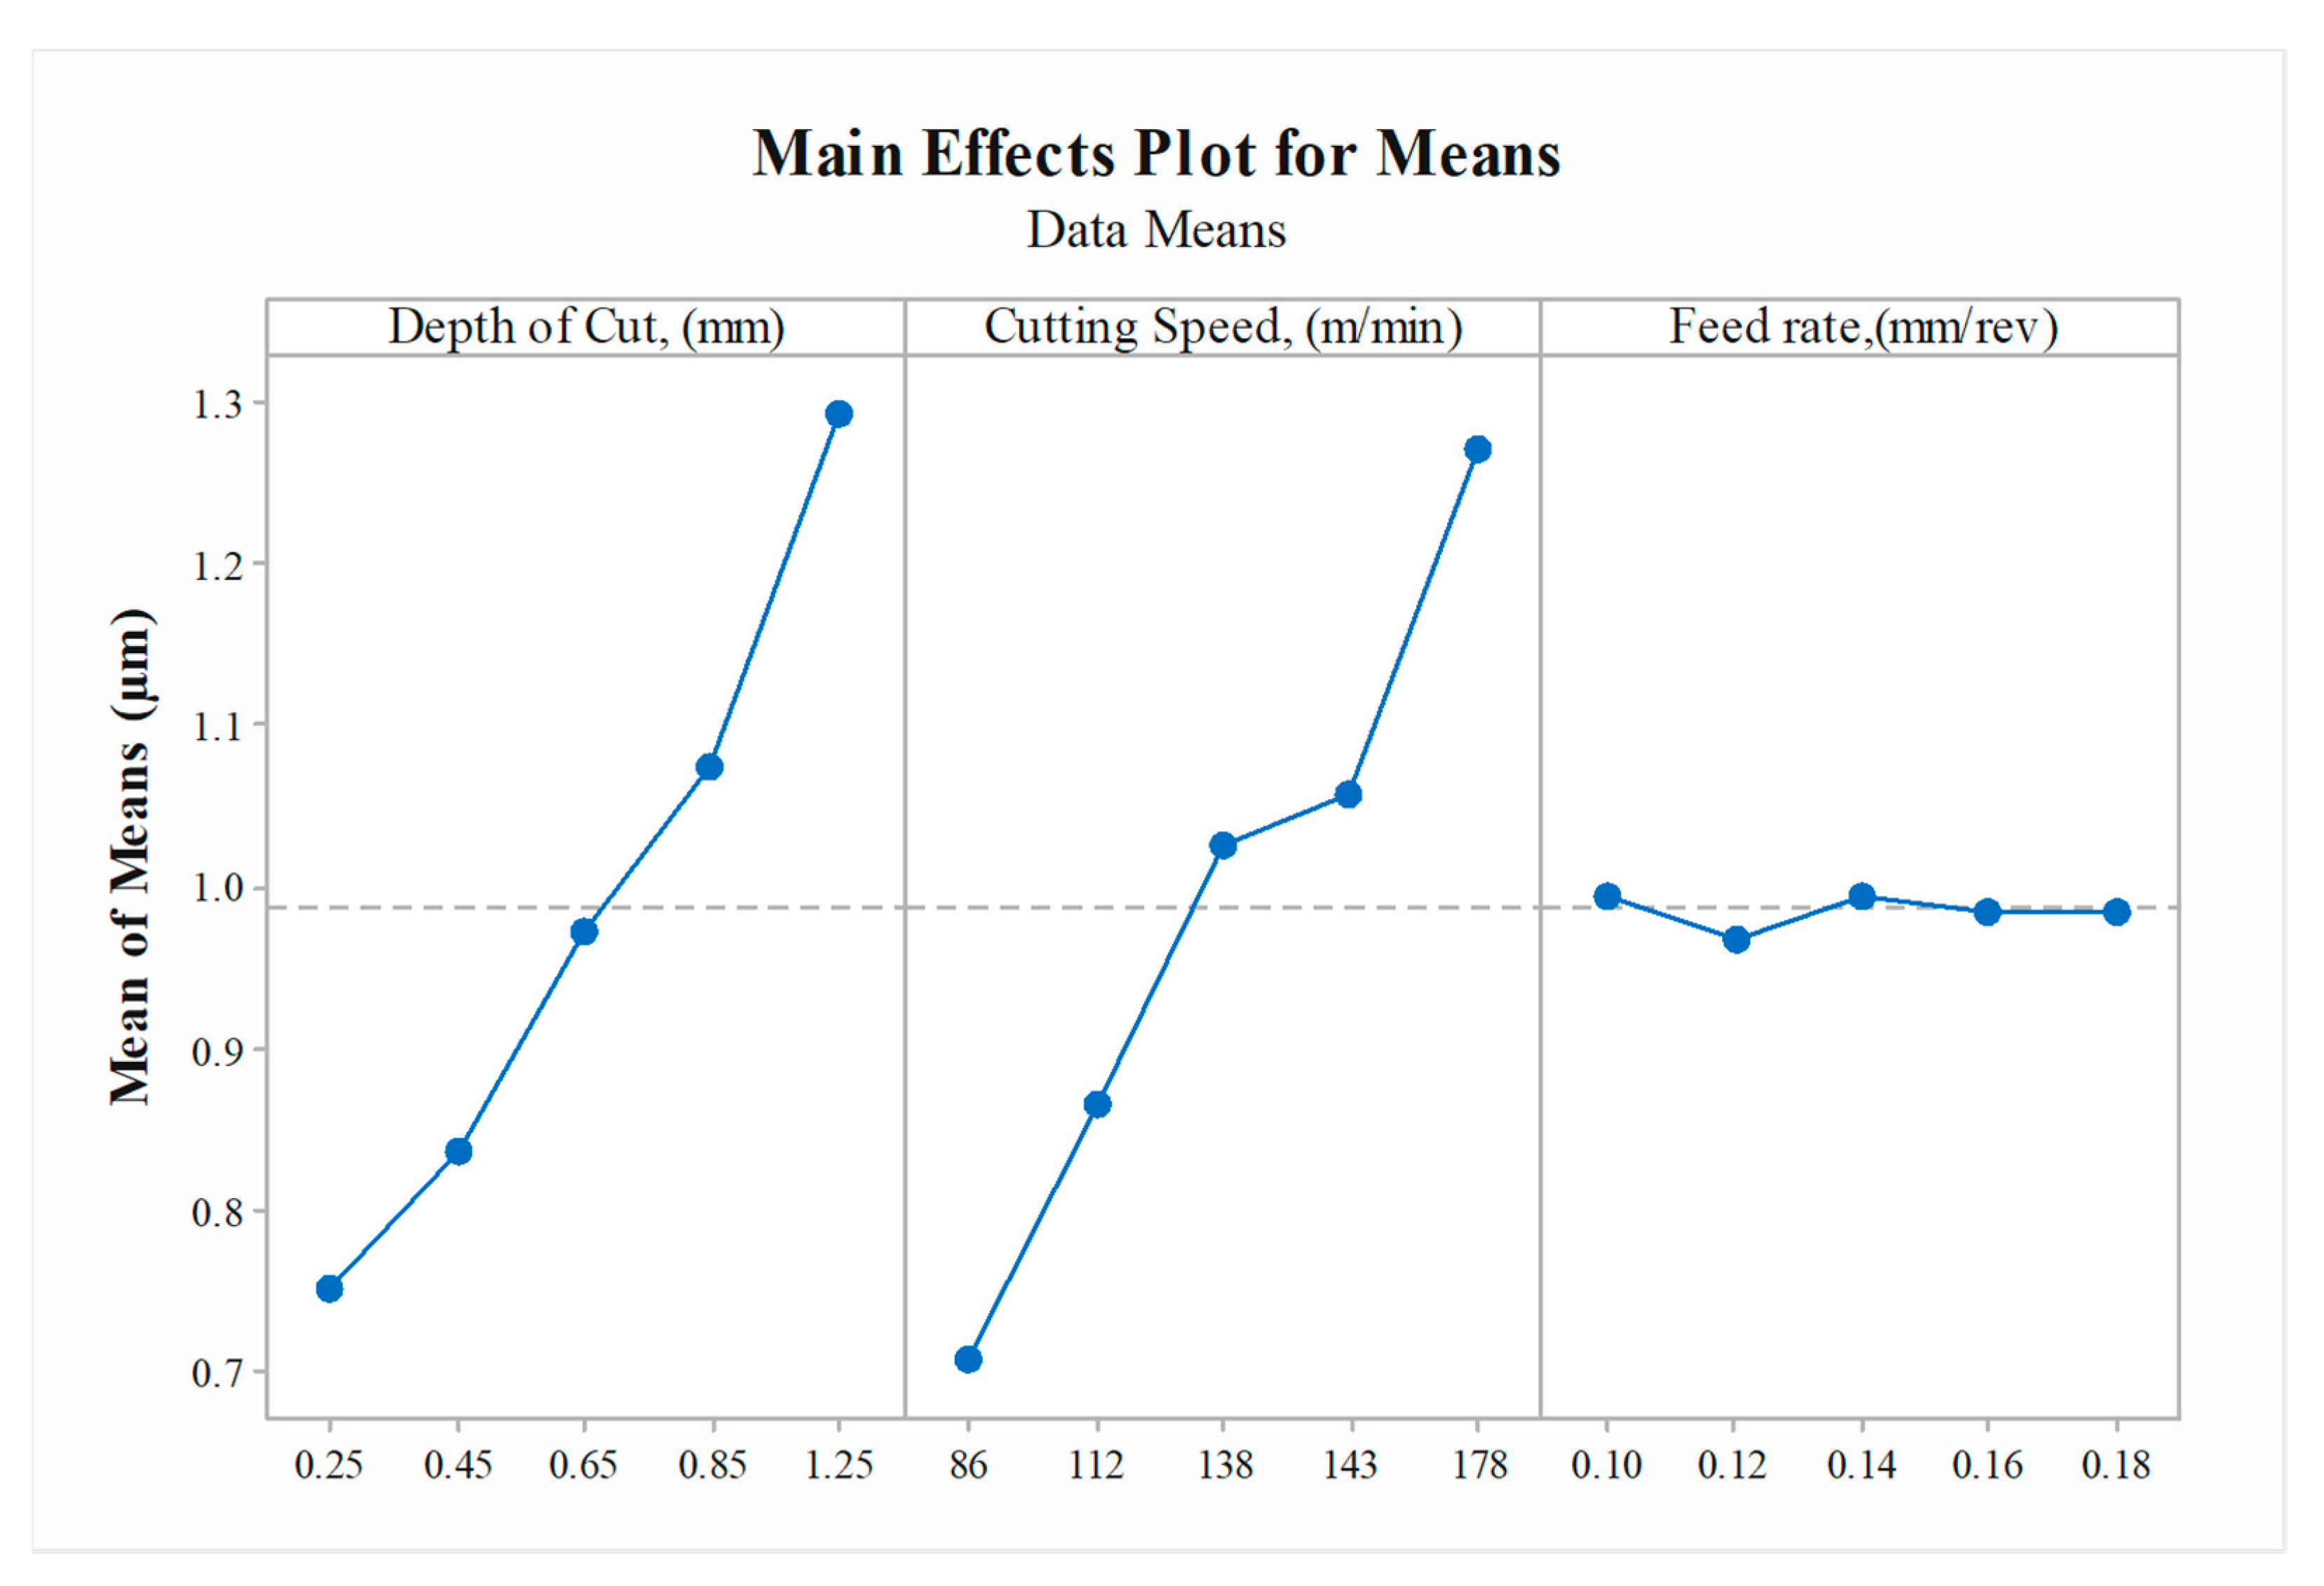
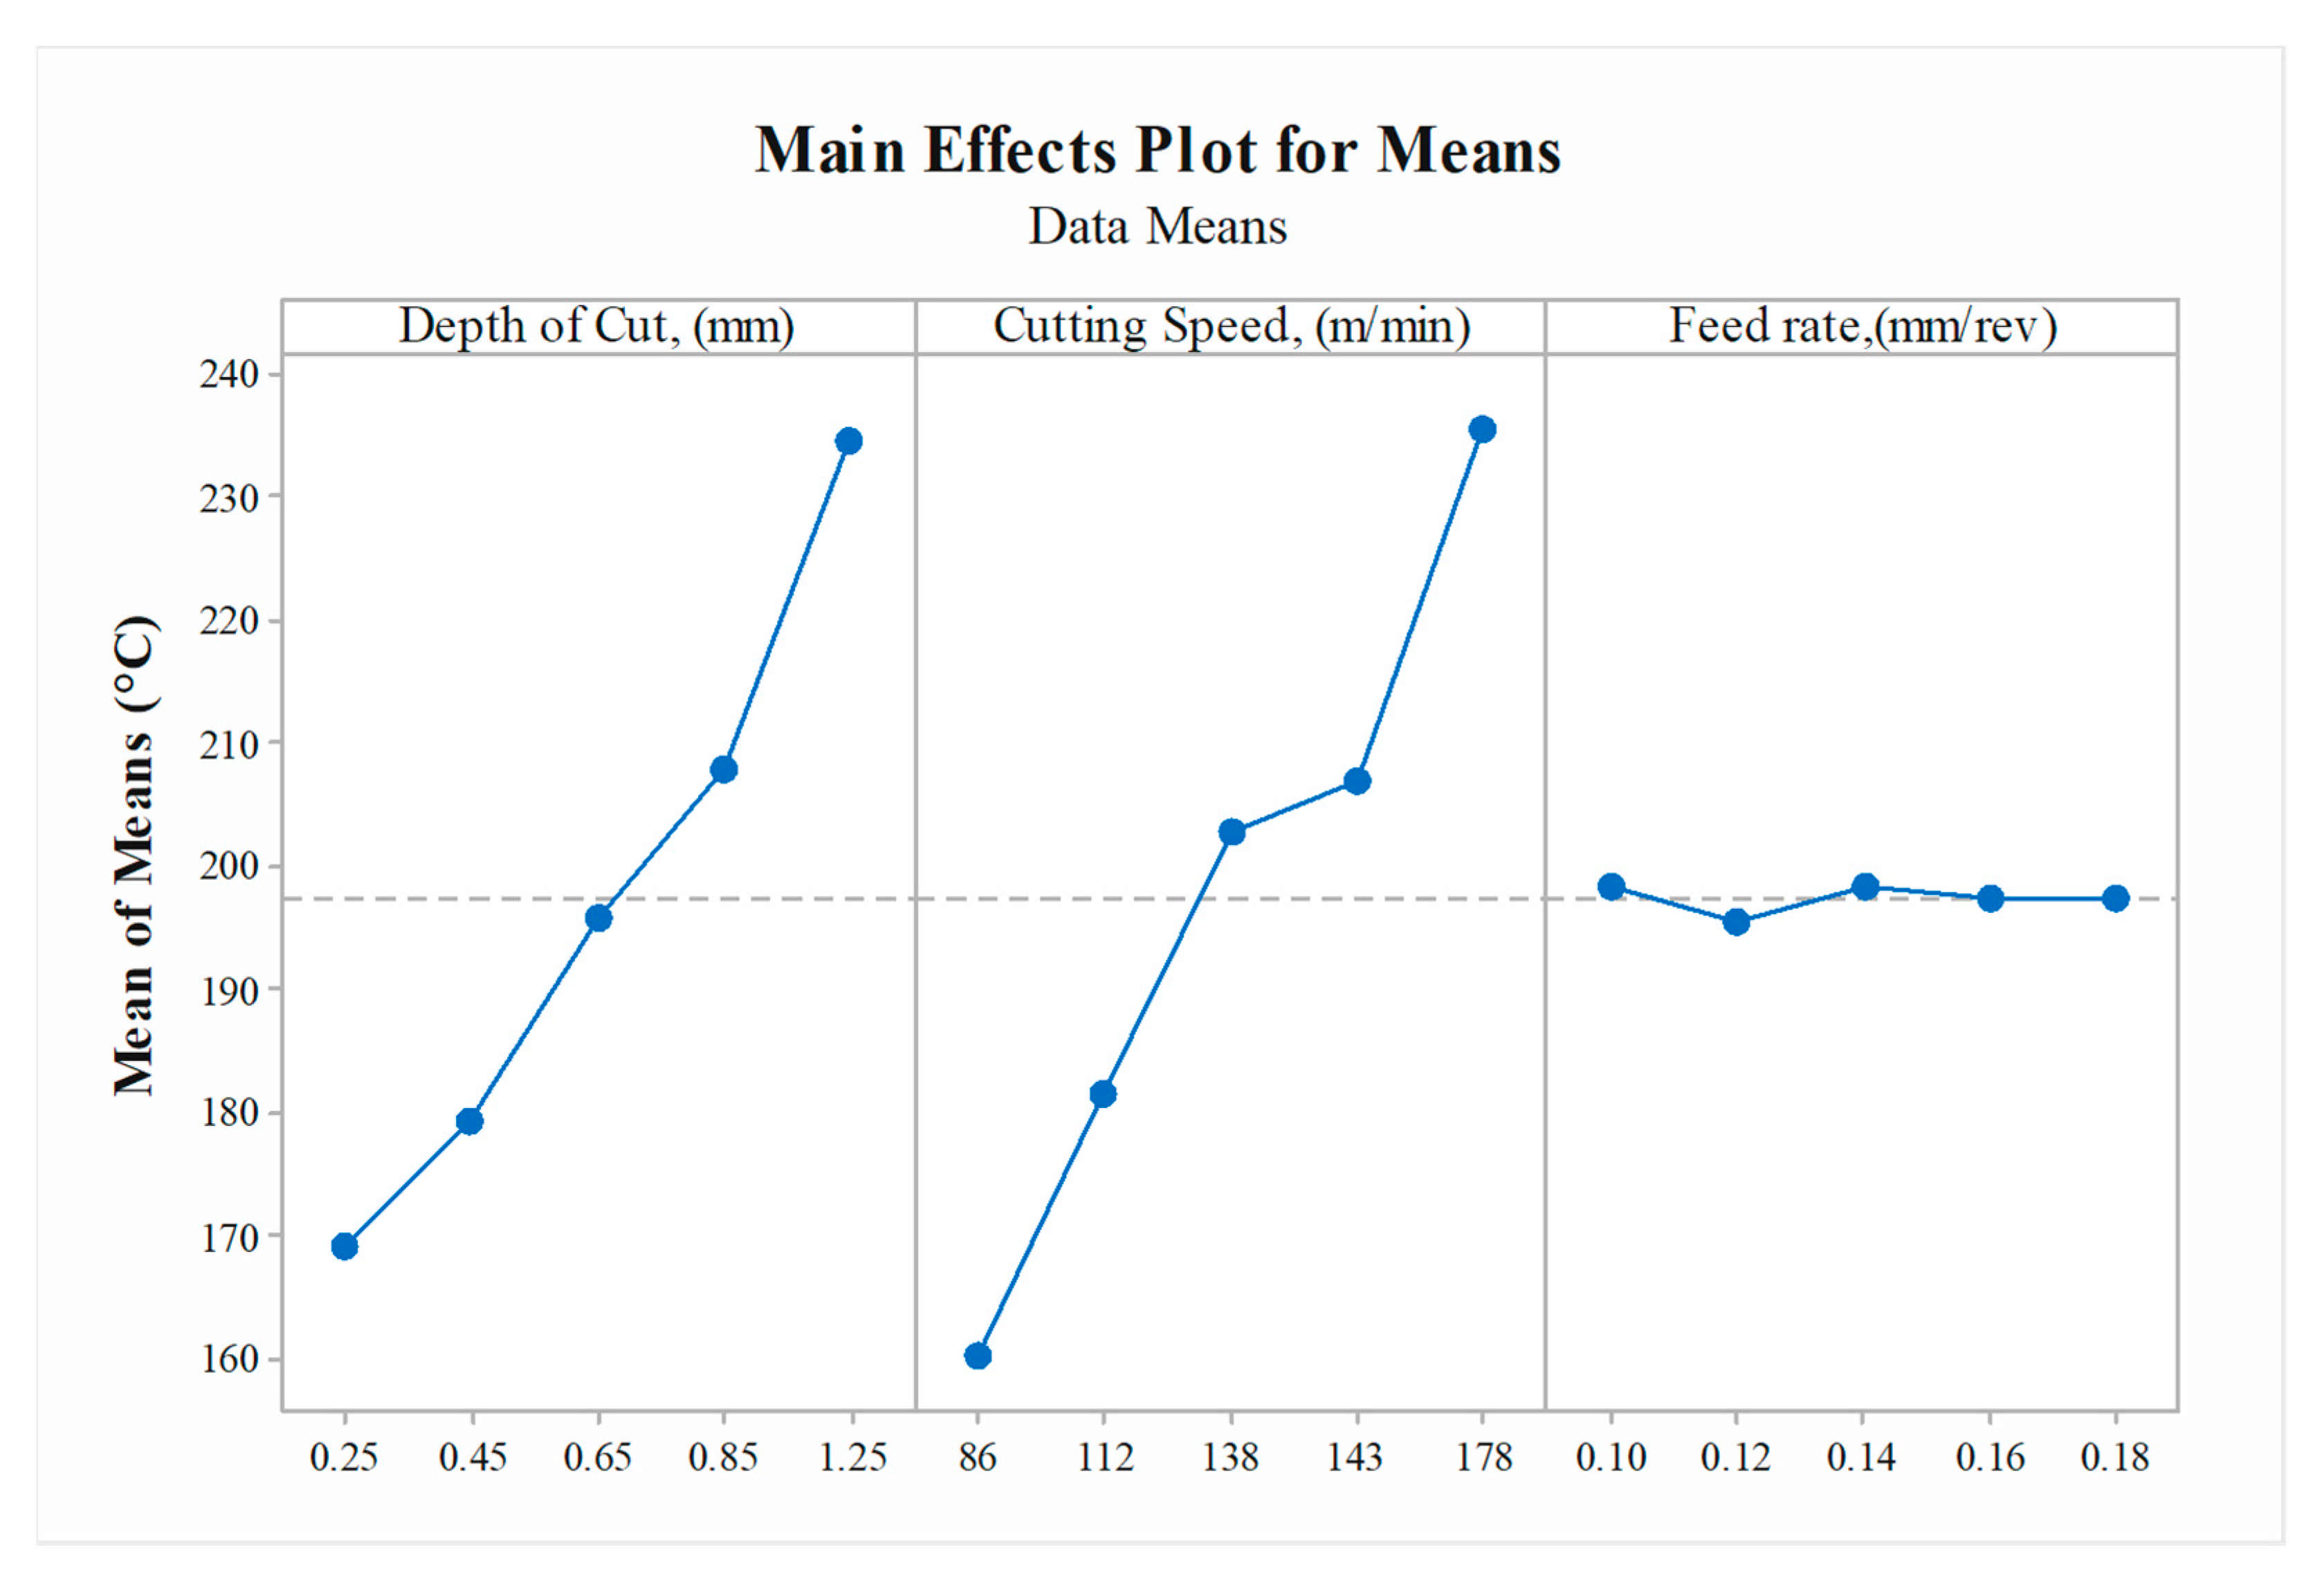
3.1. Effect of Process Paramters on Surface Roughness and Cutting Temprature

An SN ratio shows the influence of each input variable parameter on each regulated parameter level, and the parameter has an impact on the surface roughness and cutting temperature. Since a higher SN is closer to a higher quality, a bigger SN ratio is better. Both Table 4 and Table 5 demonstrate that cuts at speeds ranked 1, followed by cutting depth rank 2, had the least impact on the results and the feed rate, as the cutting parameter affected the surface roughness most effectively and the cuts in the temperature quality were in accordance with the SN ratio.
Figure 3, Figure 4, Figure 5 and Figure 6 correspondingly show the principal effect parts for the mean and SN ratios of surface roughness and cutting temperature. It is usually preferable to increase the value of the SN ratio; hence, the ideal cutting conditions can be attained when the SN ratios are highest in all three entry parameters. The primary SN ratio effect plot (Figure 3 and Figure 5) shows that a low roughness and cutting temperature reached at a 0.25-mm cutting depth, 86-m/min cutting speed and a feed-rate of 0.12 mm/rev. Figure 4 and Figure 6 show that the ideal value at a cut-through depth of 0.25 mm, 86 m/min cutting speed and 0.12 mm/rev feed rate was seen for reduced surface roughness and cutting temperature. In order to get the optimum assessment of both surface roughness and cutting temperature, it was proposed that a lower cutting depth, lower cutting speed and low-to-moderate feed rate need to be used.

3.2. Analysis of Variance (ANOVA)

In this study, ANOVA was performed for the response of surface roughness and cutting temperature. The sum of the squares (SS), the degrees of freedom (df), the mean square (MS), the F-value, and the p-value for all input variables are shown in Table 6 and Table 7 for the MQL-aided cutting conditions. p-values below 0.05 indicate that the terms of the model are noteworthy for both responses. Moreover, it is easily understood from the analyses that the cutting speed and the depth of the cut are the most prominent factors, which is aligned with the results of the S/N ratio analysis. Thus, both the method factors can give an assertion about selecting the dominant factor affecting the process.

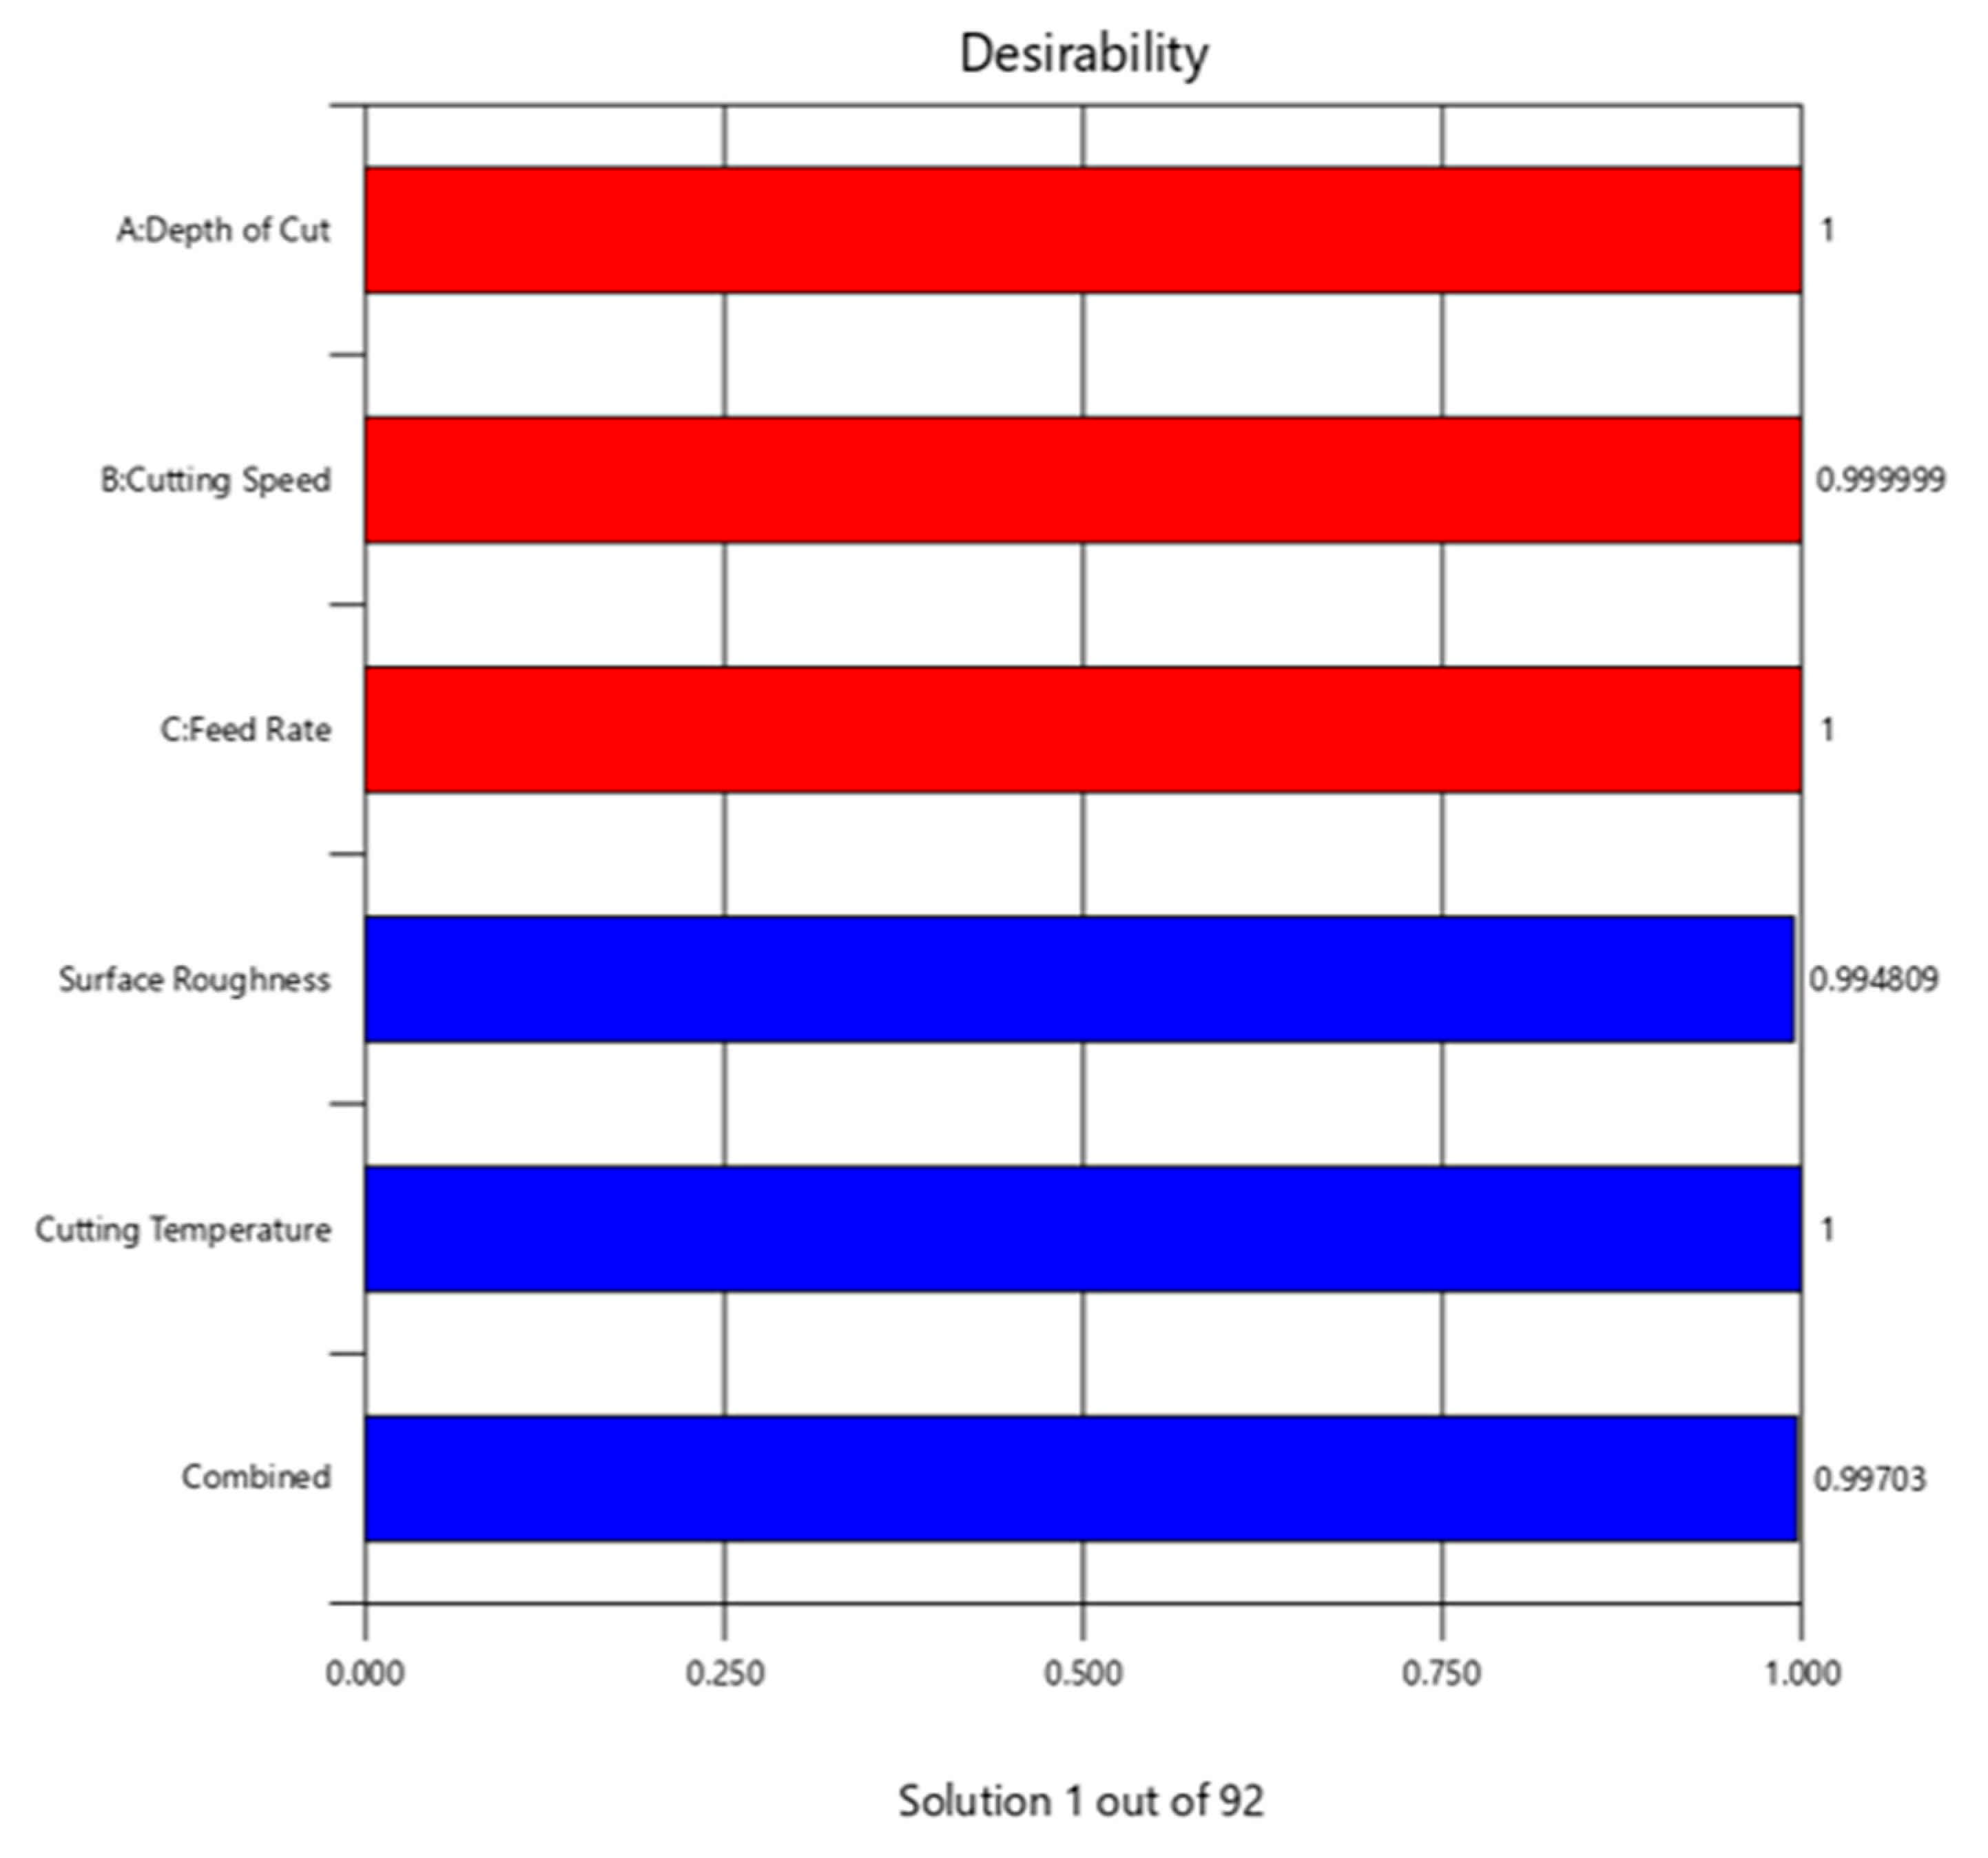
3.3. Optimization Using Desirability Function Analysis (DFA)

Multi-response optimization aims to determine the independent variable conditions that lead to optimal or nearly optimal values for the response variables. In this desirability function analysis, minimizing surface roughness and cutting force was the prime objective. Factor ranges defined for the basic optimization are shown in Table 8. A summary of the optimization to fulfil the essential purpose of minimizing the response parameter is demonstrated in Table 9 and Figure 7.

3.4. Proposed ANN Model

Various learning algorithms, such as LM, CGP, SCG and BFG, are used to determine the most appropriate learning algorithm for predicting surface roughness and cutting temperature. The number of hidden layers were modified to 9, 12, 15, and 20 to achieve the best possible proximity to the experimental results. For an increasing number of hidden layers, the response parameter values were calculated using the correlation coefficient (R2) comprising all four types of learning algorithms. Of all the algorithms, the LM algorithm was best suited for the training data of the surface roughness and cutting temperature. At the same time, SCG was the most suitable algorithm for testing data collection. When testing with cutting temperature experimental data collection, barring the best network structure for checking the cutting temperature data, i.e., 3-15-2, the best network structure for the remainder of the data set was 3-9-2, as shown in Figure 8. The proposed ANN structure showed that it has three neurons (depth of cut, cutting speed, and feed rate) in the input layer, nine neurons in the hidden layer, and two neurons in the output layer (surface roughness and cutting temperature). In Table 10, the statistical values of the learning algorithm responses are given.
In this study, 25 experimental data points were arranged for training and testing purposes. Thus, 72% of the data was used for training purposes, while 28% of the data was used for testing purposes; 18 datasets were used for training, and the remaining 7 datasets were used for testing.

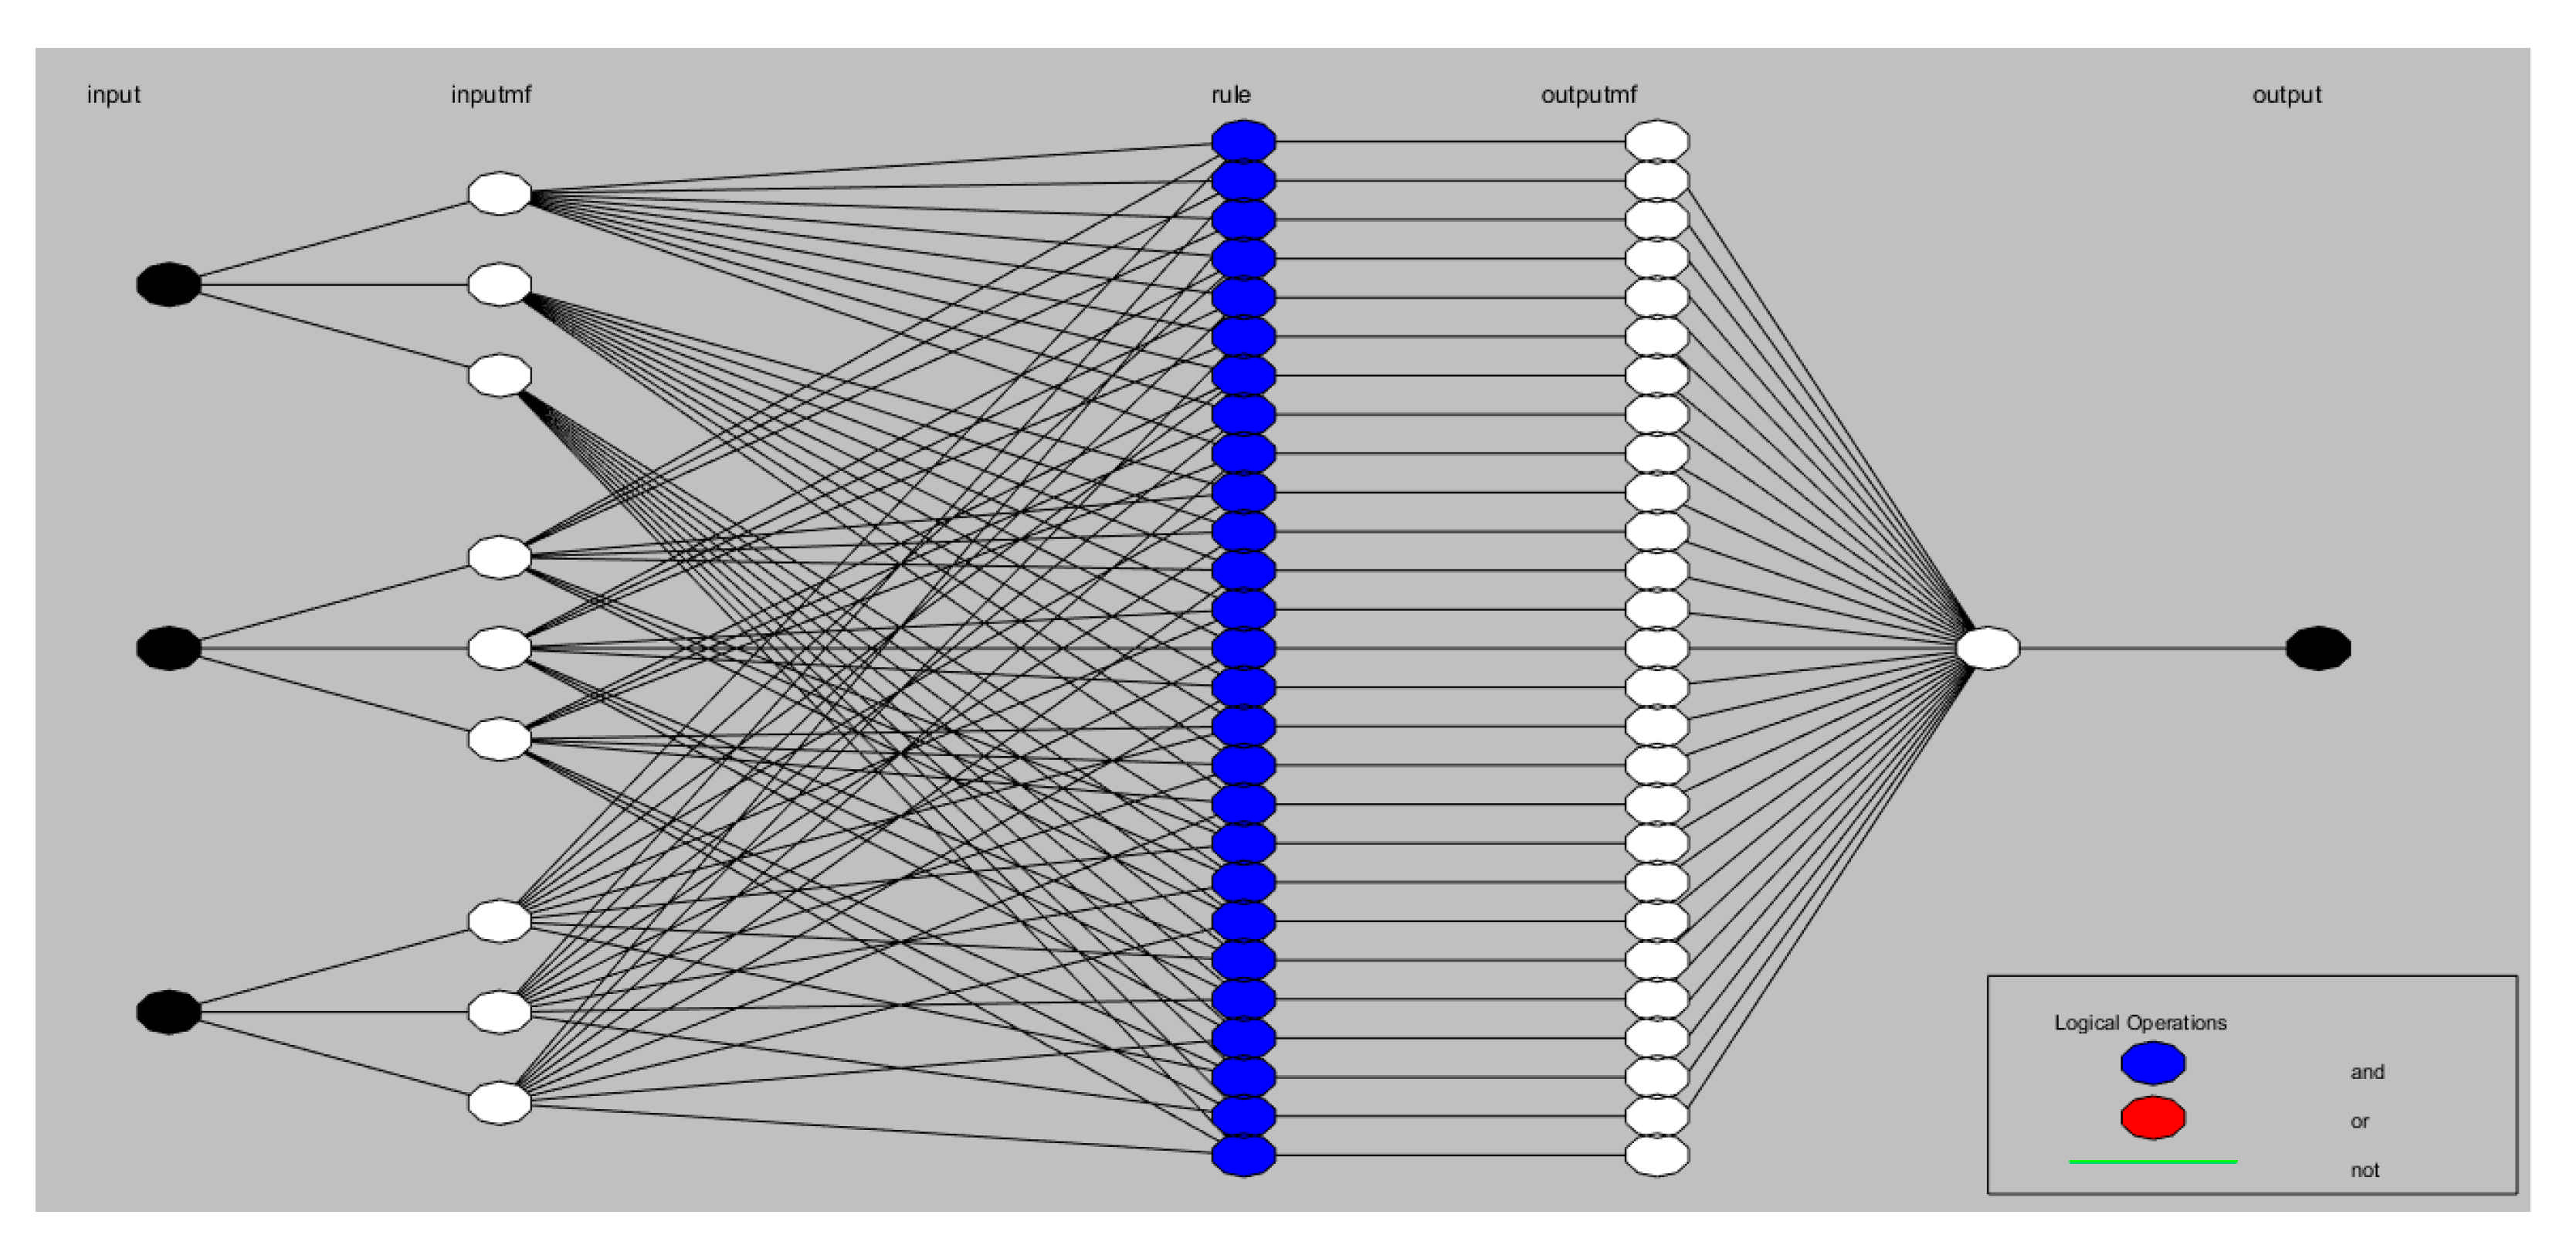
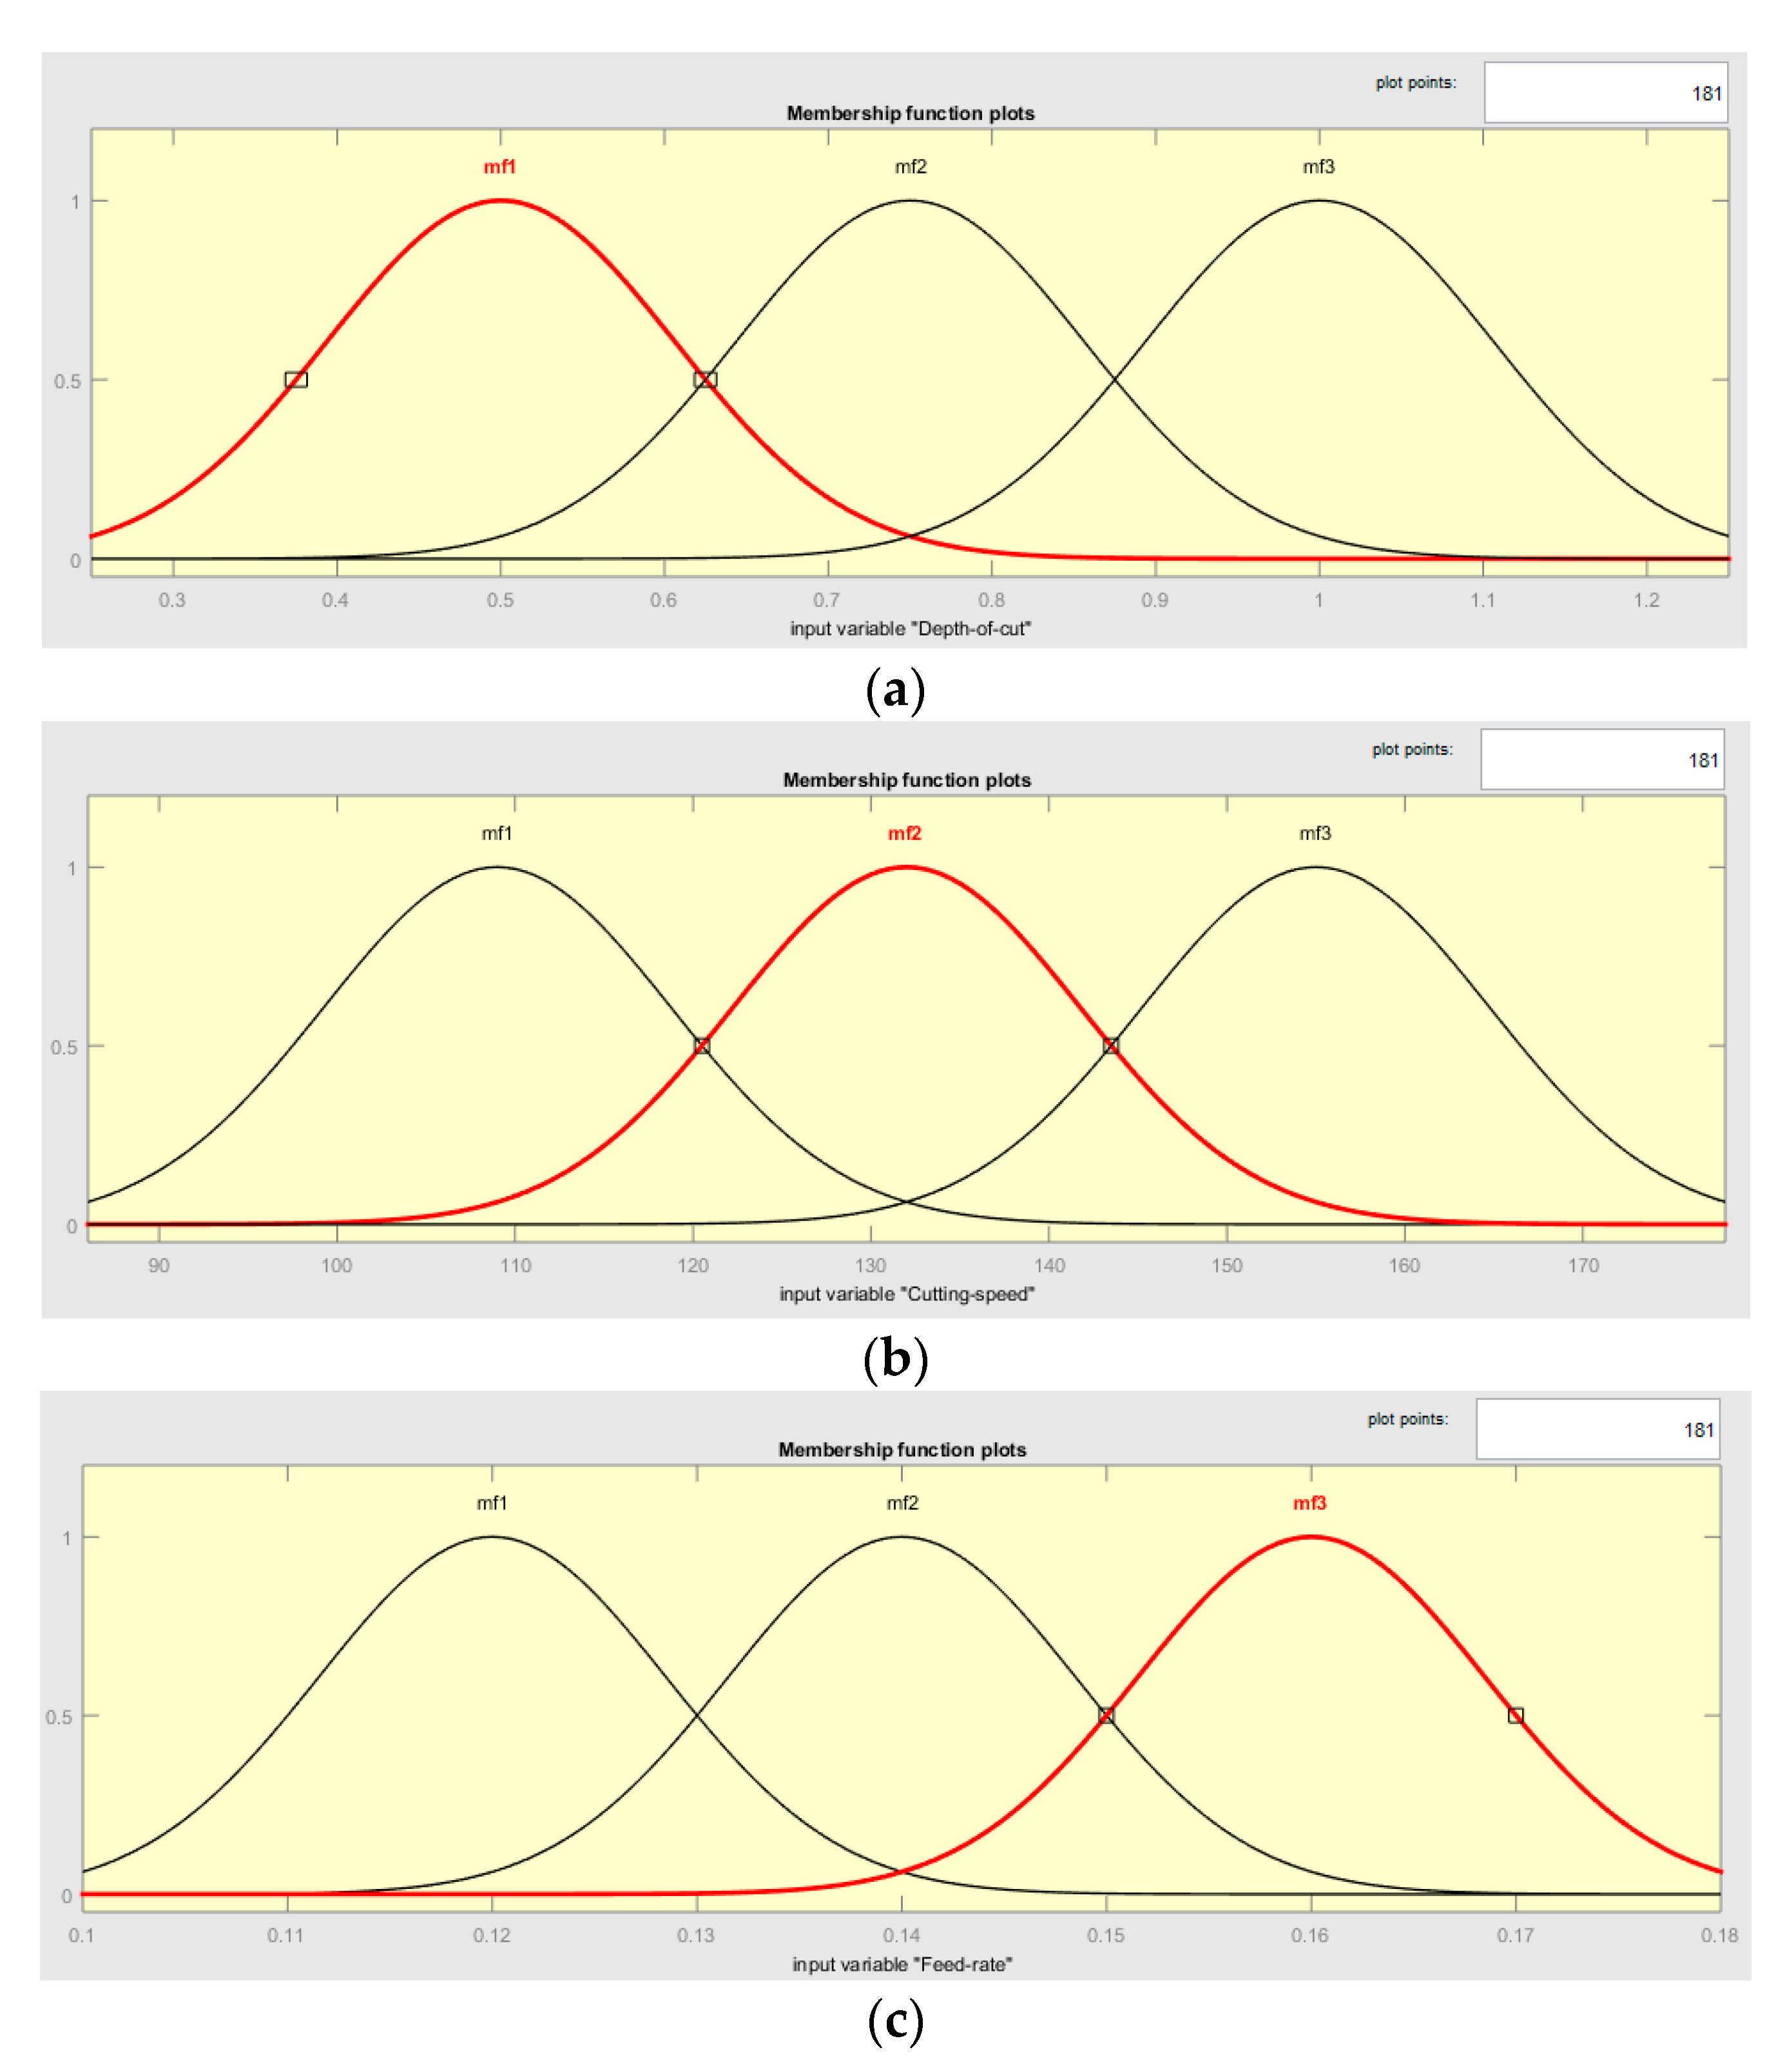
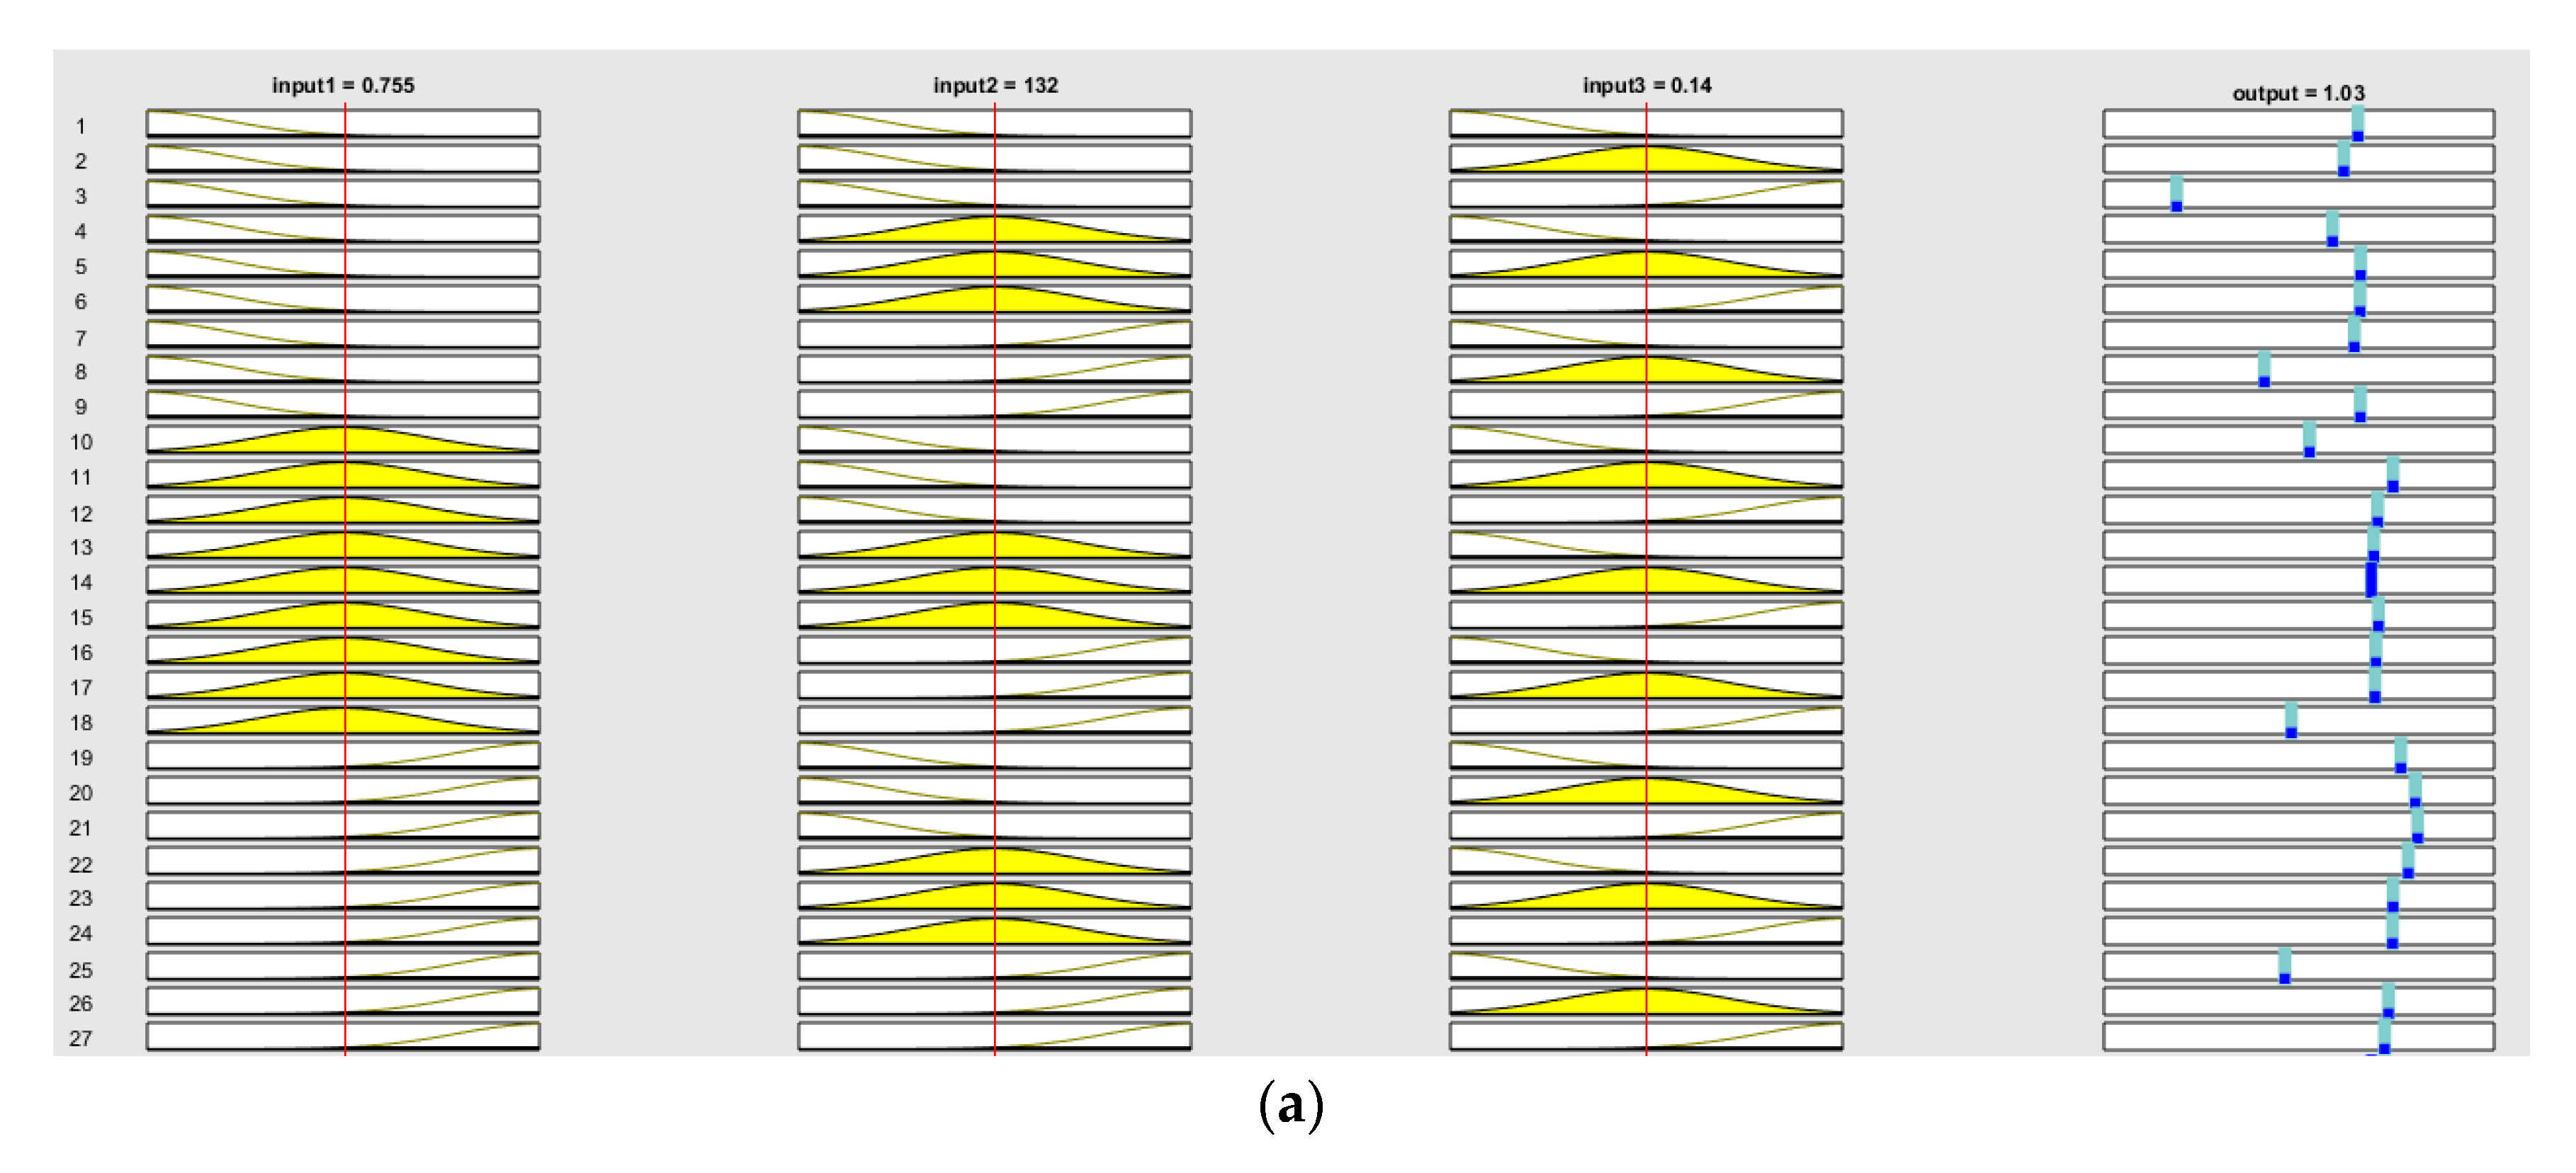
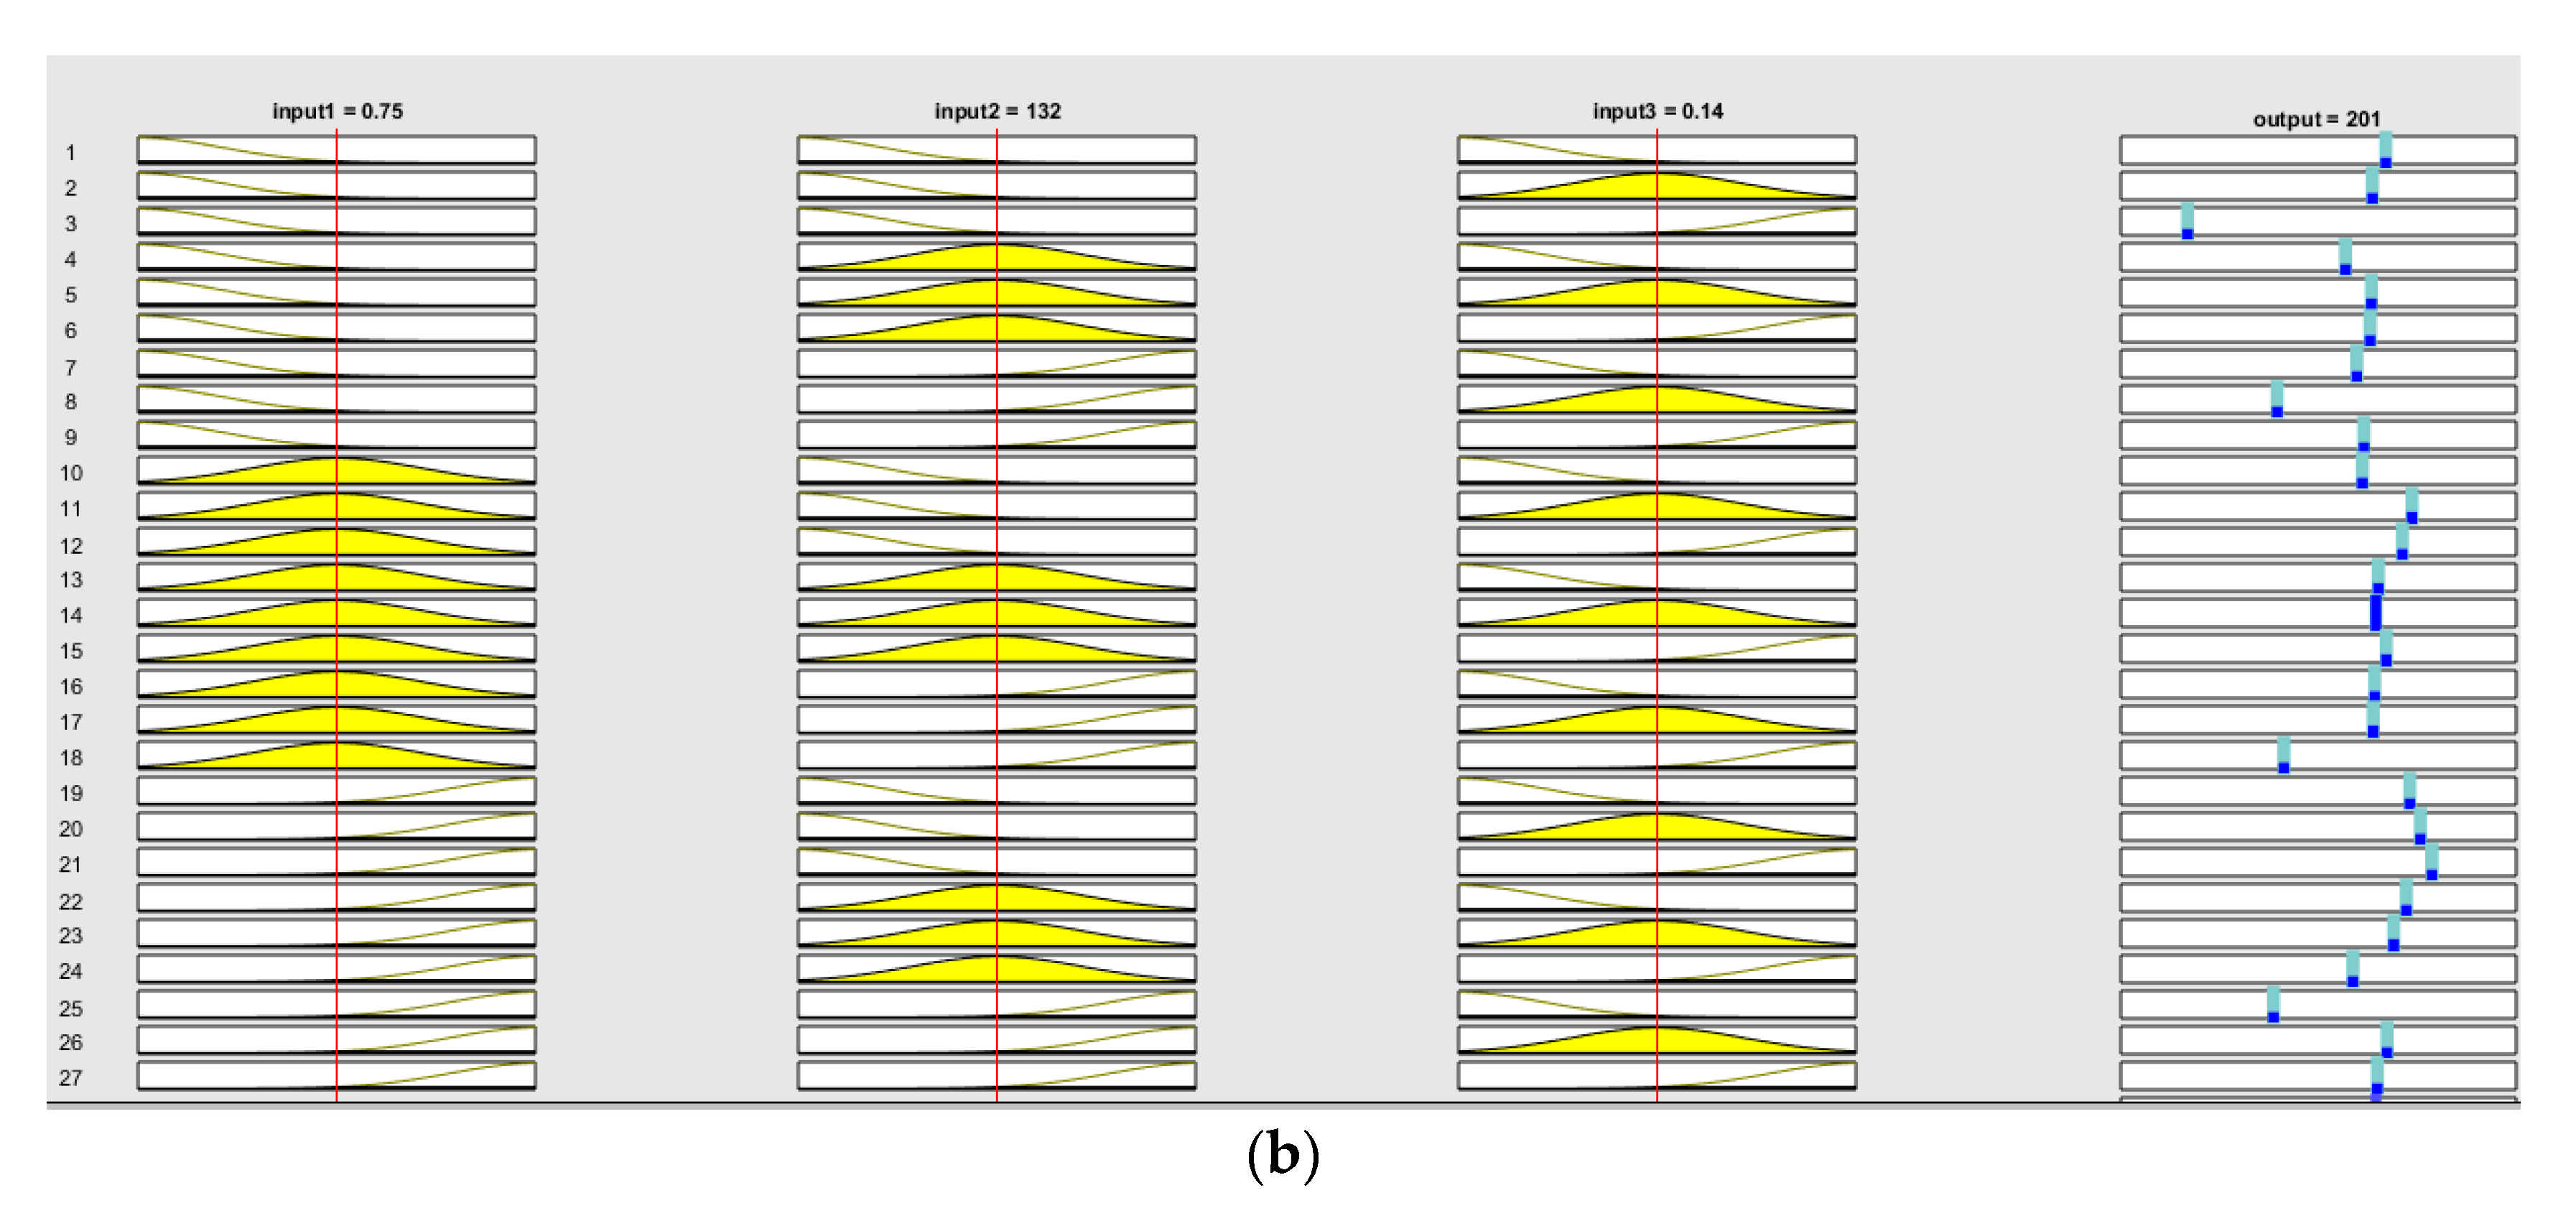
3.5. ANFIS Based Predictive Modeling

The hybrid technique is used to examine the test dataset by loading it from the workspace into ANFIS. For all input parameters and linear type membership functions for output membership functions, FIS was formed using the Gaussian mission function Gaussmf and was shown in Figure 9. The hybrid technique was chosen as the 0 percent error tolerance and 100 epoch optimization approach was used until there was a minimum error in a correct result. Membership function and rules generated by FIS for both the outputs are shown in Figure 10 and Figure 11. The corresponding errors obtained for the surface roughness and the cutting temperature in the hybrid method were 1.107% and 1.172%, respectively, using the rule viewer, as shown in Figure 11. With this changing of the inputs, the resultant output values for the developed hybrid-type ANFIS model was generated.

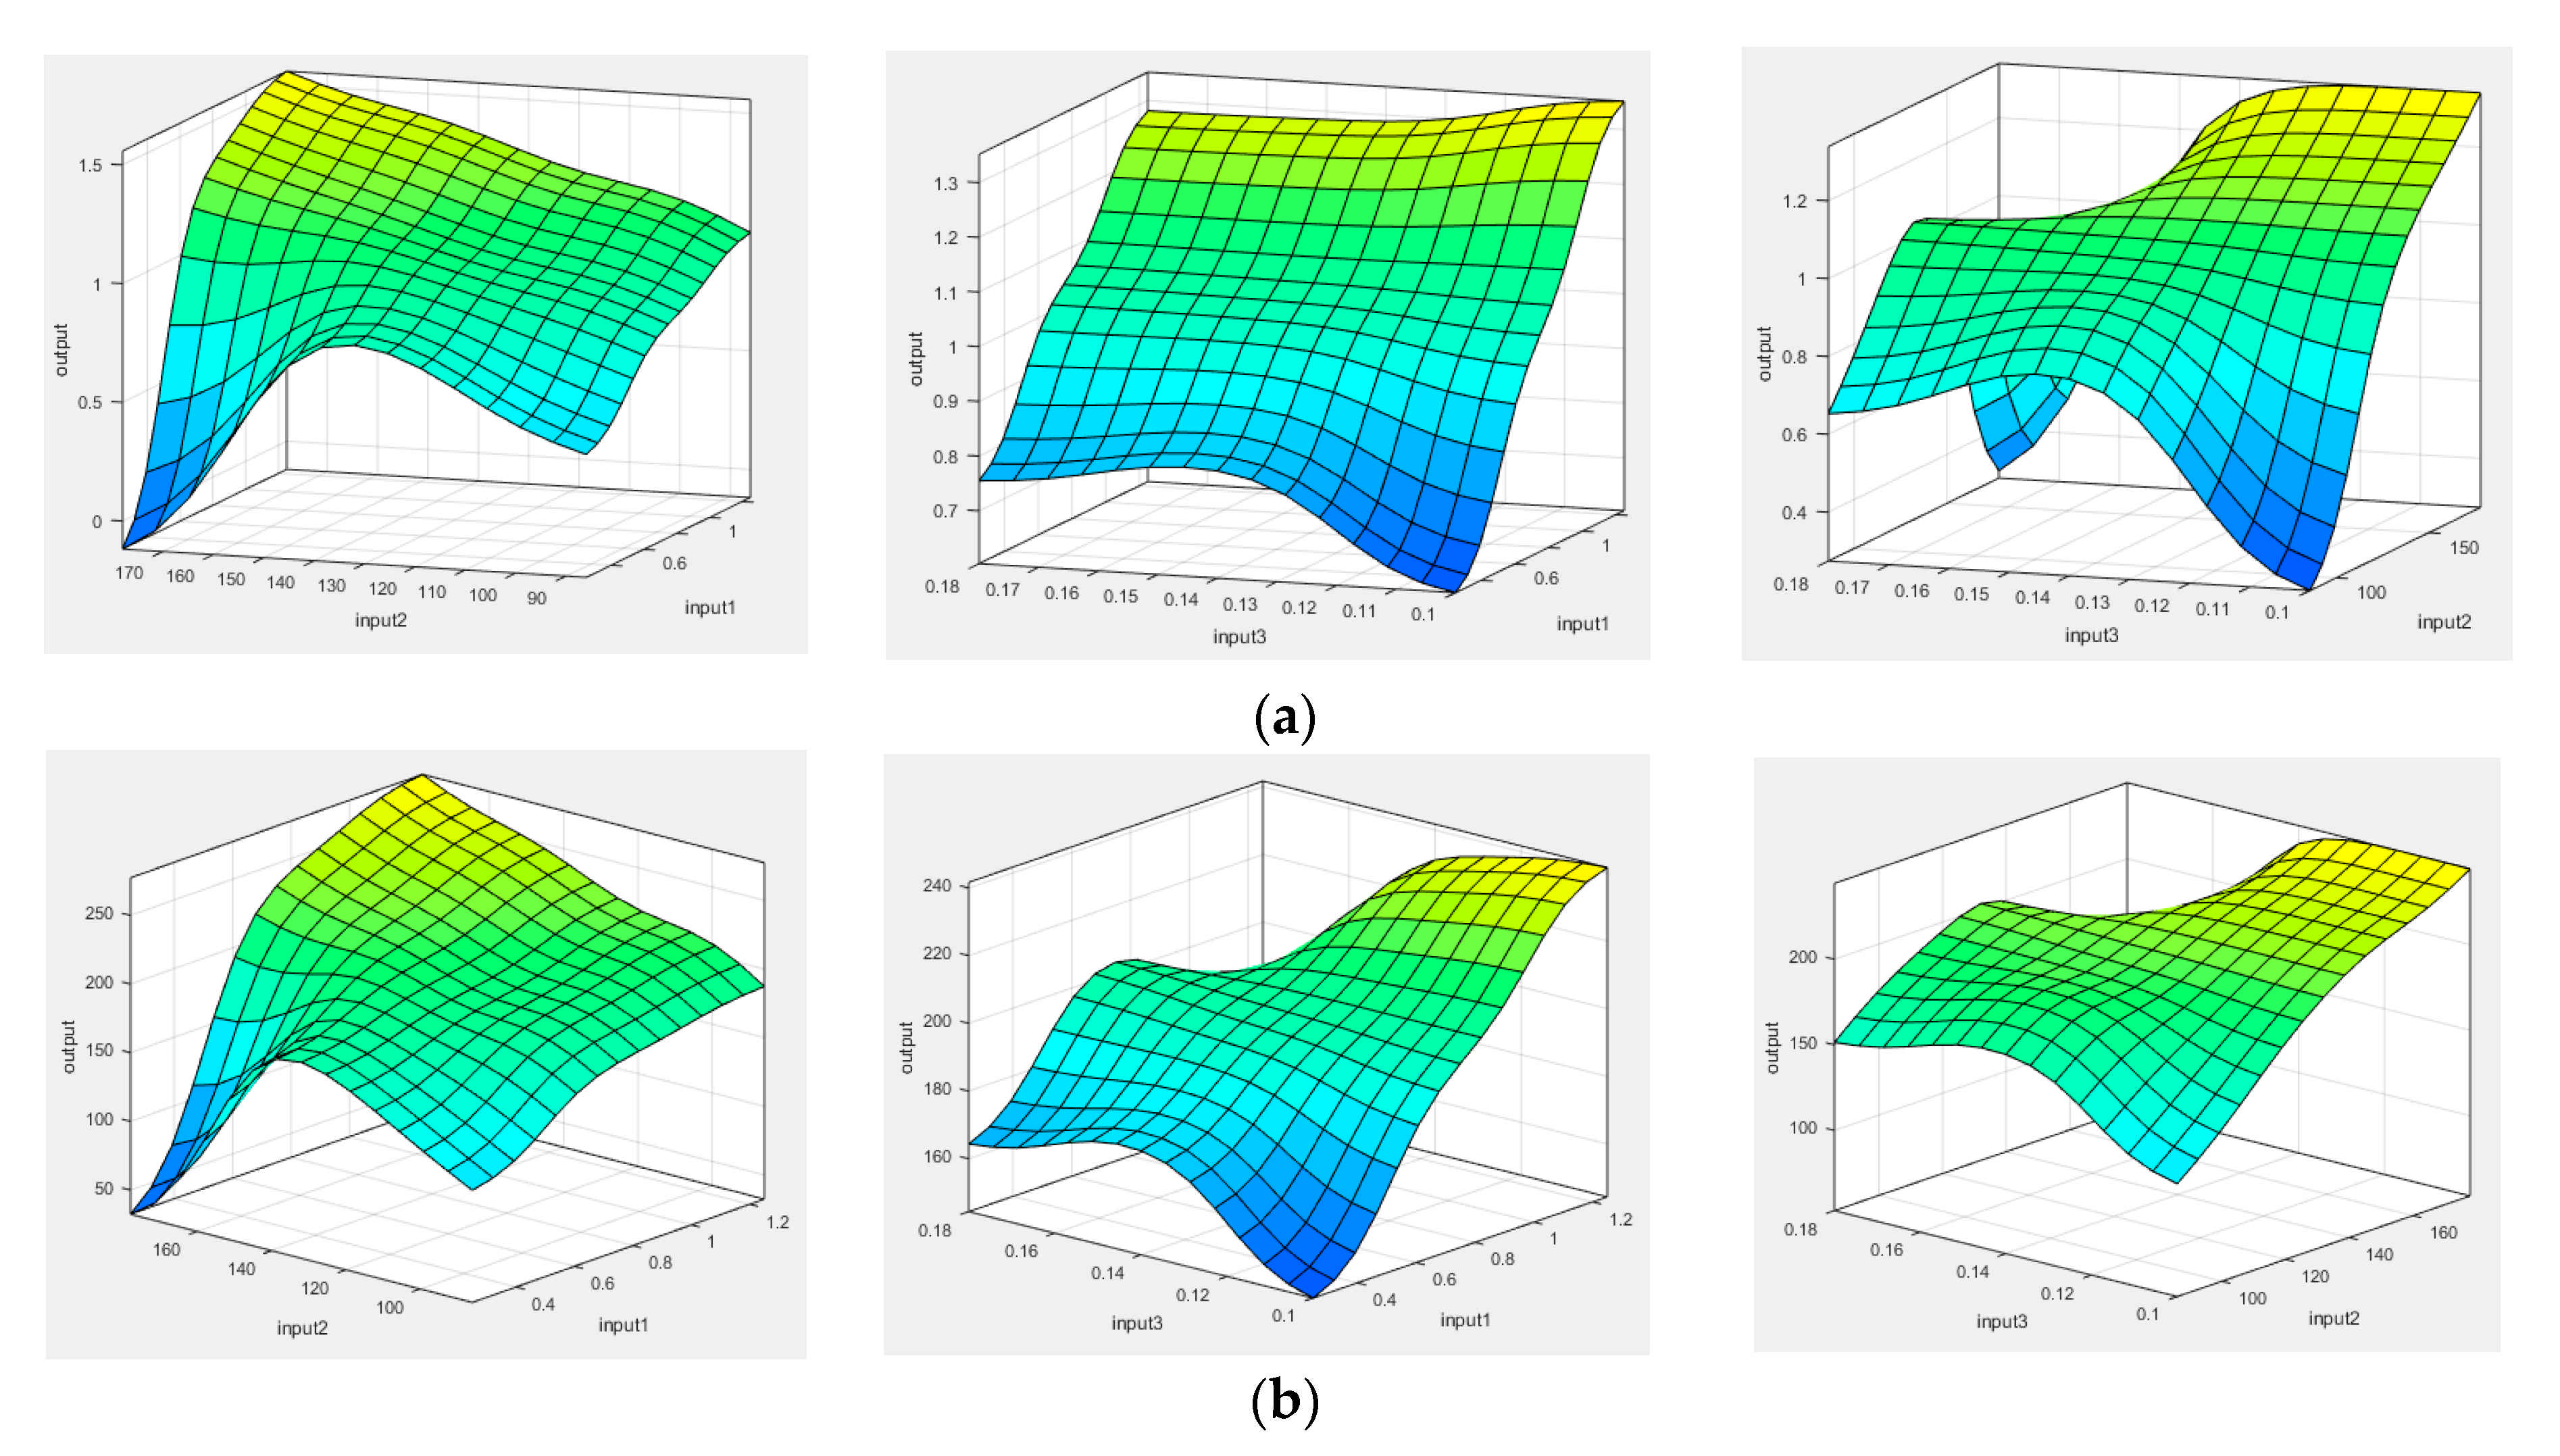
3.6. Three-Dimensional Surface Plots

To understand the interaction effects of the input variables on the response factor, 3D surface plots were plotted based on a developed ANFIS-based model, as portrayed in Figure 12. From the surface views, it was found that a three-dimensional curve represented the mapping from any of the two input parameters to the output parameter. The Z-axis represents surface roughness and the cutting temperature, while the X and Y axes represent two input parameters. All the input parameters could be changed to see how they affected the output parameter. The surface plot displays the effect of the feed rate on Ra and θ is negligible compared to the impact of the cutting speed and the depth of cut. This demonstrates that the increase in cutting speed and depth of cut leads to the rise of Ra and θ. However, in the case of cutting speed, sudden blips are also noticeable for the output parameters. Conversely, when large values of cutting speed were used, the effect became important. Therefore, it can be concluded that cutting speed exhibited the maximum influence on the response variable (Table 5).

4. Comparative Analysis

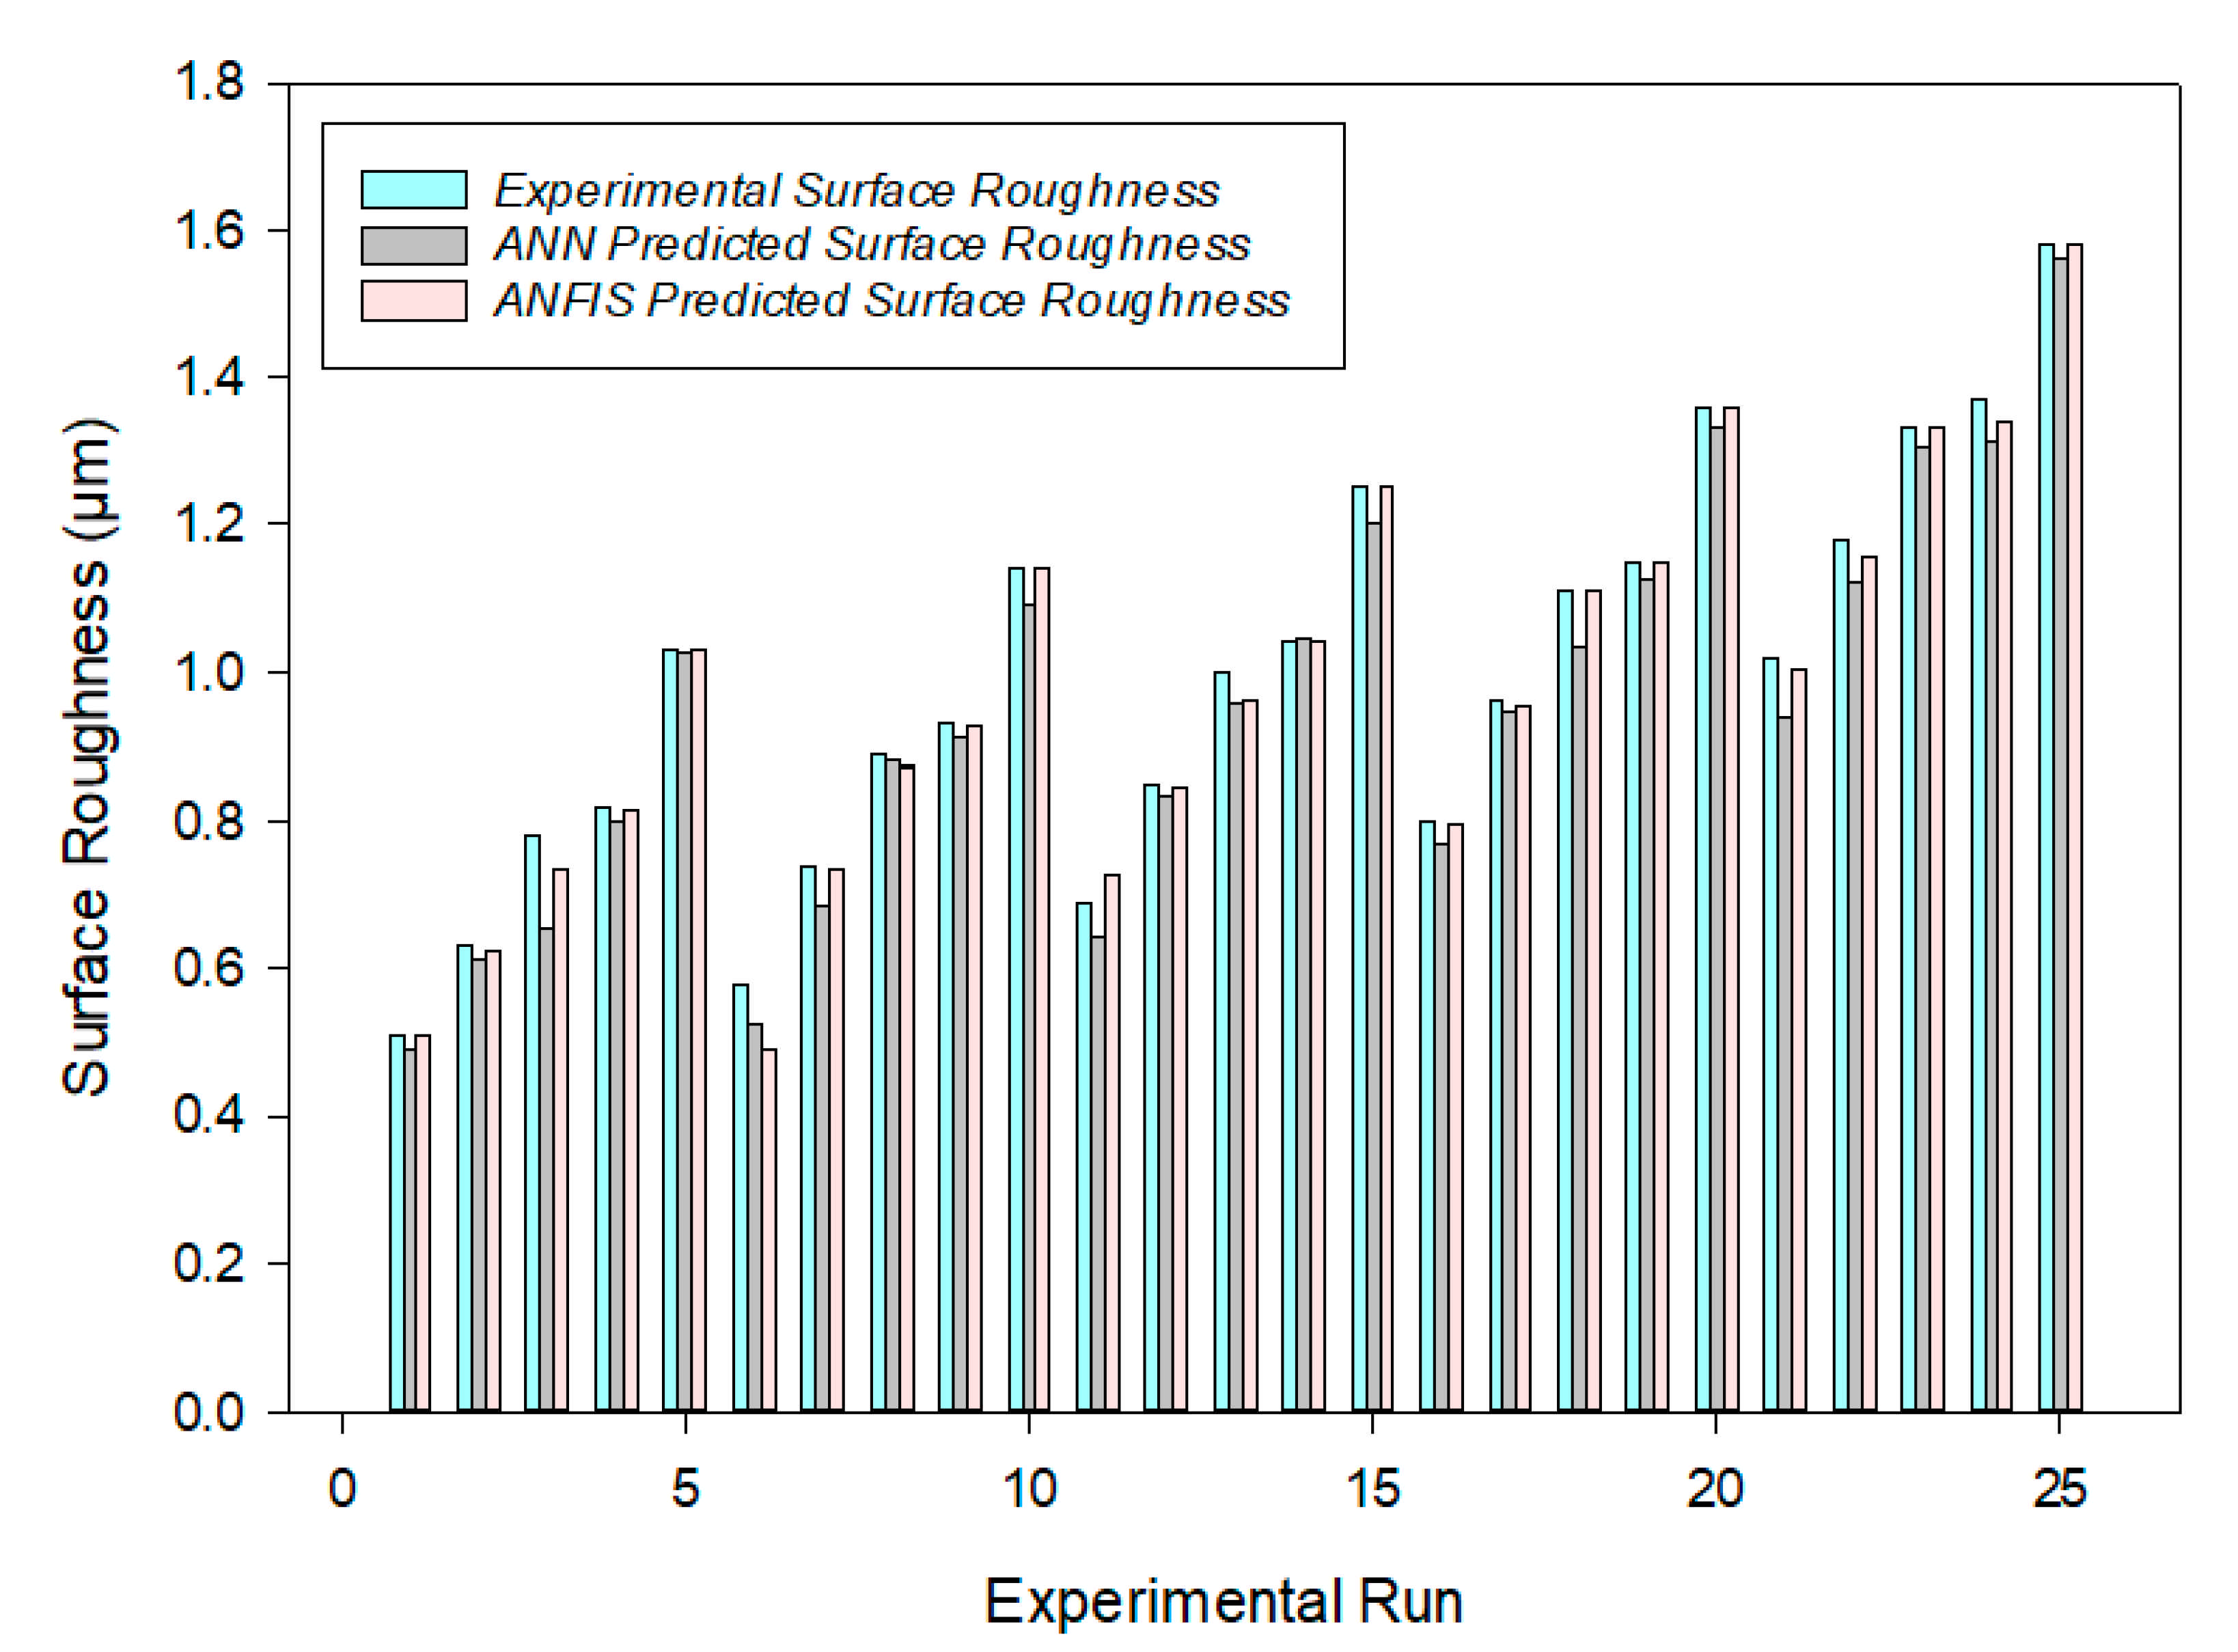
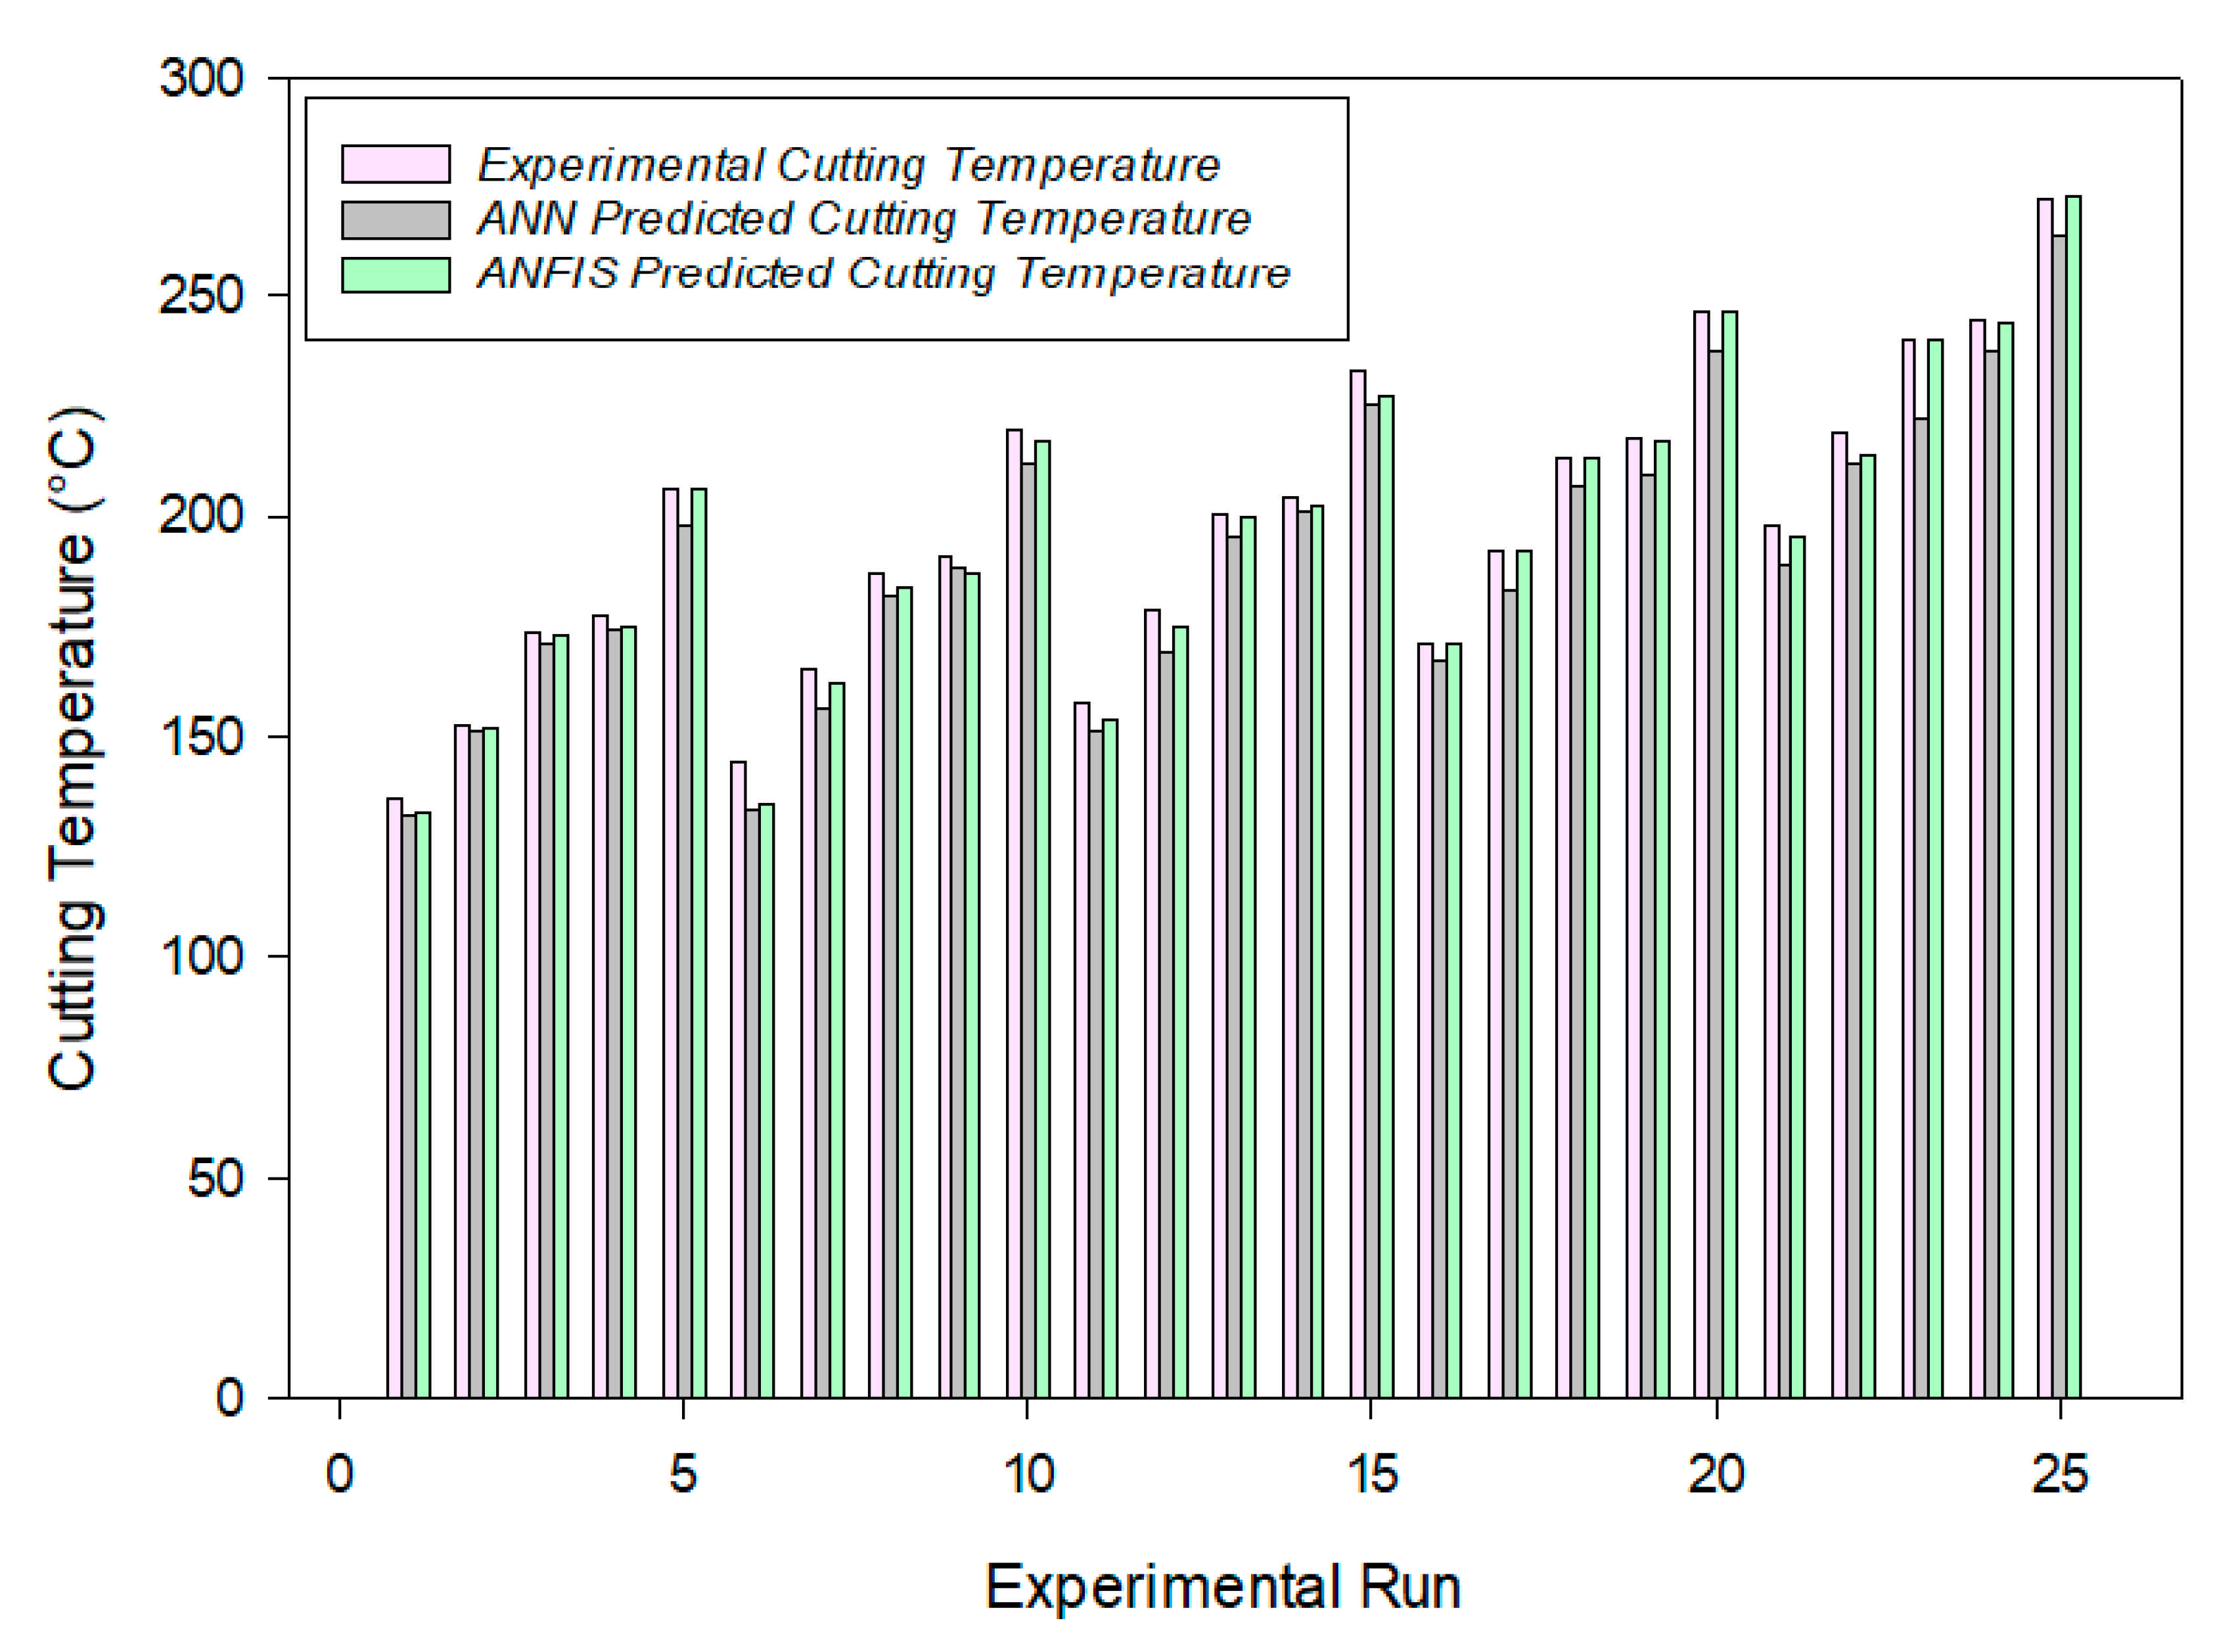
4.1. Comparison of Experimental Data with ANN and ANFIS Predicted Model

Mean absolute percentage error is used to measure the error of the process and was defined as Equation (1). MAPE calculation for the predicted values is shown in Table 11.
M A P E = A P E P j
where A P E = t j o j t j × 100 ; t is the target value, o is the output value, and P is the number of samples.
The errors between the experimental and predicted values of Ra and θ are 3.95% and 3.45% when using a model based on ANN. Subsequently, the hybrid prediction model based on ANFIS was used to detect the deflection of the expected values from the experimental values to verify the percentage of process errors. MAPE was 1.072% and 1.172% for surface roughness and cutting temperature when predicting using the ANFIS model. It could be concluded that the hybrid method predicted the resulting output much more accurately since the amount of deviation was minimal compared to the predicted values of ANN. Nonetheless, ANN could also reasonably predict this value. Figure 13 and Figure 14 show the disparity between the measured and predicted responses of Ra and Fz, which indicates the model’s efficacy, as the predicted values for various combinations were closer to those of the experimentally reported readings.

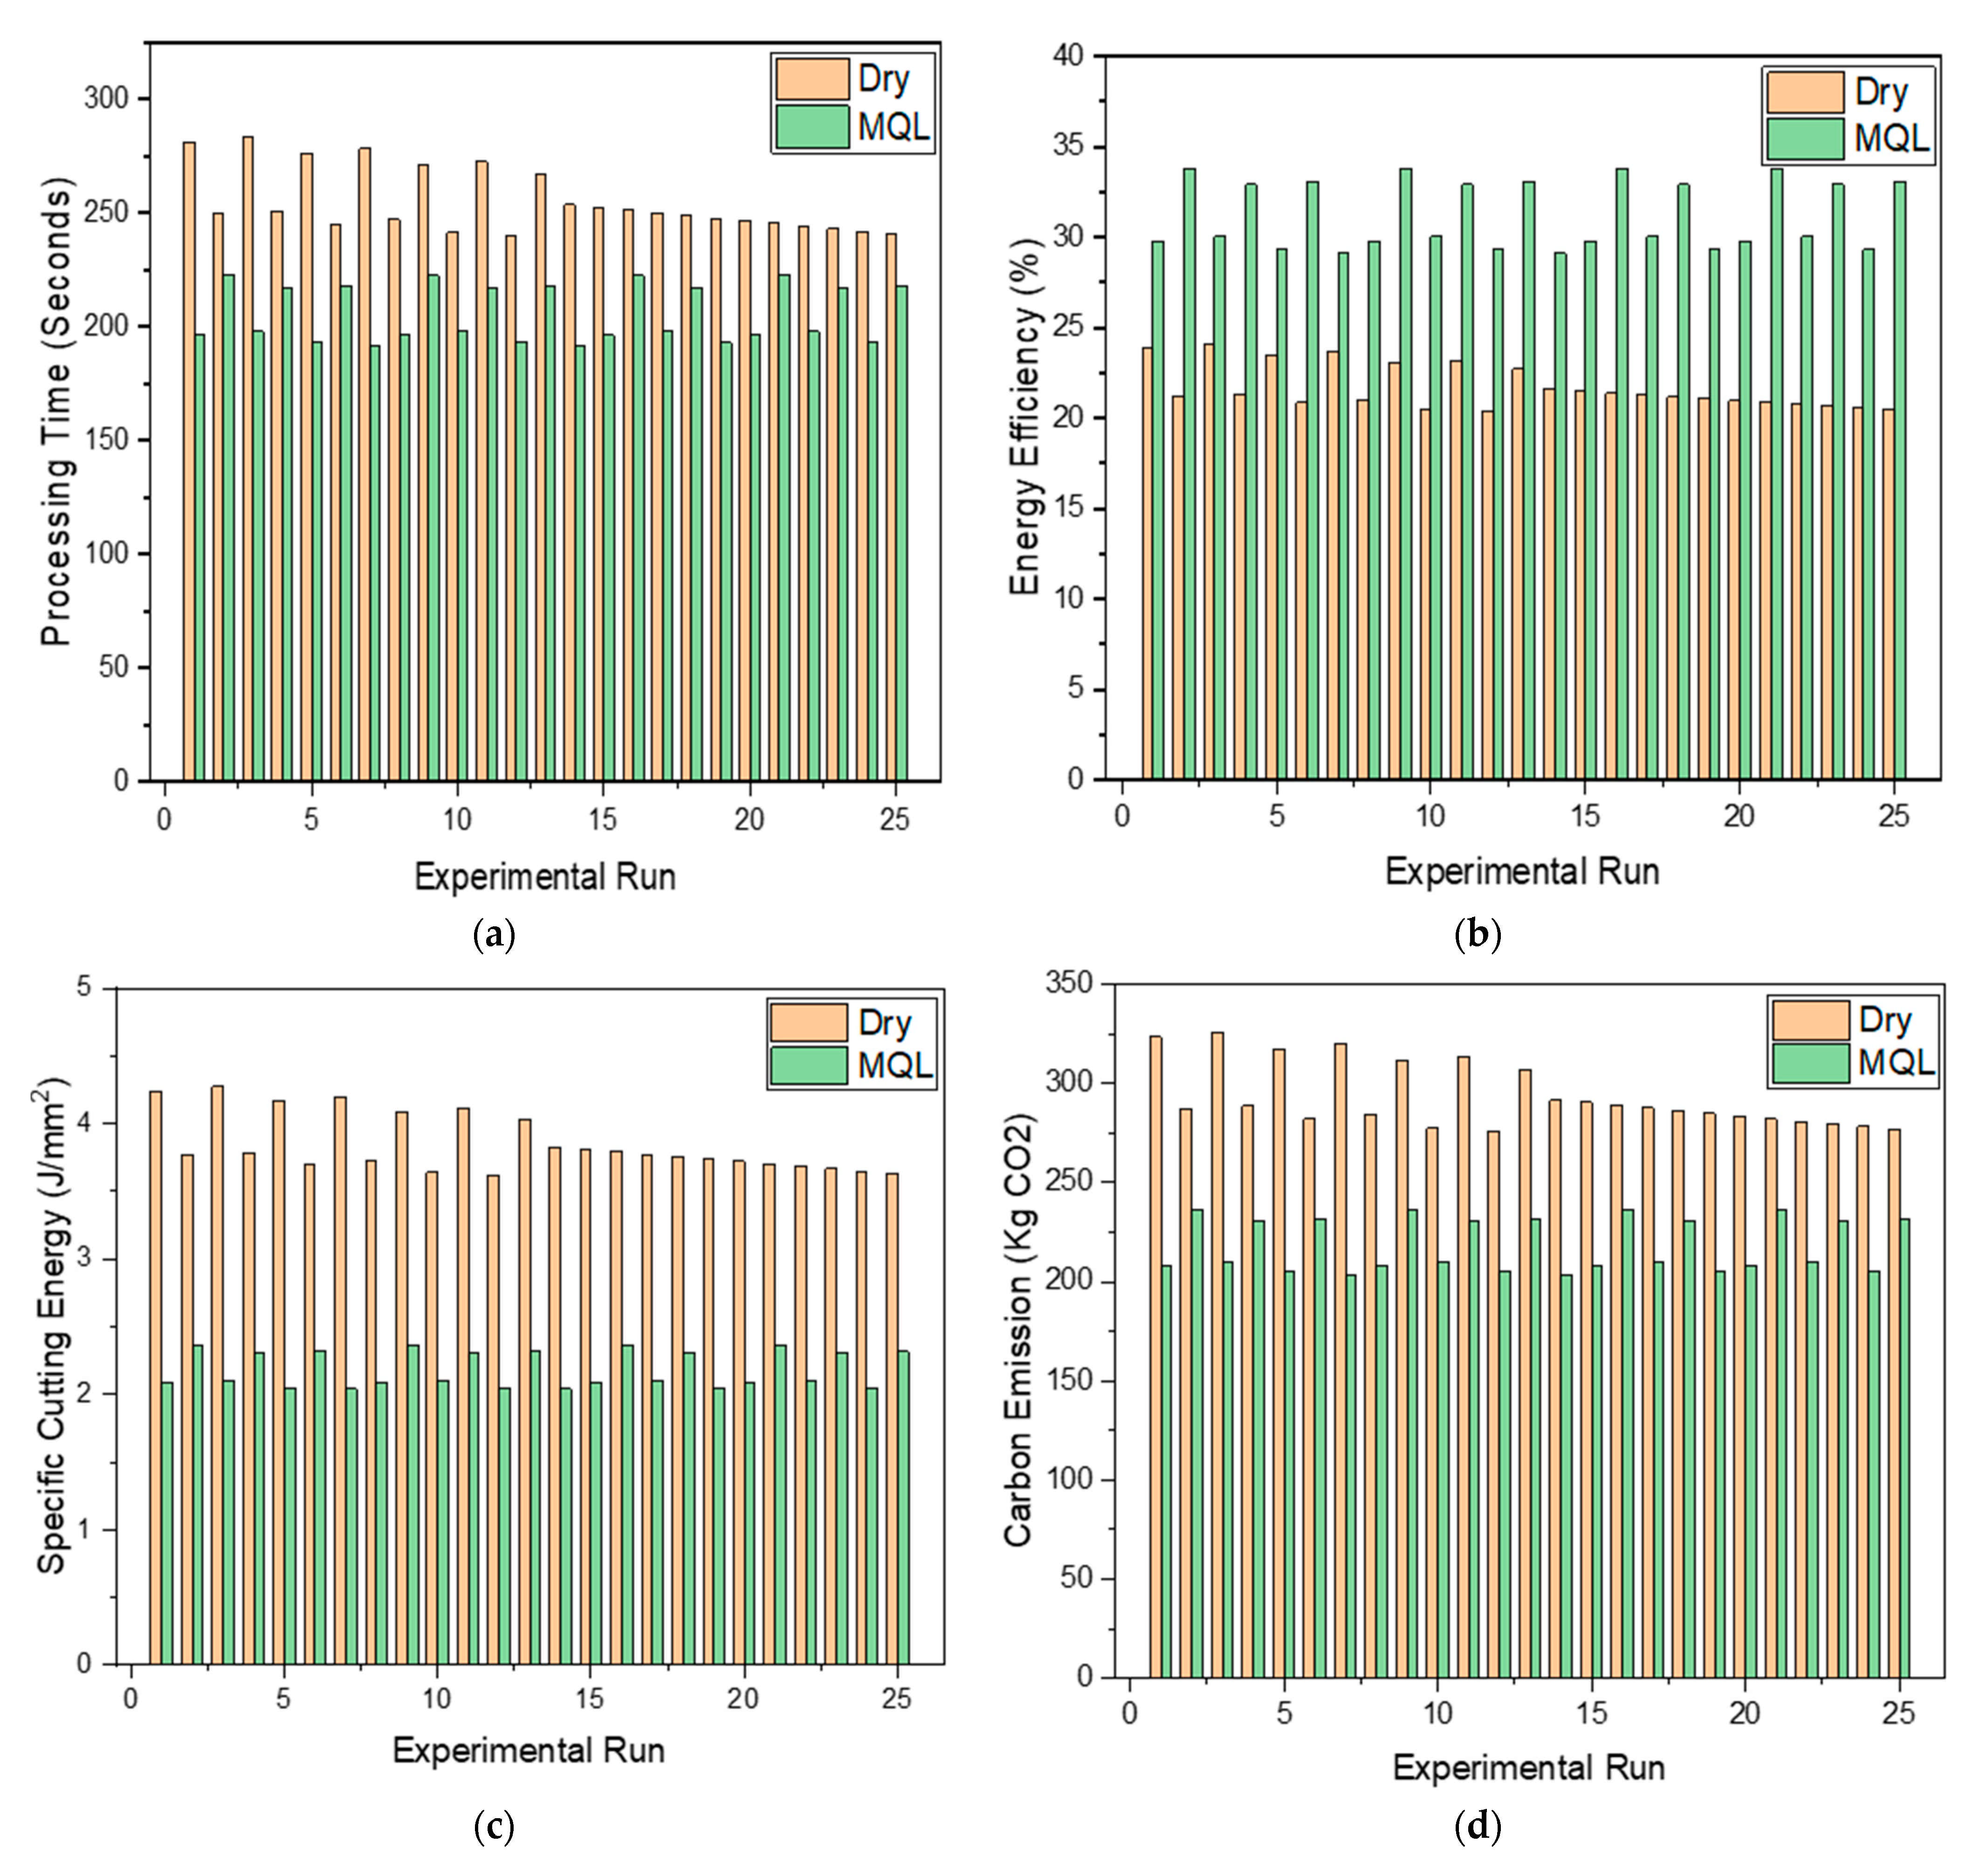
4.2. Life Cycle Assessment and Sustainability Analysis

In the present research study, the empirical models for calculating production time, energy efficiency, specific cutting energy, and carbon emission were developed using a bottom-up approach, as presented in previous research [43]. Here, LCA and sustainability performance analysis, as per the design of the experiment, was presented in terms of production time, energy efficiency, specific cutting energy, and carbon emission. Figure 15 shows the LCA and sustainability performance outputs for dry and MQL-assisted machining of Al-based materials using the PCD tool.
Every operation required a determined time to operate the machining process, called the “actual time” (Tam). Therefore, the total processing time included the idle time, air cutting time, cutting time, tool change time, and cooling/lubrication time, as calculated in Equations (2) and (3).
P r o c e s s i n g   t i m e   T c = t i + t a + t c + t t c + t c o l l u b
The idle time is the sum of stand-by time, material handling, and setup time.
I d l e   t i m e   t i = t s b + t h + t s u
The total processing time for each experimental run after calculation is shown in Figure 15a. It can be seen that MQL-assisted machining takes less time for cutting job operation in comparison to dry-machining. The minimum process time was determined at the optimized setting and was 195 s. This was due to the tool having a longer tool life, which reduced the tool change time. In addition, the MQL cutting fluid helped to reduce the cutting temperature, dissipate heat from the machining zone, and improve the tool’s efficiency and life. Similar observations have been made in previous research work [4,46].
The machining energy efficiency (η) was also considered an attribute for LCA and sustainability and is computed as shown in Equations (4)–(6).
M a c h i n i n g   e n e r g y   e f f i c i e n c y     η = Machining   Energy   E m T o t a l   E n e r g y   C o n s u m e d   E T
where power consumption can be calculated by various stages of the machine tool, as shown in Equation (5).
M a c h i n e   P o w e r   P m = P i t + P a t + P c t + P t c t + P c o l l u b t
Energy consumption is expressed in Equation (6):
Energy   consumption E m = 0 t i P i t d t + 0 t a P a t   d t + 0 t c P c t d t + 0 t t c P t c t d t + 0 t c o l l u b P c o l l u b t d t
Figure 15b shows the machine energy efficiency in terms of the experimental run for dry and MQL-assisted machining. It can be seen that the machine energy efficiency varies in the range of 20–34%. Thus, the reduction in energy consumption and the reduction of waste energy in machine tools is not the only way to achieve a high energy efficiency. Thus, the primary objectives were to reduce energy consumption and waste generation. The results show that MQL-assisted machining has a high energy efficiency compared to dry machining because the tool life is longer in MQL-assisted machining, which reduces tool change. This further reduced stand-by energy utilization in the tool changing phase.
Specific cutting energy (SCE) was also one of the key indicators of sustainability analysis. SCE is the ratio of total energy consumed to the material removal rate [47]. To reduce the SCE, either the material removal is increased using the same energy or a reduced energy consumption is needed for the same material removal, as presented in Equation (7).
S C E = E m M R R
Material removal rate (MRR) is calculated as per Equation (8).
M R R = V c × f × a p
Figure 15c shows the SCE concerning the experimental run for dry and MQL-assisted machining. It can be seen that the SCE varies in the range of 2–4 J/mm2. From the results, it can be seen that MQL-assisted machining has a low SCE compared with dry-machining. The prime reason for this is dependent on the sharpness of the cutting edge of the tool. In the case of MQL-assisted machining, the tool cutting edge has a long-life cycle. Therefore, the tool’s life depends on its cutting edge sharpness, which requires a low cutting force and energy to perform job operations. Moreover, there is no built-up-edge formation in the process, which increases the tool life and maintains the cutting edge’s sharpness because MQL-lubrication disposes of the heat energy generated in the machining zone. As a result, the long-life sharp edge produced a high material removal, and less tool change, which reduced cutting power consumption, which reduced the SCE.
Carbon emissions (CO2) can be termed as another significant indicator of sustainability. The energy consumption indirectly calculates carbon emissions via machine tools. The total carbon emission (CEtotal) is calculated as per Equation (9).
C E p = C E S × E i + E a + E c + E t c + E l + C F C T × t c T L + C F M Q L × Q M Q L × t c
Figure 15d shows the variations in CO2 concerning experimental run for dry and MQL-assisted machining. The carbon emissions under the obtained sustainable machining process were in the range of 200 to 300 kg-CO2. However, it can be seen that the CO2 emissions were comparatively much lower in MQL-assisted machining as compared to dry machining. This is because, in MQL machining, a very nominal amount of cutting fluid is used, which generates a smaller carbon footprint. Moreover, less energy consumption is required in MQL machining to achieve high degree of material removal and a very low tool change. In this, savings in energy, time, money, as well as for the environment occur, making MQL a sustainable machining process [43,48,49,50].
The obtained results are in line with previously published research work. Khan et al. reported investigating Al2O3-based nano-fluid-assisted MQL machining in terms of technological and economic factors [51]. Various sustainable parameters, such as energy, cost, and carbon emission were studied. It has been reported that nano-fluid-assisted MQL machining reduces the cost per unit of the product and achieves a low carbon manufacturing goal [52]. Gupta et al. studied the environmental and sustainability aspects of hybrid-cooling-assisted machining of Ti-6Al-4 V alloy [53]. It was reported that LN2 and MQL were the most effective cooling systems and helped in reducing the production time, energy, cost, and carbon emissions. Similar to the above-mentioned studies, the current study also presented that MQL machining reduces production time, energy, cost, and carbon emissions while processing Al-based alloys. Other sustainability indices, such as human wellbeing, pollution, vibrations, etc., will be considered in future research.

5. Conclusions

Current research focuses on the sustainability aspect of machining Al-based alloy using the PCD tool. At the same time, various machining attributes (surface roughness and cutting temperature) were also addressed to interrelate the effect of input parameters on the resultant responses. The addition of Zr in the material preparation significantly impacted reducing the cutting temperature under MQL cutting conditions. Based on the research, the following conclusions can be made.
From ANOVA analyses, it is understandable that the cutting velocity was the most dominant factor, followed by the depth of cut, to induce a preferable value for both the response parameters, which was also aligned with the SN ratio results attainted. As such, both methods can give assurances regarding the identification of the dominant factors affecting the response variables.
The SN ratio response graph demonstrates that, to obtain the optimum surface roughness and cutting temperature, a combination of parameters with a depth of cut of 0.25 mm, cutting speed of 86 m/min, and feed rate of 0.10 mm/rev was desirable. On the other hand, DFA showed the optimum surface roughness and cutting temperature, with a combination of 0.305 mm for the depth of cut, 86 m/min for cutting speed, and a 0.10 mm/rev for feed rate. Moreover, the highest perceived value of 0.997 could be attained amongst the 92 solutions while setting the mentioned parameters.
The ANN-based model effectively established a link between the input factors and response variables for the testing dataset and the training dataset. It could also be observed that the mean absolute percentage error fell to a good range of values of 3.25% to 3.95% for the response variables. The deviation chart indicated the acceptability of the Sugeno hybrid ANFIS prediction model, with mean absolute percentage errors of 1.071% and 1.72%, respectively, for surface roughness and cutting temperature, demonstrating the capacity to predict the performance of the responses more reliably than the ANN model.
MQL-assisted machining has been proven to be a sustainable machining process as compared to dry-machining. In MQL machining, owing to the very nominal use of cutting fluid, it generates a smaller carbon footprint. Moreover, significantly less energy consumption is required in MQL machining to achieve a high material removal and very low tool changes were needed. In this, there are savings in terms of energy, time, money, and the environment, making MQL a sustainable machining process.
It appears that the minimum quantity of lubrication could play a prominent role in maintaining the sustainability aspect of machining of the chosen material. Nevertheless, before applying this method for frequent industrial applications, more research needs to be done on the machining behavior considering higher cutting speeds and various nose radii of the PCD tool.
A limitation of current research work is that other sustainability indexes, such as human wellbeing, pollution, vibrations, etc., are not covered and will be considered in future research work.

Author Contributions

Data curation, M.R.K., C.P. and C.I.P.; Formal analysis, J.B.T., S.M.M. and R.K.; Investigation, A.H., S.S., R.K. and Y.N.; Resources, S.H.S.; Software, R.K. and Y.N.; Supervision, Y.N.; Validation, Y.N.; Writing—original draft, C.I.P. All authors have read and agreed to the published version of the manuscript.

Funding

This research received no external funding.

Institutional Review Board Statement

Not applicable.

Informed Consent Statement

Not applicable.

Data Availability Statement

Not applicable.

Acknowledgments

The authors would like to express their gratitude towards the Department of Mechanical and Production Engineering, AUST, for allowing us to conduct the research work using their laboratory facilities.

Conflicts of Interest

The authors declare no conflict of interest.

References

  1. Ezugwu, E.O. Improvements in the machining of aero-engine alloys using self-propelled rotary tooling technique. J. Mater. Process. Technol. 2007, 185, 60–71. [Google Scholar] [CrossRef]
  2. Verma, R.; Ghosh, A.K.; Kim, S.; Kim, C. Grain refinement and superplasticity in 5083 Al. Mater. Sci.Eng. A 1995, 191, 143–150. [Google Scholar] [CrossRef]
  3. Heath, P.J. Developments in applications of PCD tooling. J. Mater. Process. Technol. 2001, 116, 31–38. [Google Scholar] [CrossRef]
  4. Maeng, D.Y.; Lee, J.H.; Hong, S.I. The effect of transition elements on the superplastic behavior of Al–Mg alloys. Mater. Sci. Eng. A 2003, 357, 188–195. [Google Scholar] [CrossRef]
  5. Sarıkaya, M.; Güllü, A. Multi-response optimization of minimum quantity lubrication parameters using Taguchi-based grey relational analysis in turning of difficult-to-cut alloy Haynes 25. J. Clean. Prod. 2015, 91, 347–357. [Google Scholar] [CrossRef]
  6. Dhar, N.R.; Kamruzzaman, M. Cutting temperature, tool wear, surface roughness and dimensional deviation in turning AISI-4037 steel under cryogenic condition. Int. J. Mach. Tools Manuf. 2007, 47, 754–759. [Google Scholar] [CrossRef]
  7. Krolczyk, G.M.; Maruda, R.W.; Krolczyk, J.B.; Wojciechowski, S.; Mia, M.; Nieslony, P.; Budzik, G. Ecological trends in machining as a key factor in sustainable production—A review. J. Clean. Prod. 2019, 218, 601–615. [Google Scholar] [CrossRef]
  8. Sreejith, P.S.; Krishnamurthy, R.; Malhotra, S.K.; Narayanasamy, K. Evaluation of PCD tool performance during machining of carbon/phenolic ablative composites. J. Mater. Process. Technol. 2000, 104, 53–58. [Google Scholar] [CrossRef]
  9. Alagan, N.T.; Beno, T.; Wretland, A. Investigation of Modified Cutting Insert with Forced Coolant Application in Machining of Alloy 718. Procedia CIRP 2016, 42, 481–486. [Google Scholar] [CrossRef]
  10. Teti, R. Machining of Composite Materials. CIRP Ann. 2002, 51, 611–634. [Google Scholar] [CrossRef]
  11. Brun, M.K.; Lee, M.; Gorsler, F. Wear characteristics of various hard materials for machining sic-reinforced aluminum alloy. Wear 1985, 104, 21–29. [Google Scholar] [CrossRef]
  12. Weinert, K.; König, W. A Consideration of Tool Wear Mechanism when Machining Metal Matrix Composites (MMC). CIRP Ann. 1993, 42, 95–98. [Google Scholar] [CrossRef]
  13. Andrewes, C.J.E.; Feng, H.-Y.; Lau, W.M. Machining of an aluminum/SiC composite using diamond inserts. J. Mater. Process. Technol. 2000, 102, 25–29. [Google Scholar] [CrossRef]
  14. Dhar, N.R.; Kamruzzaman, M.; Ahmed, M. Effect of minimum quantity lubrication (MQL) on tool wear and surface roughness in turning AISI-4340 steel. J. Mater. Process. Technol. 2006, 172, 299–304. [Google Scholar] [CrossRef]
  15. Sivaiah, P.; Chakradhar, D. The Effectiveness of a Novel Cryogenic Cooling Approach on Turning Performance Characteristics During Machining of 17-4 PH Stainless Steel Material. Silicon 2019, 11, 25–38. [Google Scholar] [CrossRef]
  16. Kaynak, Y.; Gharibi, A. Progressive Tool Wear in Cryogenic Machining: The Effect of Liquid Nitrogen and Carbon Dioxide. J. Manuf. Mater. Process. 2018, 2, 31. [Google Scholar] [CrossRef] [Green Version]
  17. Rabiei, F.; Rahimi, A.R.; Hadad, M.J.; Ashrafijou, M. Performance improvement of minimum quantity lubrication (MQL) technique in surface grinding by modeling and optimization. J. Clean. Prod. 2015, 86, 447–460. [Google Scholar] [CrossRef]
  18. Park, K.-H.; Ewald, B.; Kwon, P.Y. Effect of Nano-Enhanced Lubricant in Minimum Quantity Lubrication Balling Milling. J. Tribol. 2011, 133. [Google Scholar] [CrossRef]
  19. Alok, A.; Das, M. Multi-objective optimization of cutting parameters during sustainable dry hard turning of AISI 52100 steel with newly develop HSN2-coated carbide insert. Measurement 2019, 133, 288–302. [Google Scholar] [CrossRef]
  20. Shihab, S.K.; Khan, Z.A.; Mohammad, A.; Siddiqueed, A.N. RSM based study of cutting temperature during hard turning with multilayer coated carbide insert. Procedia Mater. Sci. 2014, 6, 1233–1242. [Google Scholar] [CrossRef] [Green Version]
  21. Shastri, A.; Nargundkar, A.; Kulkarni, A.J.; Benedicenti, L. Optimization of process parameters for turning of titanium alloy (Grade II) in MQL environment using multi-CI algorithm. SN Appl. Sci. 2021, 3, 226. [Google Scholar] [CrossRef]
  22. Karim, M.R.; Shawon, S.H.; Morshed, S.M.; Hasan, A.; Tariq, J.B. Investigation of Surface Roughness in MQL Aided Turning of Al/Cu/Zr Alloy Using PCD Tool; Springer: Singapore, 2020; p. 207. [Google Scholar]
  23. Karim, M.R.; Siddique, R.A.; Dilwar, F. Study of Surface Roughness and MRR in Turning of SiC Reinforced Al Alloy Composite Using Taguchi Design Method, ANN and PCA Approach under MQL Cutting Condition. Adv. Mater. Res. 2020, 1158, 115–131. [Google Scholar] [CrossRef]
  24. Hadad, M.; Sadeghi, B. Minimum quantity lubrication-MQL turning of AISI 4140 steel alloy. J. Clean. Prod. 2013, 54, 332–343. [Google Scholar] [CrossRef]
  25. Thakur, A.; Manna, A.; Samir, S. Multi-Response Optimization of Turning Parameters during Machining of EN-24 Steel with SiC Nanofluids Based Minimum Quantity Lubrication. Silicon 2020, 12, 71–85. [Google Scholar] [CrossRef]
  26. Lin, C.L. Use of the Taguchi Method and Grey Relational Analysis to Optimize Turning Operations with Multiple Performance Characteristics. Mater. Manuf. Process. 2004, 19, 209–220. [Google Scholar] [CrossRef]
  27. Varol, T.; Canakci, A.; Ozsahin, S. Artificial neural network modeling to effect of reinforcement properties on the physical and mechanical properties of Al2024–B4C composites produced by powder metallurgy. Compos. Part B Eng. 2013, 54, 224–233. [Google Scholar] [CrossRef]
  28. Bachy, B.; Franke, J. Modeling and optimization of laser direct structuring process using artificial neural network and response surface methodology. Int. J. Ind. Eng. Comput. 2015, 6, 553–564. [Google Scholar] [CrossRef]
  29. Das, B.; Roy, S.; Rai, R.N.; Saha, S.C. Studies on Effect of Cutting Parameters on Surface Roughness of Al-Cu-TiC MMCs: An Artificial Neural Network Approach. Procedia Comput. Sci. 2015, 45, 745–752. [Google Scholar] [CrossRef] [Green Version]
  30. Davim, J.P.; Gaitonde, V.N.; Karnik, S.R. Investigations into the effect of cutting conditions on surface roughness in turning of free machining steel by ANN models. J. Mater. Process. Technol. 2008, 205, 16–23. [Google Scholar] [CrossRef]
  31. Pandiyan, V.; Caesarendra, W.; Tjahjowidodo, T.; Praveen, G. Predictive Modelling and Analysis of Process Parameters on Material Removal Characteristics in Abrasive Belt Grinding Process. Appl. Sci. 2017, 7, 363. [Google Scholar] [CrossRef]
  32. Reddy, B.S.; Kumar, J.S.; Reddy, K.V.K. Prediction of surface roughness in turning using adaptive neuro-fuzzy inference system. Jordan J. Mech. Ind. Eng. 2009, 3, 252–259. [Google Scholar]
  33. Karim, M.; Dilwar, F.; Siddique, R. Predictive Modeling of Surface Roughness in MQL assisted Turning of SiC-Al Alloy Composites using Artificial Neural Network and Adaptive Neuro Fuzzy Inference System. J. Adv. Res. Manuf. Mater. Sci. Metall. Eng. 2019, 5, 12–28. [Google Scholar]
  34. Kumar, R.; Bilga, P.S.; Singh, S. An Investigation of Energy Efficiency in Finish Turning of EN 353 Alloy Steel. Procedia CIRP 2021, 98, 654–659. [Google Scholar] [CrossRef]
  35. Kumar, R.; Singh, S.; Bilga, P.S.; Jatin, K.; Singh, J.; Singh, S.; Scutaru, M.-L.; Pruncu, C.I. Revealing the benefits of entropy weights method for multi-objective optimization in machining operations: A critical review. J. Mater. Res. Technol. 2021, 10, 1471–1492. [Google Scholar] [CrossRef]
  36. Kishawy, H.A.; Hegab, H.; Deiab, I.; Eltaggaz, A. Sustainability Assessment during Machining Ti-6Al-4V with Nano-Additives-Based Minimum Quantity Lubrication. J. Manuf. Mater. Process. 2019, 3, 61. [Google Scholar] [CrossRef] [Green Version]
  37. Liu, Z.Y.; Li, C.; Fang, X.Y.; Guo, Y.B. Cumulative energy demand and environmental impact in sustainable machining of inconel superalloy. J. Clean. Prod. 2018, 181, 329–336. [Google Scholar] [CrossRef]
  38. Frischknecht, R.; Wyss, F.; Knöpfel, S.B.; Lützkendorf, T.; Balouktsi, M. Cumulative energy demand in LCA: The energy harvested approach. Int. J. Life Cycle Assess. 2015, 20, 957–969. [Google Scholar] [CrossRef]
  39. Ic, Y.T.; Güler, E.S.; Cabbaroğlu, C.; Yüksel, E.D.; Sağlam, H.M. Optimisation of cutting parameters for minimizing carbon emission and maximising cutting quality in turning process. Int. J. Prod. Res. 2018, 56, 4035–4055. [Google Scholar] [CrossRef]
  40. Branker, K.; Adams, D.; Jeswiet, J. Initial analysis of cost, energy and carbon dioxide emissions in single point incremental forming—Producing an aluminium hat. Int. J. Sustain. Eng. 2012, 5, 188–198. [Google Scholar] [CrossRef]
  41. Jamil, M.; Khan, A.M.; He, N.; Li, L.; Iqbal, A.; Mia, M. Evaluation of machinability and economic performance in cryogenic-assisted hard turning of α-β titanium: A step towards sustainable manufacturing. Mach. Sci. Technol. 2019, 23, 1022–1046. [Google Scholar] [CrossRef]
  42. Santos, M.C.; Machado, A.R.; Barrozo, M.A. Temperature in machining of aluminum alloys. In Temperature Sensing; Books on Demand: Norderstedt, Germany, 2018; p. 71. [Google Scholar] [CrossRef] [Green Version]
  43. Bilga, P.S.; Singh, S.; Kumar, R. Optimization of energy consumption response parameters for turning operation using Taguchi method. J. Clean. Prod. 2016, 137, 1406–1417. [Google Scholar] [CrossRef]
  44. Padilla-Atondo, J.M.; Limon-Romero, J.; Perez-Sanchez, A.; Tlapa, D.; Baez-Lopez, Y.; Puente, C.; Ontiveros, S. The Impact of Hydrogen on a Stationary Gasoline-Based Engine through Multi-Response Optimization: A Desirability Function Approach. Sustainability 2021, 13, 1385. [Google Scholar] [CrossRef]
  45. Jeswiet, J.; Kara, S. Carbon emissions and CES™ in manufacturing. CIRP Ann. 2008, 57, 17–20. [Google Scholar] [CrossRef]
  46. Khan, A.M.; Anwar, S.; Jamil, M.; Nasr, M.M.; Gupta, M.K.; Saleh, M.; Ahmad, S.; Mia, M. Energy, Environmental, Economic, and Technological Analysis of Al-GnP Nanofluid- and Cryogenic LN2-Assisted Sustainable Machining of Ti-6Al-4V Alloy. Metals 2021, 11, 88. [Google Scholar] [CrossRef]
  47. Kumar, R.; Singh, S.; Sidhu, A.S.; Pruncu, C.I. Bibliometric Analysis of Specific Energy Consumption (SEC) in Machining Operations: A Sustainable Response. Sustainability 2021, 13, 5617. [Google Scholar] [CrossRef]
  48. Kumar, R.; Bilga, P.S.; Singh, S. Optimization of Active Cutting Power Consumption by Taguchi Method for Rough Turning of Alloy Steel. Int. J. Metall. Alloys 2020, 6, 37–45. Available online: http://materials.journalspub.info/index.php?journal=IJM&page=article&op=view&path%5B%5D=632 (accessed on 1 December 2020).
  49. Kumar, R.; Bilga, P.S.; Singh, S. Optimization and Modeling of Active Power Consumption for Turning Operations. In Proceedings of the ISME 19th Conference on Advances in Mechanical Engineering (Mechanical Systems and Sustainability), Jalandhar, Punjab, India, 20–22 December 2018; Dr. B. R. Ambedkar National Institute of Technology Jalandhar: Punjab, India; pp. 1–16. [Google Scholar]
  50. Kumar, R.; Bilga, P.S.; Singh, S. Multi objective optimization using different methods of assigning weights to energy consumption responses, surface roughness and material removal rate during rough turning operation. J. Clean. Prod. 2017, 164, 45–57. [Google Scholar] [CrossRef]
  51. Khan, A.M.; Liang, L.; Mia, M.; Gupta, M.K.; Wei, Z.; Jamil, M.; Ning, H. Development of process performance simulator (PPS) and parametric optimization for sustainable machining considering carbon emission, cost and energy aspects. Renew. Sustain. Energy Rev. 2021, 139, 110738. [Google Scholar] [CrossRef]
  52. Chandel, R.S.; Kumar, R.; Kapoor, J. Sustainability aspects of machining operations: A summary of concepts. Mater. Today Proc. 2021. [Google Scholar] [CrossRef]
  53. Gupta, M.K.; Song, Q.; Liu, Z.; Sarikaya, M.; Jamil, M.; Mia, M.; Kushvaha, V.; Singla, A.K.; Li, Z. Ecological, economical and technological perspectives based sustainability assessment in hybrid-cooling assisted machining of Ti-6Al-4 V alloy. Sustain. Mater. Technol. 2020, 26, e00218. [Google Scholar] [CrossRef]
Figure 1. EDX analysis of the Al-Mg-Zr alloy.
Sustainability 13 07321 g001
Figure 2. Experimental setup under MQL conditions.
Sustainability 13 07321 g002
Figure 3. Main effect plots for SN ratios of surface roughness.
Sustainability 13 07321 g003
Figure 4. Main effect plots for surface roughness.
Sustainability 13 07321 g004
Figure 5. Main effect plots for SN ratios of cutting temperature.
Sustainability 13 07321 g005
Figure 6. Main effects plot for cutting temperature.
Sustainability 13 07321 g006
Figure 7. Desirability bar chart for optimum solution.
Sustainability 13 07321 g007
Figure 8. Proposed ANN architecture (3-9-2).
Sustainability 13 07321 g008
Figure 9. Sugeno ANFIS-based predictive model.
Sustainability 13 07321 g009
Figure 10. Membership function for input variable (a) depth of cut, (b) cutting speed, and (c) feed rate.
Sustainability 13 07321 g010
Figure 11. ANFIS-generated rule viewer for (a) surface roughness and (b) cutting temperature.
Sustainability 13 07321 g011aSustainability 13 07321 g011b
Figure 12. Variation of (a) surface roughness and (b) cutting temperature on different combinations of inputs (depth of cut, cutting speed, and feed rate).
Sustainability 13 07321 g012
Figure 13. Comparison between experimental and predicted results of surface roughness.
Sustainability 13 07321 g013
Figure 14. Comparison between experimental and predicted results of cutting temperature.
Sustainability 13 07321 g014
Figure 15. (a) Processing-time, (b) energy efficiency, (c) specific cutting energy, and (d) carbon emissions against the experimental run and cooling modes.
Sustainability 13 07321 g015
Table 1. Composition of the developed Al/Mg/Zr alloy.
ElementWeight %Atomic %
Mg34.8151.67
O11.3412.63
Al52.1834.47
Zr1.671.22
Table 2. Experimental input parameters and resultant responses.
Variable 1Variable 2Variable 3Response 1Response 2
Runt: Depth of Cut
(mm)
Vc: Cutting
Speed
(m/min)
S0: Feed Rate
(mm/rev.)
Ra: Surface
Roughness (µm)
θ: Cutting Temperature
(°C)
10.25860.10.508135.79
20.251120.120.625152.24
30.251380.140.784173.45
40.251430.160.815177.53
50.251780.181.030206.09
60.45860.120.49134.66
70.451120.140.735165.50
80.451380.160.894186.77
90.451430.180.925190.85
100.451780.11.140219.41
110.65860.140.728162.43
120.651120.160.845178.88
130.651380.181.004200.09
140.651430.11.035204.17
150.651780.121.250232.73
160.85860.160.795170.98
170.851120.180.955192.20
180.851380.11.114213.41
190.851430.121.145217.49
200.851780.141.360246.05
211.25860.181.015197.62
221.251120.11.175218.84
231.251380.121.334240.05
241.251430.141.365244.13
251.251780.161.580272.69
Table 3. Cutting parameters and different levels.
Variables UnitsLevel 1Level 2Level 3Level 4Level 5
Depth of cut (t)mm0.250.450.650.851.25
Cutting speed (Vc)m/min86112138143178
Feed rate (S0)mm/rev.0.10.120.140.160.18
Table 4. Response table for SN ratios (surface roughness).
LevelDepth of CutCutting SpeedFeed Rate
10.75280.70740.9948
20.83720.86710.9692
30.97281.02680.9948
41.07431.05750.9863
51.29431.27240.9863
Delta0.54150.56500.0256
Rank213
Note: Smaller is better.
Table 5. Response table for SN ratios (cutting temperature).
LevelDepth of CutCutting SpeedFeed Rate
1−44.47−44.01−45.81
2−44.97−45.11−45.59
3−45.77−46.09−45.79
4−46.30−46.26−45.77
5−47.36−47.40−45.90
Delta2.893.390.32
Rank213
Note: Smaller is better.
Table 6. Analysis of variance for surface roughness.
SourceSSdfMSF-Valuep-ValueContribution
Model1.8030.59951152.52<0.0001significant
t0.895610.89561721.90<0.000149.48%
Vc0.902810.90281735.65<0.000149.87%
S07.688× 10−917.688 × 10−90.00000.9970
Residual0.0109210.0005
Cor. Total1.8124
Table 7. Analysis of variance for cutting temperature.
SourceSSdfMSF-valuep-ValueContribution
Model29,087.4039695.801462.35<0.0001significant
t13,136.15113,136.151981.23<0.000144.94%
Vc15,951.25115,951.252405.82<0.000154.57%
S00.000510.00050.00010.9932
Residual139.24216.63
Cor. Total29,226.6424
Table 8. Goals and factor range for optimization of surface roughness and cutting temperature.
FactorGoalLimitWeightImportance
LowHighLowHigh
tis in range0.251.25113
Vcminimize86178113
S0is in range0.10.18113
Raminimize0.491.58042114
θis in range134.66272.698114
Table 9. Summary of the values obtained from optimization.
No.tVcS0RaθDesirability
10.30586.0000.1800.496134.6600.997Selected
20.26489.3070.1800.494134.6600.983
30.39686.0000.1800.546140.7190.970
40.41486.0000.1800.555141.9060.965
50.44586.0000.1000.573143.9920.956
60.50486.5960.1000.609148.4220.933
70.57389.9310.1000.667155.7060.887
Table 10. Statistical data of the response parameters using different learning algorithms.
Learning AlgorithmNo. of NeuronsTraining DataTesting Data
R2R2
RaθRaθ
LM90.997320.998470.996430.9964
LM120.996120.997270.99150.9927
LM150.991030.992180.95740.9584
LM200.984310.985460.964870.96597
LM240.963560.964710.976720.97773
CGP90.992420.993570.99430.9973
CGP120.991850.99280.99150.9927
CGP150.991510.992660.993880.9948
CGP200.991360.992510.994670.9956
CGP240.991450.992600.995210.9964
SCG90.991370.992520.994880.9974
SCG120.991560.992710.99440.9967
SCG150.991990.99290.994640.9976
SCG200.991610.992710.993520.9975
SCG240.991820.992860.993510.99658
BFG90.992080.993280.996380.9973
BFG120.992150.994150.996310.9971
BFG150.991870.992970.995630.9966
BFG200.991710.992760.995320.9962
BFG240.991810.99280.993730.9947
Table 11. MAPE calculation using ANN- and ANFIS-based predictive models.
RunExp. ResultANN Predicted ResultANFIS Predicted Result
RaθRaθRaθ
(μm)(°C)(μm)(°C)(μm)(°C)
10.508135.790.49132.340.508133
20.625152.240.611151.340.625152
30.784173.450.654170.890.735173
40.815177.530.8174.230.816175
51.030206.091.025197.661.03206
60.49134.660.523133.620.49135
70.735165.500.687156.260.735162
80.894186.770.882181.880.872184
90.925190.850.911188.220.926187
101.140219.411.09211.91.14217
110.728162.430.644151.440.728154
120.845178.880.836169.130.845175
131.004200.090.956195.10.96200
141.035204.171.043200.761.04202
151.250232.731.2225.431.25227
160.795170.980.77166.980.796171
170.955192.200.946183.320.955192
181.114213.411.034206.661.11213
191.145217.491.1262091.15217
201.360246.051.33237.441.36246
211.015197.620.936188.741.004195
221.175218.841.12211.761.155214
231.334240.051.304222.131.33240
241.365244.131.311237.561.34244
251.580272.691.562641.58273
MAPE3.953.451.0721.172
Publisher’s Note: MDPI stays neutral with regard to jurisdictional claims in published maps and institutional affiliations.

