
Market Structure of Urban Waste Treatment and Disposal: Empirical Evidence from the Italian Industry


Department of Business and Law, University of Milano-Bicocca, 20126 Milan, Italy
*
Author to whom correspondence should be addressed.
Sustainability 2021, 13(13), 7412; https://0-doi-org.brum.beds.ac.uk/10.3390/su13137412
Submission received: 28 May 2021
/
Revised: 17 June 2021
/
Accepted: 28 June 2021
/
Published: 2 July 2021
(This article belongs to the Special Issue Management of Solid Waste)
Abstract
:In light of the organizational dynamics of services of economic interest, the regulation of municipal solid waste management is a critical issue to deal with so as to achieve sustainability goals in the coming decades. The European circular economy targets limit the share of municipal waste in landfills to a maximum of 10% by 2035. Consequently, waste-to-energy plants may temporarily become the primary option for residual unsorted waste. The municipal waste management chain comprises two consequential stages: collection and transport, and the treatment and disposal stage, which characterizes as an oligopolistic market structure. After defining the relevant market and calculating market concentration measures, we analyze market power in the treatment and disposal of non-recyclable mixed waste, also known as residual waste. Our analyses are based on empirical data using well-known market concentration indices such as the Herfindahl–Hirschman index and concentration ratios. We report the results of three different market concentration scenarios based on alternative geographic and product market definitions. Considering only waste-to-energy as a product market, we present a situation of moderate concentration, typically involving the attention of competition authorities. On the contrary, considering both options as a single product market, no relevant evidence emerges due to the significant share of waste sent to landfills in 2019, i.e., 20.1% of the total municipal solid waste generated in Italy. Implications for future studies consist of new detailed information on the municipal waste treatment market structure in one of the leading European countries that may prompt comparative studies. Policy implications are derived from the possibility of taking cues from this paper to envisage appropriate regulatory models for an evolving sector in which market spaces are increasing.
1. Introduction
Municipal solid waste (MSW) management is one of the most important local services, and its effective economic regulation can be a driver for the sector toward innovation, sustainability, and efficiency. Prominent economic topics include, among others, the analysis of the market structure [1], the regulatory frameworks [2], or charging models of waste management services [3].
Waste management sustainability targets are at the heart of policies [4] worldwide due to global commitment in sustainable development goals, given that by 2050, 3.40 billion tons of waste annually are expected to be generated globally, one and a half times more than today [5]. In Europe, these targets are highlighted in the so-called circular economy package [6].
It is no wonder that efficient regulation of the waste management chain is essential [2] if environmental sustainability targets are to be met while economic efficiency is improved.
Differently from other utilities such as water, gas, or electricity, stages of the MSW management chain are virtually independent, i.e., not linked from physical elements used to transport the material from one stage to the following.
The MSW management chain includes two consequential stages that differ both technically and economically. First comes the collection and transport (CT) stage, in which the separation of unsorted and sorted waste takes place, and second comes the treatment and disposal stage (TD), where recyclable waste is treated, and residual waste is disposed of. Disposal typically happens by landfilling or incinerator options, among which waste to energy (WTE) plants that generate energy from waste [7] are placed before landfilling in the waste hierarchy [8] given, generally, their lower environmental impact compared to landfilling. However, it is worth noting that that WTE plants have several problems associated with emissions and the pollutant ashes eventually have to be disposed of also by mean of landfills.
The MSW management chain and the role of the different operators in it varies considerably both across and between countries [9]. Consequently, it is increasingly important to lay the foundations for benchmarking and comparative purposes to design environmentally, economically, and socially efficient waste management systems [10].
Previous literature has provided insights on the functioning of the market as a complete cycle, frequently using economic variables such as total cost of the service [11], the efficiency of the service [12], or even options to regulate the service [13]. The sector is constantly expanding, giving rise to new challenges in terms of economic regulation, taking into account the existing balance and the difficulty in distinguishing between public service and the market. One aspect that is evident is that the space for competition in the market has become much larger, and likewise, the role of regulation has also increased [14]. The legal basis of competition in MSW management is rooted in the Treaty on the Functioning of the European Union that aims to prevent distortions on and restrictions of competition. Specifically, Articles 14, 59, 93, 106, 107, 108, and 114 for public services, services of general interest, and services of general economic interest [15].
The design of efficient regulation calls for the analysis of the MSW management chain industrial structure, including market concentration measures and the boundaries between public services and the market [14]. Indeed, competition analysis relies on the market definition paradigm, under which a relevant market is defined in order to make inferences about market power [16]. The inferences relate to the importance of the relevant market in the analysis of the competition and, in particular, the economic substitutability of products as measured according to the notion of market power in the relevant market [17]. Currently, nevertheless, there is a significant information asymmetry preventing the sound regulation of the MSW management industry [18] and in this paper, we focus on the information inherent in market power.
Our goal is to reduce the information gap to help overcome the regulatory failures that affect the functioning of the waste management market, since the degree of concentration in the TD stage, in particular of TD of residual waste, is likely to increase in the short and medium-term. Therefore, problems of market regulation and issues regarding the regulation of access to the infrastructure typical of network industries arise with operators with high market power [19]. We contribute to this topic by focusing on the current degree of market concentration in the TD of residual waste and on the governance model of waste flows and tariff regulation.
Having defined the relevant market and calculated the market concentration measures, we analyze the market power in the treatment and disposal of the unsorted unrecyclable waste, also known as residual waste. Our results help to understand potentially abusive conduct of competition, including bundling and leverage strategies with the risk of vertical foreclosure, i.e., the possibility for operators with dominant positions in a stage to extend their power into adjacent market stages.
We provide insights to policymakers in order to define industrial and environmental policies aimed at fostering the transition to the circular economy. Since the TD of residual waste involves using landfill and WTE plants, these two options must be considered complementary solutions with different regulatory and managerial frameworks.
Our analyses are based on empirical data using well-known market concentration indexes such as the Herfindahl–Hirschman Index (HHI) and the concentration ratio (CR). The HHI measures the level of concentration in a given industry and is widely recognized as an indicator of market competition [20]. In the same vein, the CR is usually measured as the sum of the market share of the largest operators [21].
We report on the results of three different market concentration scenarios based on alternative definitions of geographical and product markets. Considering only WTE plants as a product market, a moderate market concentration arises. Conversely, considering both options as a single product market, no relevant elements emerge due to the significant share of waste still sent to landfills in 2019.
Regarding the relationship with the regulatory framework, there is no clear relationship between the governance model and the cost of treatment, although consistent with previous literature, efficient costs seem to correlate with regions relying on the market for price regulation [22].
The implications of our work on competition policy are twofold. First, we provide novel, detailed information regarding the structure of the municipal waste treatment market in one of the main European member states. Second, we lay the groundwork for further assessments inherent in the governance models of waste treatment flows and regulation.
2. Materials and Methods
2.1. Background
Since the definition of the relevant market makes it possible to calculate market measures, for our analysis to be robust, it is necessary to define the product dimension and the geographic dimension. Generally speaking, the relevant market can be defined as the smallest context within which it is possible to generate a significant degree of market power [23]. In economic terms, market power is the ability of a company to profitably raise its price above the competitive price according to different drivers [24]. A relevant product market comprises products and/or services that are interchangeable or substitutable due to product characteristics, prices, and use. In this paper, the relevant product market is unsorted/residual waste and options for its treatment. Similarly, the relevant geographic market includes the area where competition conditions are homogeneous and distinguished from neighboring areas. In this paper, the geographically relevant market is Italy and its regions. Finally, the relevant market is the combination of the product and the geographic markets. In this paper, three scenarios of relevant markets are identified: (scenario 1) WTE and landfills, (scenario 2) WTE, (scenario 3) landfills. Market concentration analyses largely rely on well-known market concentration measures such as the HHI and the CR. The HHI assesses the level of concentration in a given industry according to which a market can be depicted as low or non-concentrated, moderately concentrated, or concentrated [20]. In the same vein, the CR of market concentration is usually quantified as the sum of the market shares of the largest operators in the industry [21].
We intend to contribute to a new strand of literature inherent in the market structure of unsorted, non-recyclable waste treatment because of the progressive linear reduction of landfilling.
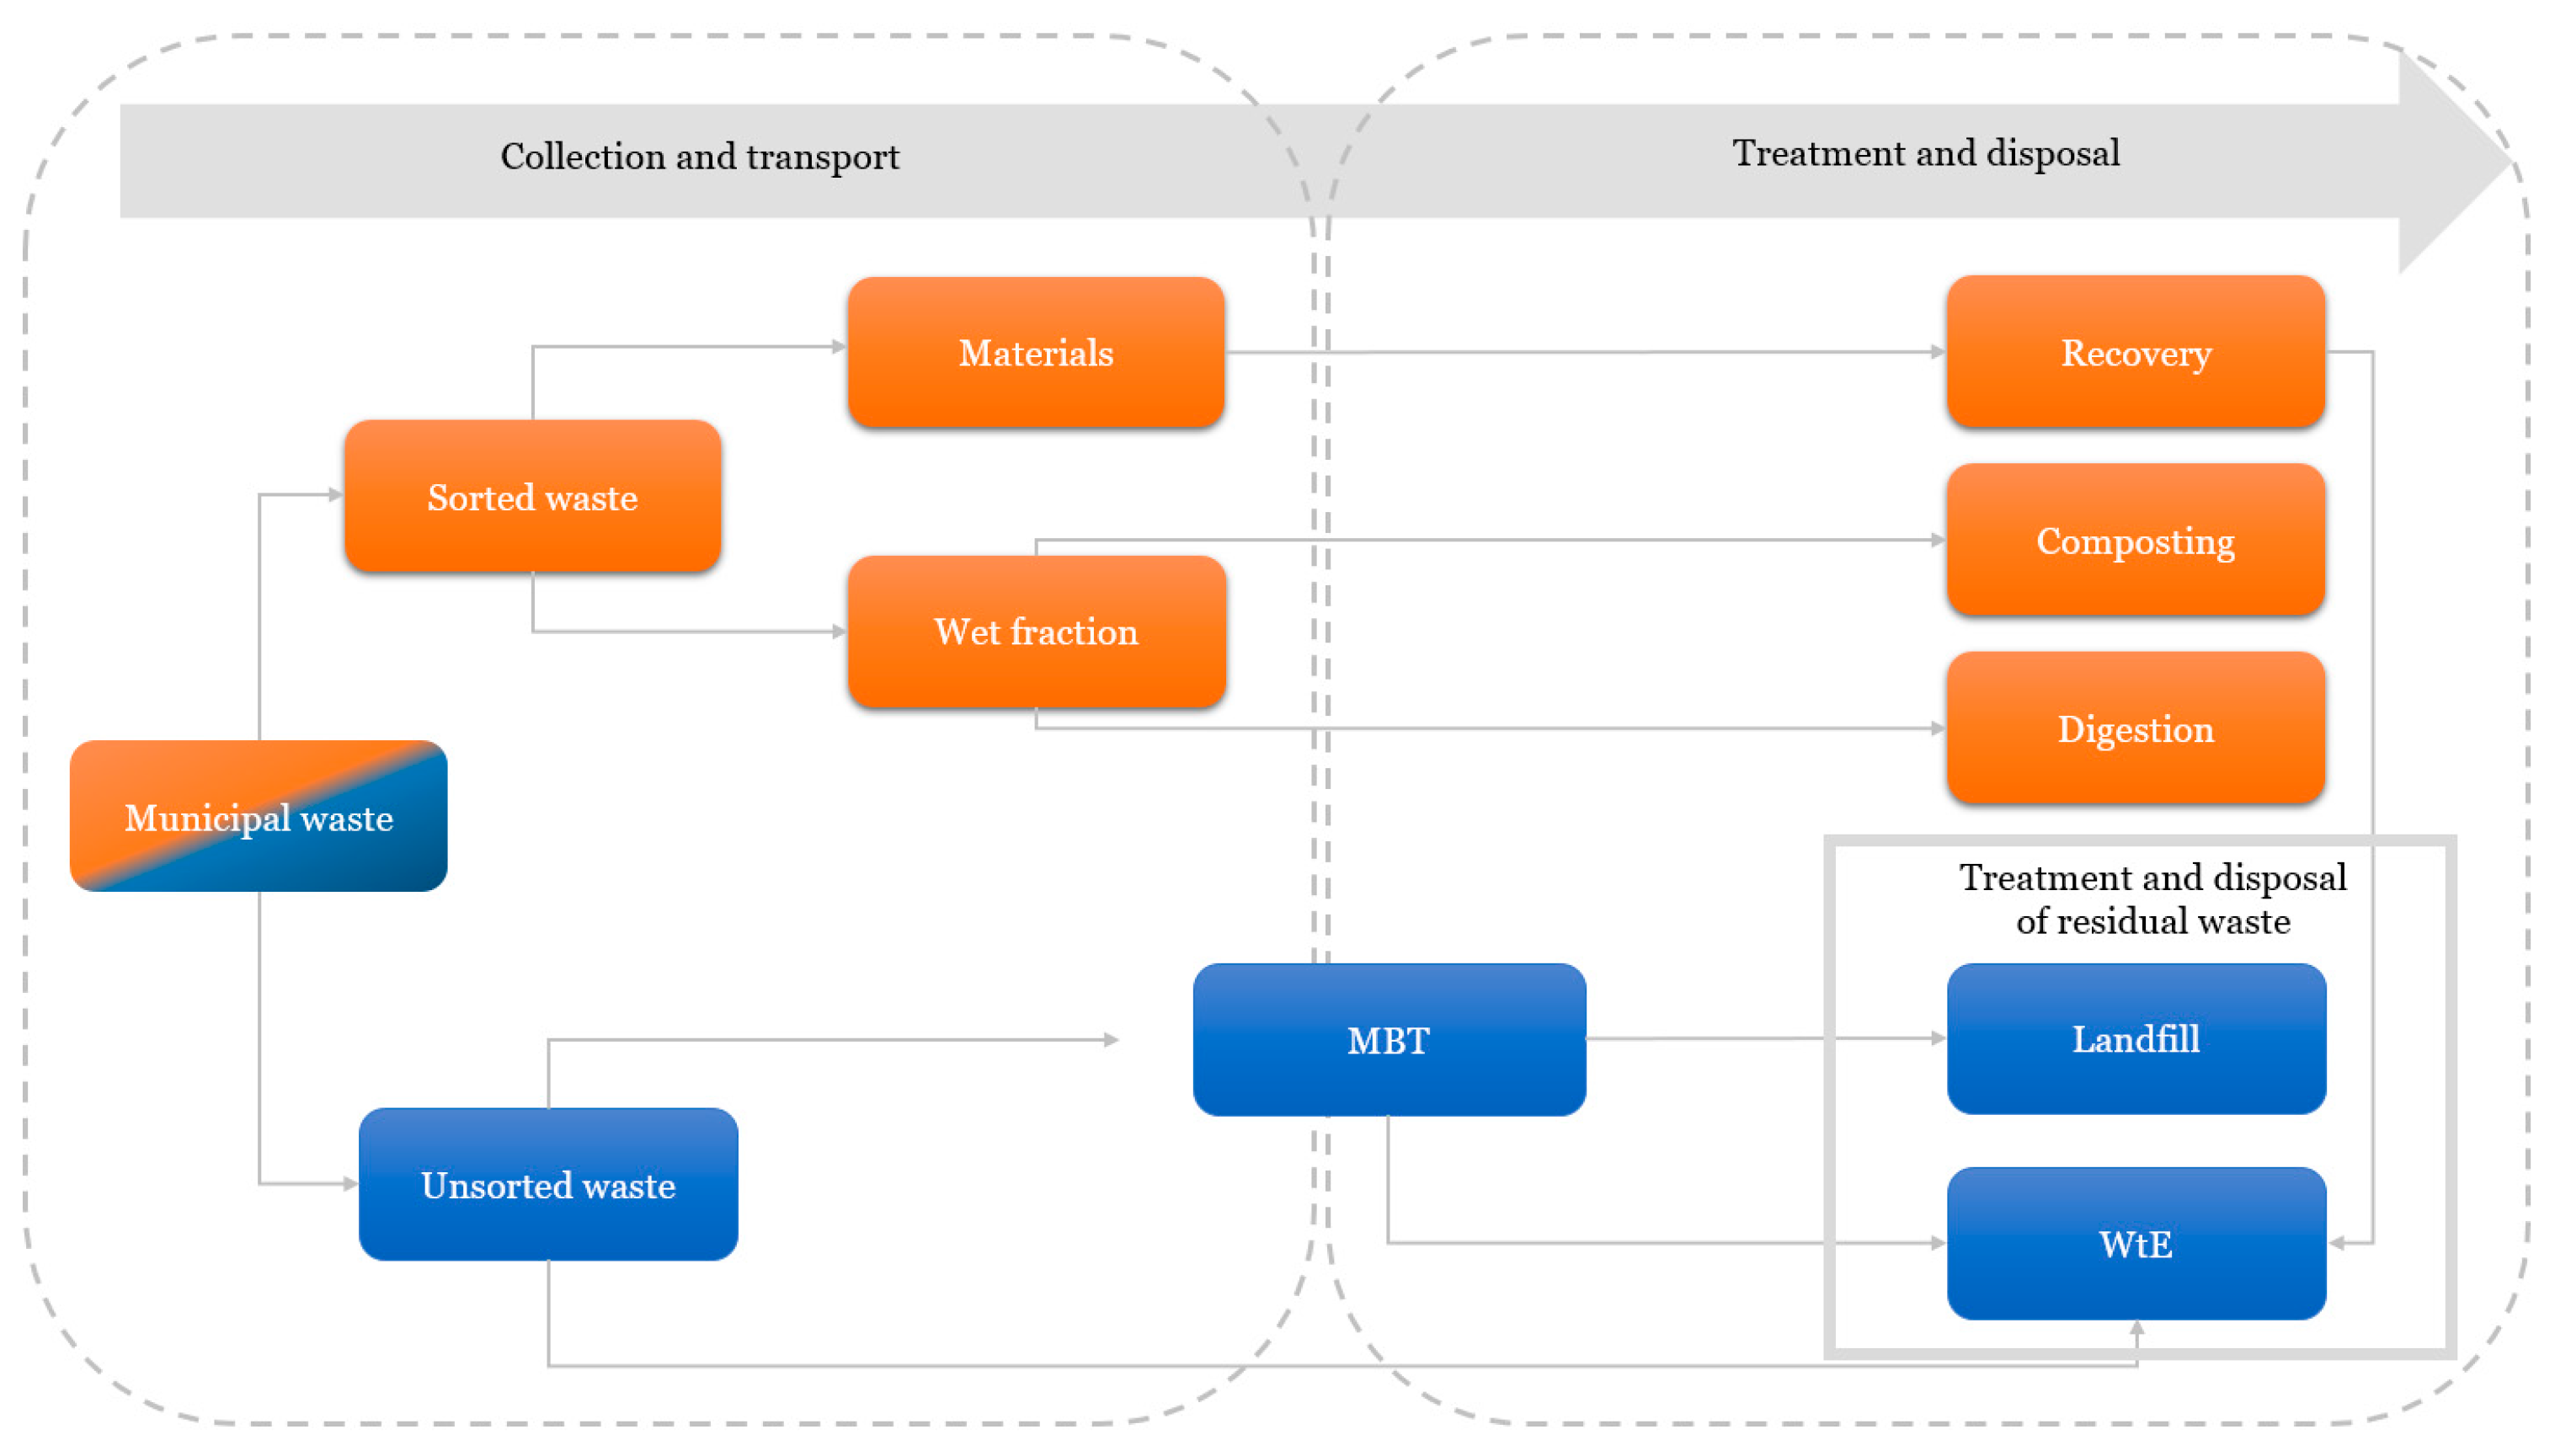
Figure 1 shows the MSW management chain: the left-hand side reflects the CT stage, which we do not discuss in this paper, while the right-hand side includes the TD of the residual waste stages. The relevant markets, landfill and WTE, are in the bottom-right hand corner.
For modeling purposes, WTE and landfill can first be included in the same product market and independently analyzed later. The same holds true for the geographical dimension where, for modeling reasons, the relevant market can be national or sub-national. The significance of this paper also lies in the fact that there is a certain degree of freedom in the definition boundaries, making them reproducible worldwide depending on local conditions.
The scope of our research is the treatment and disposal of unsorted non-recyclable waste as labeled in the bottom-right side.
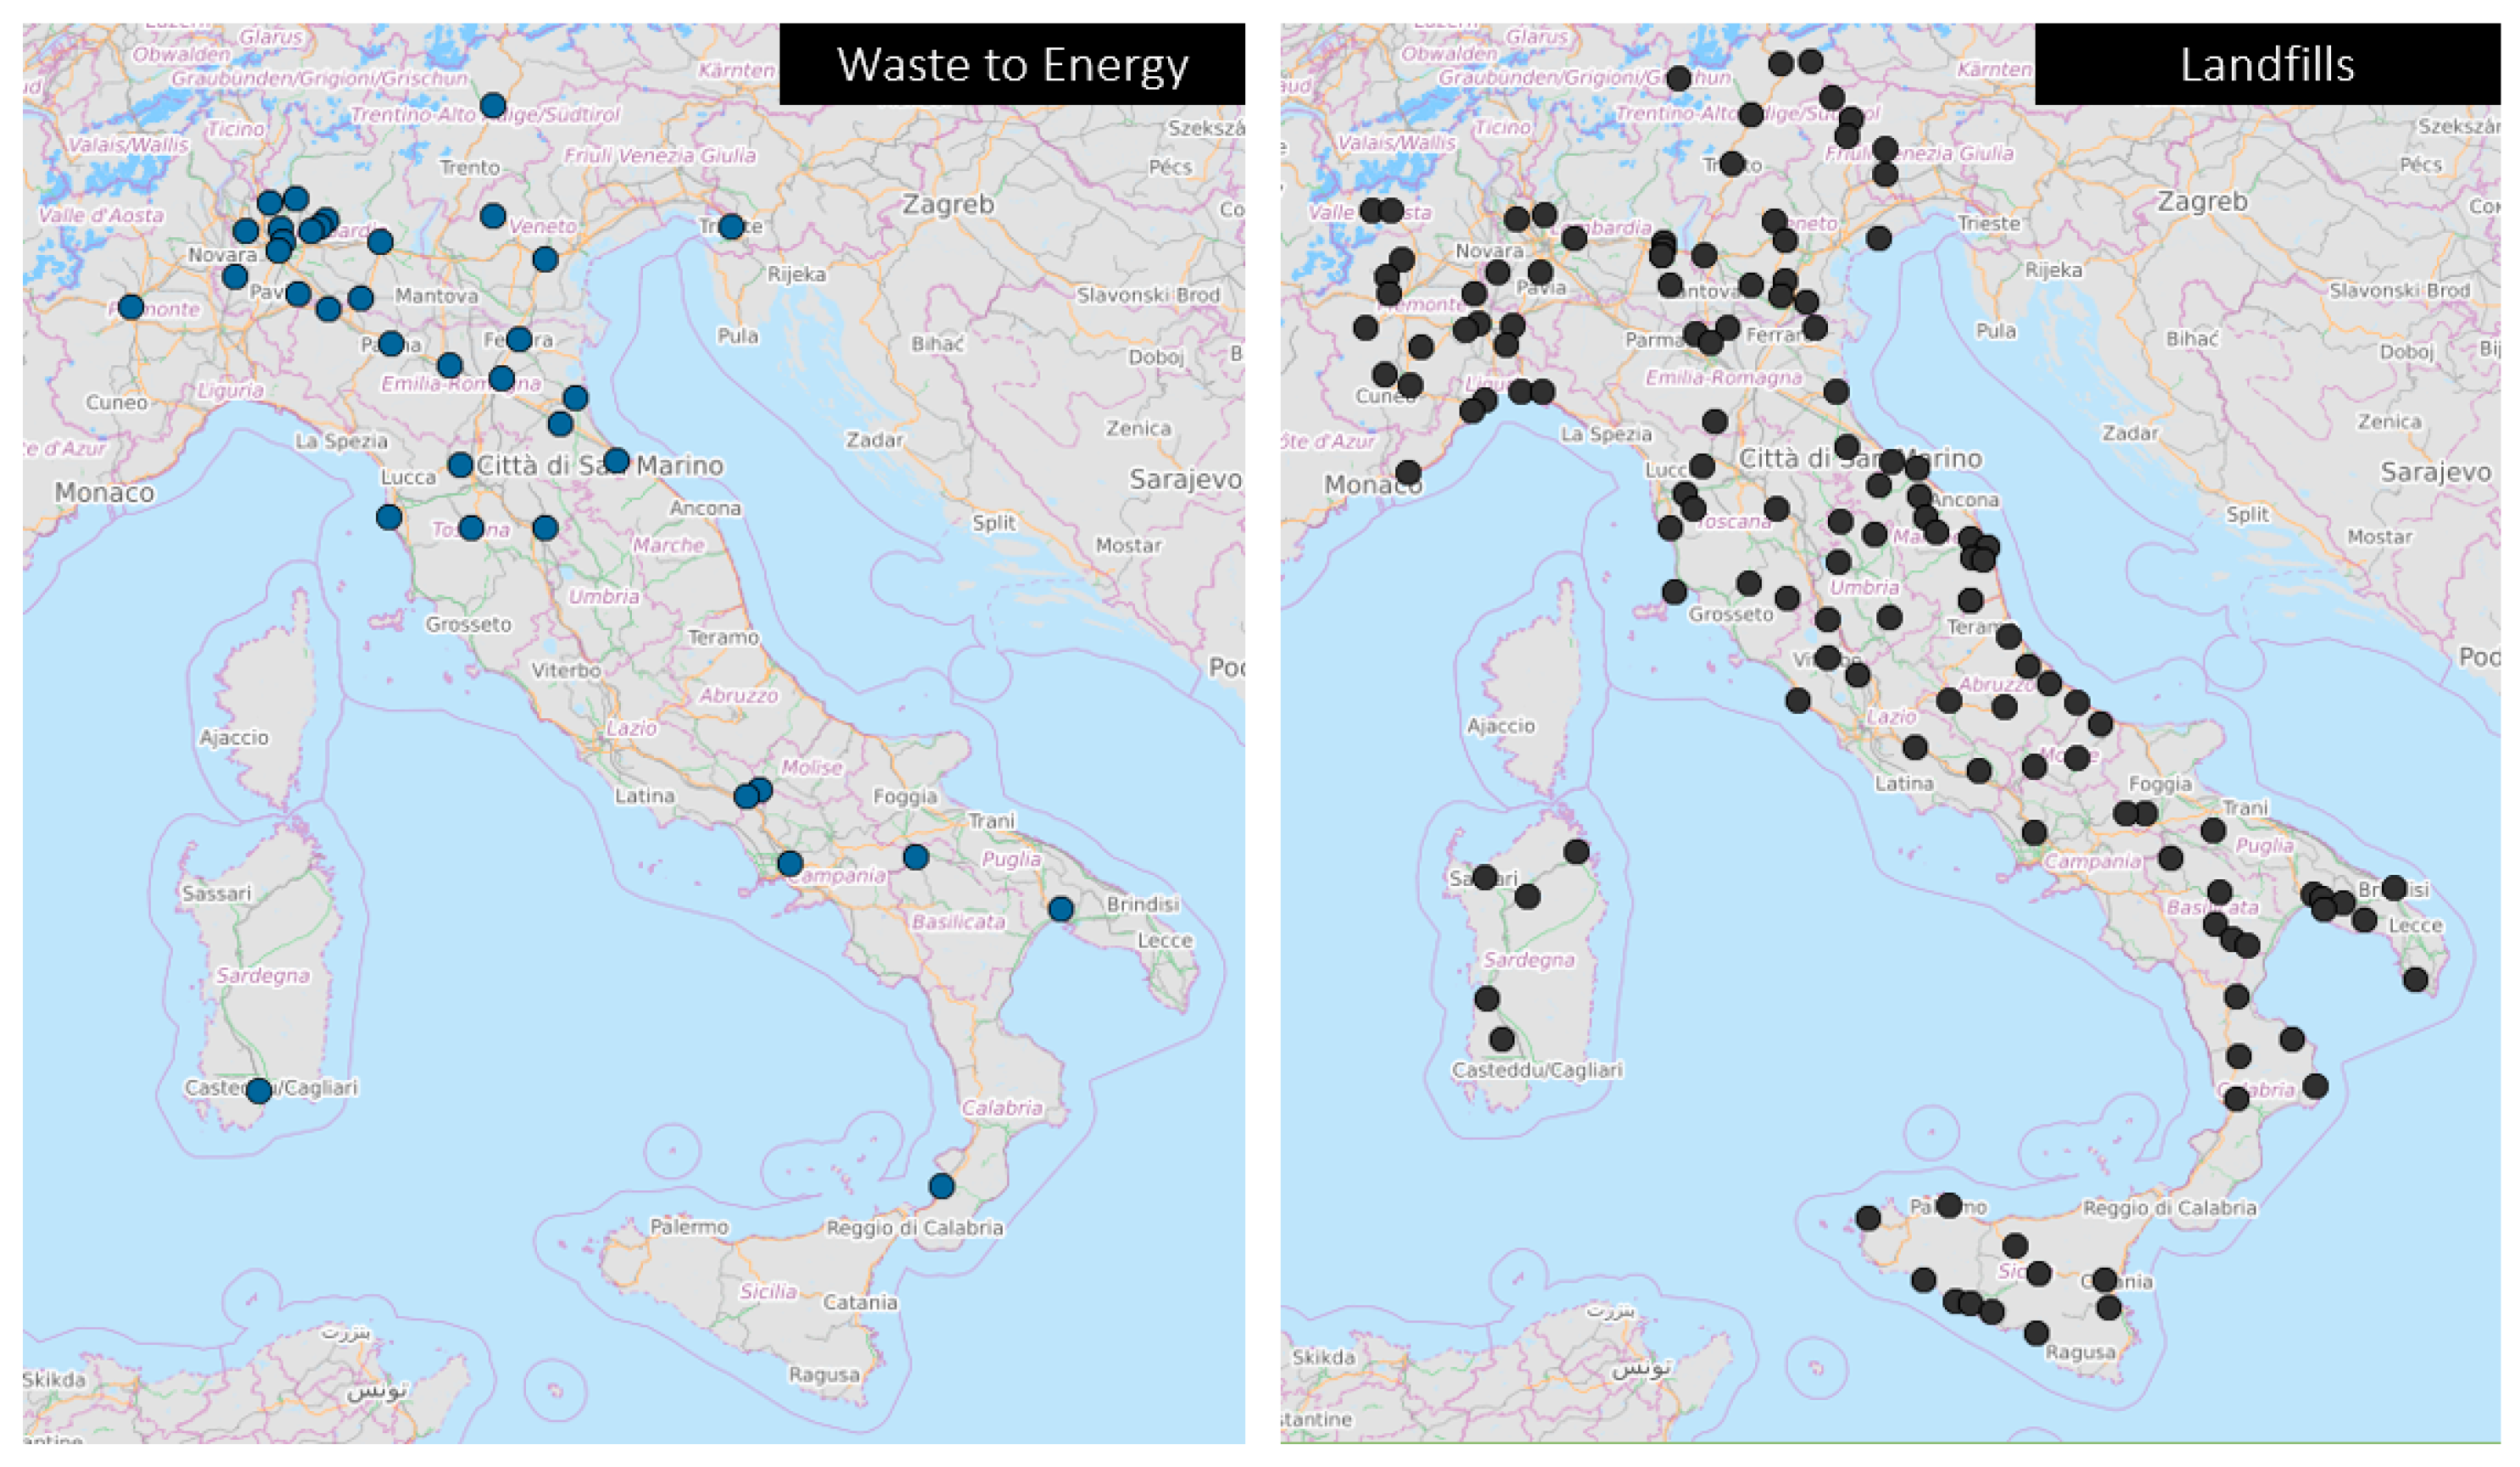
Based on Figure 1, showing the municipal waste management supply chain, we use the following assumptions about the operation of individual supply chains. Although the regulatory framework differs across countries, CT typically falls into a legal monopoly regulation, characterized by the presence of cost sub-additivity, poor economies of scale, and short investment payback time. Similarly, the landfill disposal segment is a legal monopoly, or a contestable market, with low sub-additivity of costs, low economies of scale, and low investment payback time. Finally, the WTE segment resumes an oligopolistic market or monopolistic competition with no sub-additivity of costs, high economies of scale, and high payback time for investments. Figure 2 highlights how the geographic distribution of WTE is unbalanced.
Our purpose is to evaluate the concentration of the TD of the residual waste stage of unsorted municipal waste to calculate the market power of the operators. The problem that we intend to overcome is the lack of information regarding the market balance between operators in the management of municipal waste. At the time of writing, there is a significant under-capacity of WTE that is counterbalanced by landfilling.
2.2. Data Gathering and Research Questions
Data about quantities of waste treated by each WTE plant or sent to landfills were extrapolated from the waste register managed by the Italian National Institute for Environmental Protection. In addition, we extrapolated the balance sheets of all the companies managing WTE plants and landfills from the Amadeus database. The data collection lasted three months and enabled us to calculate concentration indices. The data refer to 2019, the latest available year at the time of writing.
In view of a progressive linear reduction in landfill use, two prominent questions arise: what is the current degree of market concentration in the TD stage? Given that the WTE plants can be monopolies under certain circumstances, it is conceivable that with the progressive reduction of waste disposed of in landfills, the market for the treatment of unsorted waste could tend toward greater concentration? Regarding the model of governance of waste flows and tariff regulation, we hypothesize that the model characterized by free movement is appropriate where there is an adequate presence of treatment plants.
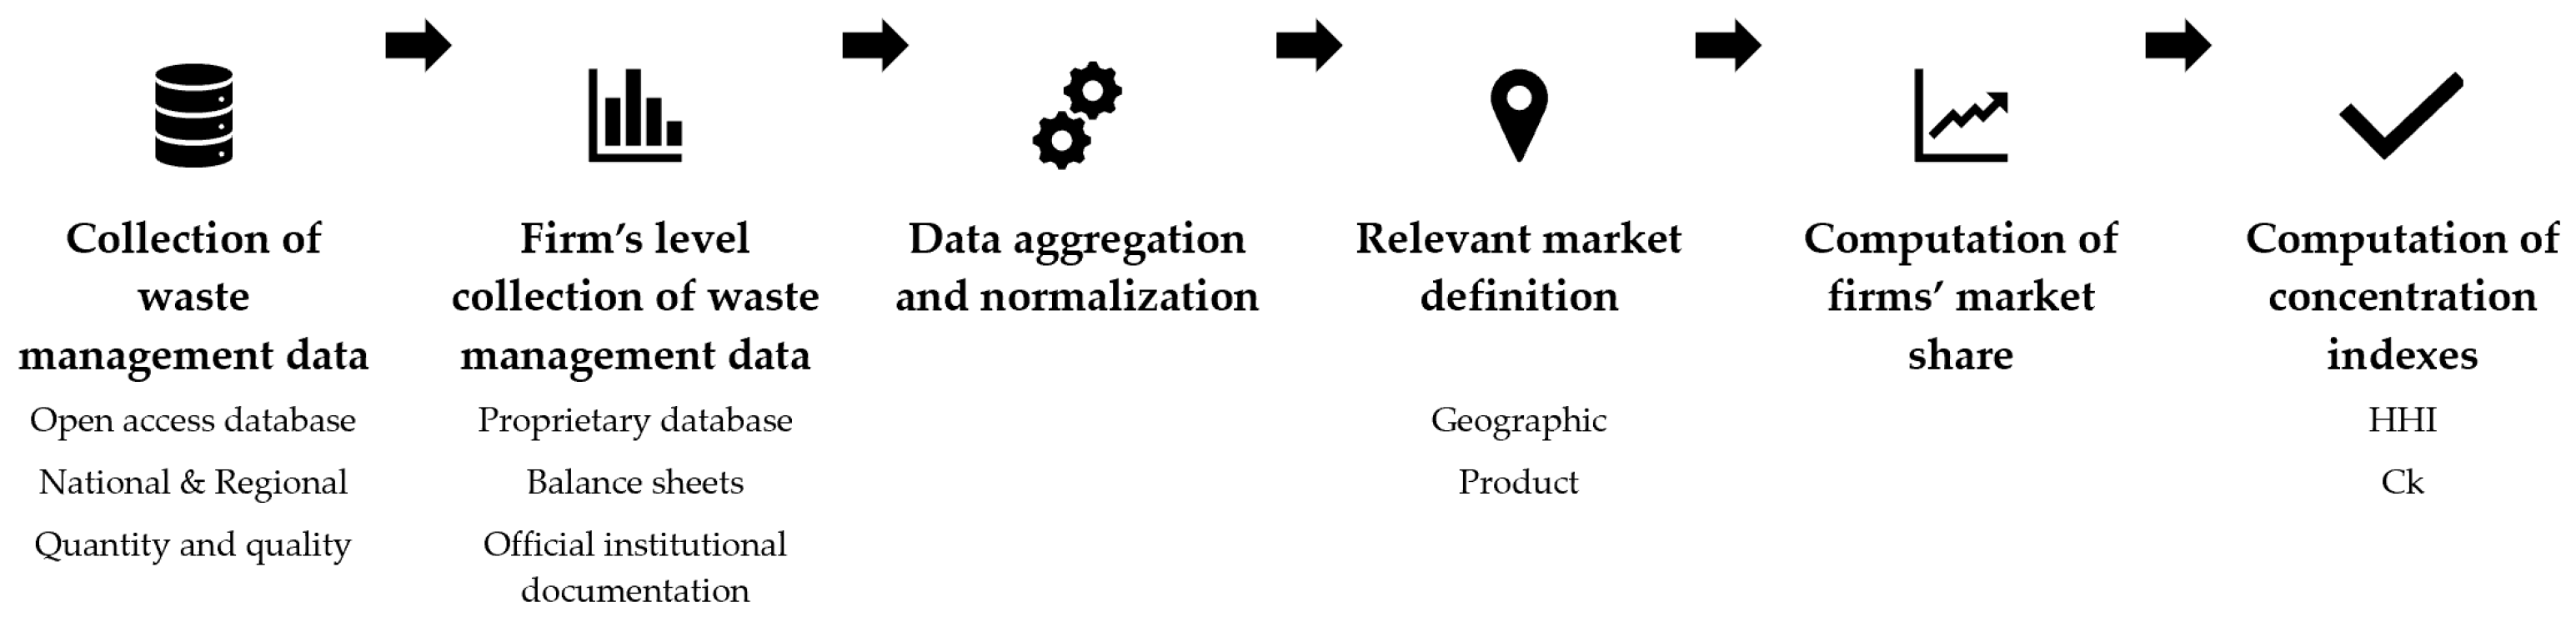
The research process we followed to empirically analyze the industry is resumed in Figure 3.
2.3. Concentration Measures
To calculate the degree of competition and concentration in an industry, economists primarily use two measures: the CR and the HHI.
The CR of k-firms is presented in Equation (1) where k is the number of the largest operators in the industry taken into consideration, Si the market share of the operator i, with i that in our analysis ranged from 1 to k = 4 and 0 < CR <100, where 0 corresponds to perfect competition, and 100 reflects a monopoly.
In our research, the concentration ratio was first replicated using four operators, namely: CR1, CR2, CR3, and CR4. The HHI corresponds to the sum of the squares of the market shares S of all n operators in the market that can be formalized as in Equation (2):
The HHI index provides a widely used information regarding competitive pressure in the market as it ranges from 0 in the case of perfect competition and 10,000 in the case of a monopoly.
3. Results
We provide a background to the waste management industrial organization to give context to our results. Table 1 presents descriptive statistics of key waste management variables, which show that the situation is heterogeneous. This is true from the points of view of the structure of the market, of the cost of management itself, and of the orographic variables and the quality of the sorted waste. For example, there are regions in which the market is highly concentrated in the hands of a single operator. Similarly, the cost of municipal waste management is quite divergent, to the point of being twice as expensive in some regions as compared to other regions. Finally, the data regarding the percentage of the separate collection also show imbalances as set out in Table 2.
Our goal is to provide useful information to policymakers by developing indices of market concentration in the treatment of unsorted waste.
Table 3 presents the data inherent in the concentration indices at the regional level, from which we note that only in four cases out of 20 is the HHI index less than 2000.
Table 4 contains the correlations between the main variables used. Table 4 shows the implications of some drivers of MSW management costs that are economies of scale in waste management [11,25]. This highlights the fact that when the principle of proximity is used as a guideline for the management of waste, limiting the movement of waste between different regions, the principle works if there is adequate unsorted waste treatment capacity.
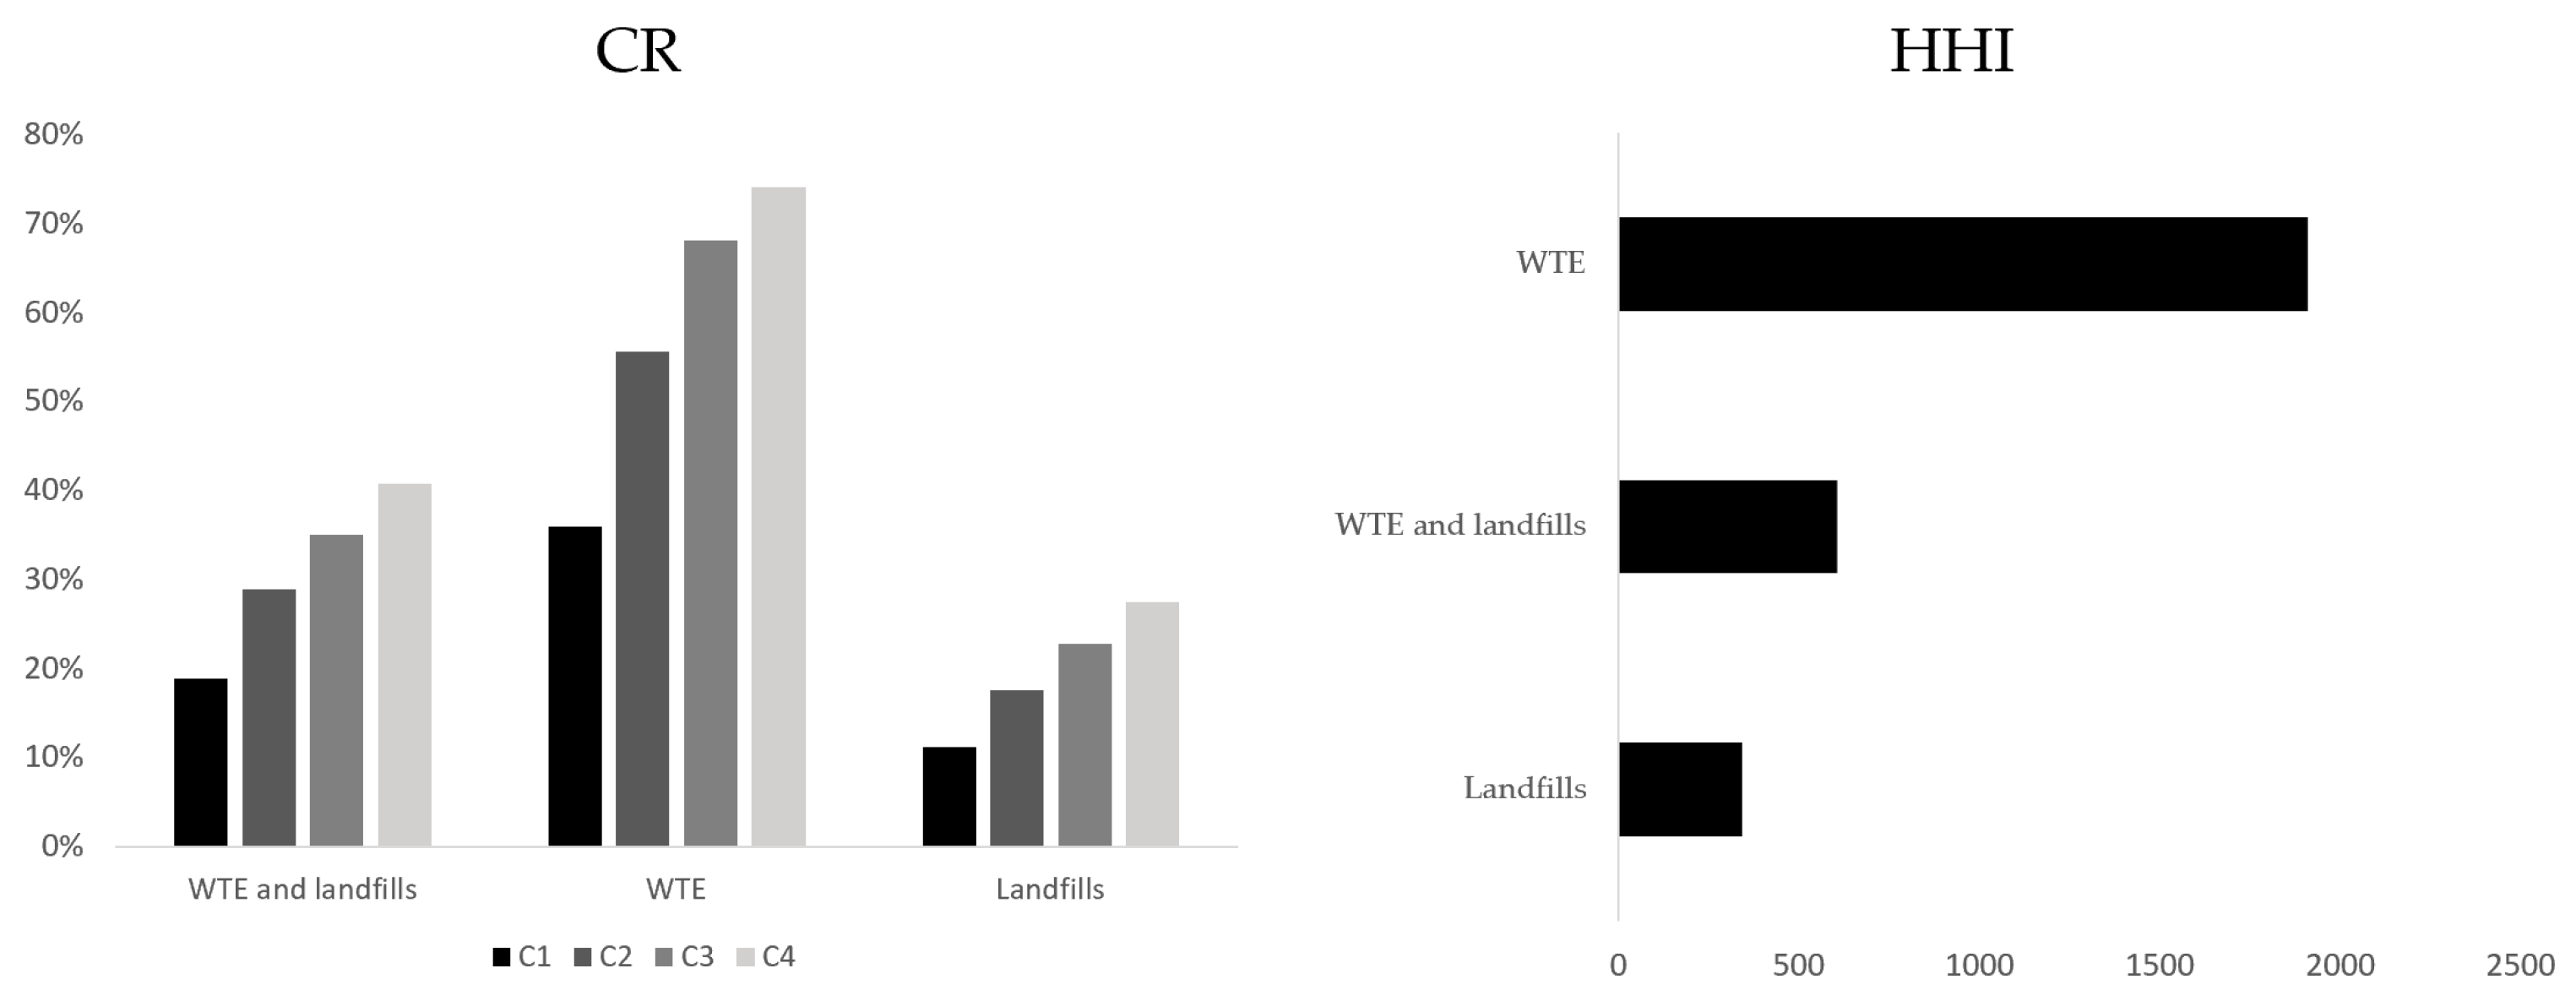
We introduce below the main results obtained from the data analysis. Figure 4 presents the main information derived from our analysis. In particular, we consider Italy as a geographical dimension, and, from a product point of view, we consider three scenarios that correspond to the three rows of the table.
Figure 4 allows us to draw some considerations regarding the market structure. Insofar as the national market is concerned, considering landfills and WTE, a relatively competitive situation emerges, which, however, could be misleading. At this level of analysis, it is not possible to verify whether there are market distortions in different areas of the country.
As expected, considering the commodity size limit of landfills at the national level, substantial competition emerges. This form of waste disposal solution is widespread in all Italian regions and is the only solution in six out of the 20 regions. The situation changes noticeably when we take into consideration, as a commodity size, the waste from energy plants. In this case, we notice a HHI index close to 2000, which is a situation of moderate market concentration.
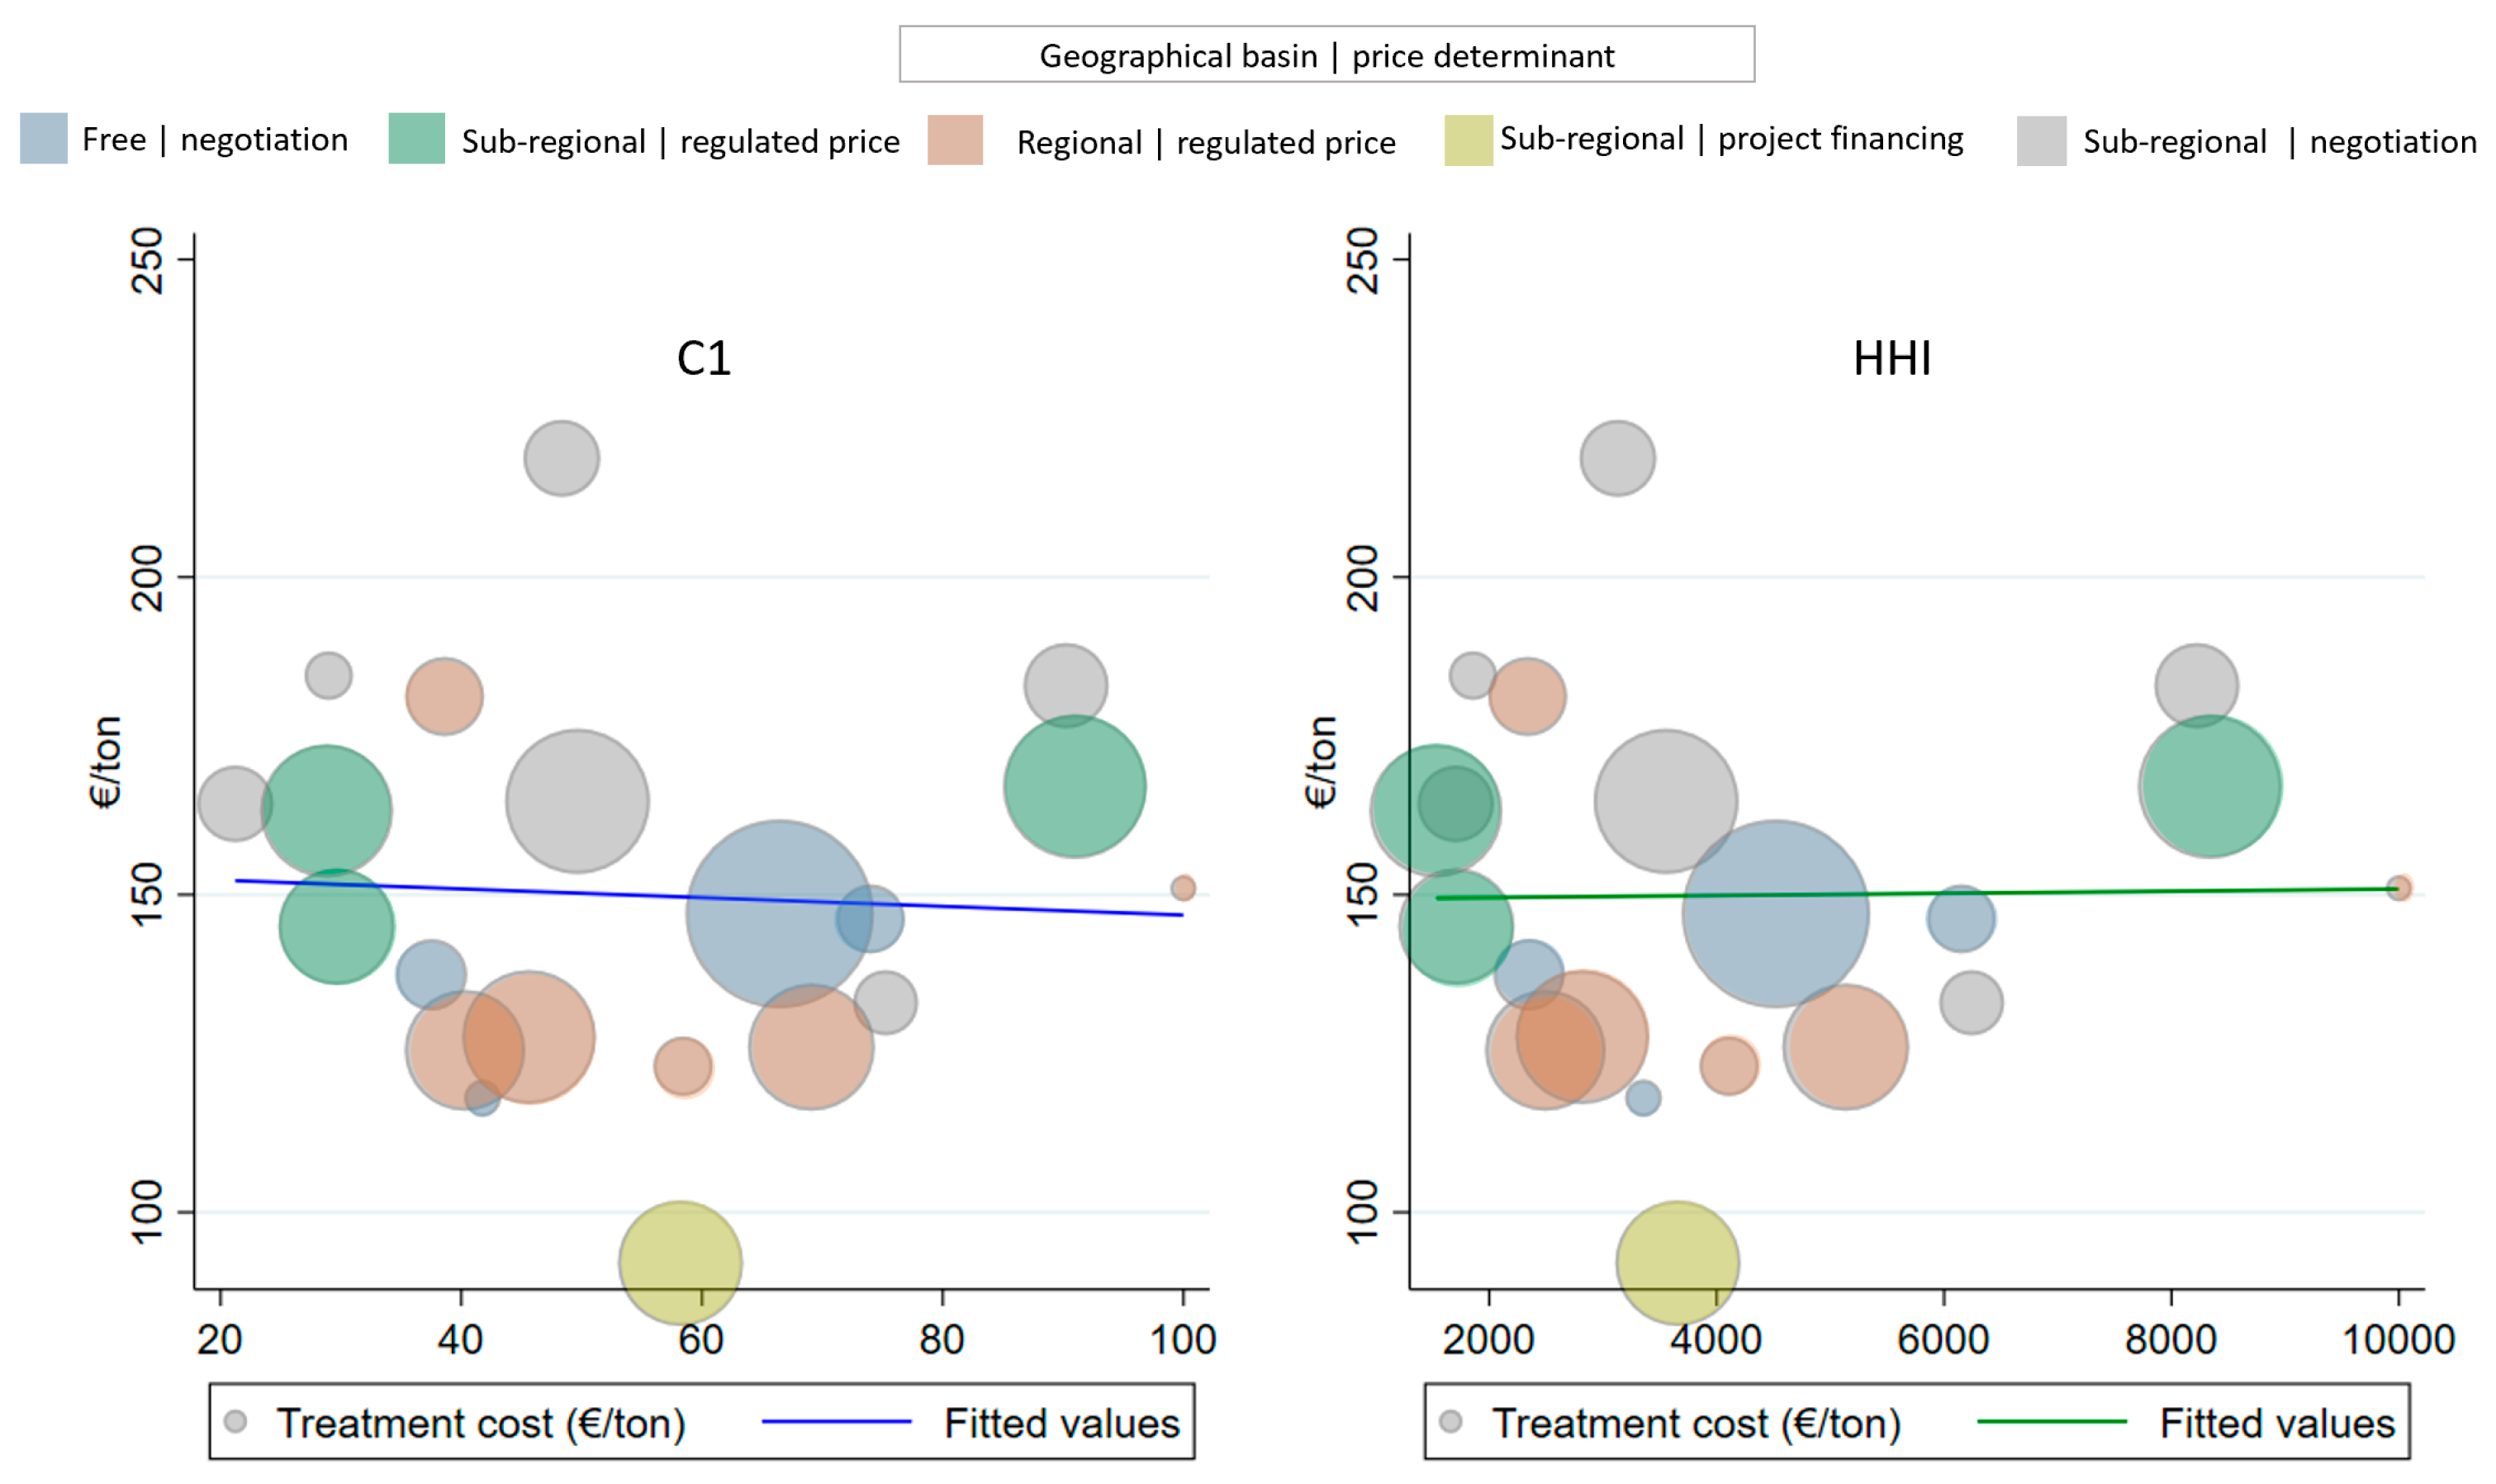
Figure 5 contains some significant information. From the trend of the two interpolating straight lines, an interesting element emerges from the point of view of industrial economics. If, as the C1 index increases, it appears that the cost of the TD of the residual waste stage tends to decrease, it seems that as the HHI concentration index increases, there is a slight increase in cost. Therefore, it could be hypothesized that in larger regions with a greater quantity of waste to treat and a higher competition floor, an oligopolistic structure could be correlated with higher costs.
Nonetheless, Figure 5 also highlights an aspect inherent in the cluster corresponding to free flows. Figure 5 shows that the four regions belonging to this group lie close to or below the regression line, indicating that the cost of the waste management service tends to be lower than average. Similarly, the group corresponding to regulated prices with regional flows also presents costs that are predominantly below average. In Figure 5, the size of bubbles reflect the population of regions. Fitted values predicted using a linear regression model. Treatment cost refers to the cost of TD of residual waste. Fitted values for C1 = −0.0687; fitted values for HHI = 0.00016.
Given the progressive linear reduction in the use of landfills, the degree of market concentration is a function of the product market that we use as a reference. If we consider only WTE plants, we can say that we are in the presence of a moderately concentrated market. The HHI index is close to 2000, which could increase in the coming years because of the reduction in the use of landfills, posing serious challenges for competition policy. However, the relationship between the governance model of waste flow and treatment prices and the cost of waste treatment is ambiguous, although the results suggest that a market model based on the free movement of waste and the negotiation of treatment prices is associated with an efficient cost. In the two markets that were opened up to competition first (air transport and telecommunications), average prices have dropped substantially. This has not yet happened in markets opened up to competition later or not at all, where prices have remained unchanged or have even increased. However, this may be due to sector-specific factors. Overall, consumers are more likely to pay lower prices in sectors that are more open to competition.
4. Discussion
Concentration measures within the waste management chain are important in services of general economic interest given that the reference to a market is an undefined concept that can contain different types of services, including those that, despite not having a reference market, can be provided in a potentially economic context.
As mentioned, the MSW management chain comprises the CT stage, in which the separation of unsorted and sorted waste takes place, and the TD stage. Due to key differences in the industrial structure of the stages, each of them shall be differently regulated in light of the characteristics of services provided in each. From a completion policy perspective, one shall note that there are many companies operating in the two stages, not necessarily in an integrated way. In many countries, the CT stage is regulated through a competitive market approach where potential providers bid to provide the service on pre-specified terms and conditions over a specified period. The structure of the TD resumes an oligopoly; in these cases, ad hoc regulatory mechanisms to control concentrated markets are needed, especially in cases of asymmetric information [26].
In light of the consideration made regarding the relevant market and concentration measures [27,28,29], it is unlikely that the authorities regulating the functioning of the market will identify competition problems if the HHI is less than 1500. Instead, competition authorities tend to monitor the market where the HHI is less than 2000. Values above 2000 may indicate a need for more in-depth evaluations, depending on the type of market under analysis. In our case, it is necessary to consider that WTE plants are generally characterized by high technological complexity and may present relatively high fixed investment costs. In any case, there is no evidence of sub-additivity of costs. Therefore, the most efficient solution for carrying out these activities is not to concentrate production in the hands of a single operator.
However, considering only the WTE plants as the product market, one notes a CR1 index close to 36% and an HHI that equals 1909. The second consideration concerns the governance model in MSW management and the implications in terms of the cost of waste management services.
We underline the fact that the results refer to the Italian market and are therefore reliable with regard to their internal validity. They are also reliable for possible variations in the geographic extension in calculating the concentration indexes. We have used the entire national territory as a geographic dimension. However, it might make sense to consider smaller geographic areas. This is because the characteristics of this market are compatible with limited management at a territorial level. The purpose is to limit as much as possible the movement of waste to different areas because the transport of waste is correlated with environmental costs and economic costs [30]. Independent of the case study of this paper, the results are hypothetically extendable to any country. It is important that policymakers consider a geographical size appropriate to the objectives of a circular economy and simultaneously to the morphological and socio-economic characteristics of the territory.
We welcome regulations in accordance with the provisions of European directives on the circular economy discouraging landfills, for example, through an eco-tax and efficient tariffs aimed at raising the opportunity cost of avoiding landfills [31,32]. These measures, at least in the short–medium term, encourage alternative systems such as WTE. In addition, incentive regulation should make WTE economically more convenient [33,34]. We also advise national coordination between the local and central levels of government to determine the waste treatment capacity of unsorted waste in the various areas of individual countries [35]. This is a particularly important issue because the construction of WTE plants is often subject to the NIMBY syndrome [36,37]. To ensure that this tendency is overcome, coordination is needed between the various levels of government to reach an agreement on the WTE plants necessary to ensure that the objectives of the circular economy can be achieved. It is also necessary to minimize the environmental and social costs arising from inefficiency in the location of WTE plants.
Our results provide a possibly encouraging way forward on waste management regulation compliant with development goals, making recommendations to support policymakers to develop local solutions for waste management. Policymakers should equip regulatory agencies with the tools and the mandate needed to gain market data information with the aim of modeling the relevant market to properly regulate and incentivize the best organizational form of each stage of the MSW management chain. Our paper may prompt additional research regarding the market structure of TD of residual waste treatment focusing on a global level being an international perspective that should be better analyzed. In addition, there is also another noteworthy aspect, i.e., alternative scenarios with respect to the estimated increase in waste over the coming years that would lead to different possible developments, opportunities, and threads.
5. Conclusions
Given the gradual reduction of waste sent to landfills as foreseen by circular economy directives, the need to understand the path to a new equilibrium in waste treatment justifies a corpus of literature related to waste management market structure. In particular, it should be taken into consideration that the strengthening of the dominant position in an oligopolistic market could neutralize the potential entry of third parties into the relevant market. Consequently, the reduction in alternatives available to operators active in the market upstream may impact the total cost of service with negative externalities to society.
Depending on the scenarios as per product and geographical markets, the concentration may vary significantly. That said, from the shreds of evidence presented, several considerations for policy can be drawn. Under a scenario in which only WTE plants are considered, results show that even in a relatively big market, the third, if compared to other EU Member States, a moderately concentrated market emerges. As shown, the HHI index is 1909 and could rise in the coming years due to the reduction in waste sent to landfills. It is no wonder that this scenario may prompt serious challenges for competition policy as the geographical market for waste management shall not be as large as a whole country like Italy if the constraint of limiting waste transportation is respected. Therefore, given the inverse relation between the size of the geographical market and the concentration, all else being equal, the HHI index may be higher in smaller geographical markets as demonstrated in this paper. Indeed, our results confirm that by narrowing the geographic market size, concentration increases significantly not only for WTE plants but also for landfills.
Besides, the relationship between the waste governance model and cost of service seems to exist even if additional research is required to fine-tune statistical analysis. The results suggest that a market model based on the free movement of waste and negotiation of treatment prices is associated with efficient costs.
Our results are helpful in the development and design of competition policies because, in the short-medium term, WTE plants will progressively acquire market shares compared to landfills. Therefore, it is important to reflect on the implications of this evolution in terms of market structure and organization in light of the fact that WTE plants can be thought of as an oligopolistic market with local monopolies characterized by significant economies of scale and long payback times. At the same time, they can be considered essential infrastructure for waste management that shall be regulated by appropriate laws and principles to protect competition.
Author Contributions
The authors jointly contributed to all Sections of the article. All authors have read and agreed to the published version of the manuscript.
Funding
This research received no external funding.
Institutional Review Board Statement
Not applicable.
Informed Consent Statement
Not applicable.
Conflicts of Interest
The authors declare no conflict of interest.
References
- Díaz, A.M.P.; Zafra-Gómez, J.L.; Perez-Lopez, G.; López-Hernández, A.M. Alternative management structures for municipal waste collection services: The influence of economic and political factors. Waste Manag. 2014, 34, 1967–1976. [Google Scholar] [CrossRef] [PubMed]
- Di Foggia, G.; Beccarello, M. Improving efficiency in the MSW collection and disposal service combining price cap and yardstick regulation: The Italian case. Waste Manag. 2018, 79, 223–231. [Google Scholar] [CrossRef] [PubMed]
- Alzamora, B.; Barros, R.T.D.V. Review of municipal waste management charging methods in different countries. Waste Manag. 2020, 115, 47–55. [Google Scholar] [CrossRef]
- Cobo, S.; Dominguez-Ramos, A.; Irabien, A. From linear to circular integrated waste management systems: A review of methodological approaches. Resour. Conserv. Recycl. 2018, 135, 279–295. [Google Scholar] [CrossRef]
- Kaza, S.; Yao, L.; Bhada-Tata, P.; Van Woerden, F. What a Waste 2.0: A Global Snapshot of Solid Waste Management to 2050; The World Bank: Washington, DC, USA, 2018; ISBN 978-1-4648-1347-4. [Google Scholar]
- Castillo-Giménez, J.; Montañés, A.; Picazo-Tadeo, A.J. Performance in the treatment of municipal waste: Are European Union member states so different? Sci. Total Environ. 2019, 687, 1305–1314. [Google Scholar] [CrossRef]
- Zaman, A.U. A comprehensive study of the environmental and economic benefits of resource recovery from global waste management systems. J. Clean. Prod. 2016, 124, 41–50. [Google Scholar] [CrossRef]
- Gharfalkar, M.; Court, R.; Campbell, C.; Ali, Z.; Hillier, G. Analysis of waste hierarchy in the European waste directive 2008/98/EC. Waste Manag. 2015, 39, 305–313. [Google Scholar] [CrossRef]
- Pires, A.; Martinho, G.; Chang, N.-B. Solid waste management in European countries: A review of systems analysis techniques. J. Environ. Manag. 2011, 92, 1033–1050. [Google Scholar] [CrossRef]
- Rodrigues, A.; Fernandes, M.; Rodrigues, M.; Bortoluzzi, S.; Gouvea da Costa, S.E.; Pinheiro de Lima, E. Developing criteria for performance assessment in municipal solid waste management. J. Clean. Prod. 2018, 186, 748–757. [Google Scholar] [CrossRef]
- Bartolacci, F.; Del Gobbo, R.; Paolini, A.; Soverchia, M. Efficiency in waste management companies: A proposal to assess scale economies. Resour. Conserv. Recycl. 2019, 148, 124–131. [Google Scholar] [CrossRef]
- Benito-López, B.; Moreno-Enguix, M.D.R.; Solana-Ibañez, J. Determinants of efficiency in the provision of municipal street-cleaning and refuse collection services. Waste Manag. 2011, 31, 1099–1108. [Google Scholar] [CrossRef] [PubMed]
- Marques, R.C.; Simões, P.; Pinto, F.S. Tariff regulation in the waste sector: An unavoidable future. Waste Manag. 2018, 78, 292–300. [Google Scholar] [CrossRef]
- Antonioli, B.; Massarutto, A. The municipal waste management sector in Europe: Shifting boundaries between public service and the market. Ann. Public Coop. Econ. 2012, 83, 505–532. [Google Scholar] [CrossRef]
- FiedZiuk, N. Putting services of general economic interest up for tender: Reflections on applicable EU rules. Common Mark. Law Rev. 2013, 50, 87–114. [Google Scholar]
- Kaplow, L. Why (ever) define markets? Harv. Law Rev. 2010, 124, 437–517. [Google Scholar]
- De Loecker, J.; Eeckhout, J.; Unger, G. The Rise of Market Power and the Macroeconomic Implications. Q. J. Econ. 2020, 135, 561–644. [Google Scholar] [CrossRef] [Green Version]
- Massarutto, A. Municipal waste management as a local utility: Options for competition in an environmentally-regulated industry. Util. Policy 2007, 15, 9–19. [Google Scholar] [CrossRef]
- Joskow, P.L. Regulation of natural monopoly. In Handbook of Low and Ecoonomics; Polinsky, A.M., Shavell, S., Eds.; Elsevier: Amsterdam, The Netherlands, 2007; Volume 2, pp. 1227–1348. ISBN 1574-0730. [Google Scholar]
- Brezina, I.; Pekar, J.; Cickova, Z.; Reiff, M. Herfindahl–Hirschman index level of concentration values modification and analysis of their change. Cent. Eur. J. Oper. Res. 2016, 24, 49–72. [Google Scholar] [CrossRef]
- Pavić, I.; Galetic, F.; Piplica, D. Similarities and Differences between the CR and HHI as an Indicator of Market Concentration and Market Power. Br. J. Econ. Manag. Trade 2016, 13, 23193. [Google Scholar] [CrossRef]
- Di Foggia, G.; Beccarello, M. Designing waste management systems to meet circular economy goals: The Italian case. Sustain. Prod. Consum. 2021, 26, 1074–1083. [Google Scholar] [CrossRef]
- Kaplow, L. Market definition, market power. Int. J. Ind. Organ. 2015, 43, 148–161. [Google Scholar] [CrossRef] [Green Version]
- Benkovskis, K.; Wörz, J. What drives the market share changes? Price versus non-price factors. Struct. Chang. Econ. Dyn. 2018, 45, 9–29. [Google Scholar] [CrossRef] [Green Version]
- Guerrini, A.; Carvalho, P.; Romano, G.; Marques, R.C.; Leardini, C. Assessing efficiency drivers in municipal solid waste collection services through a non-parametric method. J. Clean. Prod. 2017, 147, 431–441. [Google Scholar] [CrossRef]
- Basso, L.J.; Figueroa, N.; Vásquez, J. Monopoly regulation under asymmetric information: Prices versus quantities. RAND J. Econ. 2017, 48, 557–578. [Google Scholar] [CrossRef]
- Packalen, M.; Sen, A. Static and dynamic merger effects: A market share based empirical analysis. Int. Rev. Law Econ. 2013, 36, 12–24. [Google Scholar] [CrossRef]
- Gradus, R.; Schoute, M.; Dijkgraaf, E. The effects of market concentration on costs of local public services: Empirical evidence from Dutch waste collection. Local Gov. Stud. 2016, 44, 86–104. [Google Scholar] [CrossRef] [Green Version]
- Bryant, G. Creating a level playing field? The concentration and centralisation of emissions in the European Union Emissions Trading System. Energy Policy 2016, 99, 308–318. [Google Scholar] [CrossRef]
- Economopoulou, M.A.; Economopoulou, A.A.; Economopoulos, A.P. A methodology for optimal MSW management, with an application in the waste transportation of Attica Region, Greece. Waste Manag. 2013, 33, 2177–2187. [Google Scholar] [CrossRef] [PubMed]
- Scharff, H. Landfill reduction experience in The Netherlands. Waste Manag. 2014, 34, 2218–2224. [Google Scholar] [CrossRef]
- Chu, Z.; Wang, W.; Zhou, A.; Huang, W.-C. Charging for municipal solid waste disposal in Beijing. Waste Manag. 2019, 94, 85–94. [Google Scholar] [CrossRef] [PubMed]
- Fujii, M.; Dou, Y.; Sun, L.; Ohnishi, S.; Maki, S.; Dong, H.; Dong, L.; Chandran, R. Contribution to a low-carbon society from improving exergy of waste-to-energy system by upgrading utilization of waste. Resour. Conserv. Recycl. 2019, 149, 586–594. [Google Scholar] [CrossRef]
- Pan, S.-Y.; Du, M.A.; Huang, I.-T.; Liu, I.-H.; Chang, E.-E.; Chiang, P.-C. Strategies on implementation of waste-to-energy (WTE) supply chain for circular economy system: A review. J. Clean. Prod. 2015, 108, 409–421. [Google Scholar] [CrossRef]
- Di Foggia, G. Energy-Efficient Products and Competitiveness in the Manufacturing Sector. J. Open Innov. Technol. Mark. Complex. 2021, 7, 33. [Google Scholar] [CrossRef]
- Brown, G.; Glanz, H. Identifying potential NIMBY and YIMBY effects in general land use planning and zoning. Appl. Geogr. 2018, 99, 1–11. [Google Scholar] [CrossRef]
- Johnson, R.J.; Scicchitano, M.J. Don’t Call Me NIMBY: Public Attitudes Toward Solid Waste Facilities. Environ. Behav. 2012, 44, 410–426. [Google Scholar] [CrossRef]
Figure 1.
The municipal waste management chain and scope of our analyses.

Figure 2.
WTE plants and landfills in Italy.

Figure 3.
Research process.

Figure 4.
Values of the concentration indices in the various markets.

Figure 5.
Governance models and CT unsorted non-recyclable waste.


Table 1.
Summary of variables used for concentration measures.
| Scope | Unit | Variable | Obs | Mean | Std. Dev. | Min | Max |
|---|---|---|---|---|---|---|---|
| Regional | % | waste treated by each operator | 148 | 13.52 | 19.395 | 0.029 | 100 |
| National | % | waste treated by each operator | 148 | 0.68 | 1.393 | 0.001 | 11.56 |
| Landfill | % | Waste managed by each operator on total | 112 | 0.89 | 1.476 | 0.002 | 11.242 |
| WTE | % | Waste managed by each operator on total | 36 | 2.78 | 4.929 | 0.072 | 23.865 |
| Regional | Tons | Unsorted waste | 148 | 862,141 | 661,151 | 31,605 | 2,233,494 |
| National | Tons | Unsorted waste | 148 | 12,453,364 | |||
| National | Tons | Waste managed by operator | 148 | 84,144 | 173,455 | 127 | 1,439,570 |
| Landfill | Tons | Total waste landfilled | 112 | 6,421,195 | |||
| WTE | Tons | Total waste treated | 36 | 6,032,169 |
Source: own elaboration.
Table 2.
Breakdown of industrial and geographical data.
| Variable | Obs | Mean | Std. Dev. | Minimum | Maximum |
|---|---|---|---|---|---|
| C1 | 20 | 55 | 23.00 | 21.23 | 100 |
| C2 | 19.00 | 71.59 | 19.26 | 40.86 | 100 |
| C3 | 18.00 | 81.06 | 14.11 | 55.90 | 100 |
| C4 | 17.00 | 87.69 | 10.72 | 67.20 | 100 |
| HHI | 20.00 | 4161.75 | 2462.32 | 1531.00 | 10,000 |
| Population (m) | 20 | 3.0125 | 2.54 | 0.13 | 10.10 |
| Waste per capita | 20 | 495.735 | 74.77 | 365.40 | 664.10 |
| Cost per capita | 20 | 177.606 | 31.25 | 136.60 | 253.73 |
| Cost per ton (€) | 20 | 36.255 | 6.44 | 26.440 | 47.91 |
| Waste tons | 20 | 1503.94 | 1271.80 | 75.820 | 4843.57 |
| Sorted waste (%) | 20 | 60.651 | 10.52 | 38.520 | 74.70 |
Source: Own elaboration. Data are aggregated at regional level for convenience.
Table 3.
Breakdown of concentration measures per region.
| Region | C1 | C2 | C3 | C4 | HHI | Options |
|---|---|---|---|---|---|---|
| Abruzzo | 37.532 | 58.640 | 76.051 | 84.969 | 2350 | WTE-L |
| Aosta | 100.000 | 10,000 | L | |||
| Apulia | 40.311 | 63.004 | 75.951 | 86.342 | 2494 | WTE-L |
| Basilicata | 28.994 | 50.217 | 65.148 | 77.051 | 1857 | WTE-L |
| Calabria | 90.252 | 99.101 | 99.888 | 100.000 | 8224 | WTE-L |
| Campania | 90.988 | 98.484 | 100.000 | na | 8337 | WTE-L |
| Emilia-Romagnia | 69.090 | 86.113 | 93.625 | 97.006 | 5136 | WTE-L |
| Friuli V G | 74.007 | 100.000 | 6153 | WTE-L | ||
| Lazio | 49.660 | 78.070 | 93.625 | 100.000 | 3556 | WTE-L |
| Liguria | 48.359 | 69.080 | 84.587 | 93.860 | 3132 | WTE-L |
| Lombardy | 66.454 | 72.529 | 75.930 | 79.108 | 4522 | WTE-L |
| Marche | 21.229 | 40.861 | 60.171 | 76.621 | 1705 | WTE-L |
| Molise | 41.771 | 78.970 | 91.422 | 100.000 | 3357 | WTE-L |
| Piedmont | 58.216 | 70.206 | 76.469 | 81.696 | 3659 | WTE-L |
| Sardinia | 38.618 | 57.944 | 72.656 | 84.172 | 2338 | WTE-L |
| Sicily | 45.641 | 64.739 | 81.957 | 88.014 | 2819 | L |
| Trentino A A | 75.262 | 99.341 | 99.647 | 99.929 | 6244 | WTE-L |
| Tuscany | 29.631 | 48.003 | 64.201 | 74.678 | 1711 | WTE-L |
| Umbria | 58.424 | 81.133 | 91.829 | 100.000 | 4110 | WTE-L |
| Veneto | 28.822 | 43.692 | 55.904 | 67.199 | 1531 | WTE-L |
Source: Own elaboration. L stands for landfill.
Table 4.
Relation between cost and key variables.
| Cost | C1 | HHI | Population | Waste per Capita | tons_tt | Sorted Waste (%) | |
|---|---|---|---|---|---|---|---|
| Cost per ton (€) | 1 | ||||||
| C1 | −0.054 | 1 | |||||
| HHI | 0.014 | 0.976 * | 1 | ||||
| Population | −0.124 | 0.048 | −0.067 | 1.000 | |||
| Waste per capita | −0.147 | 0.145 | 0.120 | 0.123 | 1.000 | ||
| Waste ton | −0.150 | 0.028 | −0.091 | 0.984 * | 0.260 | 1 | |
| Sorted waste (%) | −0.103 | 0.015 | −0.008 | 0.023 | 0.437 * | 0.082 | 1 |
Source: Own processing. Significance level 0.1 = *. We omit variables C2, C3, C4 since they correlate with C1, which we instead use in Figure 4 as a comparison with the HHI index.
Publisher’s Note: MDPI stays neutral with regard to jurisdictional claims in published maps and institutional affiliations. |
© 2021 by the authors. Licensee MDPI, Basel, Switzerland. This article is an open access article distributed under the terms and conditions of the Creative Commons Attribution (CC BY) license (https://creativecommons.org/licenses/by/4.0/).
Share and Cite
MDPI and ACS Style
Di Foggia, G.; Beccarello, M. Market Structure of Urban Waste Treatment and Disposal: Empirical Evidence from the Italian Industry. Sustainability 2021, 13, 7412. https://0-doi-org.brum.beds.ac.uk/10.3390/su13137412
AMA Style
Di Foggia G, Beccarello M. Market Structure of Urban Waste Treatment and Disposal: Empirical Evidence from the Italian Industry. Sustainability. 2021; 13(13):7412. https://0-doi-org.brum.beds.ac.uk/10.3390/su13137412
Chicago/Turabian StyleDi Foggia, Giacomo, and Massimo Beccarello. 2021. "Market Structure of Urban Waste Treatment and Disposal: Empirical Evidence from the Italian Industry" Sustainability 13, no. 13: 7412. https://0-doi-org.brum.beds.ac.uk/10.3390/su13137412
Note that from the first issue of 2016, this journal uses article numbers instead of page numbers. See further details here.