
Evaluating Supply Chain Collaboration Barriers in Small- and Medium-Sized Enterprises


1
Department of Industrial and Production Engineering, Bangladesh University of Engineering and Technology, Dhaka 1000, Bangladesh
2
UTS Business School, University of Technology Sydney, Sydney, NSW 2007, Australia
3
School of Accounting, Information Systems and Supply Chain, RMIT University, Melbourne, VIC 3000, Australia
*
Authors to whom correspondence should be addressed.
Sustainability 2021, 13(13), 7449; https://0-doi-org.brum.beds.ac.uk/10.3390/su13137449
Submission received: 2 June 2021
/
Revised: 29 June 2021
/
Accepted: 29 June 2021
/
Published: 2 July 2021
(This article belongs to the Special Issue Assessment of Socio-Economic Sustainability and Resilience after COVID-19)
Abstract
:The disruption has a significant impact on supply chain collaboration (SCC) which is an important task to improve performance for many enterprises. This is especially critical for small- and medium-sized enterprises (SMEs). We developed a decision-modeling framework for analyzing SCC barriers in SMEs for the emerging economy in Bangladesh. Through literature review and expert opinion survey, we have identified a comprehensive list of SCC barriers under four main categories, namely, information-related, communication-related, intra-organizational, and inter-organizational barriers. Then we applied the Grey DEMATEL and Fuzzy Best-Worst methods to evaluate these SCC barriers and compared the results. We also conducted a sensitivity analysis to assess the robustness of the proposed approach. The study reveals that lack of communication is the most crucial barrier in SCC, providing a model for assessing barriers in other emerging economies. This study contributes to the literature by analyzing SCC barriers and by comparing the results obtained from two different MCDM methods. The findings of this study can help decision-makers to plan for overcoming the most prioritized SCC barriers which ultimately contribute to improving the resilience and sustainability performances of SMEs.
1. Introduction
Collaboration is a key factor for success in supply chain management, typically improving overall supply chain performance [1,2]. According to Whipple and Russel [3], collaboration is formed when two or more organizations work together to gain better efficiency, which is impossible to achieve by working alone. Supply chain collaboration (SCC) aligns plans and objectives of individual enterprises and is important for sustaining competitive advantage in today’s competitive business era [4]. In this environment, firms are collaborating by combining the resources of suppliers and customers [5]. Supply chain partners are removing organizational barriers to ensure efficiency and responsiveness [6]. The significance of SCC for both large firms and small- and medium-sized enterprises (SMEs), described as enterprises having fewer than 250 employees [7], is already well studied and understood [2]. However, while large firms are well equipped to build collaborative relationships in a supply chain, SMEs face greater difficulties in achieving SCC. These difficulties arise from wide-ranging factors such as incompatible technology, lack of skilled personnel, poor networking with important supply chain players, and inadequate finance [7]. Moreover, the recent COVID-19 pandemic impacted supply chain collaboration practices of SMEs significantly [8]. Generally, SMEs lag behind in implementing SCC than large firms. The COVID-19 pandemic even impacted SMEs harder to maintain their SCC [9].
Although it is important to understand what makes SMEs lag behind, studies on SCC in the context of SMEs to date mostly focused on the importance and effect of SCC on various performance indicators. For example, Eyaa et al. [10] analyzed the effect of collaborative relationships on the supply chain performance of an individual SME in Uganda. Haji-Pakir and Alina [11] uncovered the minimal level of collaboration and its effects on Malaysian SMEs. Considering the importance of identifying the barriers of SCC for its successful implementation, Gumboh and Gichira [7] investigated and identified 11 collaboration barriers among SMEs in Kenya. However, as per the knowledge of the authors, none of the existing studies has put efforts to analyze the SCC barriers comprehensively to explore what are the most influential barriers. While SMEs across the world face some barriers in implementing SCC, the barriers might be different in a developed and an emerging economy, or at least their severity of the barriers is different. For example, SMEs in developed countries are more technologically advanced and receive more governmental support, whereas these are considered severe barriers to collaboration for SMEs in emerging countries [12]. In general, study on SCC in the context of SMEs in an emerging country is scarce. Aiming to contribute to the literature on SCC in the context of SMEs in an emerging economy, the study aims at answering the following specific questions:
Research Question 1 (RQ1).
What are the SCC barriers to be considered in SMEs of an emerging country?
Research Question 2 (RQ2).
What are the most influential SCC barriers in SMEs of an emerging country?
Research Question 3 (RQ3).
What are the implications of the findings in supply chain resilience and sustainability?
The study used SMEs in Bangladesh as the subject of the investigation. The substantial contribution of SMEs to the economy of Bangladesh is the main reason for using Bangladesh as the context of this study. In Bangladesh, there are 177 SME clusters, which constitute about 90% of the industrial enterprises of Bangladesh [13]. They provide 80–85% of industrial employment and generate about 19% of GDP (Gross Domestic Product) in the manufacturing and service sectors of Bangladesh [14]. Moreover, 75–80% of export earnings come from SMEs [15]. For answering the research questions, this study used an interview-based MCDM (Multi-Criteria Decision Making) methodology. While interviews are used to identify and finalize the list of barriers of SCC in SMEs, MCDM techniques are used to analyze the barriers to see what the most influential barriers are.
This study resolves the research gap by accumulating SCC barriers in various SME sectors of an emerging economy like Bangladesh and evaluating them by different MCDM techniques. This will help to differentiate the ways SMEs of emerging economies face barriers to implement SCC when compared to SMEs of developed countries. Moreover, the study analyzes the barriers to identify the most critical barriers in this regard. Previous studies in the context of various industries, both large and small, of developed economies already provided many crucial sets of barriers. Hudnurkar et al. [6] accumulate 28 factors affecting collaboration. Moreover, previous studies could not come to a consensus in deciding the most critical barriers of SCC for SMEs. For example, Eyaa et al. [10] report that lack of information sharing, decision desynchronization, and incentive misalignment are the most critical SCC barriers that affect supply chain performance. On the other hand, Zhang and Cao [5] suggest improper organizational culture as the most critical barrier of SCC. These divergent findings suggest the need for an in-depth analysis in the context of SMEs of the emerging economies to ensure that the findings truly reflect the SMEs and the context. Moreover, the findings can help the SMEs to improve their sustainability and resilience performances during a global pandemic by prioritizing and eradicating the SCC barriers. Many researchers showed the positive relationship between resilience and sustainability during the COVID-19 pandemic. As physical communication has been disrupted due to the COVID-19 pandemic, a distance communication strategy for enhancing SCC would help to attain resiliency [16]. The resilience strategies, in turn, can positively affect sustainability in the supply chain. In the literature, several studies explained the positive relationship between supply chain resilience and sustainability performance [17,18,19]. In this study, we aim to contribute to supply chain resilience and sustainability by analyzing the interrelations among SCC barriers and determining their priority ranking in the context of SMEs of Bangladesh.
The article is organized as follows. Section 2 presents a literature review. The decision-making framework for both MCDM methods (Fuzzy Best-Worst and Grey DEMATEL) is presented in Section 3. Decision criteria collection and evaluation of criteria by two methods are explained in Section 4. Section 5 presents the discussion on results and the sensitivity analysis. Finally, Section 6 concludes the paper.
2. Literature Review
Collaboration is one of the most important enablers in supply chain management. Barratt [20] identified major supporting elements of supply chain collaboration (SCC). Supply-side resilience can be gained by collaborative relationships [21]. There are many barriers and performance indices for evaluating supply chain performances in terms of collaboration [22,23,24,25]. For example, supply chain partnership and integration are crucial in the context of the apparel industry [23]. Coordination between departments, coordination with suppliers, and coordination with customers are essential when measuring the performance of SME supply chains [26]. Smooth supply chain practice in SMEs enables better supply chain performance in a large industry [27] as well as better business performance within a firm [28]. For smooth supply chain practice in SMEs, collaboration and coordination are mandatory [29]. Several studies identified barriers affecting SCC [6]. However, none of the studies thus far has specifically investigated SCC barriers for SMEs in an emerging economy.
2.1. Information-Related Barriers
Several information-related barriers disrupt SCC. Several studies consider different information-related barriers, including those related to reluctance to share information and poor information quality. Reluctance to share information increases coordination costs and leads to deterioration in performance [30]. Gunasekaran et al. [31] found that lack of information exchange among firms keeps supply chains from gaining competitive advantages. It weakens the foundation of the supply chain [32] and can create a bullwhip effect [33]. Lack of market-based information-sharing also causes difficulties in predicting customer demand [34], and creates disturbances in planning and controlling supply chains [35,36]. Inter-organizational relationships may be affected due to a lack of information-sharing [23]. Exchanged information that lacks accuracy, timeliness, credibility, and adequacy is labeled “poor information quality”, which can affect trust and commitment [37]. Poor and obsolete technology also disrupts coordination in the supply chain [38].
2.2. Communication-Related Barriers
Current literature suggests a number of communication-related barriers, such as lack of communication and poor system connectivity, are already well identified. Lack of communication represents an insufficient exchange of messages and views among firms. Lack of parallel communication structure hinders integration [39]. Obsolete technology for communication and information exchange among firms can create poor system connectivity and discourages collaboration under a disruption like the COVID-19 pandemic [40,41]. Due to lack of communication information sharing between suppliers disrupts which results in a barrier to SCC [42]. Specifically, lack of communication with suppliers during a global crisis like the COVID-19 pandemic distorts the collaboration in a supply chain [43].
2.3. Intra-Organizational Barriers
These barriers include intra-organizational weak relationships, decision desynchronization, incentive obstacles, opposition to change, leadership deficit, and territoriality. Intra-organizational weak relationships represent those weaknesses in collaboration within an organization. Intra-organizational support is needed for successful SCC [20,44]. Decision desynchronization suggests a lack of collaborative decision-making among SC members in planning and operational aspects [35]. Incentives offered in different stages of SC create obstacles, increase supply variability, and reduce total supply chain profits [1,45]. Managers often oppose collaborative change. Opposition to change results from low trust [46]. Further, inadequate skills of senior executives towards collaboration result in leadership deficits and less collaboration [46]. Individual partners may focus on territorial benefit, neglecting overall benefit for the organization. SC collaborative performance collapses because of this kind of territoriality [46].
2.4. Inter-Organizational Barriers
These barriers include lack of trust, short-term relationships, behavioral uncertainty, cultural differences, different goals, non-standardized performance metrics, lack of commitment, small firms, governmental intervention, pricing obstacles, lack of resource sharing, lack of adaptation, and lack of commitment on delivery times. Trust is one of the important enablers of SCC [23]. Distrust creates a lack of information-sharing and asset investment [47]. It also affects resilience against disruptions in supply chain topology [48,49]. Information-sharing is mediated by trust [37]. Long-term relationships are another important enabler of SCC [23], whereas short-term relationships can create failures in collaboration [50]. Long-term supplier relationships are a key driver of integration [22]. Unpredictable behavior among partners negatively affects trust level as well as collaboration [37]. Chopra et al. [1] pointed out that behavioral uncertainty contributes to information distortion. Different norms, beliefs, and underlying values shared by supply chain partners create cultural differences, and these have impacts on trust and information exchange [20,36]. Collaborative culture also is a key antecedent of SCC [5]. Different goals are associated with different priorities among partners because of different competitive situations [51]; joint performance of supply chains will decrease because of it [39].
Lack of common performance measurement approaches creates non-standardized performance metrics [52]. It also creates ambiguity and becomes a barrier to collaboration [39]. Lack of commitment causes a lack of information-sharing and asset investment [47]. Desired collaborative breakthroughs cannot be achieved without commitment [23]. Besides, a lower level of commitment leads to performance deterioration [30]. Firm size is also an important barrier for collaboration, as supply chain members prefer large firms for collaboration [39]. Governments may impose policies against collaborative behavior under the COVID-19 pandemic [53]. This kind of government intervention has effects on collaborative planning [51] and information-sharing [36]. Inflexible pricing policies may result in uncertainty in placing orders for a product [45]. Distorted information from one end of a supply to the other can cause harmful inefficiencies which are known as the bullwhip effect [54]. Pricing obstacles cause the bullwhip effect [1]. Lack of resource sharing is also an essential barrier to collaboration. Without resource commitment, successful SCC cannot be achieved [20] and plans for meeting demand cannot be executed without it [34]. Adaptation suggests shifts in supplier behavior to make better use of the firm’s resources. Lack of adaptation weakens the relationship between supplier and customer [55,56]. Firms may become inefficient in maintaining on-time delivery and this late delivery decreases reliability on firms; ultimately, collaboration may collapse [57]. Based on the literature review, a list of barriers to SCC is presented in Table 1.
2.5. Different MCDM Techniques and Their Applications
Many MCDM techniques have been used for analyzing barriers. These include: modeling sustainable supply chain complexities using Rough Set Theory (RST) [58]; analyzing critical barriers affecting the local sustainable development through adaptive reuse projects using Fuzzy-DEMATEL approach [59]; assessing barriers of circular supply chain using Fuzzy Analytical Network Process (FANP) [60]; ranking of solutions for reverse logistic barriers using Fuzzy AHP and Fuzzy TOPSIS [61]; prioritizing risk barriers involved in implementation of Product Life Management using integrated DEMATEL-based ANP and the Grey TOPSIS method [62]; evaluating barriers of sustainable supply chain management in the leather industry using Grey DEMATEL [63]; analyzing challenges for implementing Industry 4.0 using the BWM technique [64]; analyzing e-waste management barriers using ISM and DEMATEL approaches [65]; prioritizing software improvement success in global software development (GSD) using Fuzzy AHP [66]; assessing green innovation barriers in SMEs using BWM and Fuzzy TOPSIS [67]; prioritizing the drivers for integrated lean-green manufacturing for SMEs using Fuzzy TOPSIS [68]; and analyzing enablers and barriers in extension of useful life of automotive products through remanufacturing using Fuzzy ISM [69]. Table 2 summarizes the application areas of MCDM techniques.
As reported in Table 2, no study has developed a decision-modeling framework to evaluate barriers of SCC using FBWM. But FBWM can generate better consistent results by handling triangular fuzzy numbers. It can also handle many criteria with no multi optimality [89]. The Grey DEMATEL method was used to analyze barriers for an automotive parts remanufacturer [73], to analyze critical success barriers for implementation of drones in logistics sectors [90], and to analyze interrelationships among barriers to sustainable supply chain management in the leather industry [63]. However, there is no such study that used Grey DEMATEL for analyzing SCC barriers. But this method can find critical factors with the help of an impact relation diagram. It can also solve uncertain and indeterminate problems with discrete incomplete information [91]. By considering the benefits, FBWM and Grey DEMATEL will be suitable for our analysis. Most notably, studies that have integrated FBWM and Grey DEMATEL methods are scarce in the literature.
We help fill this knowledge gap by working toward the following objectives:
- To propose a framework to identify SCC barriers in the context of SMEs of Bangladesh,
- To analyze SCC barriers using the newly developed Fuzzy Best Worst (FBWM) and Grey DEMATEL methods and compare the results, and
- To outline implications for supply chain managers, as well as directions for future research, based on outcomes of the analysis.
3. Decision-Modelling Framework
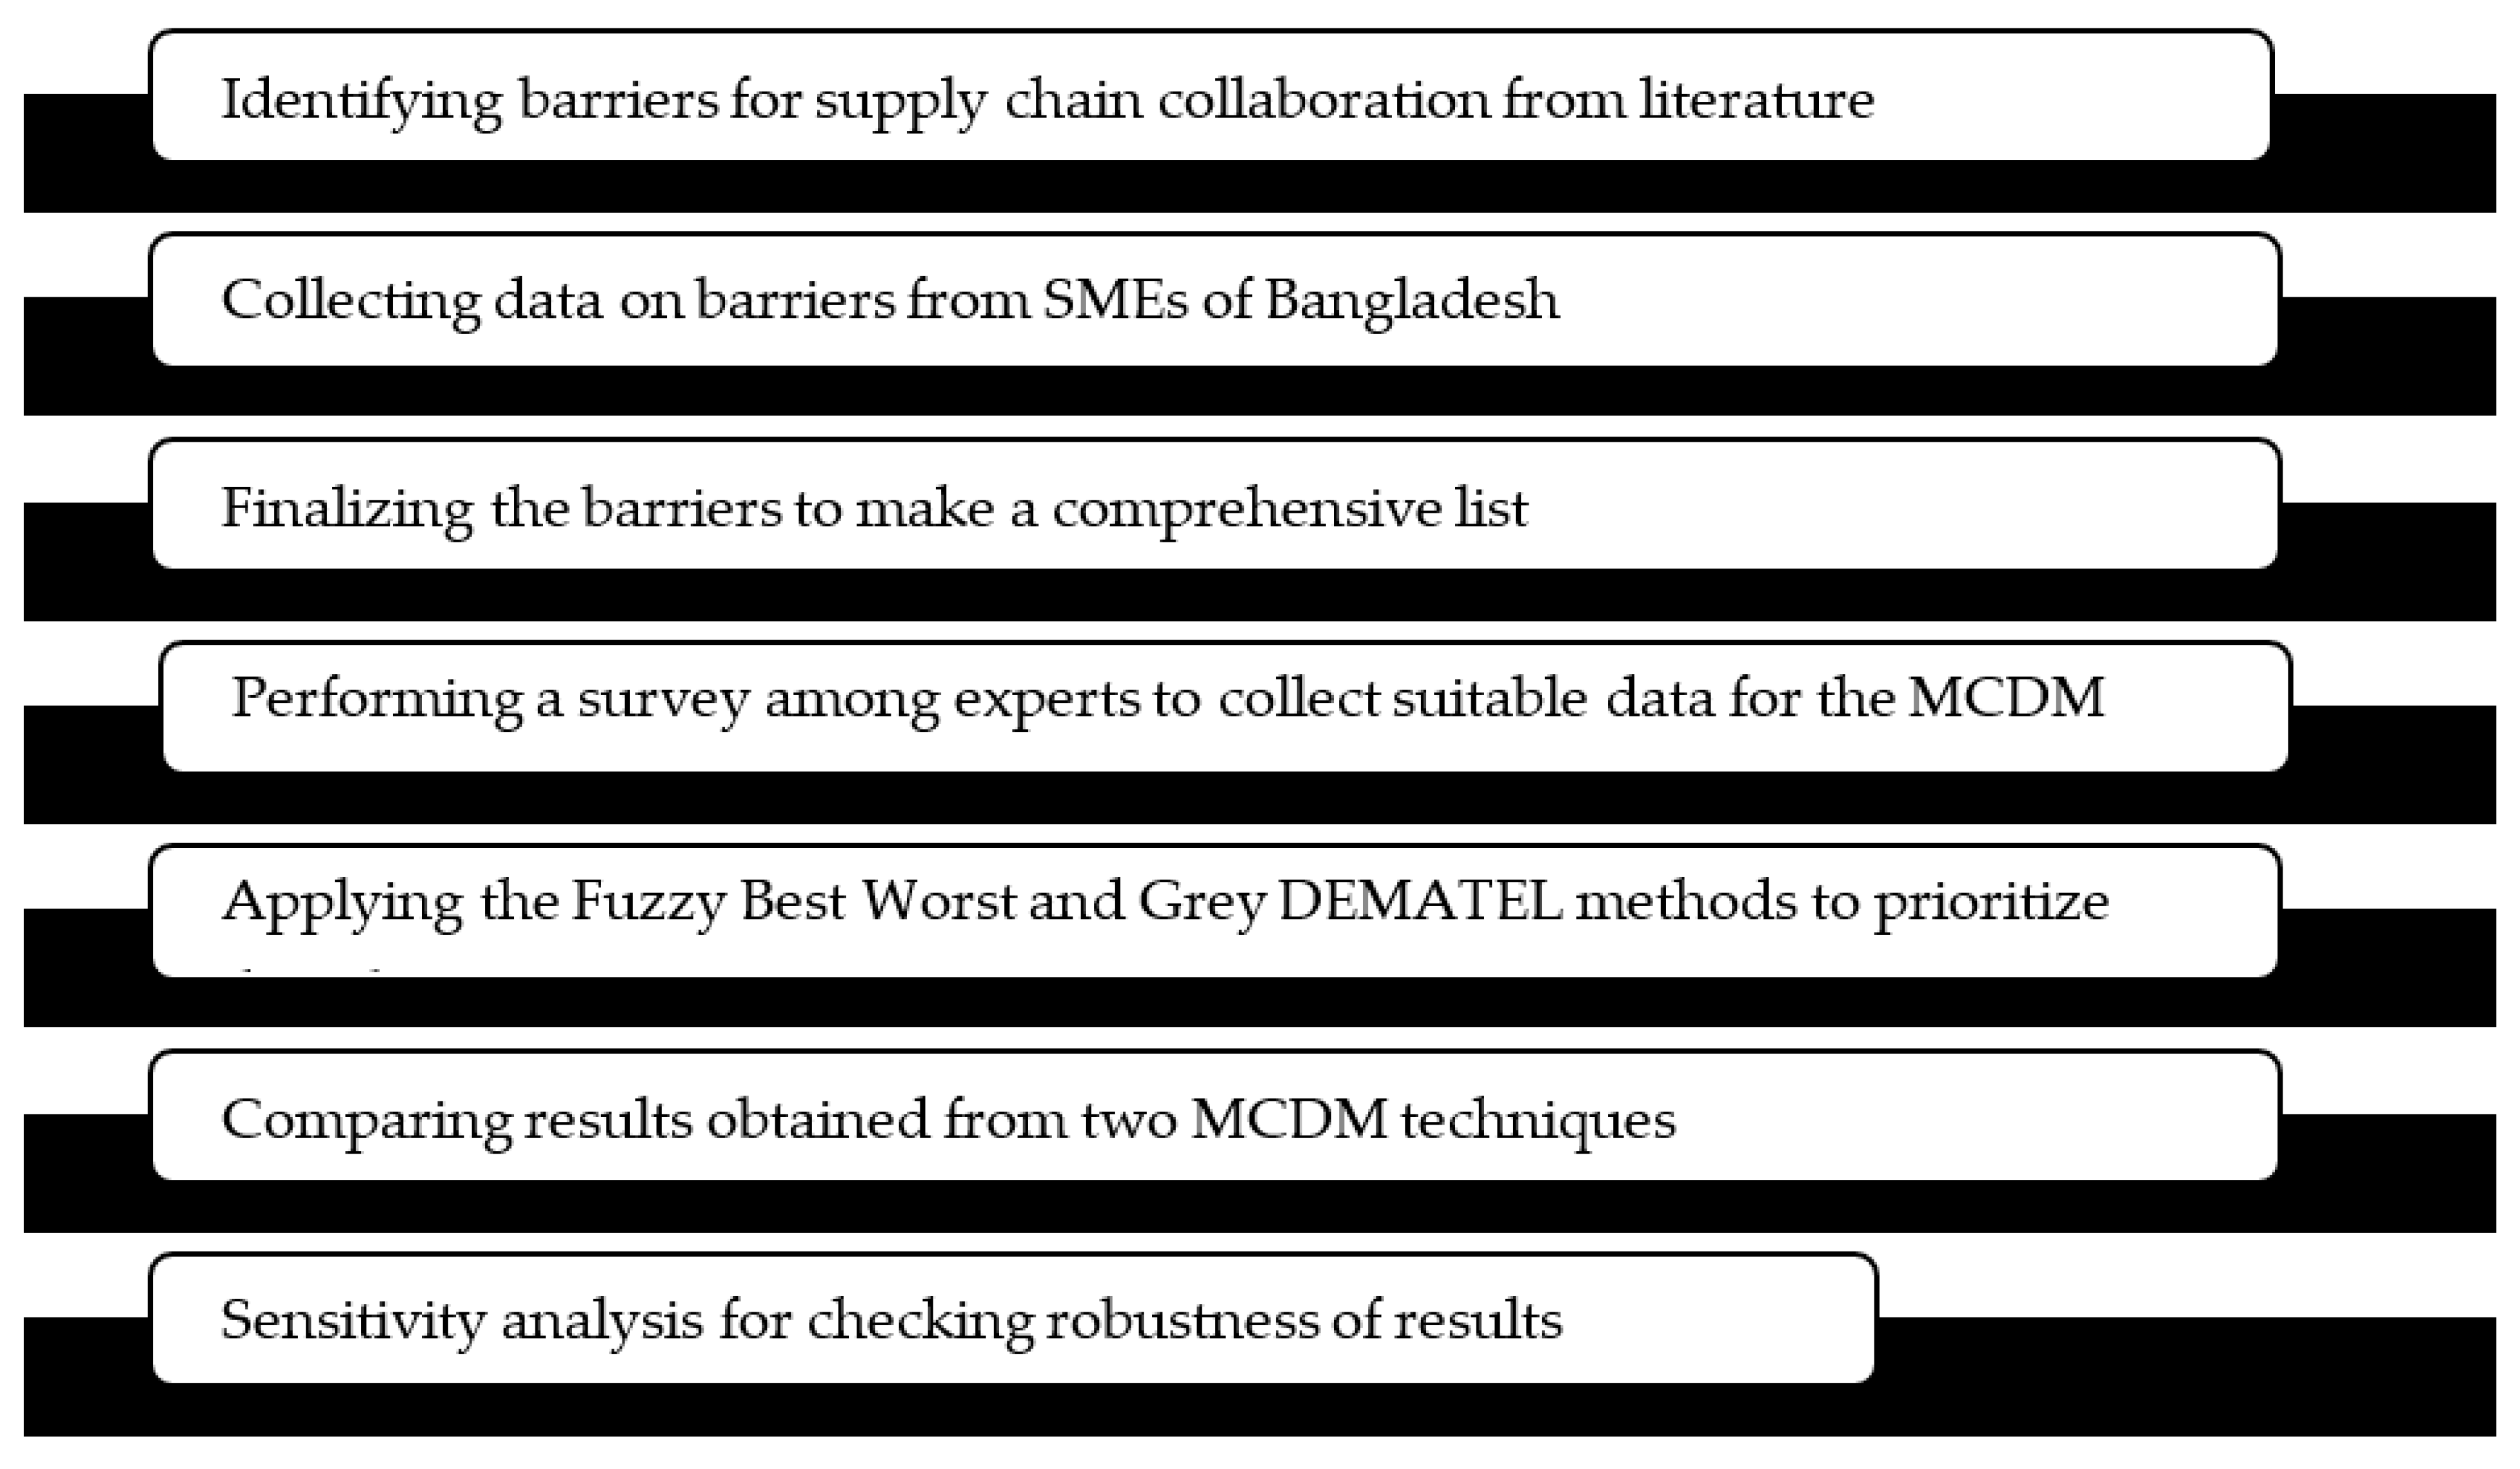
Before the application of MCDM methods, a questionnaire survey was conducted among SMEs of Bangladesh for identifying potential SCC barriers. Barriers from both the literature review and the first survey were aggregated to conduct another questionnaire survey regarding inputs of the model methods. The decision-modeling framework is shown in Figure 1.
3.1. Identification of SCC Barriers
We first identified the barriers from the literature review as reported in Table 1. Then, a list of SCC barriers was sought based on the interviews with entrepreneurs of 5 SME sectors. Then we finalized the SCC barriers from both interviews and literature review to contextualize for SMEs.
3.2. Analysis Using the Fuzzy Best Worst Method
Fuzzy Best Worst Method (FBWM) eliminate the ambiguity of decision-maker by incorporating fuzzy linguistic scale instead of traditional scale, such as 1–9 scale. The consistency ratio will be high and more reliable results can be achieved for evaluating our SCC barriers [89]. We completed the following steps in our FBWM analysis:
Step 1: Building a list of decision-making criteria
An appropriate set of decision-making criteria was selected based on the opinions of SME experts consulted.
Step 2: Determining the most and least important criteria
This is not a quantitative step—rather, it involves selection by the experts consulted for this research.
Step 3: Computing fuzzy reference comparisons for the best criterion
The fuzzy preferences of the best barrier are identified using Table 3 [89], which includes the linguistic variables of decision-makers. This generates the best-to-others vector as:
AB = (aB1, aB2, aB3, …, aBn),
Here, aBj expresses the fuzzy significance of the most important criterion B over criterion j,
Hence, aBB = (1,1,1).
Step 4: Computing pairwise comparisons between the other criteria and the worst criterion
The fuzzy preferences of all barriers are identified by using Table 3. This generates the worst-to-others vector as:
AW = (a1W, a2W, …, anW)T,
Here, ajW expresses the fuzzy significance of criterion j over the worst criterion W, and aWW = (1, 1, 1).
Step 5: Calculating the optimal fuzzy weights (w1*, w2*, w3*, …, wn*).
This aims to generate optimal weights of the selected indicators. For the ideal condition (that is, a fully consistent system) |wB/wj − aBj| and |wj/ww − ajw| should be equal to zero.
We need to minimize the maximum absolute differences to get closer to the ideal condition {|wB/wj − aBj|, |wj/ww − ajw|}, which creates the following model,
Equation (1) can be transferred into the following nonlinear programming problem min ξ:
Let, ξ* = (k*, k*, k*), , then Equation (2) can be rewritten as min ξ*:
By solving Equation (3), we can get optimal weights (w1*, w2*, w3*, …, wn*) and ξ* thereby providing the consistency ratio. The value of ξ*defines the consistency level of the decision makers’ opinions. Values close to zero indicate high levels of consistency and more reliable comparisons. Large values indicate problems in prediction or calculation, requiring re-assessment of the data.
3.3. Analysis Using the Grey DEMATEL Method
The Grey DEMATEL method is a special kind of MCDM technique that considers interrelation among all barriers to evaluating decision criteria. Influential relation maps can be drawn in this method for visualizing relations among criteria. We have used this method in our analysis of barriers by considering its features.
The stepwise procedure of Grey DEMATEL is described as follows.
Step 1: Building the Grey direct relation matrices
Let the number of barriers be ‘n’ and the number of respondents be ‘l’. Each respondent k evaluates the direct influence of criteria i over criteria j on the linguistic scale of Table 4 [92]. Thus, l Grey direct relation matrices were constructed.
Step 2: Computing the average Grey direct relation matrix
The average Grey direct matrix is established from l Grey direct matrices,
Step 3: Computing the crisp Grey direct relation matrix
The Grey values are crisped according to the following three-step modified-CFCS method [92],
(a) Normalization:
(b) Total Normalized Crisp Value:
(c) Final Crisp Value:
Step 4: Computing the normalized direct relation matrix
The normalized matrix N is computed by identifying s and multiplying Z with s
Step 5: Computing the total relation matrix
The total relation matrix is calculated as below,
Step 6: Computing cause and effect parameters
The row sum (ri) and column sum (cj) values of T are identified. Then prominence (ri + cj) and relation (ri − cj) values are calculated.
Step 7: Producing the prominence-causal DEMATEL graph
The horizontal axis of the graph includes the prominence values (ri + cj) and the vertical axis contains the relation values (ri − cj). This graph has four sections or quadrants including intertwined giver, autonomous giver, autonomous receiver, and intertwined receiver [93].
Step 8: Identifying relative weights of barriers
Importance weights are calculated based on prominence values (ri + cj) through a normalization procedure as below,
Global weights of the barriers are calculated after determining local weights from both methods.
4. Data Collection and Analysis
In this section, we identify and evaluate the barriers of SCC.
4.1. Selection of Decision Criteria
For identifying barriers for SCC, we took interviews of 30 entrepreneurs of 5 SME sectors, such as,
- Agro-processing
- Leather and leather goods
- Light engineering and metalworking
- Plastic and other synthetics
- Electrical and electronics
- Fashionwear and handicrafts.
After collecting barriers from both literature and SMEs, we made a comprehensive list of the SCC barriers. A questionnaire-based survey was conducted to select the most appropriate barriers of SCC for SMEs in Bangladesh. We created a web-based form containing questions that included indicators identified from the relevant literature. The questionnaire was sent to targeted industrial managers (IMs) and academic experts. We have considered the same importance weight of the responses from each of the experts to ensure that they all have equal influence on the result. Respondents were asked whether the indicators were suitable (see Appendix A, Table A1) in Bangladesh. Through this survey process, 23 SCC barriers were selected as presented in Table 5.
4.2. Evaluation of Barriers Using the Fuzzy Best-Worst Method
The 16 experts (Table 6), who responded, first selected the best and the worst categories and then the best and the worst barriers from the appropriate column (Appendix B, Table A2, Table A3, Table A4, Table A5, Table A6, Table A7, Table A8, Table A9, Table A10, Table A11 and Table A12). Experts also completed the comparison matrix using the linguistic scale in Table 3. The optimal weight of the main categories and the barriers were calculated by solving models presented in Equation (3). The optimal weight of the main categories and the barriers and the consistency value of the results from the 16 experts are summarized in Table 7. By multiplying the main categories’ weight with the barrier weight, a final normalized weight of each barrier was obtained. The normalized weight of each barrier and final ranking are shown in Table 8.
As, aBW = AI = (7/2,4,9/2), the consistency index for this case is 8.04. [89].
As such, consistency ratio for the main categories = 0.3542/8.04 = 0.044.
4.3. Evaluation of Barriers Using the Grey DEMATEL Method
The Grey DEMATEL method was used to rank direct influences among barriers using the linguistic scale provided in Table 4. Experts individually constructed Grey direct relation matrices of categories and barriers. Some of those matrices obtained from 16 experts are provided in Appendix C (Table A13, Table A14, Table A15, Table A16 and Table A17). The final Total Relation Matrices are computed using Equation (14).
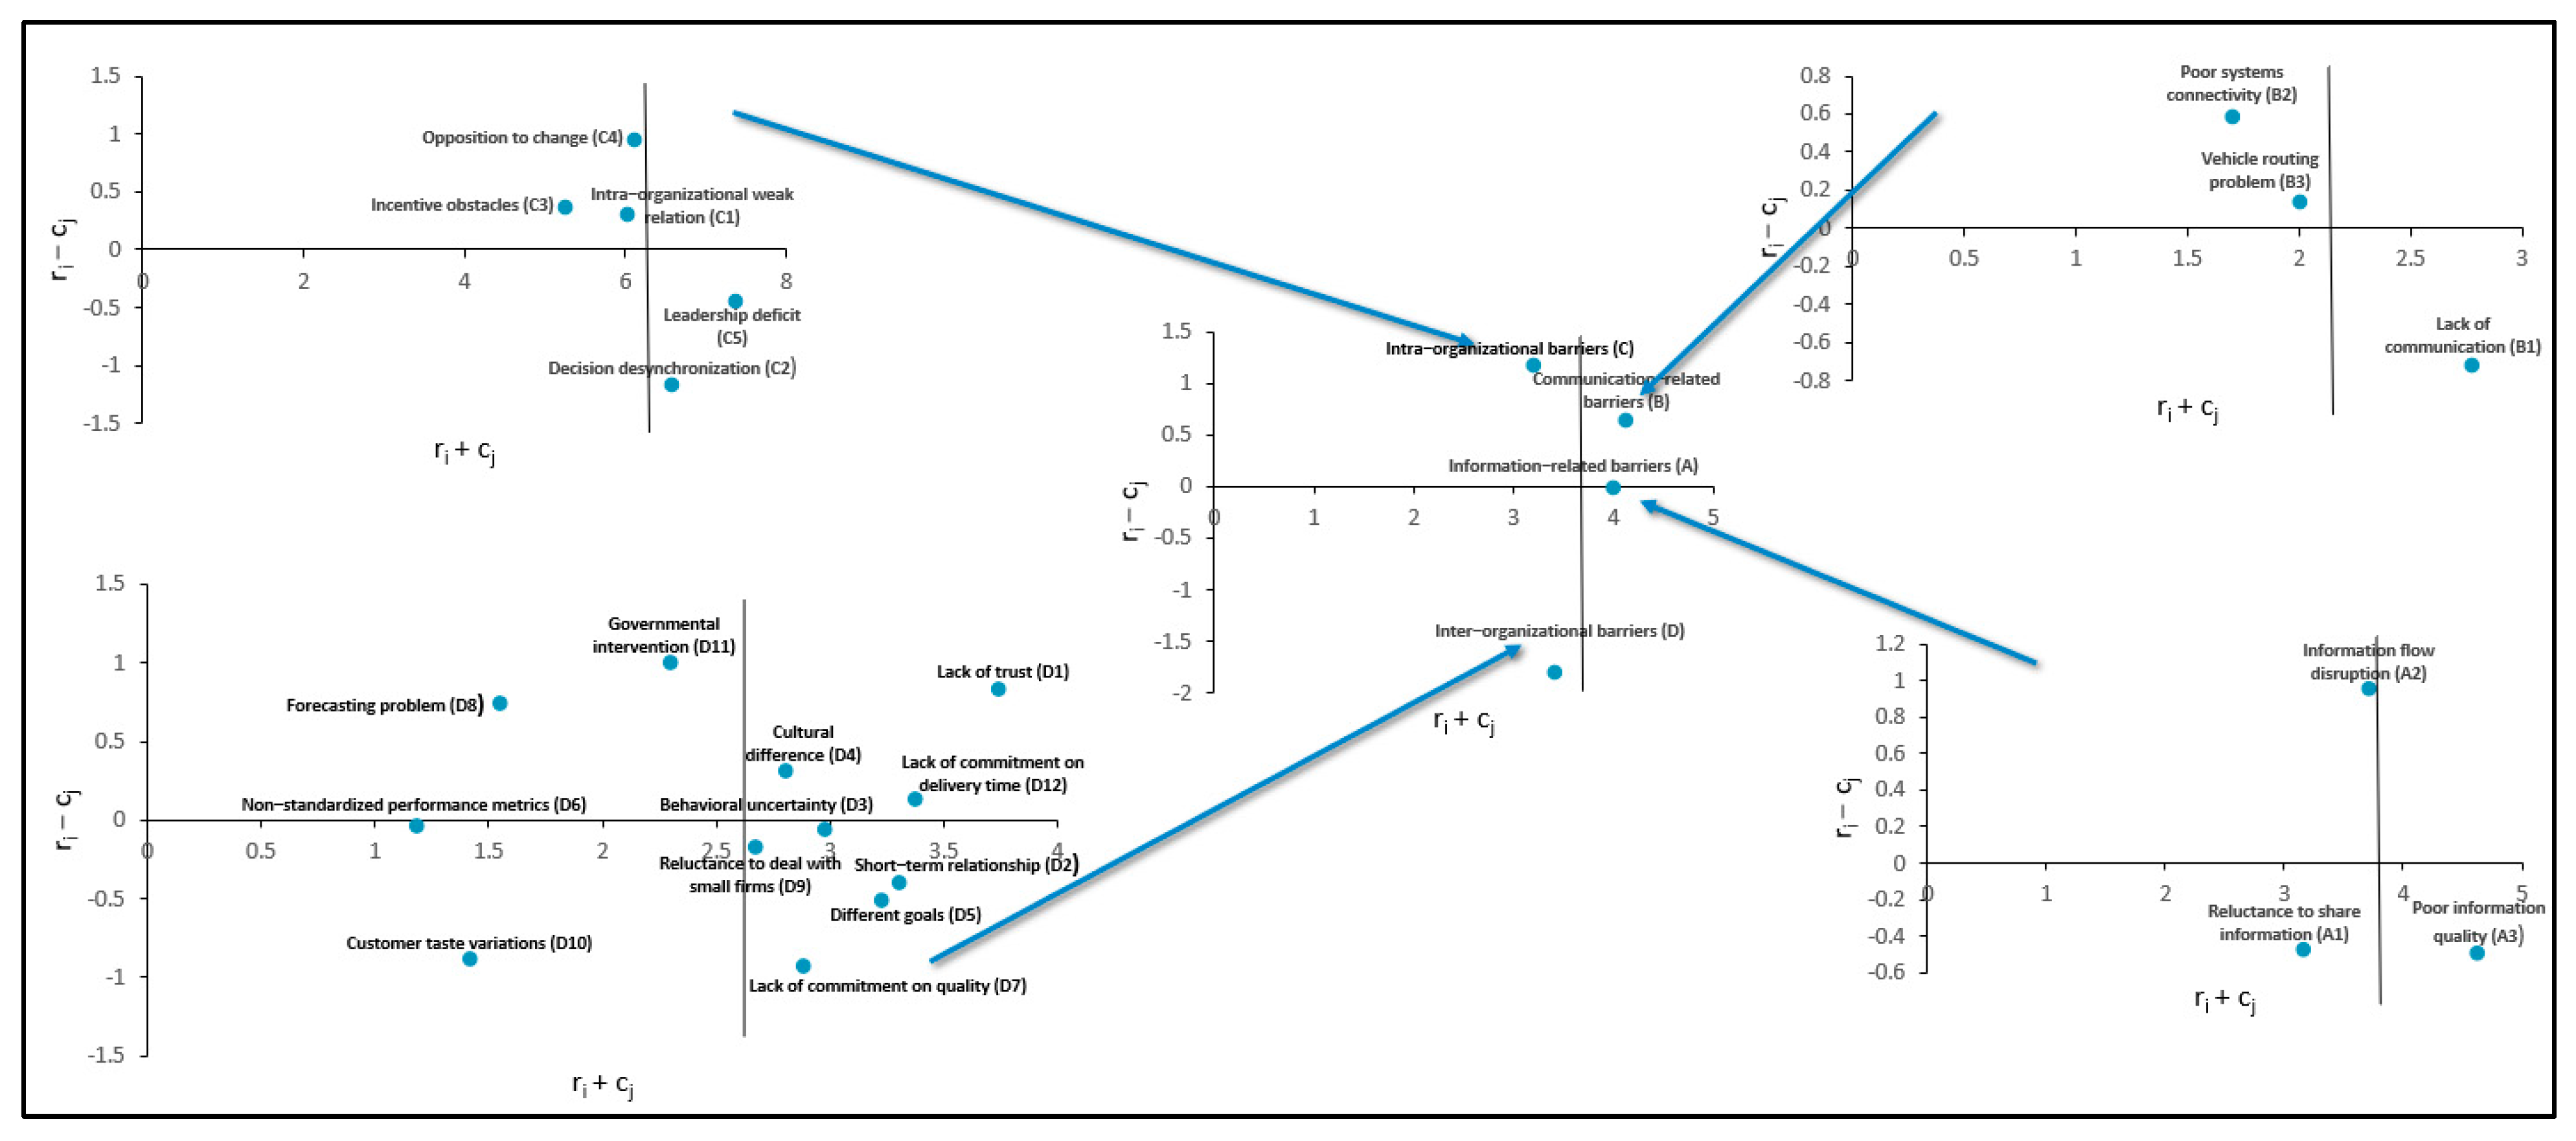
Finally, the cause and effect parameters (prominence (ri + cj) and relation (ri − cj) values) and relative weights are computed from . They are shown in Appendix C. Using the prominence and relation values, the prominence-causal DEMATEL graphs are formed for categories and the barriers as shown in Figure 2. Then we determined global weights using local weights; these are presented in Table 9.
Figure 2 connotes that communication-related barriers (B) is the core category or intertwined giver—it is the key category that affects all others. Intra-organizational barriers (C) is an autonomous giver or driving category. They have low prominence but high relation; it affects certain other categories. Inter-organizational barriers (D) is an autonomous receiver or independent category and has low prominence and relations. Information-related barriers (A) are intertwined receivers or an impact category. It has high prominence but low relation. It is affected by other categories and cannot be improved directly.
5. Results and Discussion
In this section, we discuss the results of our analysis. We also explain the validity of our results through sensitivity analysis. Finally, we discuss the practical implications and contributions of our work.
5.1. Results and Discussion
We have measured weights of four main barrier categories, as well as local weights of barriers using FBWM. The consistency ratios are all close to zero, ranging from 0.044 to 0.098, which suggests the high reliability of the results. From Table 10, communication-related barriers (B) is the most important category, followed by information-related barriers (A) and inter-organizational barriers (D). Intra-organizational barriers (C) is the least important category. Poor information quality (A3) is the most significant information-related barrier. Among communication-related barriers, lack of communication (B1) plays the most important role. Leadership deficit (C5) plays the most significant role in creating intra-organizational barriers. Lack of trust (D1) is the most important inter-organizational barrier. Based on global weights, lack of communication (B1) is the most important barrier. It is followed by poor information quality (A3), Information flow disruption (A2), and Vehicle routing problems (B3).
Measuring weights using the Grey DEMATEL method, we got the highest value of “r” for communication-related barriers (B), which means it had a high influence on other categories. Information flow disruption (A2) has the greatest influence on other information-related barriers. Poor systems connectivity (B2) affects lack of communication (B1) and vehicle routing problems (B3). Opposition to change (C4) and lack of trust (D1) are the most effective barriers among intra- and inter-organizational barrier categories, respectively.
In the Grey DEMATEL method, “c” for each barrier reflects the impact of other barriers on it. Inter-organizational barriers (D) is the most affected category. Poor information quality (A3) has the highest impact on other information-related barriers. All other communication-related barriers affect lack of communication (B1) most. Leadership deficit (C5) has the highest impact on other intra-organizational problems. Different goals (D5) is the most affected inter-organizational barrier.
The Prominence Factor (ri + cj) shows the importance weight of a criterion in the DEMATEL method. Communication-related barriers (B) is the most important category, followed by information-related barriers (A) and inter-organizational barriers (D). Intra-organizational barriers (C) is the least important category. Poor information quality (A3) is the most significant information-related barrier. Among communication-related barriers, lack of communication (B1) plays the most important role. Leadership deficit (C5) plays the most significant role in creating intra-organizational barriers. Lack of trust (D1) is the most important inter-organizational barrier.
The vertical axis of the DEMATEL graph is “Relation” (ri − cj) values. They categorize categories into cause groups and effect groups. The positive values stand for the cause group and negative values for the effect group. Communication-related barriers (B) and intra-organizational barriers (C) are causal categories, whereas Information-related barriers (A) and inter-organizational barriers (D) are effect categories. A2 among information-related barriers; B2 and B3 under communication-related barriers; C1, C3, and C4; under intra-organizational barriers; and barriers D1, D4, D8, D11, D12 under inter-organizational barriers, are from the causal group which affects all other barriers. All other remaining barriers form the effect group which is affected by these barriers.
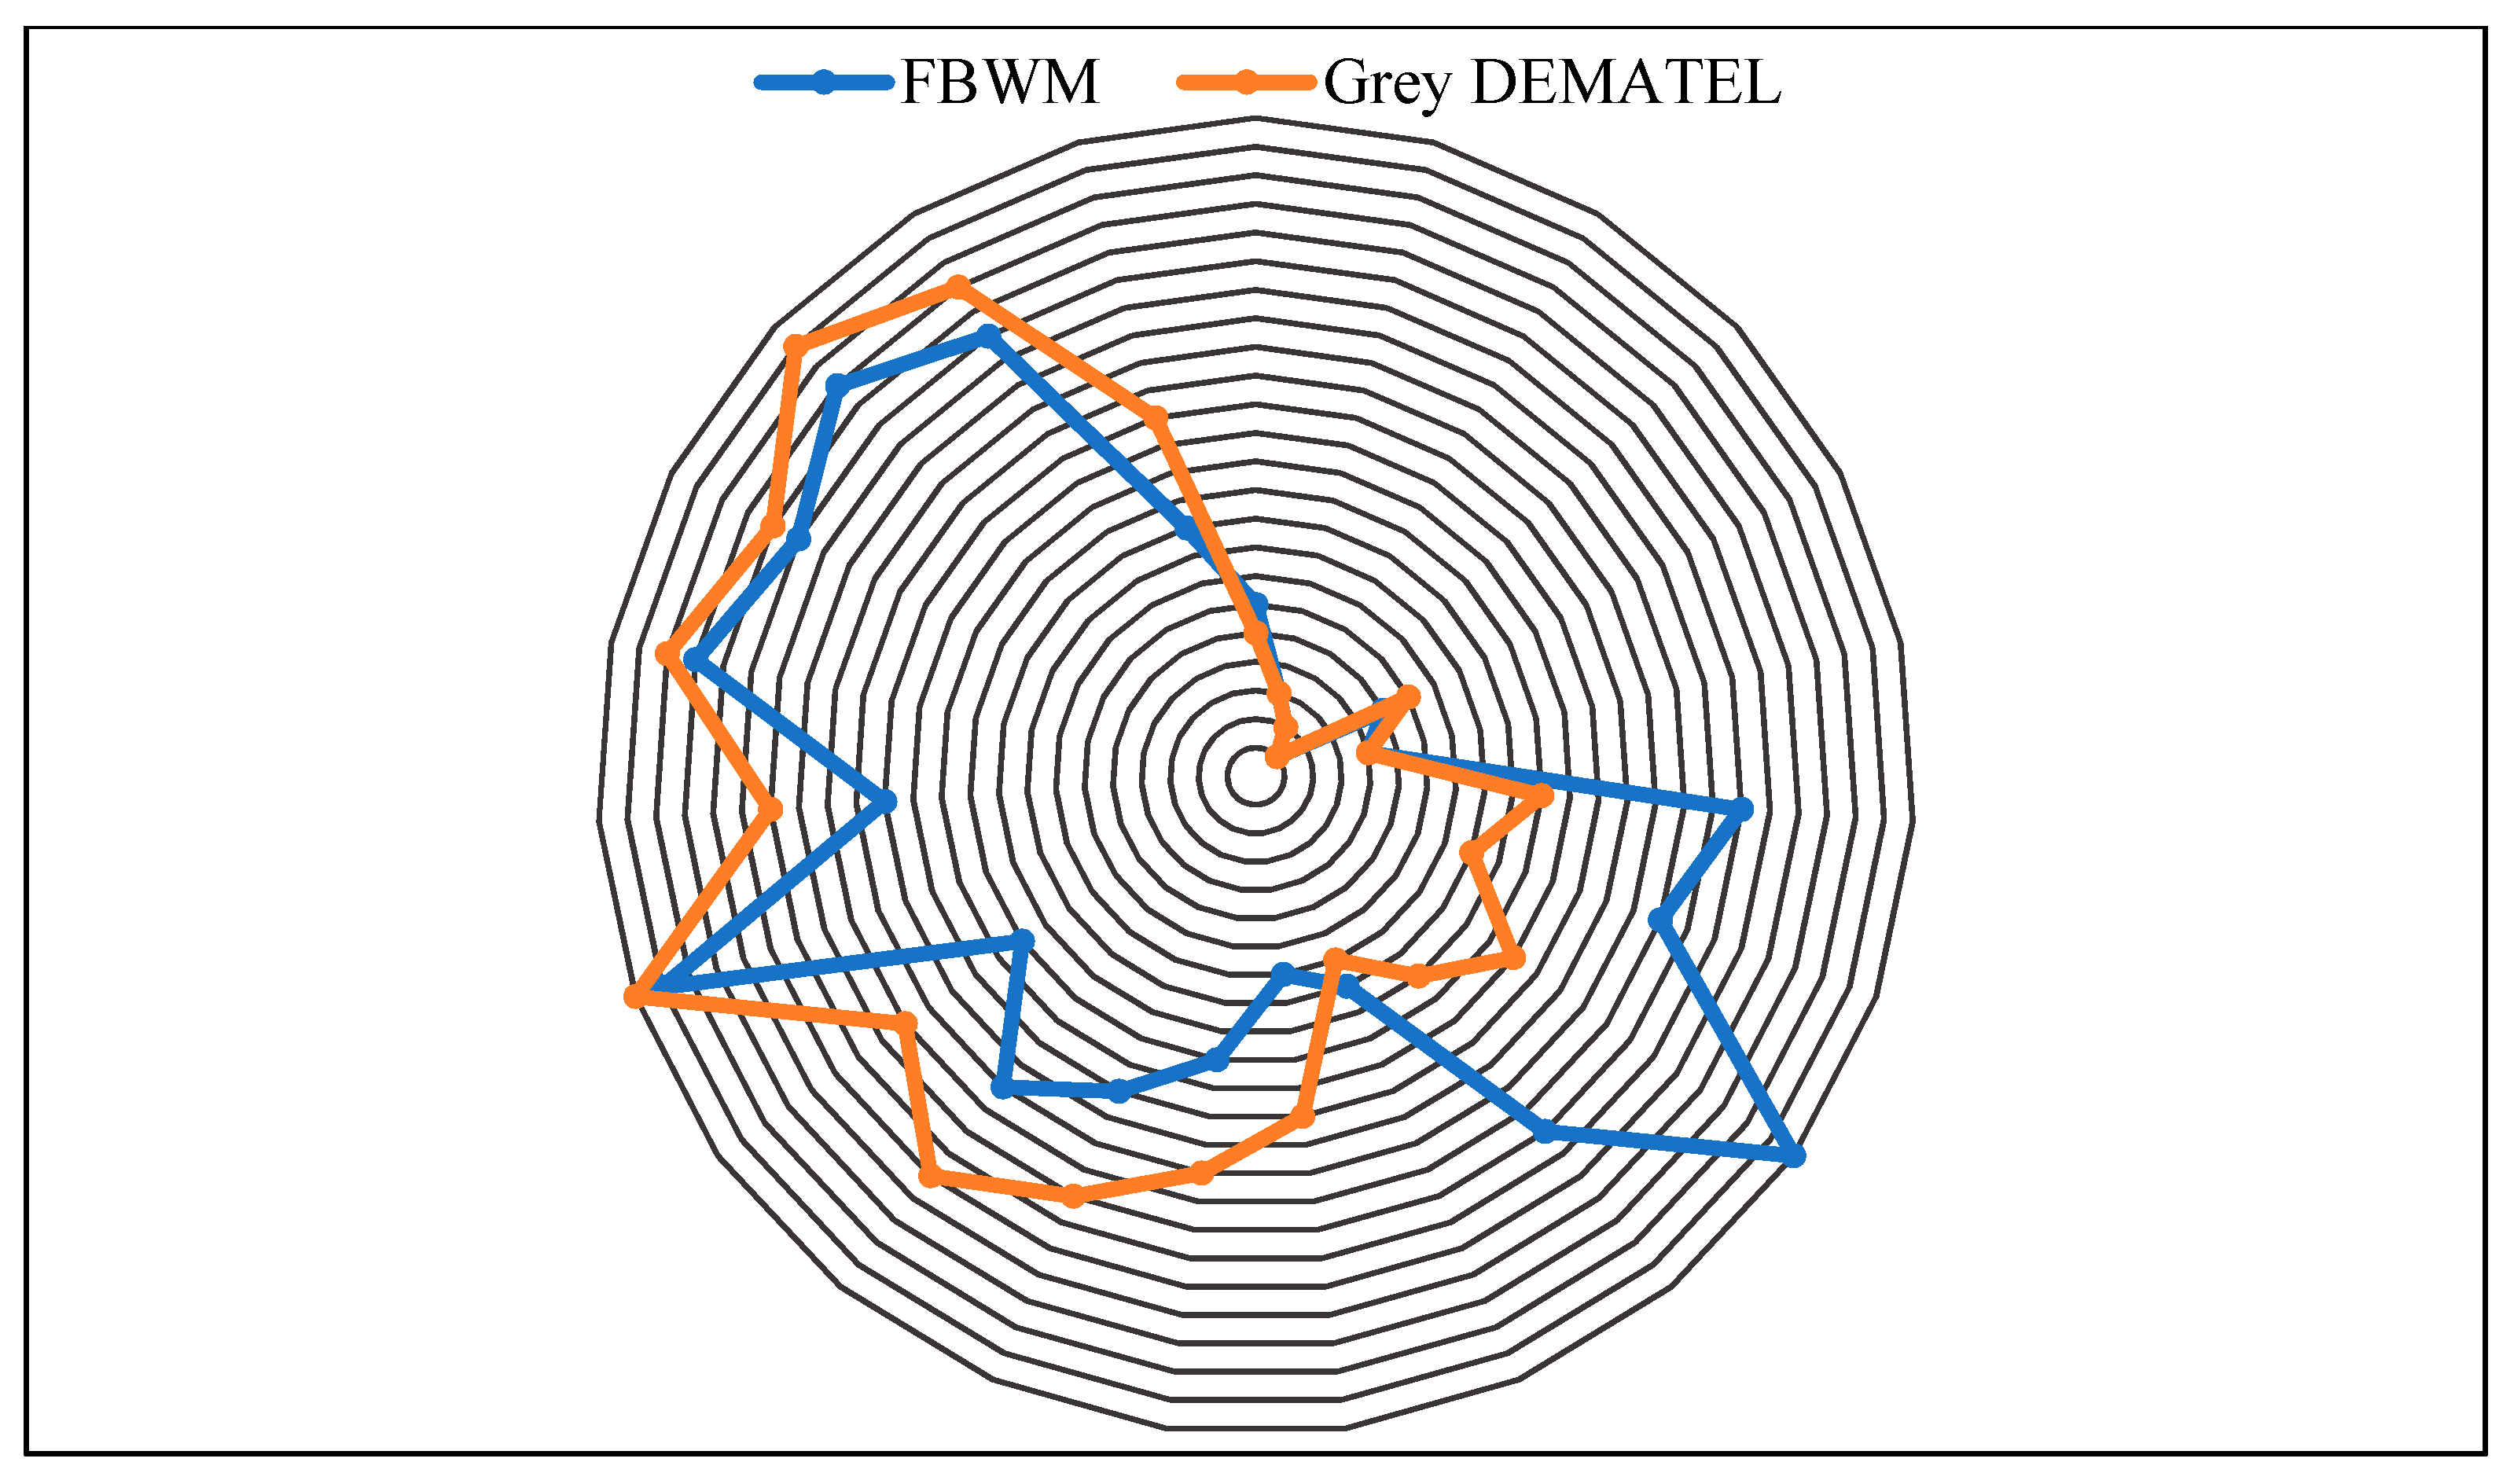
The difference in rankings of the barriers from both methods has been illustrated in Figure 3. Lack of communication (B1) is the most important barrier according to both methods. Poor information quality (A3), information flow disruption (A2), and vehicle routing problems (B3) are identified as the second, third, and fourth priorities, respectively, within all barriers. Other priority rankings are different among the applied methods for the following reasons:
- The Grey DEMATEL method considers interdependent relations among all barriers, whereas FBWM considers relationships of best and worst barriers.
- The Grey DEMATEL method contains prominence-causal maps for visualizing interrelations among barriers.
- FBWM does not consider cause and effect relations like the Grey DEMATEL method.
- In the Grey DEMATEL method, we used the Grey linguistic scale, which contains two numbers representing influence ratings, whereas we used triangular fuzzy numbers as linguistic variables in FBWM. They represent importance ratings.
5.2. Sensitivity Analysis
We performed a sensitivity analysis to ensure the robustness of our results. A sensitivity analysis is carried out by changing the weight of the top-ranked criterion and noting changes in the weights of other criteria [94,95]. The sensitivity analysis was also performed by adjusting the weights of the experts [96]. This testing helps filter out major changes during variation of the weights of experts or the top-ranked criterion. As the methodologies of the two proposed methods are different, the sensitivity analysis was conducted differently.
5.2.1. Grey DEMATEL Method
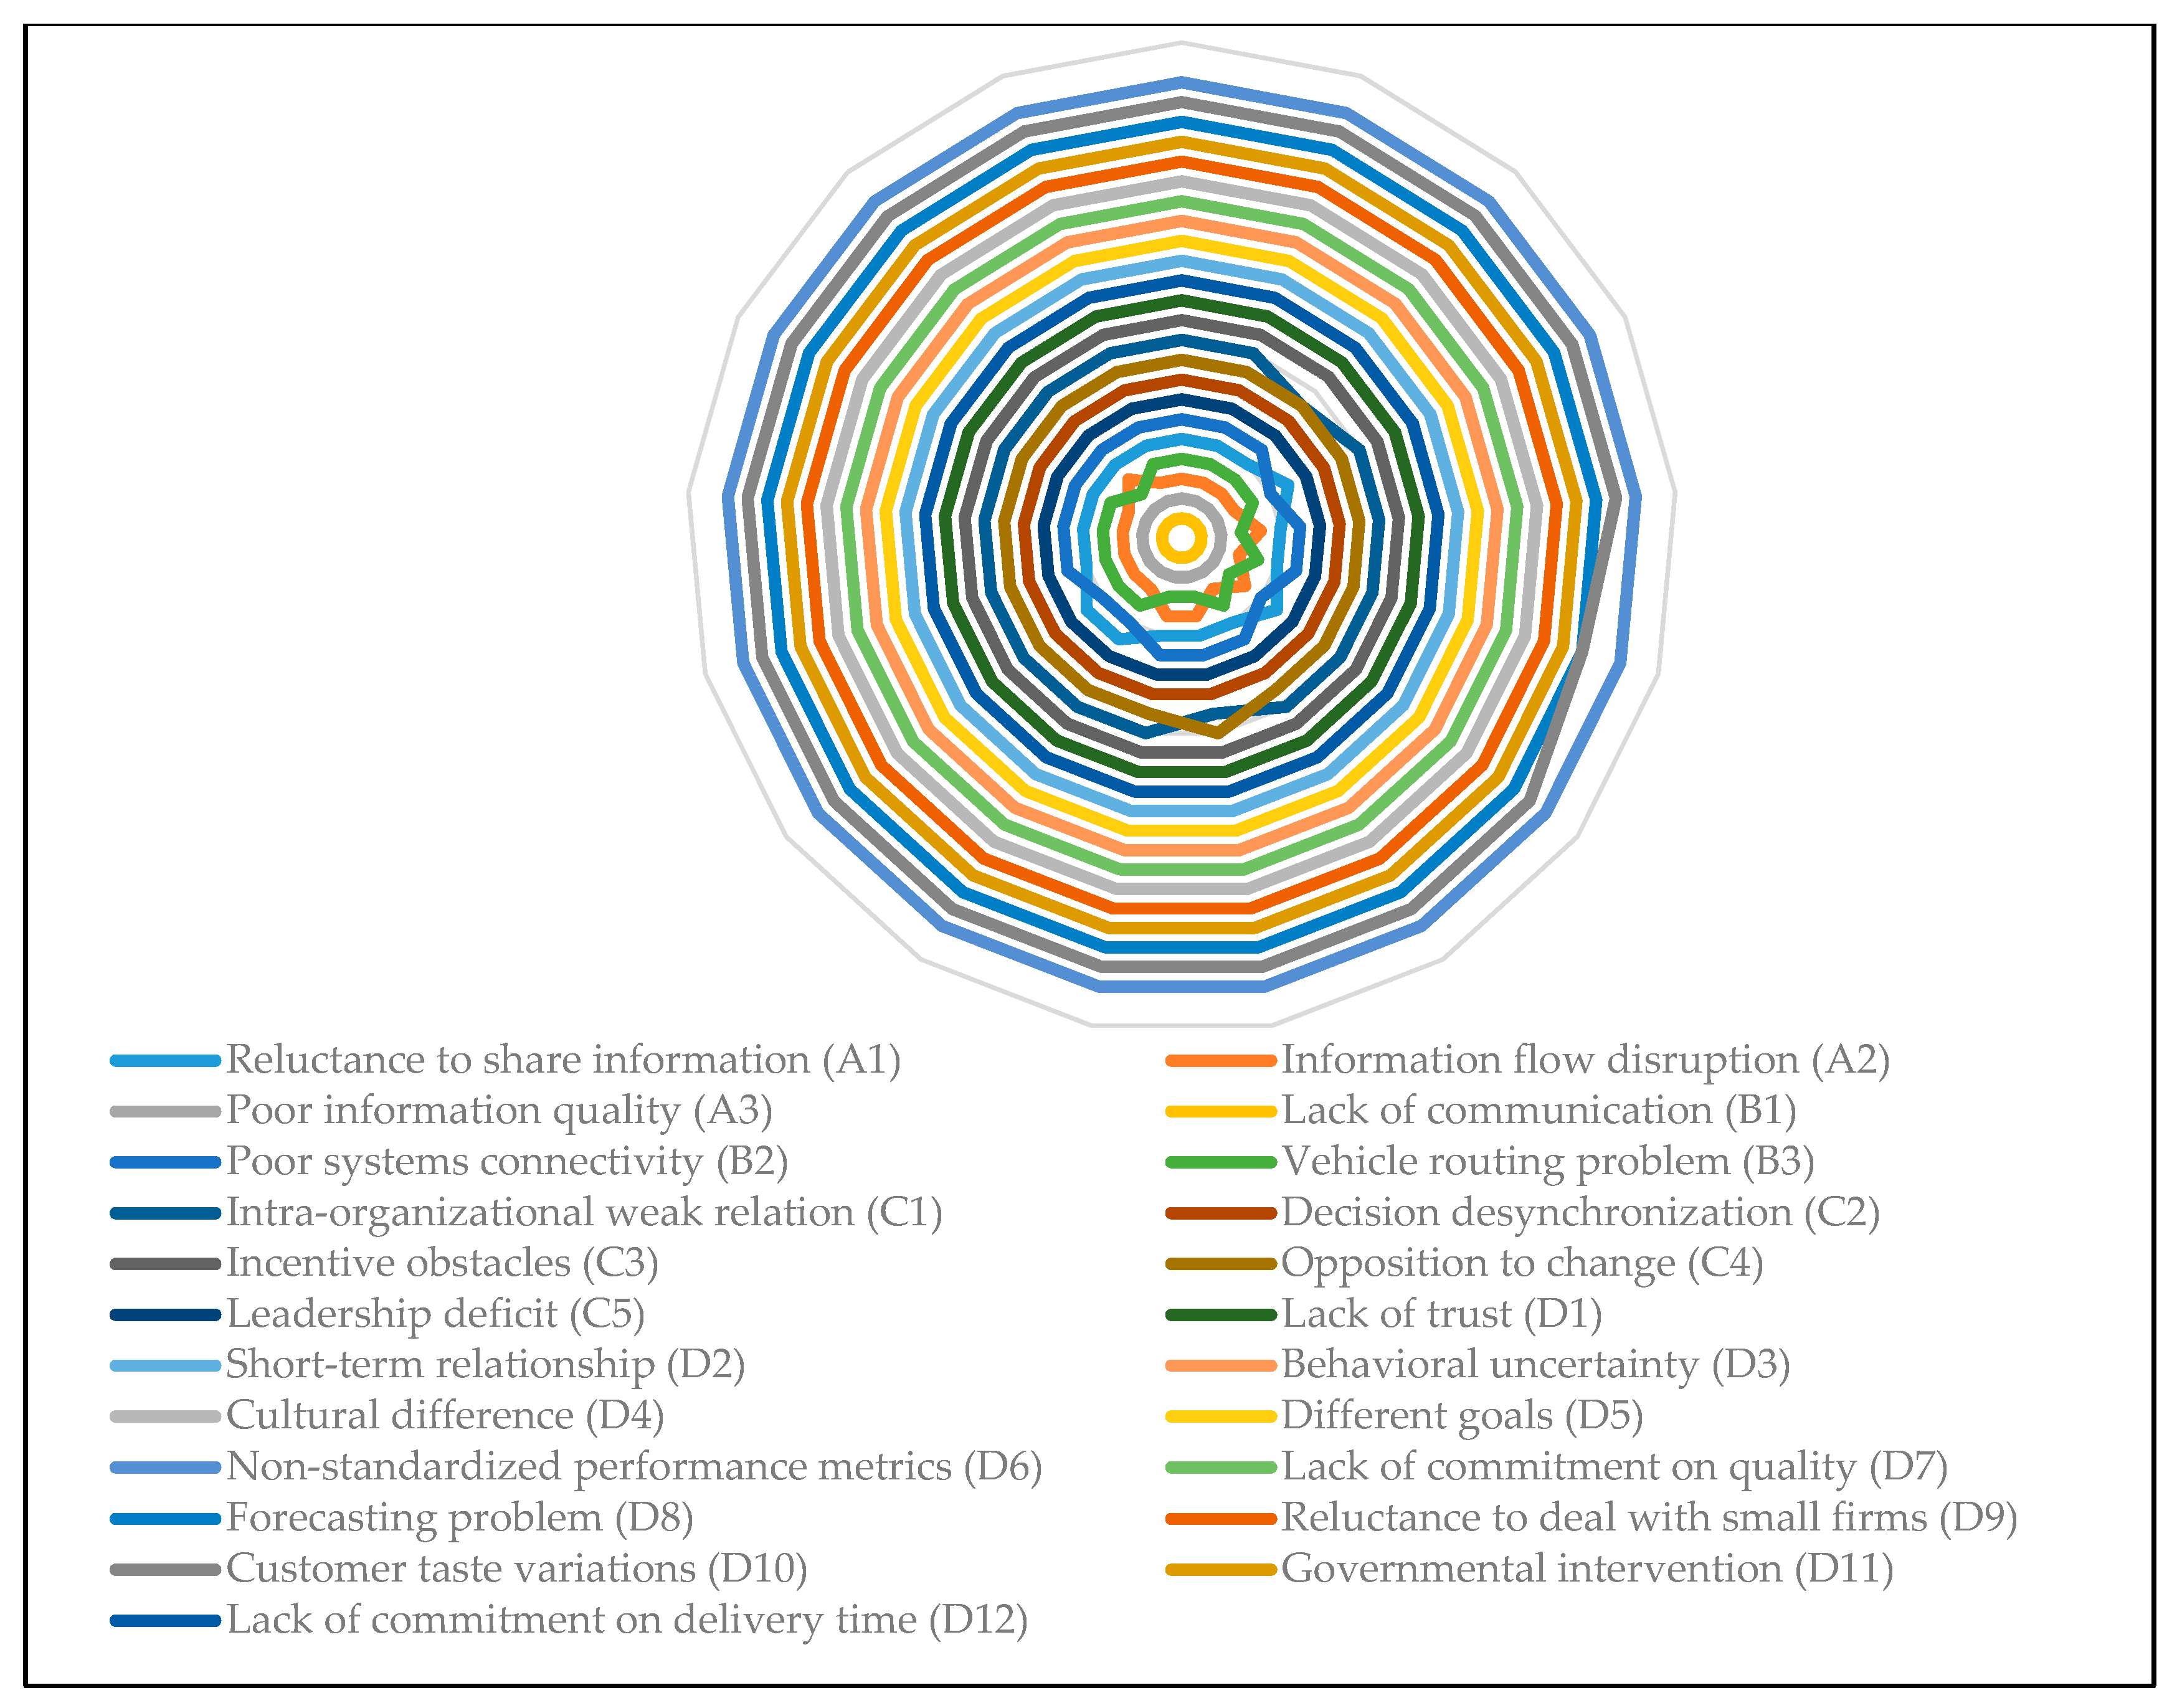
In our analysis, we considered equal weights for each expert. We have presented 16 scenarios by changing the weights of the experts and applying the Grey DEMATEL method for each scenario; results are tabulated in Appendix D (Table A18, Table A19 and Table A20). The variation in rankings is illustrated in Figure 4. The rankings of A1, A2, B2, B3, and C1 are slightly different, but most of the rankings remain unchanged. So, the proposed model frameworks seem robust to small variations in input values.
5.2.2. Fuzzy Best Worst Method
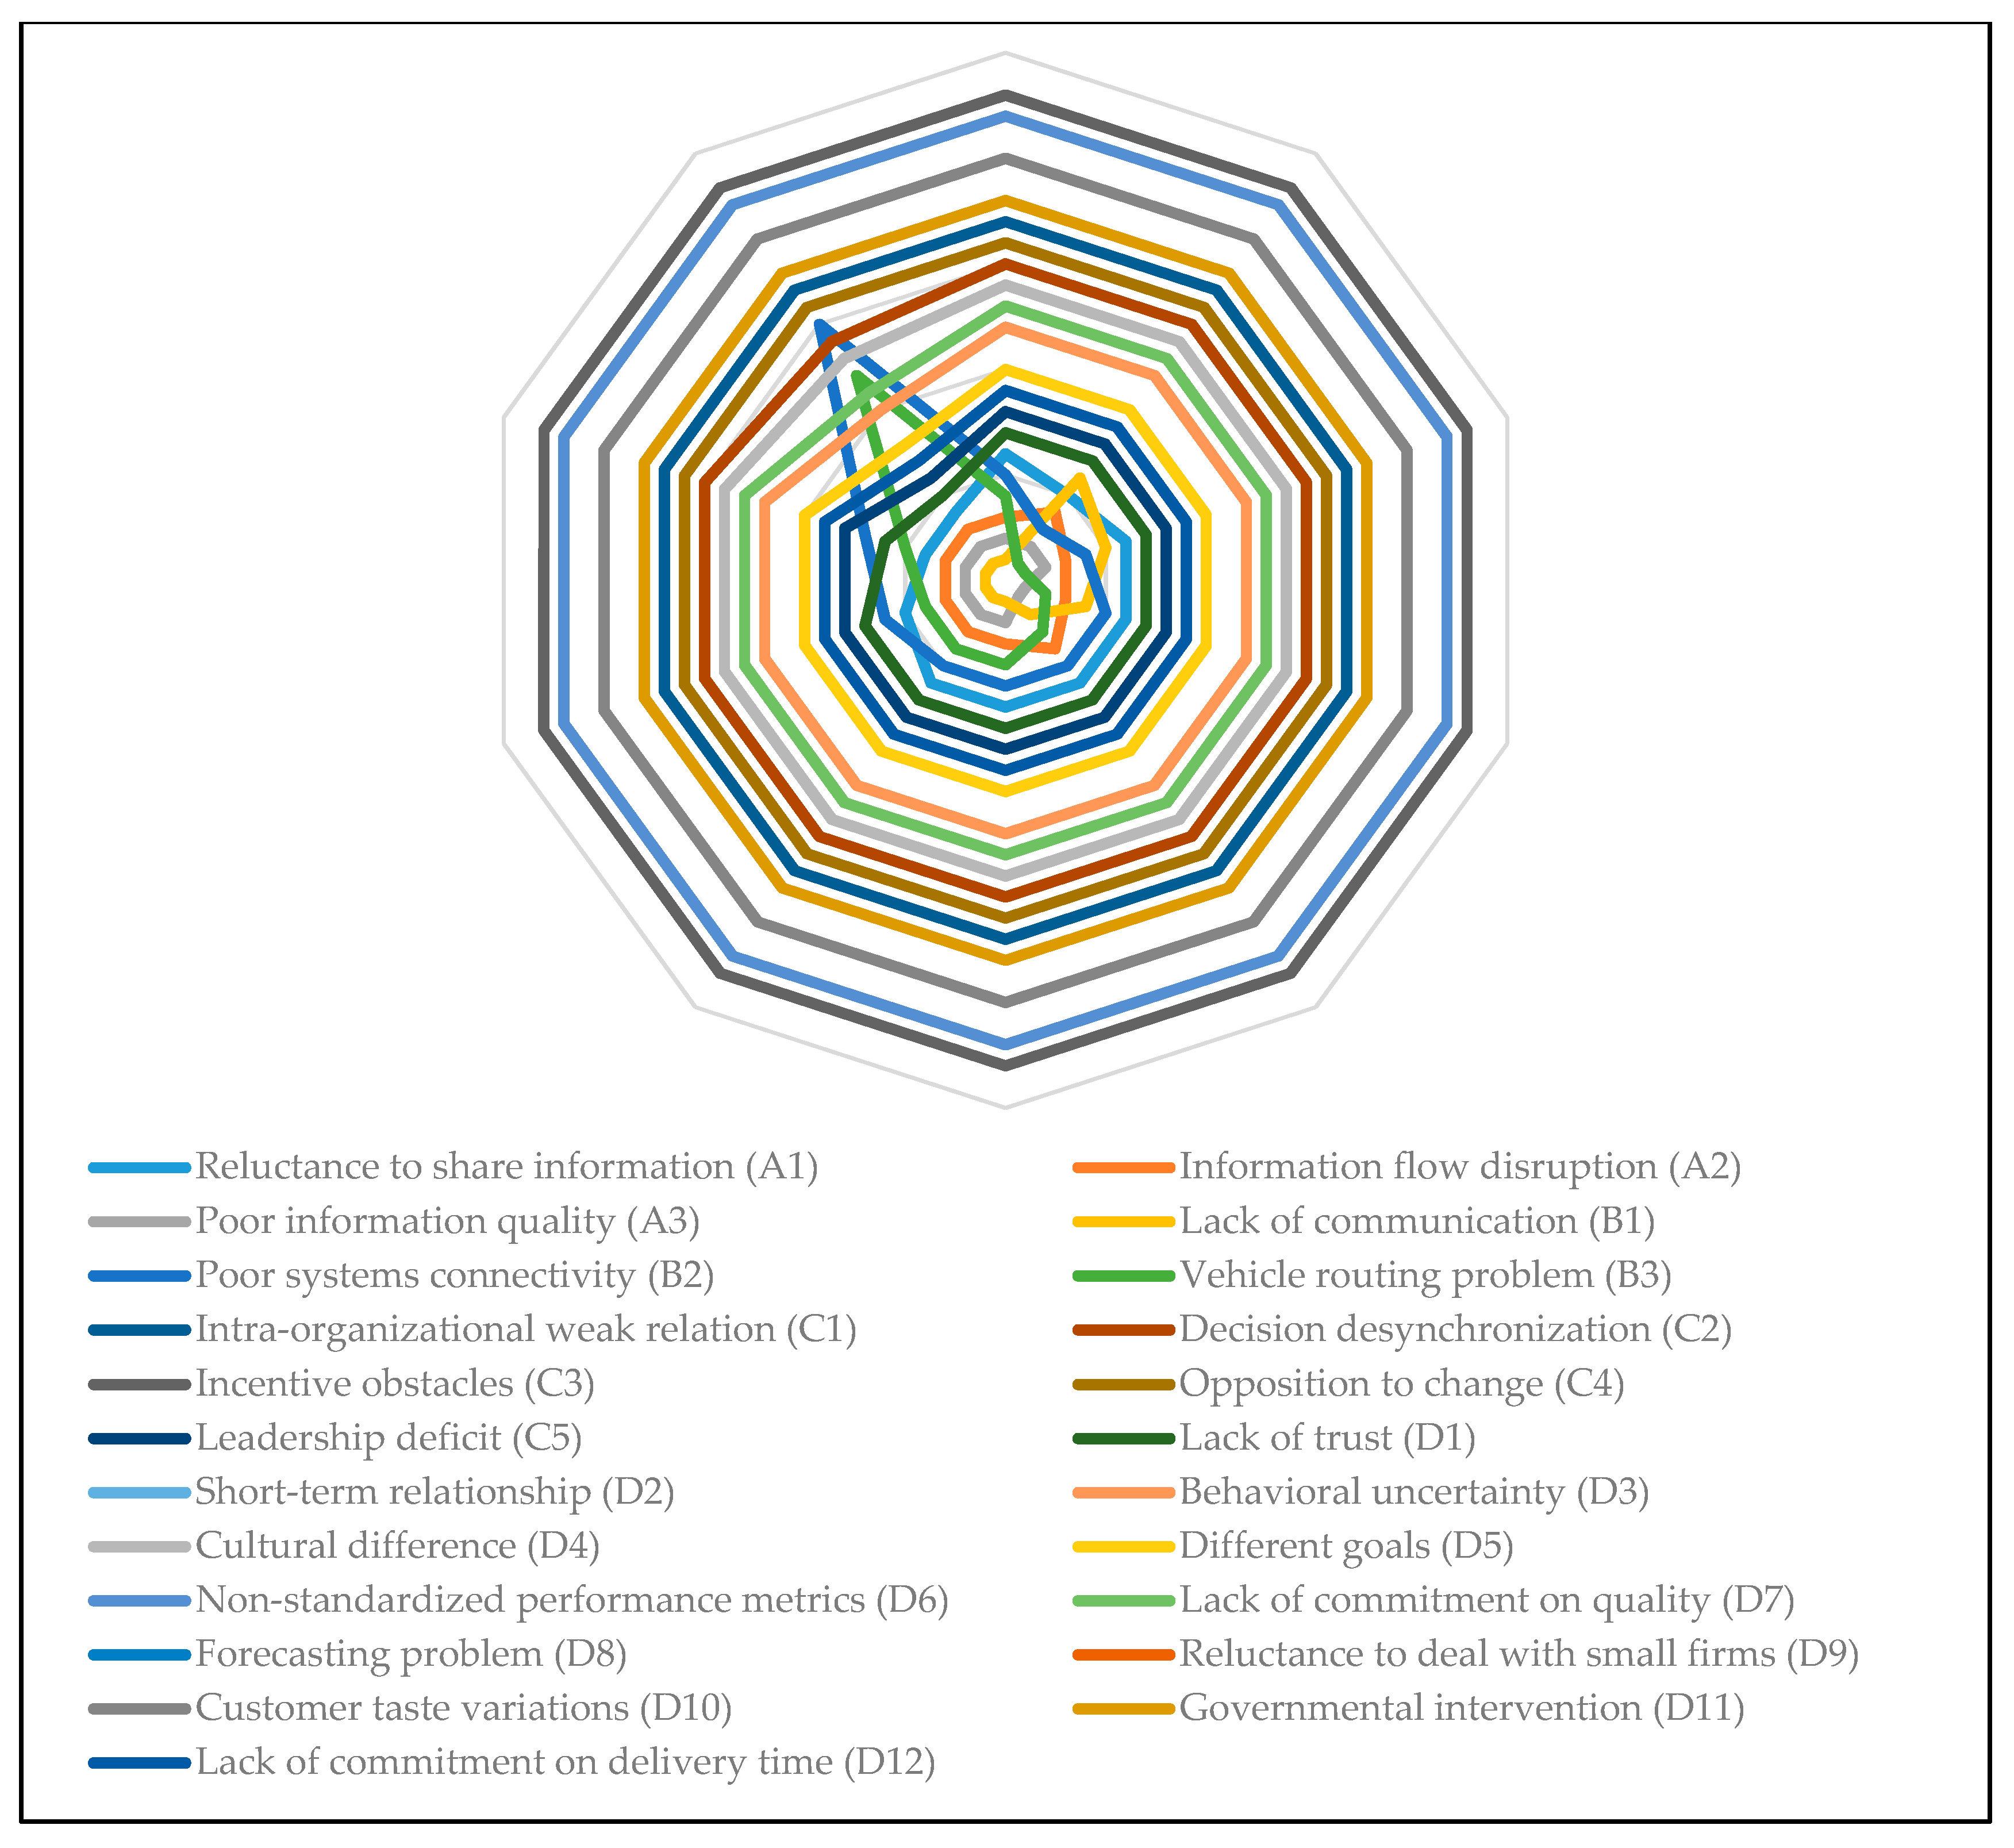
A top-ranked criterion capable of influencing other criteria is determined by sensitivity analysis, in which the weight of that criterion is changed [94]. Lack of communication (B1) is the most significant barrier according to FBWM. We have performed a sensitivity analysis by considering the incremental change in weights from 0.1 to 0.9 of B1. Appendix D shows different rankings of the barriers during different runs of the sensitivity analysis. The variation in the ranking of the barriers is illustrated in Figure 5. For a weight 0.9 of B1, rankings of some barriers have changed, but most not significantly, which is characteristic of a consistent system.
5.3. Implications and Contributions
This research identifies and ranks the barriers to SCC taking SMEs from various industries in Bangladesh. The findings will assist SME managers in understanding SCC barriers and hence formulate their strategies to improve supply chain resilience and sustainability. This is particularly important in the current situation as the COVID-19 pandemic has been taking a test of supply chain resilience for all supply chains across the globe. The classification of barriers under four main categories will enable SME managers to navigate the barriers they are facing. Since complete elimination of the barriers is not feasible, ranking of barriers will help in prioritizing the most crucial barriers. SMEs need to monitor continuously and devise strategies to eradicate the most critical barriers.
The finding of the study reveals the importance of communication and information-related barriers to SCC among SMEs of Bangladesh. Lack of communication is the most important barrier that SME managers should focus on (see Table 10). During the COVID-19 pandemic, the literature also identified that there is a significant lack of communication in supply chains [8,43]. Information-related barriers, in the form of poor information quality and information flow disruption, are the next focusing barriers for SMEs (Table 10). Especially, information integration is required amid the COVID-19 pandemic for smooth information flow [97]. Poor information flow increases lead time and thereby disrupts the collaborative supply chain during the COVID-19 pandemic [98]. Hence, SME managers need to ensure that the right information is shared among the supply chain partners at the right time consistently. Given that face-to-face interactions are found critical for SMEs in recent studies in the context of COVID-19 [8,9], SME managers need to seek avenues such as site visits and meeting at a colocation to improve such interactions. After working on these barriers, SME practitioners need to emphasize vehicle routing problems. Uncertainty in vehicle availability and increasing routing cost are common barriers during the COVID-19 pandemic [99]. Poor systems connectivity and reluctance to share information are the next focusing barriers for SMEs. In this COVID-19 pandemic, information sharing is a must for SCC [100,101]. After that, SME practitioners should focus on the lack of trust and leadership deficit barriers. Trust issues are crucial during this pandemic [102]. The other SCC barriers should be in limelight according to the rankings. The management approaches to overcome SCC barriers will help to enhance the resilience and sustainability performances of SMEs. In this way, SME practitioners can eradicate the barriers according to their rankings and improve overall supply chain performance.
During this COVID-19 outbreak, collaboration in supply chains has been greatly disrupted. This study will help SME practitioners to build back a resilient supply chain by enhancing SCC practices. Accordingly, a resilient supply chain can positively impact sustainability performances [19]. For example, as lack of communication is the most crucial barrier, SME practitioners should focus on local suppliers and buyers rather than communicating with foreign buyers or suppliers [103]. Besides, flexible communication services and synchronized information systems are great supply chain resilient strategies for achieving SCC [104,105]. Vehicle routing problems will encourage supply chain partners to adopt resilient logistics facilities which will help to improve supply chain recovery. Financial supports from the government and incentives from suppliers will enhance to achieve economic sustainability [106]. Also, overcoming SCC barriers will enhance the supply chain recovery from the impacts of large-scale disruptions such as the COVID-19 pandemic [107]. In this way, the barriers found from the study will encourage SME managers to establish various resilient strategies to attain sustainability.
This study makes several contributions to the existing literature. Several studies emphasized the importance of SCC for maintaining and improving the performance of SMEs [10,11]. However, there is a lack of studies that provided strategic directions on how SMEs can collaborate and what barriers they face in the process of collaboration. This study contributes to the literature on SCC in SMEs by providing the SCC barriers that these firms face in collaborating. Moreover, this study not only identifies the barriers to SCC but also analyzes and prioritizes them using MCDM methods. Besides, it focuses on SMEs of an emerging economy which is scarce at present in the literature. Another notable contribution of the study is that it used the data collected from multiple industries. Since the findings, SCC barriers and their ranking represent a wide variety of industries and these can be considered generalizable to various SME sectors.
6. Conclusions
Approximately 99% of formal business enterprises of Bangladesh are SMEs, which contribute 25 percent to the national GDP. Business decisions are dominated by the globalization of markets and increased competition among firms. To survive in this competitive world, SMEs must cooperate well regarding business structures and supply chain management. Most of the firms of Bangladesh are not aware of potential collaborative networks they could utilize. This paper enables the firms to identify the barriers of collaboration and helps them move past these barriers to improve their resilience and sustainability performances.
We found that lack of communication is the most important SCC barrier that restricts collaboration among firms. The identified barriers such as poor information quality, information flow disruption, and vehicle routing problems also are major barriers. This study extends the literature of supply chain management by developing a decision-modeling framework for analyzing SCC barriers in the context of SMEs of an emerging economy. This study also expands knowledge of MCDM by comparing the results obtained from FBWM and Grey DEMATEL methods. Most empirical data are vague, and decision-makers often feel confused when comparing different barriers. Linguistic variables can remedy this, by providing more reliable and consistent results. Both of the methods we employed contained linguistic scales, triangular fuzzy numbers, and Grey numbers. This helps mitigates ambiguity for decision-makers. Cause-effect relationships plotted in prominence-relation graphs enable managers to readily identify high relation and prominence (intertwined and giver) barriers. Using tools such as these, managers can take proactive measures to overcome SCC barriers and to improve the sustainability and resilience performance in their supply chains.
This research does have limitations. Although we focused on several SME sectors, our sample size is small. More barriers may be included by collecting data from more samples. Moreover, a future study could conduct a cross-sector comparison. Such a study would be valuable as it would provide more in-depth knowledge to understand how SMEs in various industries face challenges in collaboration. Finally, given that each MCDM method has certain shortcomings and benefits, several other methods can be combined to achieve more comprehensive results.
Author Contributions
Conceptualization, P.M., S.K.P.; methodology, P.M., S.K.P., A.A.; formal analysis, P.M.; investigation, A.A.; writing—original draft preparation, P.M., S.K.P., P.C.; writing—review and editing, S.K.P., A.A., P.C.; supervision, A.A.; project administration, S.K.P. All authors have read and agreed to the published version of the manuscript.
Funding
This research received no external funding.
Institutional Review Board Statement
Not applicable.
Informed Consent Statement
Informed consent was obtained from all subjects involved in the study.
Data Availability Statement
Not applicable.
Acknowledgments
This research work was carried out at the Department of Industrial and Production Engineering of Bangladesh University of Engineering and Technology (BUET) under the supervision of Abdullahil Azeem. The authors acknowledge the supports received from the Department of Industrial and Production Engineering of BUET to carry out the research work successfully.
Conflicts of Interest
The authors declare no conflict of interest.
Appendix A
- Q.1.
- Which type of company/department are you working at?
- Q.2.
- What is your designation and experience/role in your company/university?
- Q.3.
- Are the listed supply chain collaboration barriers suitable in the context of SMEs of Bangladesh?
If the barrier is suitable for the lack of supply chain collaboration in the context of the SMEs of Bangladesh, please write Yes and If the barrier is not relevant, please write No. Further, please mention your recommendation about any additional barrier if necessary.

Table A1.
SCC barriers for taking responses from respondents (experts).
| Barriers | Response (Yes/No) | Barriers | Response (Yes/No) |
|---|---|---|---|
| Lack of commitment on quality | - | Cultural difference | - |
| Lack of communication | - | Unwillingness to deal with new firms | - |
| Poor systems connectivity | - | Reluctance to deal with small firms | - |
| Intra-organizational weak relationships | - | Governmental intervention | - |
| Decision desynchronization | - | Vehicle routing problem | - |
| Incentive obstacles | - | Customer taste variations | - |
| Lack of trust | - | Lack of adaptation | - |
| Leadership deficit | - | Different goals | - |
| Territoriality | - | Non-standardized performance metrics | - |
| Lack of commitment on delivery time | - | Demand fluctuations | - |
| Opposition to change | - | Forecasting problem | - |
| Short term relationship | - | Lead time variations | - |
| Pricing obstacles | - | Reluctance to share information | - |
| Lack of Resource sharing | - | Information flow disruption | - |
| Behavioral uncertainty | - | Poor information quality | - |
Appendix B
Q.1 Please select the best (e.g., the most important) and the worst (e.g., the least important) barrier from the main group of barriers.
Select the best/worst criteria by putting tick marks beside the corresponding boxes of your selected barriers. Please select only one barrier as best and another one as worst.
Table A2.
Selection of best and worst barriers.
| Category | Best | Worst | Barrier Name | Best | Worst |
|---|---|---|---|---|---|
| Information related barriers (A) | - | - | Reluctance to share information (A1) | - | - |
| - | - | Information flow disruption (A2) | - | - | |
| - | - | Poor information quality (A3) | - | - | |
| Communication-related barriers (B) | - | - | Lack of communication (B1) | - | - |
| - | - | Poor systems connectivity (B2) | - | - | |
| - | - | Vehicle routing problem (B3) | - | - | |
| Intra-organizational barriers (C) | - | - | Intra-organizational weak relationships (C1) | - | - |
| - | - | Decision desynchronization (C2) | - | - | |
| - | - | Incentive obstacles (C3) | - | - | |
| - | - | Opposition to change (C4) | - | - | |
| - | - | Leadership deficit (C5) | - | - | |
| Inter-organizational barriers (D) | - | - | Lack of trust (D1) | - | - |
| - | - | Short term relationship (D2) | - | - | |
| - | - | Behavioral uncertainty (D3) | - | - | |
| - | - | Cultural difference (D4) | - | - | |
| - | - | Different goals (D5) | - | - | |
| - | - | Non-standardized performance metrics (D6) | - | - | |
| - | - | Lack of commitment on quality (D7) | - | - | |
| - | - | Forecasting problem (D8) | - | - | |
| - | - | Reluctance to deal with small firms (D9) | - | - | |
| - | - | Customer taste variations (D10) | - | - | |
| - | - | Governmental intervention (D11) | - | - | |
| - | - | Lack of commitment on delivery time (D12) | - | - |
Q.2. Please fill up the following comparison vectors by indicating the degree of importance between barriers.
Scales description:
EI: equally important WI: weakly important; FI: fairly important; VI: very important; AI: absolutely important
Table A3.
Scaling of the best category over other categories (best-to-others pairwise comparison vectors).
Table A3.
Scaling of the best category over other categories (best-to-others pairwise comparison vectors).
| Most Important Category | A | B | C | D |
|---|---|---|---|---|
| - | - | - | - | - |
Table A4.
Scaling of other categories over the worst category (others-to-worst pairwise comparison vectors).
Table A4.
Scaling of other categories over the worst category (others-to-worst pairwise comparison vectors).
| Other Categories | Least Important Category |
|---|---|
| A | - |
| B | - |
| C | - |
| D | - |
Table A5.
Scaling of the best barrier over other barriers under Information related barriers (best-to-others pairwise comparison vectors).
Table A5.
Scaling of the best barrier over other barriers under Information related barriers (best-to-others pairwise comparison vectors).
| Most Important Barrier | A1 | A2 | A3 |
|---|---|---|---|
| - | - | - | - |
Table A6.
Scaling of other barriers over the worst barrier under Information related barriers (others-to-worst pairwise comparison vectors).
Table A6.
Scaling of other barriers over the worst barrier under Information related barriers (others-to-worst pairwise comparison vectors).
| Other Barriers | Least Important Barrier |
|---|---|
| A1 | - |
| A2 | - |
| A3 | - |
Table A7.
Scaling of the best barrier over other barriers under Communication-related barriers (best-to-others pairwise comparison vectors).
Table A7.
Scaling of the best barrier over other barriers under Communication-related barriers (best-to-others pairwise comparison vectors).
| Most Important Barrier | B1 | B2 | B3 |
|---|---|---|---|
| - | - | - | - |
Table A8.
Scaling of other barriers over the worst barrier under Communication-related barriers (others-to-worst pairwise comparison vectors).
Table A8.
Scaling of other barriers over the worst barrier under Communication-related barriers (others-to-worst pairwise comparison vectors).
| Other Barriers | Least Important Barrier |
|---|---|
| B1 | - |
| B2 | - |
| B3 | - |
Table A9.
Scaling of the best barrier over other barriers under Intra-organizational barriers (best-to-others pairwise comparison vectors).
Table A9.
Scaling of the best barrier over other barriers under Intra-organizational barriers (best-to-others pairwise comparison vectors).
| Most Important Barrier | C1 | C2 | C3 | C4 | C5 |
|---|---|---|---|---|---|
| - | - | - | - | - | - |
Table A10.
Scaling of other barriers over the worst barrier under Intra-organizational barriers (others-to-worst pairwise comparison vectors).
Table A10.
Scaling of other barriers over the worst barrier under Intra-organizational barriers (others-to-worst pairwise comparison vectors).
| Other Sub Barriers | Least Important Barrier |
|---|---|
| C1 | - |
| C2 | - |
| C3 | - |
| C4 | - |
| C5 | - |
Table A11.
Scaling of the best barrier over other barriers under Inter-organizational barriers (best-to-others pairwise comparison vectors).
Table A11.
Scaling of the best barrier over other barriers under Inter-organizational barriers (best-to-others pairwise comparison vectors).
| Most Important Barrier | D1 | D2 | D3 | D4 | D5 | D6 | D7 | D8 | D9 | D10 | D11 | D12 |
|---|---|---|---|---|---|---|---|---|---|---|---|---|
| - | - | - | - | - | - | - | - | - | - | - | - | - |
Table A12.
Scaling of other barriers over the worst barrier under Inter-organizational barriers (others-to-worst pairwise comparison vectors).
Table A12.
Scaling of other barriers over the worst barrier under Inter-organizational barriers (others-to-worst pairwise comparison vectors).
| Other Barriers | Least Important Barrier | Other Barriers | Least Important Barrier |
|---|---|---|---|
| D1 | - | D7 | - |
| D2 | - | D8 | - |
| D3 | - | D9 | - |
| D4 | - | D10 | - |
| D5 | - | D11 | - |
| D6 | - | D12 | - |
Appendix C
Table A13.
Grey Direct Relation Matrix for the categories by Expert 1.
| Categories | A | B | C | D |
|---|---|---|---|---|
| A | (0, 0) | (0.5, 0.75) | (0.25, 0.5) | (0.5, 0.75) |
| B | (0.75, 1) | (0, 0) | (0.25, 0.5) | (0.75, 1) |
| C | (0.75, 1) | (0.25, 0.5) | (0, 0) | (0.5, 0.75) |
| D | (0, 0.25) | (0.25, 0.5) | (0, 0.25) | (0, 0) |
Table A14.
Grey Direct Relation Matrix for the categories by Expert 2.
| Categories | A | B | C | D |
|---|---|---|---|---|
| A | (0, 0) | (0.5, 0.75) | (0.25, 0.5) | (0.5, 0.75) |
| B | (0.75, 1) | (0, 0) | (0, 0.25) | (0.75, 1) |
| C | (0.75, 1) | (0.25, 0.5) | (0, 0) | (0.5, 0.75) |
| D | (0, 0.25) | (0.25, 0.5) | (0, 0.25) | (0, 0) |
Table A15.
Average Direct Relation Matrix for the categories from 16 experts’ feedback.
| Categories | A | B | C | D |
|---|---|---|---|---|
| A | (0, 0) | (0.5, 0.75) | (0.25, 0.5) | (0.5, 0.75) |
| B | (0.75, 1) | (0, 0) | (0.17, 0.42) | (0.75, 1) |
| C | (0.67, 0.92) | (0.25, 0.5) | (0, 0) | (0.5, 0.75) |
| D | (0, 0.25) | (0.08, 0.33) | (0.25, 0.5) | (0, 0) |
Table A16.
Total Relation Matrix ( ) for the categories.
| Categories | A | B | C | D |
|---|---|---|---|---|
| A | 0.3774 | 0.5627 | 0.3259 | 0.7297 |
| B | 0.7402 | 0.4069 | 0.3332 | 0.9039 |
| C | 0.6940 | 0.5099 | 0.2158 | 0.7671 |
| D | 0.1909 | 0.2650 | 0.1382 | 0.2069 |
Table A17.
Cause/effect parameters and relative weights for the categories and the barriers.
| Categories/ Barriers | Row Sum (ri) | Column Sum (cj) | ri + cj | ri − cj | Relative Degrees of Interactions (Weights), |
|---|---|---|---|---|---|
| A | 1.9957 | 2.0025 | 3.9982 | −0.0068 | 0.2713 |
| B | 2.3843 | 1.7446 | 4.1289 | 0.6397 | 0.2802 |
| C | 2.1868 | 1.0130 | 3.1998 | 1.1738 | 0.2171 |
| D | 0.8010 | 2.6077 | 3.4087 | −1.8067 | 0.2313 |
| A1 | 1.3462 | 1.8101 | 3.1563 | −0.4640 | 0.2750 |
| A2 | 2.3322 | 1.3767 | 3.7089 | 0.9554 | 0.3231 |
| A3 | 2.0612 | 2.5527 | 4.6139 | −0.4915 | 0.4019 |
| B1 | 1.0251 | 1.7454 | 2.7705 | −0.7203 | 0.4280 |
| B2 | 1.1429 | 0.5555 | 1.6983 | 0.5874 | 0.2624 |
| B3 | 1.0683 | 0.9353 | 2.0036 | 0.1329 | 0.3096 |
| C1 | 3.1561 | 2.8595 | 6.0155 | 0.2966 | 0.1919 |
| C2 | 2.7126 | 3.8772 | 6.5897 | −1.1646 | 0.2102 |
| C3 | 2.8179 | 2.4461 | 5.2640 | 0.3718 | 0.1679 |
| C4 | 3.5270 | 2.5852 | 6.1122 | 0.9419 | 0.1950 |
| C5 | 3.4583 | 3.9039 | 7.3622 | −0.4457 | 0.2349 |
| D1 | 2.2816 | 1.4578 | 3.7394 | 0.8239 | 0.1190 |
| D2 | 1.4501 | 1.8484 | 3.2985 | −0.3983 | 0.1050 |
| D3 | 1.4598 | 1.5173 | 2.9771 | −0.0575 | 0.0948 |
| D4 | 1.5572 | 1.2430 | 2.8002 | 0.3142 | 0.0891 |
| D5 | 1.3606 | 1.8658 | 3.2265 | −0.5052 | 0.1027 |
| D6 | 0.5717 | 0.6114 | 1.1831 | −0.0397 | 0.0377 |
| D7 | 0.9721 | 1.9073 | 2.8794 | −0.9352 | 0.0917 |
| D8 | 1.1404 | 0.4096 | 1.5501 | 0.7308 | 0.0493 |
| D9 | 1.2506 | 1.4221 | 2.6727 | −0.1715 | 0.0851 |
| D10 | 0.2652 | 1.1497 | 1.4149 | −0.8846 | 0.0450 |
| D11 | 1.6456 | 0.6482 | 2.2938 | 0.9973 | 0.0730 |
| D12 | 1.7511 | 1.6253 | 3.3764 | 0.1258 | 0.1075 |
Appendix D
Table A18.
Weights assigned for experts during sensitivity analysis.
| Scenarios | Expert No. | |||||||||||||||
|---|---|---|---|---|---|---|---|---|---|---|---|---|---|---|---|---|
| 1 | 2 | 3 | 4 | 5 | 6 | 7 | 8 | 9 | 10 | 11 | 12 | 13 | 14 | 15 | 16 | |
| 1 | 0.1 | 0.06 | 0.06 | 0.06 | 0.06 | 0.06 | 0.06 | 0.06 | 0.06 | 0.06 | 0.06 | 0.06 | 0.06 | 0.06 | 0.06 | 0.06 |
| 2 | 0.06 | 0.1 | 0.06 | 0.06 | 0.06 | 0.06 | 0.06 | 0.06 | 0.06 | 0.06 | 0.06 | 0.06 | 0.06 | 0.06 | 0.06 | 0.06 |
| 3 | 0.06 | 0.06 | 0.1 | 0.06 | 0.06 | 0.06 | 0.06 | 0.06 | 0.06 | 0.06 | 0.06 | 0.06 | 0.06 | 0.06 | 0.06 | 0.06 |
| 4 | 0.06 | 0.06 | 0.06 | 0.1 | 0.06 | 0.06 | 0.06 | 0.06 | 0.06 | 0.06 | 0.06 | 0.06 | 0.06 | 0.06 | 0.06 | 0.06 |
| 5 | 0.06 | 0.06 | 0.06 | 0.06 | 0.1 | 0.06 | 0.06 | 0.06 | 0.06 | 0.06 | 0.06 | 0.06 | 0.06 | 0.06 | 0.06 | 0.06 |
| 6 | 0.06 | 0.06 | 0.06 | 0.06 | 0.06 | 0.1 | 0.06 | 0.06 | 0.06 | 0.06 | 0.06 | 0.06 | 0.06 | 0.06 | 0.06 | 0.06 |
| 7 | 0.06 | 0.06 | 0.06 | 0.06 | 0.06 | 0.06 | 0.1 | 0.06 | 0.06 | 0.06 | 0.06 | 0.06 | 0.06 | 0.06 | 0.06 | 0.06 |
| 8 | 0.06 | 0.06 | 0.06 | 0.06 | 0.06 | 0.06 | 0.06 | 0.1 | 0.06 | 0.06 | 0.06 | 0.06 | 0.06 | 0.06 | 0.06 | 0.06 |
| 9 | 0.06 | 0.06 | 0.06 | 0.06 | 0.06 | 0.06 | 0.06 | 0.06 | 0.1 | 0.06 | 0.06 | 0.06 | 0.06 | 0.06 | 0.06 | 0.06 |
| 10 | 0.06 | 0.06 | 0.06 | 0.06 | 0.06 | 0.06 | 0.06 | 0.06 | 0.06 | 0.1 | 0.06 | 0.06 | 0.06 | 0.06 | 0.06 | 0.06 |
| 11 | 0.06 | 0.06 | 0.06 | 0.06 | 0.06 | 0.06 | 0.06 | 0.06 | 0.06 | 0.06 | 0.1 | 0.06 | 0.06 | 0.06 | 0.06 | 0.06 |
| 12 | 0.06 | 0.06 | 0.06 | 0.06 | 0.06 | 0.06 | 0.06 | 0.06 | 0.06 | 0.06 | 0.06 | 0.1 | 0.06 | 0.06 | 0.06 | 0.06 |
| 13 | 0.06 | 0.06 | 0.06 | 0.06 | 0.06 | 0.06 | 0.06 | 0.06 | 0.06 | 0.06 | 0.06 | 0.06 | 0.1 | 0.06 | 0.06 | 0.06 |
| 14 | 0.06 | 0.06 | 0.06 | 0.06 | 0.06 | 0.06 | 0.06 | 0.06 | 0.06 | 0.06 | 0.06 | 0.06 | 0.06 | 0.1 | 0.06 | 0.06 |
| 15 | 0.06 | 0.06 | 0.06 | 0.06 | 0.06 | 0.06 | 0.06 | 0.06 | 0.06 | 0.06 | 0.06 | 0.06 | 0.06 | 0.06 | 0.1 | 0.06 |
| 16 | 0.06 | 0.06 | 0.06 | 0.06 | 0.06 | 0.06 | 0.06 | 0.06 | 0.06 | 0.06 | 0.06 | 0.06 | 0.06 | 0.06 | 0.06 | 0.1 |
Table A19.
Ranking of barriers of supply chain collaboration during sensitivity analysis for Grey DEMATEL method.
Table A19.
Ranking of barriers of supply chain collaboration during sensitivity analysis for Grey DEMATEL method.
| Barriers | Scenarios | ||||||||||||||||
|---|---|---|---|---|---|---|---|---|---|---|---|---|---|---|---|---|---|
| Normal | 1 | 2 | 3 | 4 | 5 | 6 | 7 | 8 | 9 | 10 | 11 | 12 | 13 | 14 | 15 | 16 | |
| A1 | 5 | 5 | 5 | 6 | 5 | 5 | 6 | 5 | 5 | 5 | 6 | 6 | 5 | 5 | 5 | 5 | 5 |
| A2 | 3 | 3 | 3 | 3 | 4 | 3 | 4 | 3 | 4 | 4 | 3 | 3 | 3 | 3 | 3 | 4 | 3 |
| A3 | 2 | 2 | 2 | 2 | 2 | 2 | 2 | 2 | 2 | 2 | 2 | 2 | 2 | 2 | 2 | 2 | 2 |
| B1 | 1 | 1 | 1 | 1 | 1 | 1 | 1 | 1 | 1 | 1 | 1 | 1 | 1 | 1 | 1 | 1 | 1 |
| B2 | 6 | 6 | 6 | 5 | 6 | 6 | 5 | 6 | 6 | 6 | 5 | 5 | 6 | 6 | 6 | 6 | 6 |
| B3 | 4 | 4 | 4 | 4 | 3 | 4 | 3 | 4 | 3 | 3 | 4 | 4 | 4 | 4 | 4 | 3 | 4 |
| C1 | 10 | 10 | 9 | 10 | 10 | 10 | 10 | 10 | 9 | 10 | 10 | 10 | 10 | 10 | 10 | 10 | 10 |
| C2 | 8 | 8 | 8 | 8 | 8 | 8 | 8 | 8 | 8 | 8 | 8 | 8 | 8 | 8 | 8 | 8 | 8 |
| C3 | 11 | 11 | 11 | 11 | 11 | 11 | 11 | 11 | 11 | 11 | 11 | 11 | 11 | 11 | 11 | 11 | 11 |
| C4 | 9 | 9 | 9 | 9 | 9 | 9 | 9 | 9 | 10 | 9 | 9 | 9 | 9 | 9 | 9 | 9 | 9 |
| C5 | 7 | 7 | 7 | 7 | 7 | 7 | 7 | 7 | 7 | 7 | 7 | 7 | 7 | 7 | 7 | 7 | 7 |
| D1 | 12 | 12 | 12 | 12 | 12 | 12 | 12 | 12 | 12 | 12 | 12 | 12 | 12 | 12 | 12 | 12 | 12 |
| D2 | 14 | 14 | 14 | 14 | 14 | 14 | 14 | 14 | 14 | 14 | 14 | 14 | 14 | 14 | 14 | 14 | 14 |
| D3 | 16 | 16 | 16 | 16 | 16 | 16 | 16 | 16 | 16 | 16 | 16 | 16 | 16 | 16 | 16 | 16 | 16 |
| D4 | 18 | 18 | 18 | 18 | 18 | 18 | 18 | 18 | 18 | 18 | 18 | 18 | 18 | 18 | 18 | 18 | 18 |
| D5 | 15 | 15 | 15 | 15 | 15 | 15 | 15 | 15 | 15 | 15 | 15 | 15 | 15 | 15 | 15 | 15 | 15 |
| D6 | 23 | 23 | 23 | 23 | 23 | 23 | 23 | 23 | 23 | 23 | 23 | 23 | 23 | 23 | 23 | 23 | 23 |
| D7 | 17 | 17 | 17 | 17 | 17 | 17 | 17 | 17 | 17 | 17 | 17 | 17 | 17 | 17 | 17 | 17 | 17 |
| D8 | 21 | 21 | 21 | 21 | 21 | 21 | 21 | 21 | 21 | 21 | 21 | 21 | 21 | 21 | 21 | 21 | 21 |
| D9 | 19 | 19 | 19 | 19 | 19 | 19 | 19 | 19 | 19 | 19 | 19 | 19 | 19 | 19 | 19 | 19 | 19 |
| D10 | 22 | 22 | 22 | 22 | 22 | 21 | 22 | 22 | 22 | 22 | 22 | 22 | 22 | 22 | 22 | 22 | 22 |
| D11 | 20 | 20 | 20 | 20 | 20 | 20 | 20 | 20 | 20 | 20 | 20 | 20 | 20 | 20 | 20 | 20 | 20 |
| D12 | 13 | 13 | 13 | 13 | 13 | 13 | 13 | 13 | 13 | 13 | 13 | 13 | 13 | 13 | 13 | 13 | 13 |
Table A20.
Ranking of barriers of supply chain collaboration during sensitivity analysis for Fuzzy Best-Worst method.
Table A20.
Ranking of barriers of supply chain collaboration during sensitivity analysis for Fuzzy Best-Worst method.
| Barriers | Changing Weights of “Lack of Communication (B1)” | |||||||||
|---|---|---|---|---|---|---|---|---|---|---|
| Normal | 0.1 | 0.2 | 0.3 | 0.4 | 0.5 | 0.6 | 0.7 | 0.8 | 0.9 | |
| A1 | 6 | 5 | 6 | 6 | 6 | 6 | 6 | 5 | 4 | 4 |
| A2 | 3 | 4 | 3 | 3 | 4 | 3 | 3 | 3 | 3 | 3 |
| A3 | 2 | 2 | 2 | 1 | 1 | 2 | 2 | 2 | 2 | 2 |
| B1 | 1 | 6 | 5 | 4 | 2 | 1 | 1 | 1 | 1 | 1 |
| B2 | 5 | 3 | 4 | 5 | 5 | 5 | 5 | 6 | 7 | 15 |
| B3 | 4 | 1 | 1 | 2 | 3 | 4 | 4 | 4 | 5 | 12 |
| C1 | 17 | 17 | 17 | 17 | 17 | 17 | 17 | 17 | 17 | 17 |
| C2 | 15 | 15 | 15 | 15 | 15 | 15 | 15 | 15 | 15 | 14 |
| C3 | 23 | 23 | 23 | 23 | 23 | 23 | 23 | 23 | 23 | 23 |
| C4 | 16 | 16 | 16 | 16 | 16 | 16 | 16 | 16 | 16 | 16 |
| C5 | 8 | 8 | 8 | 8 | 8 | 8 | 8 | 8 | 8 | 6 |
| D1 | 7 | 7 | 7 | 7 | 7 | 7 | 7 | 7 | 6 | 5 |
| D2 | 10 | 10 | 10 | 10 | 10 | 10 | 10 | 10 | 10 | 8 |
| D3 | 12 | 12 | 12 | 12 | 12 | 12 | 12 | 12 | 12 | 10 |
| D4 | 14 | 14 | 14 | 14 | 14 | 14 | 14 | 14 | 14 | 13 |
| D5 | 10 | 10 | 10 | 10 | 10 | 10 | 10 | 10 | 10 | 8 |
| D6 | 22 | 22 | 22 | 22 | 22 | 22 | 22 | 22 | 22 | 22 |
| D7 | 13 | 13 | 13 | 13 | 13 | 13 | 13 | 13 | 13 | 11 |
| D8 | 20 | 20 | 20 | 20 | 20 | 20 | 20 | 20 | 20 | 20 |
| D9 | 18 | 18 | 18 | 18 | 18 | 18 | 18 | 18 | 18 | 18 |
| D10 | 20 | 20 | 20 | 20 | 20 | 20 | 20 | 20 | 20 | 20 |
| D11 | 18 | 18 | 18 | 18 | 18 | 18 | 18 | 18 | 18 | 18 |
| D12 | 9 | 9 | 9 | 9 | 9 | 9 | 9 | 9 | 9 | 7 |
References
- Chopra, S.; Meindl, P.; Kalra, D.V. Supply Chain Management: Strategy, Planning, and Operation; Pearson: Boston, MA, USA, 2013. [Google Scholar]
- Liao, S.-H.; Hu, D.-C.; Ding, L.-W. Assessing the influence of supply chain collaboration value innovation, supply chain capability and competitive advantage in Taiwan’s networking communication industry. Int. J. Prod. Econ. 2017, 191, 143–153. [Google Scholar] [CrossRef]
- Whipple, J.M.; Russell, D. Building supply chain collaboration: A typology of collaborative approaches. Int. J. Logist. Manag. 2007, 18, 174–196. [Google Scholar] [CrossRef]
- Allaoui, H.; Guo, Y.; Sarkis, J. Decision support for collaboration planning in sustainable supply chains. J. Clean. Prod. 2019, 229, 761–774. [Google Scholar] [CrossRef]
- Zhang, Q.; Cao, M. Exploring antecedents of supply chain collaboration: Effects of culture and interorganizational system appropriation. Int. J. Prod. Econ. 2018, 195, 146–157. [Google Scholar] [CrossRef]
- Hudnurkar, M.; Jakhar, S.; Rathod, U. Factors Affecting Collaboration in Supply Chain: A Literature Review. Procedia Soc. Behav. Sci. 2014, 133, 189–202. [Google Scholar] [CrossRef] [Green Version]
- Gumboh, J.; Gichira, R. Supply Chain Collaboration among SMEs in Kenya: A Review of Collaboration Barriers. Int. J. Humanit. Soc. Sci. 2015, 5, 223–229. [Google Scholar]
- Chowdhury, P.; Paul, S.K.; Kaisar, S.; Moktadir, M.A. COVID-19 pandemic related supply chain studies: A systematic review. Transp. Res. Part. E Logist. Transp. Rev. 2021, 148, 102271. [Google Scholar] [CrossRef]
- Wen, W.; Yang, S.; Zhou, P.; Gao, S. Impacts of COVID-19 on the electric vehicle industry: Evidence from China. Renew. Sustain. Energy Rev. 2021, 144, 111024. [Google Scholar] [CrossRef]
- Eyaa, S.; Ntayi, J.M.; Namagembe, S. Collaborative relationships and SME supply chain performance. World J. Entrep. Manag. Sustain. Dev. 2010, 6, 233–245. [Google Scholar] [CrossRef]
- Haji-Pakir, M.I.; Alina, S. Level of supply chain collaboration of Malaysian SME manufacturers. In Proceedings of the 2010 IEEE International Conference on Management of Innovation & Technology, Singapore, 2–5 June 2010; Institute of Electrical and Electronics Engineers (IEEE): Piscataway, NJ, USA, 2010; pp. 169–174. [Google Scholar]
- Roy, S.; Das, M.; Ali, S.M.; Raihan, A.S.; Paul, S.K.; Kabir, G. Evaluating strategies for environmental sustainability in a supply chain of an emerging economy. J. Clean. Prod. 2020, 262, 121389. [Google Scholar] [CrossRef]
- Acma, M.Q. Productivity and performance evaluation of SME sector in Bangladesh: Evidence from the historical data. J. Islam. Financ. Bus. Res. 2015, 3, 14–22. [Google Scholar]
- Abdin, M.J. Development of SMEs: Replicating Top Foreign Models. Dev. SMEs Replicating Top Foreign Model. 2014. [Google Scholar] [CrossRef]
- Uddin, M.T. A Study on Financing of SMEs in Bangladesh. J. Econ. Sustain. Dev. 2014, 5, 161–168. [Google Scholar]
- Appolloni, A.; Colasanti, N.; Fantauzzi, C.; Fiorani, G.; Frondizi, R. Distance Learning as a Resilience Strategy during Covid-19: An Analysis of the Italian Context. Sustainability 2021, 13, 1388. [Google Scholar] [CrossRef]
- D’Adamo, I.; Rosa, P. How Do You See Infrastructure? Green Energy to Provide Economic Growth after COVID-19. Sustainability 2020, 12, 4738. [Google Scholar] [CrossRef]
- Miceli, A.; Hagen, B.; Riccardi, M.P.; Sotti, F.; Settembre-Blundo, D. Thriving, Not Just Surviving in Changing Times: How Sustainability, Agility and Digitalization Intertwine with Organizational Resilience. Sustainability 2021, 13, 2052. [Google Scholar] [CrossRef]
- D’Adamo, I.; Lupi, G. Sustainability and Resilience after COVID-19: A Circular Premium in the Fashion Industry. Sustainability 2021, 13, 1861. [Google Scholar] [CrossRef]
- Barratt, M. Understanding the meaning of collaboration in the supply chain. Supply Chain Manag. Int. J. 2004, 9, 30–42. [Google Scholar] [CrossRef]
- Fan, Y.; Stevenson, M.; Li, F. Supplier-initiating risk management behaviour and supply-side resilience: The effects of interpersonal relationships and dependence asymmetry in buyer-supplier relationships. Int. J. Oper. Prod. Manag. 2020, 40, 971–995. [Google Scholar] [CrossRef]
- Prajogo, D.; Olhager, J. Supply chain integration and performance: The effects of long-term relationships, information technology and sharing, and logistics integration. Int. J. Prod. Econ. 2012, 135, 514–522. [Google Scholar] [CrossRef]
- Anbanandam, R.; Banwet, D.K.; Shankar, R. Evaluation of supply chain collaboration: A case of apparel retail industry in India. Int. J. Product. Perform. Manag. 2011, 60, 82–98. [Google Scholar] [CrossRef]
- Bahinipati, B.K.; Kanda, A.; Deshmukh, S. Horizontal collaboration in semiconductor manufacturing industry supply chain: An evaluation of collaboration intensity index. Comput. Ind. Eng. 2009, 57, 880–895. [Google Scholar] [CrossRef]
- Cai, Y.-J.; Choi, T.-M. A United Nations’ Sustainable Development Goals perspective for sustainable textile and apparel supply chain management. Transp. Res. Part. E Logist. Transp. Rev. 2020, 141, 102010. [Google Scholar] [CrossRef]
- Kumar, R.; Singh, R.K. Coordination and responsiveness issues in SME supply chains: A review. Benchmarking Int. J. 2017, 24, 635–650. [Google Scholar] [CrossRef]
- Hong, P.; Jeong, J. Supply chain management practices of SMEs: From a business growth perspective. J. Enterp. Inf. Manag. 2006, 19, 292–302. [Google Scholar] [CrossRef]
- Zhou, H.; Li, L. The impact of supply chain practices and quality management on firm performance: Evidence from China’s small and medium manufacturing enterprises. Int. J. Prod. Econ. 2020, 230, 107816. [Google Scholar] [CrossRef]
- Quayle, M. A study of supply chain management practice in UK industrial SMEs. Supply Chain Manag. Int. J. 2003, 8, 79–86. [Google Scholar] [CrossRef]
- Huo, B.; Zhang, C.; Zhao, X. The effect of IT and relationship commitment on supply chain coordination: A contingency and configuration approach. Inf. Manag. 2015, 52, 728–740. [Google Scholar] [CrossRef]
- Gunasekaran, A.; Subramanian, N.; Papadopoulos, T. Information technology for competitive advantage within logistics and supply chains: A review. Transp. Res. Part. E Logist. Transp. Rev. 2017, 99, 14–33. [Google Scholar] [CrossRef]
- Lotfi, Z.; Mukhtar, M.; Sahran, S.; Zadeh, A.T. Information Sharing in Supply Chain Management. Procedia Technol. 2013, 11, 298–304. [Google Scholar] [CrossRef] [Green Version]
- Jiang, Q.; Ke, G. Information sharing and bullwhip effect in smart destination network system. Ad Hoc Networks 2019, 87, 17–25. [Google Scholar] [CrossRef]
- Kumar, G.; Banerjee, R.N. Supply chain collaboration index: An instrument to measure the depth of collaboration. Benchmarking Int. J. 2014, 21, 184–204. [Google Scholar] [CrossRef]
- Simatupang, T.M.; Sridharan, R. The collaboration index: A measure for supply chain collaboration. Int. J. Phys. Distrib. Logist. Manag. 2005, 35, 44–62. [Google Scholar] [CrossRef]
- Cai, S.; Jun, M.; Yang, Z. Implementing supply chain information integration in China: The role of institutional forces and trust. J. Oper. Manag. 2009, 28, 257–268. [Google Scholar] [CrossRef]
- Chen, J.V.; Yen, D.C.; Rajkumar, T.; Tomochko, N.A. The antecedent factors on trust and commitment in supply chain relationships. Comput. Stand. Interfaces 2011, 33, 262–270. [Google Scholar] [CrossRef]
- Linton, J.D. Open innovation/integration versus disintermediation/disintegration. Technovation 2018, 78, 1–3. [Google Scholar] [CrossRef]
- Forslund, H.; Jonsson, P. Obstacles to supply chain integration of the performance management process in buyer-supplier dyads. Int. J. Oper. Prod. Manag. 2009, 29, 77–95. [Google Scholar] [CrossRef] [Green Version]
- Tareq, S.; Rahman, T.; Hossain, M.; Dorrington, P. Additive manufacturing and the COVID-19 challenges: An in-depth study. J. Manuf. Syst. 2021. [Google Scholar] [CrossRef]
- Wang, X.V.; Wang, L. A literature survey of the robotic technologies during the COVID-19 pandemic. J. Manuf. Syst. 2021. [Google Scholar] [CrossRef] [PubMed]
- Mzougui, I.; Carpitella, S.; Certa, A.; El Felsoufi, Z.; Izquierdo, J. Assessing Supply Chain Risks in the Automotive Industry through a Modified MCDM-Based FMECA. Processes 2020, 8, 579. [Google Scholar] [CrossRef]
- Ilyas, M.; Carpitella, S.; Zoubir, E. Designing supplier selection strategies under COVID-19 constraints for industrial environments. Procedia CIRP 2021, 100, 589–594. [Google Scholar] [CrossRef]
- Butt, A.S. Guanxi and intra-organizational conflicts: Evidence from Chinese logistics industry. Manag. Res. Rev. 2019, 42, 495–505. [Google Scholar] [CrossRef]
- Taqi, H.M.M.; Ahmed, H.N.; Paul, S.; Garshasbi, M.; Ali, S.M.; Kabir, G.; Paul, S.K. Strategies to Manage the Impacts of the COVID-19 Pandemic in the Supply Chain: Implications for Improving Economic and Social Sustainability. Sustainability 2020, 12, 9483. [Google Scholar] [CrossRef]
- Fawcett, S.E.; McCarter, M.W.; Fawcett, A.M.; Webb, G.S.; Magnan, G.M. Why supply chain collaboration fails: The socio-structural view of resistance to relational strategies. Supply Chain Manag. Int. J. 2015, 20, 648–663. [Google Scholar] [CrossRef] [Green Version]
- Kwon, I.G.; Louis, S.; Louis, S. Factors Affecting the Level of Trust and Commitment in Supply Chain Relationships. J. Supply Chain Manag. 2004, 40, 4–14. [Google Scholar] [CrossRef]
- Hou, Y.; Wang, X.; Wu, Y.J.; He, P. How does the trust affect the topology of supply chain network and its resilience? An agent-based approach. Transp. Res. Part. E Logist. Transp. Rev. 2018, 116, 229–241. [Google Scholar] [CrossRef]
- Paul, S.K.; Sarker, R.; Essam, D. Managing risk and disruption in production-inventory and supply chain systems: A review. J. Ind. Manag. Optim. 2015, 12, 1009–1029. [Google Scholar] [CrossRef] [Green Version]
- Ramanathan, U.; Gunasekaran, A. Supply chain collaboration: Impact of success in long-term partnerships. Int. J. Prod. Econ. 2014, 147, 252–259. [Google Scholar] [CrossRef]
- Wu, L.; Chiu, M.-L. Examining supply chain collaboration with determinants and performance impact: Social capital, justice, and technology use perspectives. Int. J. Inf. Manag. 2018, 39, 5–19. [Google Scholar] [CrossRef]
- Shaw, S.; Grant, D.B.; Mangan, J. A supply chain practice-based view of enablers, inhibitors and benefits for environmental supply chain performance measurement. Prod. Plan. Control. 2021, 32, 382–396. [Google Scholar] [CrossRef]
- Weible, C.M.; Nohrstedt, D.; Cairney, P.; Carter, D.; Crow, D.A.; Durnová, A.P.; Heikkila, T.; Ingold, K.; McConnell, A.; Stone, D. COVID-19 and the policy sciences: Initial reactions and perspectives. Policy Sci. 2020, 53, 225–241. [Google Scholar] [CrossRef] [Green Version]
- Lee, H.L.; Padmanabhan, V.; Whang, S. The bullwhip effect in supply chains. Sloan Manag. Rev. 1997, 38, 93–102. [Google Scholar] [CrossRef]
- Fynes, B.; Voss, C.; de Búrca, S. The impact of supply chain relationship quality on quality performance. Int. J. Prod. Econ. 2005, 96, 339–354. [Google Scholar] [CrossRef]
- Walter, A. Relationship-specific factors influencing supplier involvement in customer new product development. J. Bus. Res. 2003, 56, 721–733. [Google Scholar] [CrossRef]
- Tan, E.N.; Smith, G.; Saad, M. Managing the global supply chain: A SME perspective. Prod. Plan. Control 2006, 17, 238–246. [Google Scholar] [CrossRef]
- Bai, C.; Sarkis, J. Honoring complexity in sustainable supply chain research: A rough set theoretic approach (SI: ResMeth). Prod. Plan. Control 2018, 29, 1367–1384. [Google Scholar] [CrossRef]
- Vardopoulos, I. Critical sustainable development factors in the adaptive reuse of urban industrial buildings. A fuzzy DEMATEL approach. Sustain. Cities Soc. 2019, 50, 101684. [Google Scholar] [CrossRef]
- Ozkan-Ozen, Y.D.; Kazancoglu, Y.; Mangla, S.K. Synchronized barriers for circular supply chains in industry 3.5/industry 4.0 transition for sustainable resource management. Resour. Conserv. Recycl. 2020, 161, 104986. [Google Scholar] [CrossRef]
- Sirisawat, P.; Kiatcharoenpol, T. Fuzzy AHP-TOPSIS approaches to prioritizing solutions for reverse logistics barriers. Comput. Ind. Eng. 2018, 117, 303–318. [Google Scholar] [CrossRef]
- Singh, S.; Misra, S.C.; Kumar, S. Identification and ranking of the risk factors involved in PLM implementation. Int. J. Prod. Econ. 2020, 222, 107496. [Google Scholar] [CrossRef]
- Moktadir, M.A.; Ali, S.M.; Rajesh, R.; Paul, S.K. Modeling the interrelationships among barriers to sustainable supply chain management in leather industry. J. Clean. Prod. 2018, 181, 631–651. [Google Scholar] [CrossRef]
- Moktadir, A.; Ali, S.M.; Kusi-Sarpong, S.; Shaikh, A.A. Assessing challenges for implementing Industry 4.0: Implications for process safety and environmental protection. Process. Saf. Environ. Prot. 2018, 117, 730–741. [Google Scholar] [CrossRef]
- Kumar, A.; Dixit, G. An analysis of barriers affecting the implementation of e-waste management practices in India: A novel ISM-DEMATEL approach. Sustain. Prod. Consum. 2018, 14, 36–52. [Google Scholar] [CrossRef]
- Kiliç, B.; Ucler, C. Stress among ab-initio pilots: A model of contributing factors by AHP. J. Air Transp. Manag. 2019, 80, 101–106. [Google Scholar] [CrossRef]
- Gupta, H.; Barua, M.K. A framework to overcome barriers to green innovation in SMEs using BWM and Fuzzy TOPSIS. Sci. Total. Environ. 2018, 633, 122–139. [Google Scholar] [CrossRef]
- Gandhi, N.S.; Thanki, S.J.; Thakkar, J.J. Ranking of drivers for integrated lean-green manufacturing for Indian manufacturing SMEs. J. Clean. Prod. 2018, 171, 675–689. [Google Scholar] [CrossRef]
- Chakraborty, K.; Mondal, S.; Mukherjee, K. Critical analysis of enablers and barriers in extension of useful life of automotive products through remanufacturing. J. Clean. Prod. 2019, 227, 1117–1135. [Google Scholar] [CrossRef]
- Kamble, S.S.; Gunasekaran, A.; Parekh, H.; Joshi, S. Modeling the internet of things adoption barriers in food retail supply chains. J. Retail. Consum. Serv. 2019, 48, 154–168. [Google Scholar] [CrossRef]
- Kumar, A.; Dixit, G. Evaluating critical barriers to implementation of WEEE management using DEMATEL approach. Resour. Conserv. Recycl. 2018, 131, 101–121. [Google Scholar] [CrossRef]
- Nilashi, M.; Samad, S.; Manaf, A.A.; Ahmadi, H.; Rashid, T.A.; Munshi, A.; Almukadi, W.; Ibrahim, O.; Ahmed, O.H. Factors influencing medical tourism adoption in Malaysia: A DEMATEL-Fuzzy TOPSIS approach. Comput. Ind. Eng. 2019, 137, 106005. [Google Scholar] [CrossRef]
- Xia, X.; Govindan, K.; Zhu, Q. Analyzing internal barriers for automotive parts remanufacturers in China using grey-DEMATEL approach. J. Clean. Prod. 2015, 87, 811–825. [Google Scholar] [CrossRef]
- Sharma, S.K.; Singh, R.; Matai, R. Force field analysis of Indian automotive strategic sourcing risk management enablers and barriers. Meas. Bus. Excel. 2018, 22, 258–275. [Google Scholar] [CrossRef]
- Ren, J.; Tan, S.; Goodsite, M.; Sovacool, B.; Dong, L. Sustainability, shale gas, and energy transition in China: Assessing barriers and prioritizing strategic measures. Energy 2015, 84, 551–562. [Google Scholar] [CrossRef]
- Dixit, A.; Routroy, S.; Dubey, S.K. A systematic literature review of healthcare supply chain and implications of future research. Int. J. Pharm. Health Mark. 2019, 13, 405–435. [Google Scholar] [CrossRef]
- Lind, L.; Pirttilä, M.; Viskari, S.; Schupp, F.; Kärri, T. Working capital management in the automotive industry: Financial value chain analysis. J. Purch. Supply Manag. 2012, 18, 92–100. [Google Scholar] [CrossRef]
- Omrani, H.; Alizadeh, A.; Emrouznejad, A. Finding the optimal combination of power plants alternatives: A multi response Taguchi-neural network using TOPSIS and fuzzy best-worst method. J. Clean. Prod. 2018, 203, 210–223. [Google Scholar] [CrossRef] [Green Version]
- Liao, H.; Mi, X.; Yu, Q.; Luo, L. Hospital performance evaluation by a hesitant fuzzy linguistic best worst method with inconsistency repairing. J. Clean. Prod. 2019, 232, 657–671. [Google Scholar] [CrossRef]
- Sahebi, I.G.; Arab, A.; Moghadam, M.R.S. Analyzing the barriers to humanitarian supply chain management: A case study of the Tehran Red Crescent Societies. Int. J. Disaster Risk Reduct. 2017, 24, 232–241. [Google Scholar] [CrossRef]
- Wu, Q.; Zhou, L.; Chen, Y.; Chen, H. An integrated approach to green supplier selection based on the interval type-2 fuzzy best-worst and extended VIKOR methods. Inf. Sci. 2019, 502, 394–417. [Google Scholar] [CrossRef]
- Ansari, Z.N.; Kant, R.; Shankar, R. Prioritizing the performance outcomes due to adoption of critical success factors of supply chain remanufacturing. J. Clean. Prod. 2019, 212, 779–799. [Google Scholar] [CrossRef]
- De Silva, U.S.K.; Paul, A.; Paul, S.K.; Ali, S.M.; Chakrabortty, R.K. Examining risks and strategies for the spice processing supply chain in the context of an emerging economy. Int. J. Emerg. Mark. 2021, 1–23, in press. [Google Scholar] [CrossRef]
- Ansari, Z.N.; Kant, R.; Shankar, R. Evaluation and ranking of solutions to mitigate sustainable remanufacturing supply chain risks: A hybrid fuzzy SWARA-fuzzy COPRAS framework approach. Int. J. Sustain. Eng. 2020, 13, 473–494. [Google Scholar] [CrossRef]
- Garg, C.P.; Kashav, V. Evaluating value creating factors in greening the transportation of Global Maritime Supply Chains (GMSCs) of containerized freight. Transp. Res. Part. D Transp. Environ. 2019, 73, 162–186. [Google Scholar] [CrossRef]
- Ghimire, L.P.; Kim, Y. An analysis on barriers to renewable energy development in the context of Nepal using AHP. Renew. Energy 2018, 129, 446–456. [Google Scholar] [CrossRef]
- Khan, A.A.; Shameem, M.; Kumar, R.R.; Hussain, S.; Yan, X. Fuzzy AHP based prioritization and taxonomy of software process improvement success factors in global software development. Appl. Soft Comput. 2019, 83, 105–148. [Google Scholar] [CrossRef]
- Saivaew, N.; Butdee, S. Decision making for effective assembly machined parts selection using fuzzy AHP and fuzzy logic. Mater. Today Proc. 2020, 26, 2265–2271. [Google Scholar] [CrossRef]
- Guo, S.; Zhao, H. Fuzzy best-worst multi-criteria decision-making method and its applications. Knowl. Based Syst. 2017, 121, 23–31. [Google Scholar] [CrossRef]
- Raj, A.; Sah, B. Analyzing critical success factors for implementation of drones in the logistics sector using grey-DEMATEL based approach. Comput. Ind. Eng. 2019, 138, 106118. [Google Scholar] [CrossRef]
- Si, S.-L.; You, X.-Y.; Liu, H.-C.; Zhang, P. DEMATEL Technique: A Systematic Review of the State-of-the-Art Literature on Methodologies and Applications. Math. Probl. Eng. 2018, 2018, 1–33. [Google Scholar] [CrossRef] [Green Version]
- Fu, X.; Zhu, Q.; Sarkis, J. Evaluating green supplier development programs at a telecommunications systems provider. Int. J. Prod. Econ. 2012, 140, 357–367. [Google Scholar] [CrossRef]
- Hwang, W.; Hsiao, B.; Chen, H.-G.; Chern, C.-C. Multiphase Assessment of Project Risk Interdependencies: Evidence from a University ISD Project in Taiwan. Proj. Manag. J. 2016, 47, 59–75. [Google Scholar] [CrossRef]
- Mangla, S.K.; Kumar, P.; Barua, M.K. An integrated methodology of FTA and fuzzy AHP for risk assessment in green supply chain. Int. J. Oper. Res. 2016, 25, 77. [Google Scholar] [CrossRef] [Green Version]
- Prakash, C.; Barua, M.K. Integration of AHP-TOPSIS method for prioritizing the solutions of reverse logistics adoption to overcome its barriers under fuzzy environment. J. Manuf. Syst. 2015, 37, 599–615. [Google Scholar] [CrossRef]
- Rajesh, R.; Ravi, V. Modeling enablers of supply chain risk mitigation in electronic supply chains: A Grey–DEMATEL approach. Comput. Ind. Eng. 2015, 87, 126–139. [Google Scholar] [CrossRef]
- Yin, S.; Zhang, N.; Dong, H. Preventing COVID-19 from the perspective of industrial information integration: Evaluation and continuous improvement of information networks for sustainable epidemic prevention. J. Ind. Inf. Integr. 2020, 19, 100157. [Google Scholar] [CrossRef]
- McMaster, M.; Nettleton, C.; Tom, C.; Xu, B.; Cao, C.; Qiao, P. Risk Management: Rethinking Fashion Supply Chain Management for Multinational Corporations in Light of the COVID-19 Outbreak. J. Risk Financial Manag. 2020, 13, 173. [Google Scholar] [CrossRef]
- Singh, S.; Kumar, R.; Panchal, R.; Tiwari, M.K. Impact of COVID-19 on logistics systems and disruptions in food supply chain. Int. J. Prod. Res. 2021, 59, 1993–2008. [Google Scholar] [CrossRef]
- Sodhi, M.S.; Tang, C.S. Supply Chain Management for Extreme Conditions: Research Opportunities. J. Supply Chain Manag. 2021, 57, 7–16. [Google Scholar] [CrossRef]
- Chowdhury, T.; Sarkar, A.; Paul, S.K.; Moktadir, A. A case study on strategies to deal with the impacts of COVID-19 pandemic in the food and beverage industry. Oper. Manag. Res. 2020, 1–13. [Google Scholar] [CrossRef]
- Kumar, S.; Raut, R.D.; Narwane, V.S.; Narkhede, B.E. Applications of industry 4.0 to overcome the COVID-19 operational challenges. Diabetes Metab. Syndr. Clin. Res. Rev. 2020, 14, 1283–1289. [Google Scholar] [CrossRef]
- Sarkis, J. Supply chain sustainability: Learning from the COVID-19 pandemic. Int. J. Oper. Prod. Manag. 2020, 41, 63–73. [Google Scholar] [CrossRef]
- Ivanov, D.; Dolgui, A. Viability of intertwined supply networks: Extending the supply chain resilience angles towards survivability. A position paper motivated by COVID-19 outbreak. Int. J. Prod. Res. 2020, 58, 2904–2915. [Google Scholar] [CrossRef] [Green Version]
- Paul, S.K.; Chowdhury, P. Strategies for Managing the Impacts of Disruptions During COVID-19: An Example of Toilet Paper. Glob. J. Flex. Syst. Manag. 2020, 21, 283–293. [Google Scholar] [CrossRef]
- Karmaker, C.L.; Ahmed, T.; Ahmed, S.; Ali, S.M.; Moktadir, M.A.; Kabir, G. Improving supply chain sustainability in the context of COVID-19 pandemic in an emerging economy: Exploring drivers using an integrated model. Sustain. Prod. Consum. 2021, 26, 411–427. [Google Scholar] [CrossRef]
- Paul, S.K.; Chowdhury, P. A production recovery plan in manufacturing supply chains for a high-demand item during COVID-19. Int. J. Phys. Distrib. Logist. Manag. 2021, 51, 104–125. [Google Scholar] [CrossRef]
Figure 1.
Decision-modeling framework analyzing barriers of SCC.

Figure 2.
The prominence−causal DEMATEL graph for categories and barriers.

Figure 3.
Radar chart for the ranking in terms of the FBWM and Grey DEMATEL methods.

Figure 4.
Ranking of barriers of supply chain collaboration during the sensitivity analysis.

Figure 5.
Ranking of barriers to supply chain collaboration during sensitivity analysis.

Table 1.
List of barriers from the literature review.
| Category | Barrier Name | Reference |
|---|---|---|
| Information-related barriers | Reluctance to share information | [23,30,31,32,33,34,35,36] |
| Poor information quality | [37,38] | |
| Communication-related barriers | Lack of communication | [39] |
| Poor system connectivity | [46] | |
| Intra-organizational barriers | Intra-organizational weak relationships | [20,44] |
| Decision desynchronization | [35] | |
| Incentive obstacles | [1] | |
| Opposition to change | [46] | |
| Territoriality | [46] | |
| Leadership deficit | [46] | |
| Inter-organizational barriers | Lack of trust | [23,37,47,48] |
| Short-term relationships | [22,23,50] | |
| Behavioral uncertainty | [1,37] | |
| Cultural difference | [5,20,36] | |
| Different goals | [39,51] | |
| Non-standardized performance metrics | [39,52] | |
| Lack of commitment | [23,30,47] | |
| Small firms | [39] | |
| Governmental intervention | [36,51] | |
| Pricing obstacles | [1] | |
| Lack of resource sharing | [20,34] | |
| Lack of adaptation | [55,56] | |
| Late delivery | [39,57] |
Table 2.
MCDM techniques and their applications.
| Method | Applications | References |
|---|---|---|
| DEMATEL, Grey DEMATEL, and Fuzzy DEMATEL | Modeling interrelations among barriers for implementing drones in logistics, industrial symbiosis, adopting IoT in the food supply chain, automotive parts remanufacturing; analyzing challenges to implementing sustainable manufacturing, industry 4.0; identifying critical barriers to the establishment of refueling stations | [59,63,70,71,72,73,74] |
| Rough Set Theory | Modeling sustainable supply chain complexities | [58] |
| ANP and Fuzzy ANP | Analyzing drivers of green information technology; prioritizing barriers of the circular supply chain; assessing barriers of sustainable shale gas revolution | [60,75] |
| Grey DEMATEL-ANP and Grey TOPSIS | Ranking of risk barriers of product lifecycle management implementation; analyzing criteria for Green Strategic Sourcing | [62] |
| BWM and Fuzzy BWM | Analyzing barriers of green innovation in SMEs, humanitarian supply chain; assessing challenges of sustainable manufacturing, evaluating performances of the sustainable supply chain in the leather industry; sustainable supplier selection | [76,77,78,79,80,81] |
| TOPSIS and Fuzzy TOPSIS | Prioritizing barriers of supply chain remanufacturing and their solutions, ranking of drivers of lean-green manufacturing; prioritizing challenges and enablers of reverse logistics, green manufacturing; analyzing barriers of supply chain remanufacturing | [61,67,72,82,83] |
| AHP and Fuzzy AHP | Analyzing solutions for reverse logistics barriers, prioritizing barriers to renewable energy development, selecting assembly machined parts | [61,84,85,86,87,88] |
Table 3.
The linguistic scale for the respondents’ assessment.
| Linguistic Terms | Membership Function |
|---|---|
| Equal importance (EI) | (1, 1, 1) |
| Weakly important (WI) | (2/3, 1, 3/2) |
| Fairly important (FI) | (3/2, 2, 5/2) |
| Very important (VI) | (5/2, 3, 7/2) |
| Absolutely important (AI) | (7/2, 4, 9/2) |
Table 4.
Grey linguistic scale for decision makers’ assessments.
| Linguistic Terms | Grey Numbers |
|---|---|
| No influence (N) | (0, 0) |
| Very low influence (VL) | (0, 0.25) |
| Low influence (L) | (0.25, 0.5) |
| High influence (H) | (0.5, 0.75) |
| Very high influence (VH) | (0.75, 1) |
Table 5.
Selected SCC barriers for application purposes.
| Category Name | Barrier Name | Sources (LR = Literature Review) |
|---|---|---|
| Information-related barriers (A) | Reluctance to share information (A1) | LR |
| Information flow disruption (A2) | survey | |
| Poor information quality (A3) | LR + survey | |
| Communication-related barriers (B) | Lack of communication (B1) | LR + survey |
| Poor systems connectivity (B2) | LR + survey | |
| Vehicle routing problem (B3) | survey | |
| Intra-organizational barriers (C) | Intra-organizational weak relationships (C1) | LR |
| Decision desynchronization (C2) | LR + survey | |
| Incentive obstacles (C3) | LR | |
| Opposition to change (C4) | LR | |
| Leadership deficit (C5) | LR + survey | |
| Inter-organizational barriers (D) | Lack of trust (D1) | LR + survey |
| Short-term relationship (D2) | LR + survey | |
| Behavioral uncertainty (D3) | LR + survey | |
| Cultural difference (D4) | LR | |
| Different goals (D5) | LR + survey | |
| Non-standardized performance metrics (D6) | LR | |
| Lack of commitment on quality (D7) | survey | |
| Forecasting problem (D8) | survey | |
| Reluctance to deal with small firms (D9) | LR + survey | |
| Customer taste variations (D10) | survey | |
| Governmental intervention (D11) | LR + survey | |
| Lack of commitment on delivery time (D12) | LR + survey |
Table 6.
Experts and their professional roles.
| Type of Industry | Role of Respondents | Number of Respondents | Percentage of Respondents (%) |
|---|---|---|---|
| University | Academic | 3 | 18.75 |
| Cigarette Company | Executive, Production Department (1) | 2 | 12.5 |
| Manager, Supply Chain Management (1) | |||
| Garments Sector | Officer, Production Department (4) | 7 | 43.75 |
| Manager, Supply Chain Management (2) | |||
| Chief Executive Officer (1) | |||
| Food and Beverage Industry | Executive, Supply Chain Management | 1 | 6.25 |
| Paint and Coating Manufacturing Company | Manager, Supply Chain Management | 1 | 6.25 |
| Power Engineering Company | Manager, Supply Chain Management | 1 | 6.25 |
| Chief Executive Officer | |||
| Furniture Manufacturing Company | Supply Planner | 1 | 6.25 |
Table 7.
Weight of main categories and barriers.
| Best/Worst | Main Categories | |||||||||||
|---|---|---|---|---|---|---|---|---|---|---|---|---|
| A | B | C | D | |||||||||
| Best (B) | WI | EI | AI | FI | ||||||||
| Worst (C) | AI | AI | EI | VI | ||||||||
| Weights (ξ* = 0.044) | 0.3308 | 0.3623 | 0.0838 | 0.2233 | ||||||||
| Information-Related Barriers | ||||||||||||
| A1 | A2 | A3 | ||||||||||
| Best (A3) | AI | WI | EI | |||||||||
| Worst (A1) | EI | FI | AI | |||||||||
| Weights (ξ* = 0.0559) | 0.1431 | 0.3493 | 0.5076 | |||||||||
| Communication-Related Barriers | ||||||||||||
| B1 | B2 | B3 | ||||||||||
| Best (B1) | EI | AI | FI | |||||||||
| Worst (B2) | AI | EI | WI | |||||||||
| Weights (ξ* = 0.0559) | 0.5895 | 0.1667 | 0.2438 | |||||||||
| Intra-Organizational Barriers | ||||||||||||
| C1 | C2 | C3 | C4 | C5 | ||||||||
| Best (C5) | FI | WI | AI | WI | EI | |||||||
| Worst (C3) | FI | FI | EI | WI | AI | |||||||
| Weights (ξ* = 0.0984) | 0.1768 | 0.2177 | 0.1007 | 0.1811 | 0.3238 | |||||||
| Inter-Organizational Barriers | ||||||||||||
| D1 | D2 | D3 | D4 | D5 | D6 | D7 | D8 | D9 | D10 | D11 | D12 | |
| Best (D1) | EI | FI | WI | FI | FI | AI | WI | VI | FI | VI | FI | WI |
| Worst (D6) | AI | VI | FI | FI | VI | EI | FI | WI | WI | WI | WI | VI |
| Weights (ξ* = 0.044) | 0.15 | 0.10 | 0.10 | 0.09 | 0.10 | 0.04 | 0.10 | 0.05 | 0.06 | 0.05 | 0.06 | 0.11 |
Table 8.
Relative importance (weights) of categories and barriers using the fuzzy best-worst method.
Table 8.
Relative importance (weights) of categories and barriers using the fuzzy best-worst method.
| Category Name | Category Weights | Barrier Name | Local Weights of Barrier | Global Weights of Barrier |
|---|---|---|---|---|
| Information-related barriers (A) | 0.3308 | Reluctance to share information (A1) | 0.1431 | 0.0473 |
| Information flow disruption (A2) | 0.3493 | 0.1155 | ||
| Poor information quality (A3) | 0.5076 | 0.1679 | ||
| Communication-related barriers (B) | 0.3623 | Lack of communication (B1) | 0.5895 | 0.2136 |
| Poor systems connectivity (B2) | 0.1667 | 0.0604 | ||
| Vehicle routing problem (B3) | 0.2438 | 0.0883 | ||
| Intra-organizational barriers (C) | 0.0838 | Intra-organizational weak relation (C1) | 0.1768 | 0.0148 |
| Decision desynchronization (C2) | 0.2177 | 0.0182 | ||
| Incentive obstacles (C3) | 0.1007 | 0.0084 | ||
| Opposition to change (C4) | 0.1811 | 0.0152 | ||
| Leadership deficit (C5) | 0.3238 | 0.0271 | ||
| Inter-organizational barriers (D) | 0.2233 | Lack of trust (D1) | 0.1453 | 0.0324 |
| Short-term relationship (D2) | 0.1008 | 0.0225 | ||
| Behavioral uncertainty (D3) | 0.0971 | 0.0217 | ||
| Cultural difference (D4) | 0.0856 | 0.0191 | ||
| Different goals (D5) | 0.1008 | 0.0225 | ||
| Non-standardized performance metrics (D6) | 0.0401 | 0.0090 | ||
| Lack of commitment on quality (D7) | 0.0969 | 0.0216 | ||
| Forecasting problem (D8) | 0.0489 | 0.0109 | ||
| Reluctance to deal with small firms (D9) | 0.0606 | 0.0135 | ||
| Customer taste variations (D10) | 0.0489 | 0.0109 | ||
| Governmental intervention (D11) | 0.0606 | 0.0135 | ||
| Lack of commitment on delivery time (D12) | 0.1144 | 0.0255 |
Table 9.
Relative importance (weights) of categories and barriers using the grey DEMATEL method.
| Category Name | Category Weights | Barrier Name | Local Weights of Barrier | Global Weights of Barrier |
|---|---|---|---|---|
| Information-related barriers (A) | 0.2713 | Reluctance to share information (A1) | 0.2750 | 0.0746 |
| Information flow disruption (A2) | 0.3231 | 0.0877 | ||
| Poor information quality (A3) | 0.4019 | 0.1090 | ||
| Communication-related barriers (B) | 0.2802 | Lack of communication (B1) | 0.4280 | 0.1199 |
| Poor systems connectivity (B2) | 0.2624 | 0.0735 | ||
| Vehicle routing problem (B3) | 0.3096 | 0.0867 | ||
| Intra-organizational barriers (C) | 0.2171 | Intra-organizational weak relation (C1) | 0.1919 | 0.0417 |
| Decision desynchronization (C2) | 0.2102 | 0.0456 | ||
| Incentive obstacles (C3) | 0.1679 | 0.0365 | ||
| Opposition to change (C4) | 0.1950 | 0.0423 | ||
| Leadership deficit (C5) | 0.2349 | 0.0510 | ||
| Inter-organizational barriers (D) | 0.2313 | Lack of trust (D1) | 0.1190 | 0.0275 |
| Short-term relationship (D2) | 0.1050 | 0.0243 | ||
| Behavioral uncertainty (D3) | 0.0948 | 0.0219 | ||
| Cultural difference (D4) | 0.0891 | 0.0206 | ||
| Different goals (D5) | 0.1027 | 0.0238 | ||
| Non-standardized performance metrics (D6) | 0.0377 | 0.0087 | ||
| Lack of commitment on quality (D7) | 0.0917 | 0.0212 | ||
| Forecasting problem (D8) | 0.0493 | 0.0114 | ||
| Reluctance to deal with small firms (D9) | 0.0851 | 0.0197 | ||
| Customer taste variations (D10) | 0.0450 | 0.0104 | ||
| Governmental intervention (D11) | 0.0730 | 0.0169 | ||
| Lack of commitment on delivery time (D12) | 0.1075 | 0.0249 |
Table 10.
Importance ranking of the categories and barriers.
| Category | Barrier Name | Importance Ranking from FBWM | Importance Ranking from Grey-DEMATEL |
|---|---|---|---|
| Information-related barriers (A) | Reluctance to share information (A1) | 6 | 5 |
| Information flow disruption (A2) | 3 | 3 | |
| Poor information quality (A3) | 2 | 2 | |
| Communication-related barriers (B) | Lack of communication (B1) | 1 | 1 |
| Poor systems connectivity (B2) | 5 | 6 | |
| Vehicle routing problem (B3) | 4 | 4 | |
| Intra-organizational barriers (C) | Intra-organizational weak relation (C1) | 17 | 10 |
| Decision desynchronization (C2) | 15 | 8 | |
| Incentive obstacles (C3) | 23 | 11 | |
| Opposition to change (C4) | 16 | 9 | |
| Leadership deficit (C5) | 8 | 7 | |
| Inter-organizational barriers (D) | Lack of trust (D1) | 7 | 12 |
| Short-term relationship (D2) | 10 | 14 | |
| Behavioral uncertainty (D3) | 12 | 16 | |
| Cultural difference (D4) | 14 | 18 | |
| Different goals (D5) | 10 | 15 | |
| Non-standardized performance metrics (D6) | 22 | 23 | |
| Lack of commitment on quality (D7) | 13 | 17 | |
| Forecasting problem (D8) | 20 | 21 | |
| Reluctance to deal with small firms (D9) | 18 | 19 | |
| Customer taste variations (D10) | 20 | 22 | |
| Governmental intervention (D11) | 18 | 20 | |
| Lack of commitment on delivery time (D12) | 9 | 13 |
Publisher’s Note: MDPI stays neutral with regard to jurisdictional claims in published maps and institutional affiliations. |
© 2021 by the authors. Licensee MDPI, Basel, Switzerland. This article is an open access article distributed under the terms and conditions of the Creative Commons Attribution (CC BY) license (https://creativecommons.org/licenses/by/4.0/).
Share and Cite
MDPI and ACS Style
Mahmud, P.; Paul, S.K.; Azeem, A.; Chowdhury, P. Evaluating Supply Chain Collaboration Barriers in Small- and Medium-Sized Enterprises. Sustainability 2021, 13, 7449. https://0-doi-org.brum.beds.ac.uk/10.3390/su13137449
AMA Style
Mahmud P, Paul SK, Azeem A, Chowdhury P. Evaluating Supply Chain Collaboration Barriers in Small- and Medium-Sized Enterprises. Sustainability. 2021; 13(13):7449. https://0-doi-org.brum.beds.ac.uk/10.3390/su13137449
Chicago/Turabian StyleMahmud, Priom, Sanjoy Kumar Paul, Abdullahil Azeem, and Priyabrata Chowdhury. 2021. "Evaluating Supply Chain Collaboration Barriers in Small- and Medium-Sized Enterprises" Sustainability 13, no. 13: 7449. https://0-doi-org.brum.beds.ac.uk/10.3390/su13137449
Note that from the first issue of 2016, this journal uses article numbers instead of page numbers. See further details here.