Article

School Refusal Behaviour Profiles and Academic Self-Attributions in Language and Literature

by
Carolina Gonzálvez
1,
Mariola Giménez-Miralles
1,
María Vicent
1,*,
Ricardo Sanmartín
1,
María José Quiles
2 and
José Manuel García-Fernández
1
1
Department of Developmental Psychology and Teaching, Faculty of Education, University of Alicante, 03690 Alicante, Spain
2
Health Psychology Department, Faculty of Psychology, University Miguel Hernández of Elche, 03202 Elche, Spain
*
Author to whom correspondence should be addressed.
Sustainability 2021, 13(13), 7512; https://0-doi-org.brum.beds.ac.uk/10.3390/su13137512
Submission received: 17 June 2021 / Revised: 3 July 2021 / Accepted: 3 July 2021 / Published: 5 July 2021

Abstract

:
School refusal behaviour has a major impact on the lives of children and adolescents, seriously affecting their personal, academic and social adjustment. The objectives of this research were: (1) to identify, using latent profile analysis, school refusal behaviour profiles based on the functional model and (2) to analyse the relationship between the identified school refusal behaviour profiles and academic self-attributions in language and literature. The School Refusal Assessment Scale-Revised (SRAS-R) and the Sydney Attribution Scale (SAS) were administered to 926 Spanish students (51% boys) aged 8 to 11 (M = 9.57; SD = 1.07). Four school refusal behaviour profiles were obtained: low school refusal behaviour, school refusal behaviour by positive reinforcement, mixed school refusal behaviour and high mixed school refusal behaviour. School refuser profiles, characterised by high scores on the first three factors of the SRAS-R (high mixed and mixed school refusal behaviour profiles), reported higher scores on an academic self-attributional style, in which they associate their failures with a lack of ability and effort. Results are discussed, considering the relationship between school refusal behaviour and unsuitable attributional styles in language and literature. Promoting effective coping skills to deal with school failure situations will seek to improve, as far as possible, the needs of all students contributing to a healthy learning environment.

1. Introduction

According to data from PISA, Spain is among the countries with better results regarding students’ perception of school climate and their well-being (86.80% of Spanish students get on well with other students, 86.50% feel involved, and 81.00% make friends easily at school) [1]. However, 18.40% of Spanish students occasionally missed school (1 or 2 days), and 6.60% of students do it more frequently (3 or more days), while the average is 15% [2]. Therefore, Spain is among the group of the Organization for Economic Co-operation and Development (OECD) countries and the European Union with the highest percentage of students who are absent from class unjustifiably. In addition to these negative situations, Spanish students scored below the OECD average in Mathematics (481 points), Reading (477 points), and Science (483) [1]. In light of these results, there is major interest in clarifying what factors can explain the problems of school attendance and the academic performance of Spanish students.
School attendance problems (SAPs) may be motivated by a great diversity of the school and psychological factors that may generate stress and demotivation. Knowing how students react to these situations is vital to offer them orientation. One of the moments which can be more stressful is the one associated with educational success and failure, with the students’ attributional style being a determinant factor of their school adjustment [3]. Identifying how students’ academic attributional styles associate with SAPs could be a critical step in understanding how to improve their attitude toward school, learning process and building better mental health. This purpose is in line with Sustainable Development Goals, which since 2015 included mental health as a priority for global development [4]. Promoting effective coping skills to deal with stressful school situations could help students lead healthier and more satisfying lives [5].

2. Literature Review

2.1. School Refusal Behavior

School refusal behaviour (SRB) is a concept that refers to a student’s negative attitude to attend school or the persistent difficulty in remaining there [6]. This concept is part of the school attendance problems (SAPs), with the main concept referring to the set of different types of school absences or difficulties in attending or remaining in school. Some examples of this behaviour include delays in arrival to school, occasional or ongoing absences, and unexcused absences or absences without parental consent.
Negative attitudes toward school may be simultaneously caused by several reasons. In each situation, however, their relative strength differs [7]. Due to the heterogeneity of each case, a functional analysis model of SRB has been developed (see Figure 1), including four possible causes (the so-called functional conditions) of the ongoing SRB: (1) To avoid school-based stimuli that provoke negative affectivity, (2) To escape school-based social and/or evaluative situations, (3) To pursue attention from significant others, and (4) To pursue tangible reinforcers outside of school. In the first two dimensions, children refuse school for negative reinforcement (for example, overcoming stage fright during public speaking, difficulty with a new school or teacher [8]); whereas, in the last two functional conditions, students refuse school for positive reinforcement (for example, garnering parental attention or staying at home playing video games). These conditions can be evaluated by the School Refusal Assessment Scale (SRAS) [9] and its revised version (SRAS-R) [10]. Until now, this instrument has been the most widely used measure to identify subgroups of school refusers.
To better understand the heterogeneity of this population, several studies have attempted to evidence profiles of scholars with SRB. Kearney and Silverman [9] proposed the functional model according to which four main groups have been distinguished: a mixed SRB profile, with high scores on factors for both positive and negative reinforcements [11]; an SRB profile characterised by negative reinforcement, with high scores on both or one of the first two factors of the SRAS-R [12]; an SRB profile distinguished by positive reinforcement, with high scores on both or one of the last two factors of the SRAS-R [11,12]; and a group of non-school refusal, with low scores on the four factors of the SRAS-R [11,12]. Other studies have attached new groups such as the SRB with high scores on all four functional conditions, called the high SRB profile [13] and two groups with moderate-low and high scores, respectively, on the four factors without reaching remarkable values [13,14].
Different variables, mainly of a psychological nature, have been linked to the SRB profiles (e.g., mental health [15], self-concept [14,16], psychiatric disorders [17], emotional and behavioural difficulties [18], or anxiety-stress and depression [11]). Most of these are internalising variables, with those of an educational nature being set aside. Previous research, however, suggests that SRB leads to poorer academic performance and may have long-term consequences such as school failure, school dropout, subsequent economic deprivation, employment difficulties and mental disorders [6,19,20,21]. Although the relationship between SRB and educational variables is of great interest, research on this matter is scarce in terms of SRB and attributional styles in academic areas.

2.2. Academic Self-Attributions

The descriptive perception that an individual generates for their own behaviour and for that of others is referred to as an attribution [18]. Weiner’s causal attribution theory [22] describes these processes. As mentioned above, this is an expository conceptual framework of the interpretations and evaluations made by pupils when justifying circumstances of educational success or failure [23]. The most common factors affecting attributions for achievement are ability, task difficulty, effort, and luck [24]. Learners tend to attribute their successes or failures to internal causes such as their abilities, or lack thereof, and to external causes, defined as the difficulty of the task or their luck during the action [25]. Learners with higher ratings of self-esteem and with higher school achievement attributed their success to internal, stable and uncontrollable factors such as ability, while they ascribed their failure to either internal, unstable, or controllable factors such as effort, or external, stable, and uncontrollable factors such as task difficulty [26].
Three causal factors for perceived success and failure in life can be differentiated based on the locus of control, stability, and controllability: (1) internal or external, depending on the location of the cause (within the subject or external); (2) stable or unstable, according to the perseverance and inconsistency of the cause; and (3) controllable or uncontrollable, considering the degree of control of individuals to adapt to the consequences [27]. The principles of this theory are explained by three concepts: attribution is a three-level process in which, firstly, behaviour is analysed; secondly, behaviour is determined to be intentional; and finally, behaviour is assigned to internal or external causes.
Past research has analysed Spanish children aged 8 to 11 regarding the relationship between SRB and academic self-attributions in the subject of Mathematics [28]. This study revealed that school refusers based on negative affect or anxiety generated by the school were more likely to attribute their failures in Mathematics to a lack of ability and effort. On the other hand, school refusers based on the search for tangible reinforcements outside of school were more likely to attribute their successes to ability [28]. Despite these findings, no studies have been found that have analysed the relationship between school refusal and attributional style in the area of Language and Literature. Therefore, it is necessary to study how attributional style in the linguistic area affects the different profiles of school refusal behaviour.
The aims of this study are:
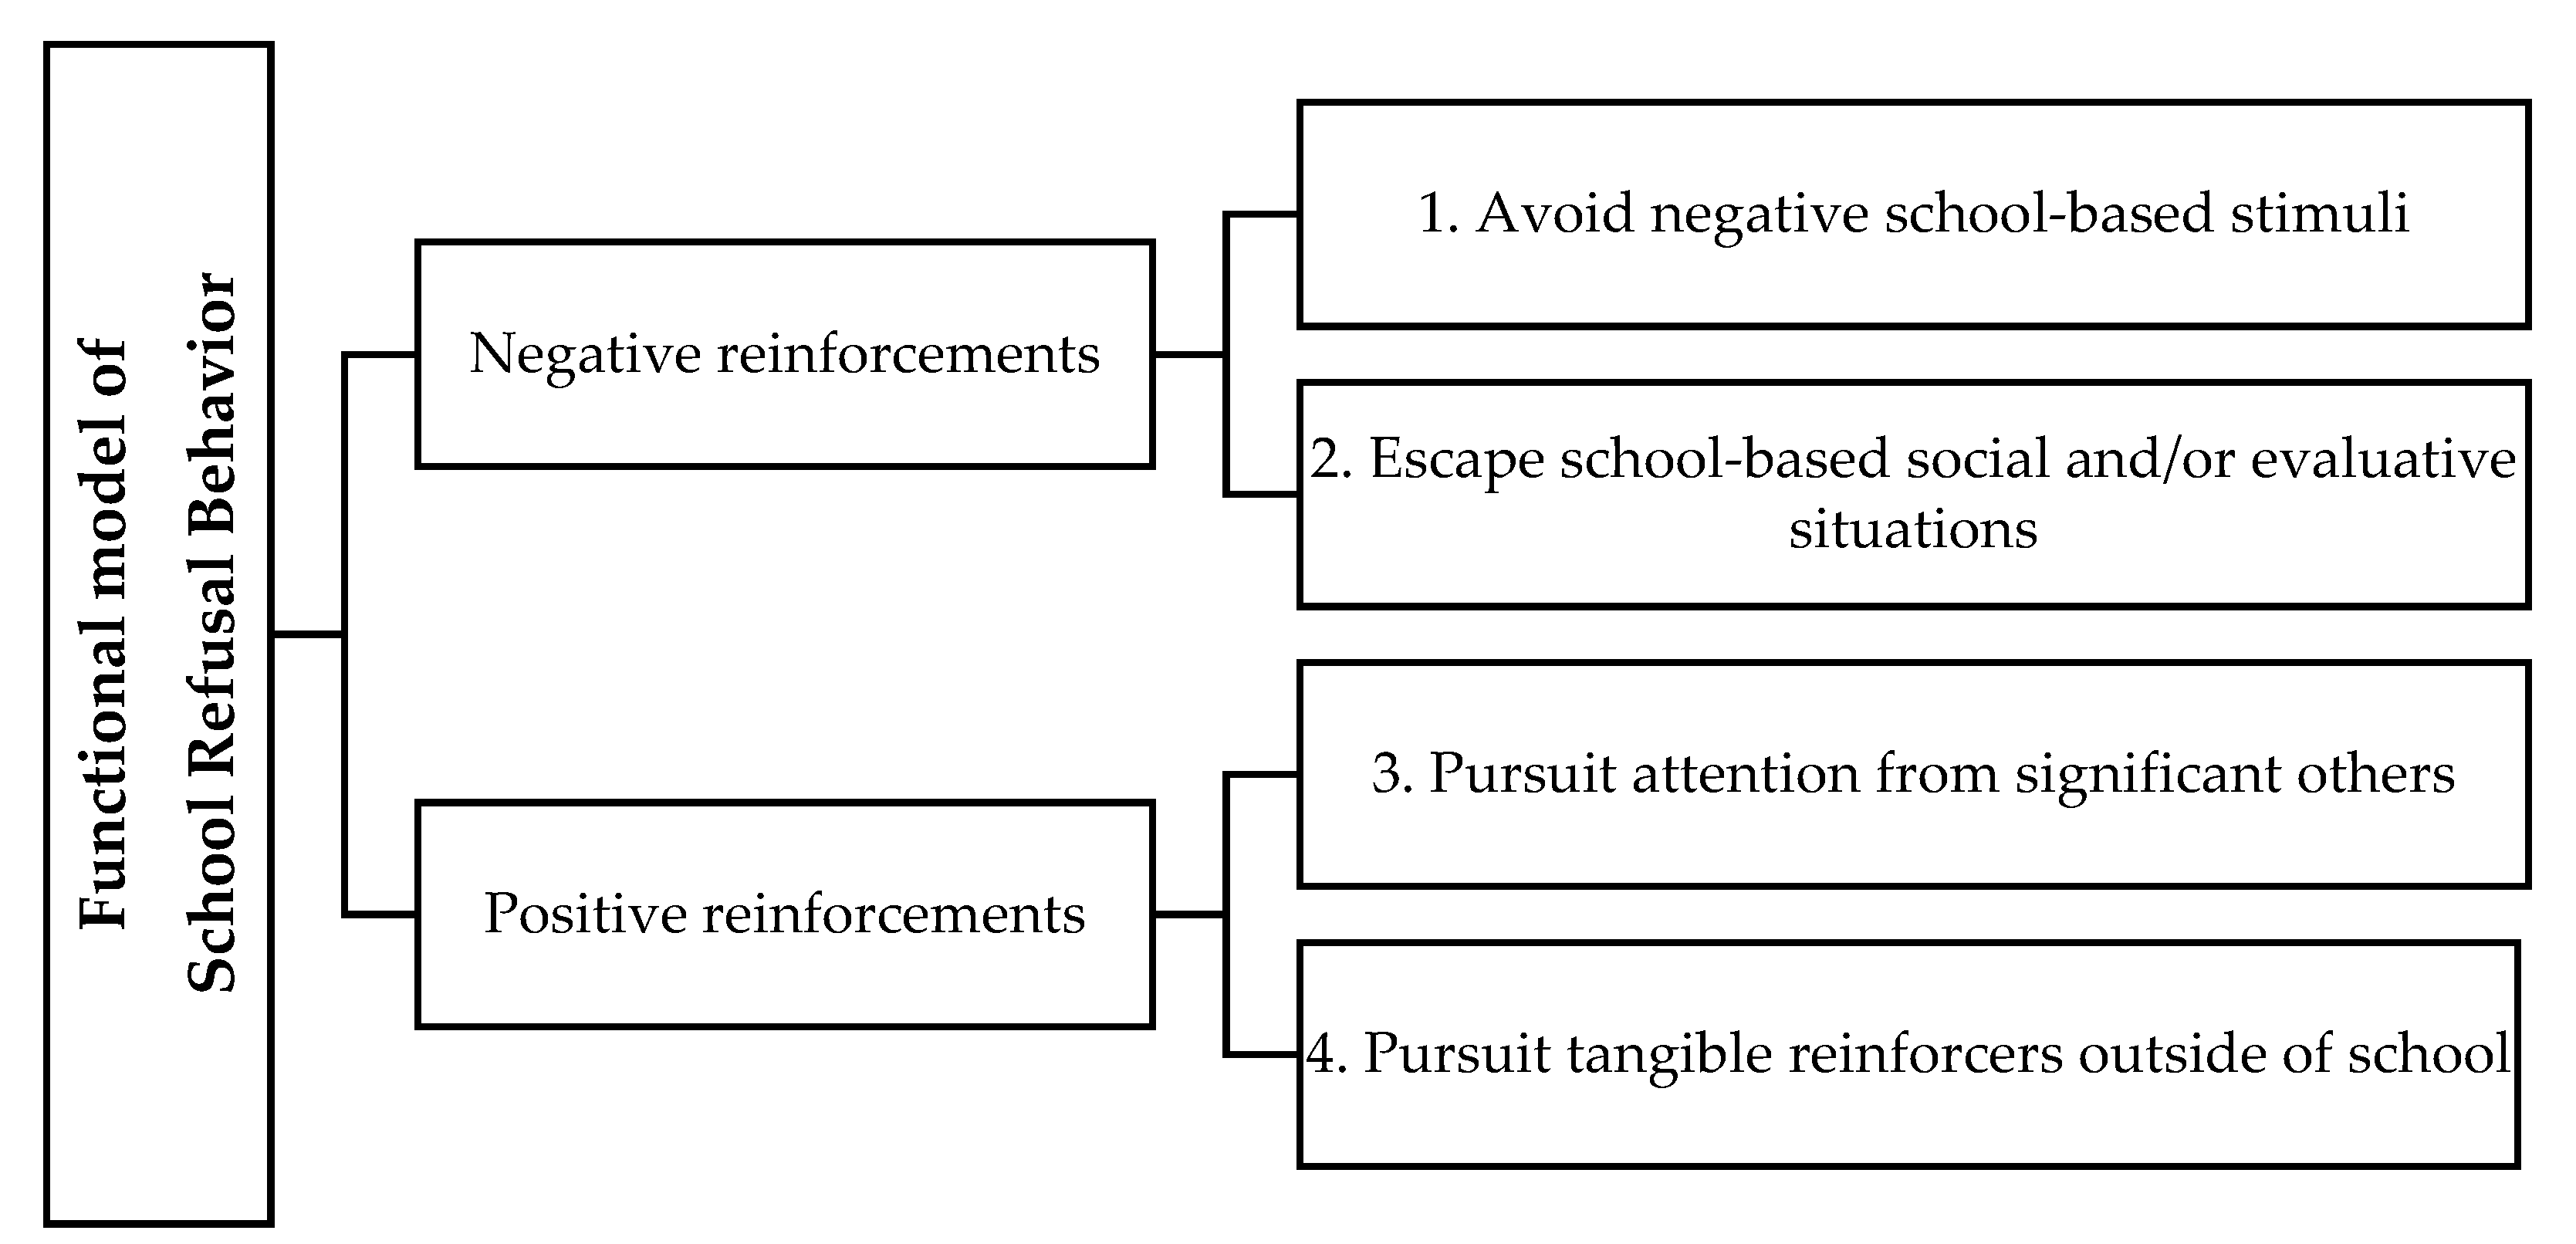
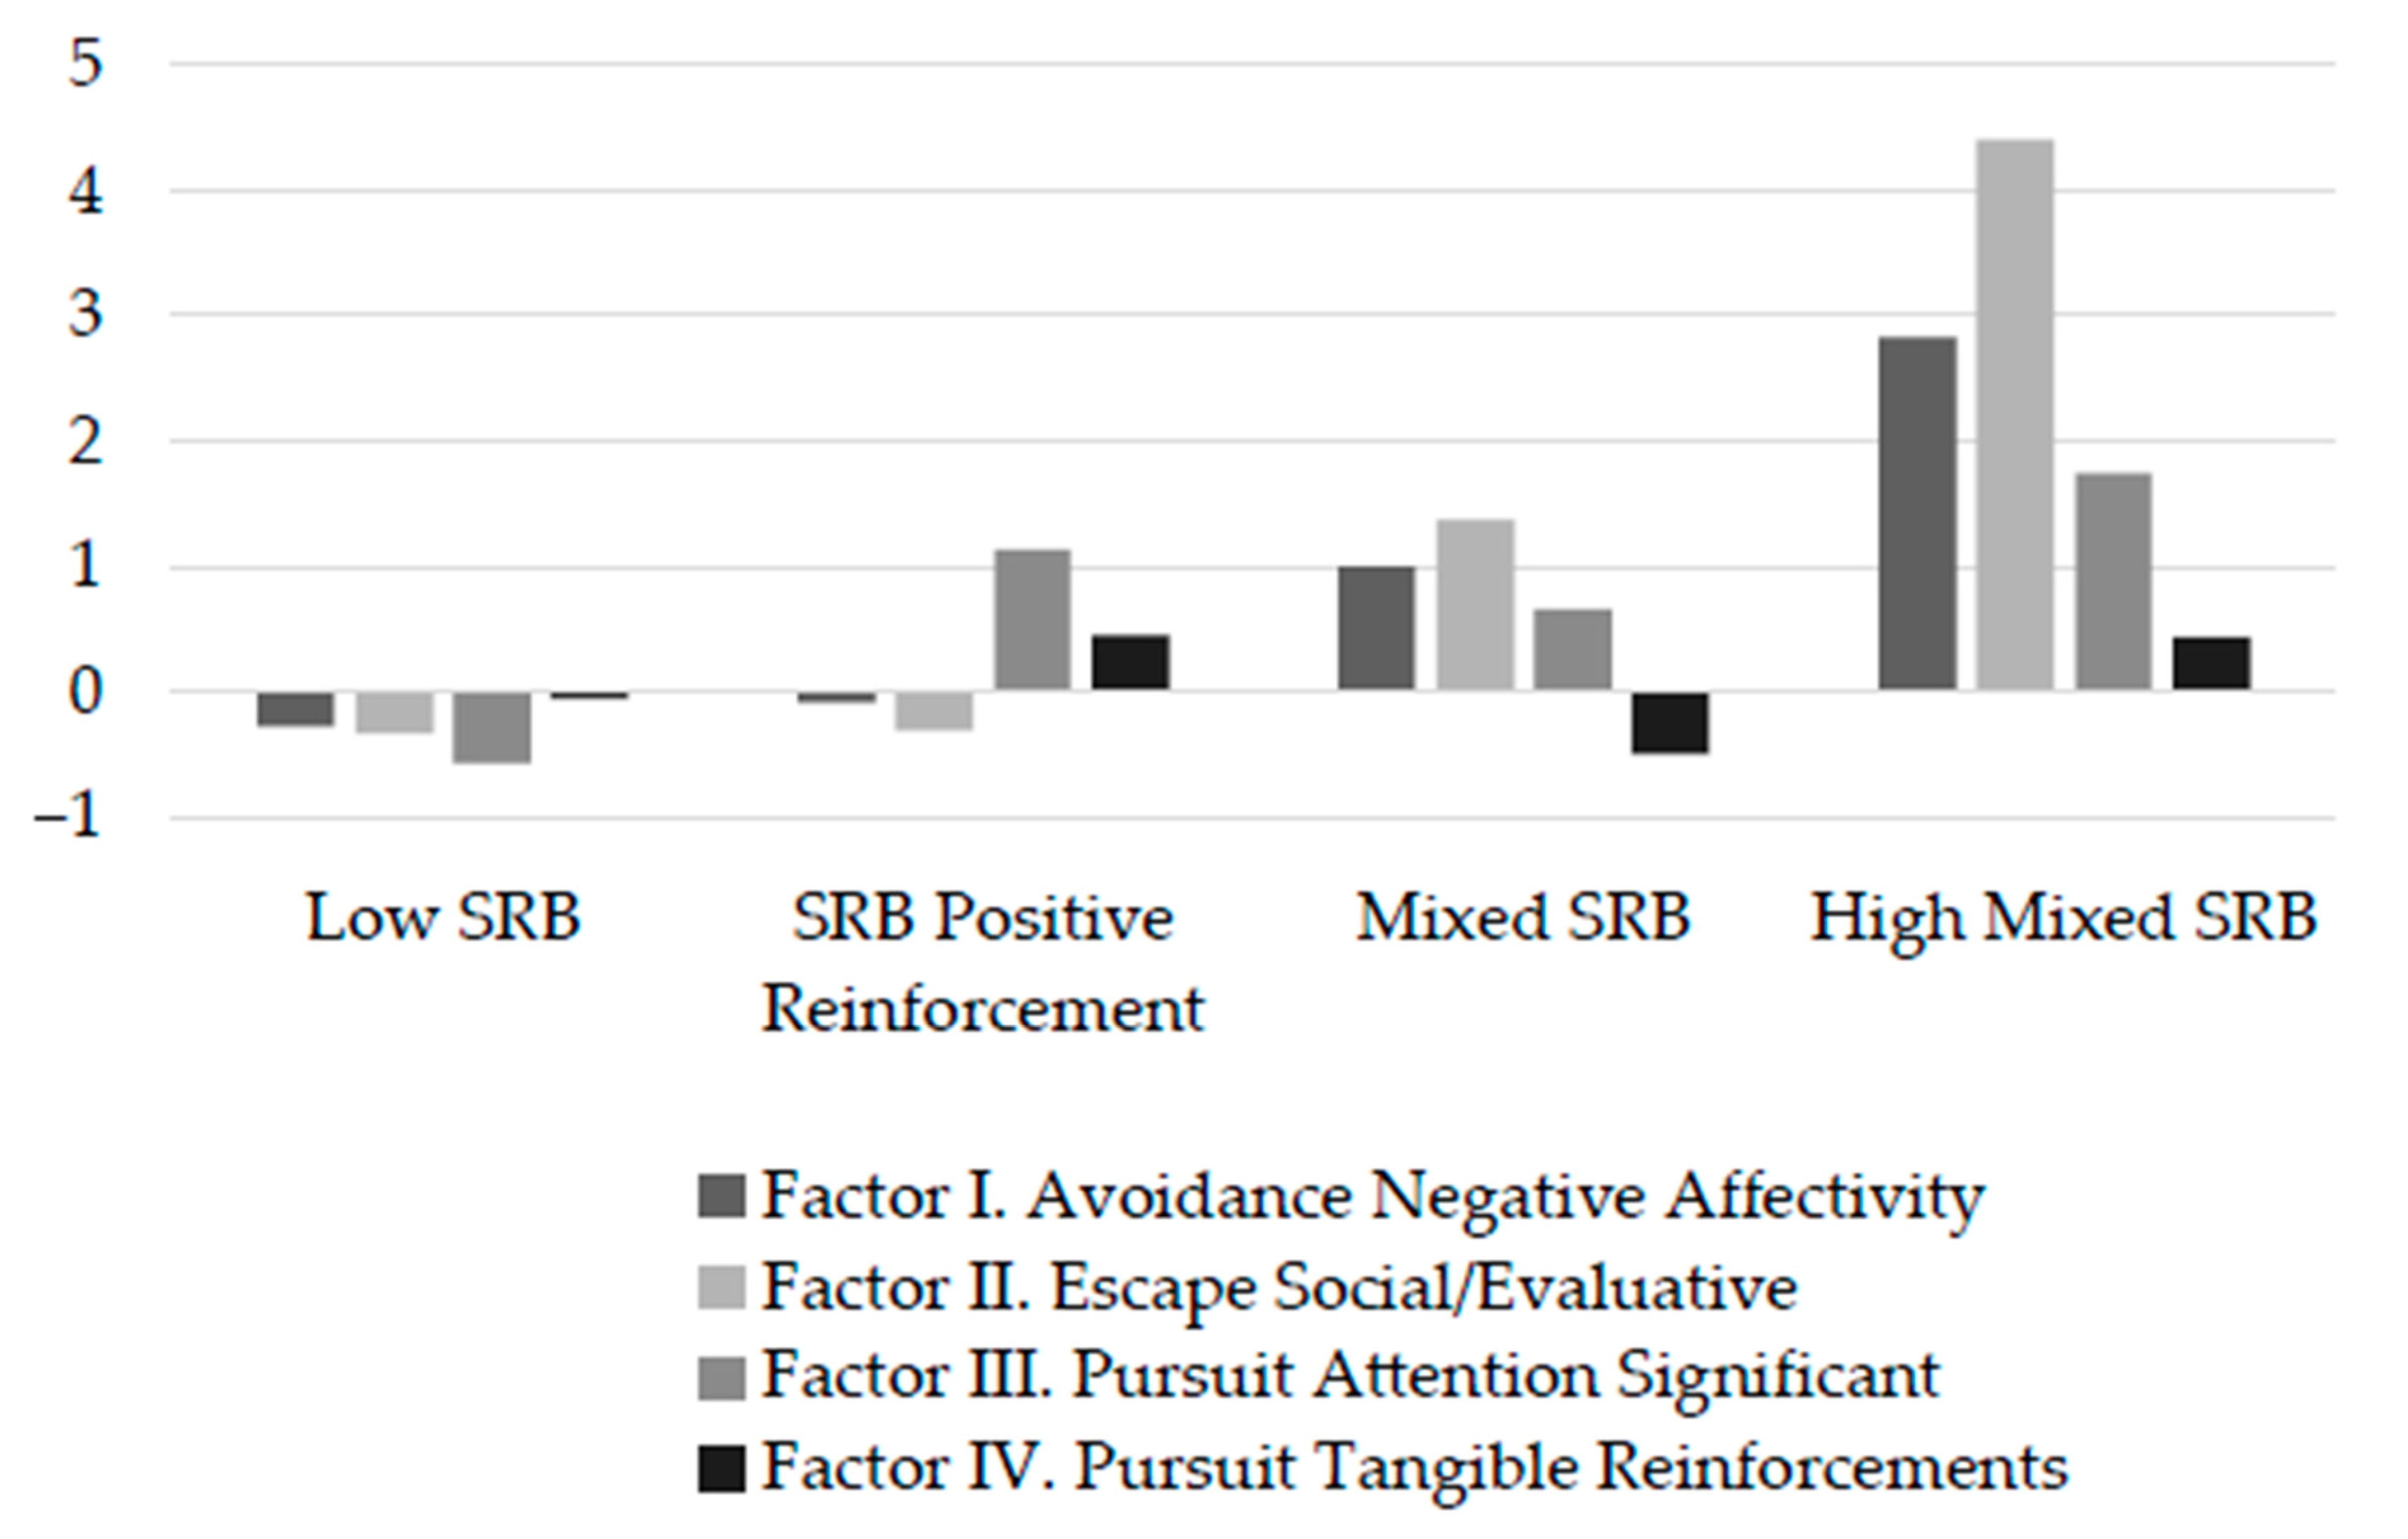
  • To identify SRB profiles using latent profile analysis, considering the potential reasons that underlie SRB based on the functional model proposed by Kearney and Silverman [9]. According to previous research, it is expected that four profiles will be identified: non-school refusal behaviour, school refusal behaviour by negative reinforcement, school refusal behaviour by positive reinforcement, and school refusal behaviour by mixed or multiple reinforcements (which combines factors by positive and negative reinforcements) [11,12].
  • To analyse the relationship between the identified SRB profiles and academic self-attributions in Language and Literature in Spanish children. It is expected that SRB profiles based on anxiety or negative affectivity generated by the school (SRB profile by negative reinforcement and mixed SRB profile) will more frequently ascribe their failures to an absence of ability and effort, whereas SRB profiles based on positive reinforcement will allocate their successes to their ability [28].

3. Materials and Methods

3.1. Participants

The initial sample was made up of 1017 students, of which 53 participants (5.2%) were excluded because their parents or legal guardians did not give written consent to participate in the research; 23 students (2.3%) did not contribute because they were unable to understand the self-report measures due to a low reading level, and 15 participants (1.5%) were excluded because they did not properly complete the questionnaires. As a result, the final sample included 926 Spanish students (51% boys) aged 8 to 11 (M = 9.57; SD = 1.07). The sample distribution according to age was 8 years old (n = 186, 20.10%), 9 years old (n = 260, 28.10%), 10 years old (n = 246, 26.60%), and 11 years old (n = 234, 25.31%).
The sample was recruited using a multi-stage random cluster sampling, with the primary units being the geographical areas of the provinces of Alicante and Murcia (central, north, south, east, and west), the secondary units were the schools, and the tertiary units were the classrooms. A total of 13 primary schools, both public and private, were selected, and from each centre, one classroom per academic grade was randomly selected from the 3rd to 6th grade of primary education. The predominant socioeconomic status of the sample was average. This study included a community sample of students and concluded that none of the participants had a clinical diagnosis, learning difficulties, or behavioural or psychological problems.

3.2. Instruments

School Refusal Assessment Scale-Revised (SRAS-R) [10]. The SRAS-R is a self-reporting instrument consisting of 24 items using a 7-point response scale (0 = never; 6 = always). It measures the four functional conditions for the continuance of SRB: (1) Avoidance of school-related stimuli that provoke a general sense of negative affectivity (ANA) (e.g., how often do you feel worse at school (for example, scared, nervous, or sad) as compared to how you feel at home with friends?); (2) Escape from aversive social and/or evaluative situations at school (ESE) (e.g., how often do you stay away from school because you do not have many friends there?); (3) pursuit of attention from significant others (PAS) (e.g., how much would you rather be taught by your parents at home than by your teacher at school?); and (4) Pursuit of tangible reinforcement outside of school (PTR) (e.g., would it be easier for you to go to school if you could do more things you like after school hours (for example, being with friends)?). In this study, the version of the SRAS-R validated in Spain was applied. It consists of 18 items [29], maintaining the four previously mentioned factors. The coefficients of internal consistency (Cronbach’s alpha test) were: 0.72 (ANA), 0.87 (ESE), 0.78 (PAS), and 0.70 (PTR) obtained using the SPSS 24 statistical package.
Sydney Attribution Scale (SAS) [30]. This instrument consists of 24 hypothetical situations to be considered by participants using a 5-point Likert scale (1 = false; 5 = true). It measures the attribution of successes and failures in Mathematics and Language and overall academic self-attributions. In this study, the Spanish version of González-Pumariega, Núñez, and González-Pienda [31] was administered. Only the Language dimension was assessed (e.g., imagine that the teacher chooses you for the group of the best readers in the class. It would probably be because: 1. You are good at reading; 2. You work hard at reading; 3. The teacher has made a mistake). The causes would attribute success or failure to ability, effort, or an external cause. In this study, the coefficients of internal consistency (Cronbach’s alpha test) were: 0.88 (success/ability), 0.84 (success/effort), 0.72 (success/external causes), 0.86 (failure/ability), 0.76 (failure/effort) and 0.75 (failure/external causes) obtained using the SPSS 24 statistical package.

3.3. Procedure

First, a meeting was held with the school’s principals to present the study objectives and to appeal to their collaboration. After accepting their participation in the study, a letter indicating the purpose of the study was provided to the parents or legal guardians of the students. In addition, written informed consent forms were sent to the students’ families. Over a two-week period, students were informed about the study and their voluntary participation. They completed the instruments during a school session that lasted 35 min. Participants filled out both questionnaires (15 min for the SRAS-R and 20 min for the SAS). At least one member of the research team was present at the sessions to sort out any doubts of the students and to supervise questionnaire completion. Compliance with the ethical standards of the Declaration of Helsinki [32], a statement of ethical principles for research involving human subjects, was guaranteed for the study. It was also approved by the Ethics Committee of the University of Alicante (UA-2017-09-05).

3.4. Statistical Analysis

Subgroups of students with SRB were identified using Latent Profile Analysis (LPA), a recommended method used for class selection [33]. We used LPA to group students based on their scores on all four factors of the SRAS-R and considering the following standard fit statistics: Bayesian Information Criteria (BIC), Akaike Information Criterion (AIC), Vuong-Lo-Mendell-Rubin likelihood-ratio test (LRT), the bootstrap likelihood-ratio test (BLRT), entropy, and size index. The model having the lowest BIC and AIC values was desirable, and a p-value below 0.05 for the LRT and BLRT is required. Moreover, an entropy score approaching one was preferable, and it is also necessary to consider the size of the classes to choose the best model since the classes should include at least 1% of the sample.
Subsequently, a multivariate analysis of variance (MANOVA) was performed to examine whether students in different classes also differed on academic self-attributions in Language and Literature. Next, Scheffé’s post-hoc tests were used, and the effect size was calculated using the d-index, which was analysed based on Cohen’s interpretation [34]. The d-index has been interpreted as follows: values between 0.20 and 0.49 indicate a low effect size; values between 0.50 and 0.79 suggest a moderate effect size; and those above 0.80, a high effect size. Analyses were calculated using the SPSS 24 statistical package and Mplus version 8.

4. Results

4.1. School Refusal Behaviour Profiles

Table 1 presents the fit indices of the six examined models, including the AIC, the BIC and adjusted BIC, the LRT and adjusted LRT, the BLRT, the entropy information, and the size index for the number of classes that do not achieve at least 1% of the sample. The lowest BIC and AIC scores were obtained by the six- and seven-class models. However, these classes were rejected since the most restrictive criterion, the LRT, had a p > 0.05. The five-class model, although having low BIC and AIC scores and a p < 0.05, was rejected since the size index was above 0. Combining all of these criteria, the four-class model was selected as the best fitting model with p < 0.05 for the LRT and the BLRT. It also had the lowest AIC and BIC indices as compared to the other models.
Figure 2 summarises the four identified classes: Profile 1-low school refusal behaviour (59.61% of the sample, with low scores on the third factor and scores having a downward trend for the others); Profile 2-SRB by positive reinforcement (17.71% of the sample, with high scores on the third and fourth factors); Profile 3-mixed SRB (13.39% of the sample, with high scores on the first three factors), and Profile 4-high mixed SRB (9.29% of the sample, with very high scores on the first three factors).

4.2. Inter-Class Differences in Academic Self-Attributions in Language and Literature

A MANOVA established whether or not the four SRB profiles differed on mean scores of the academic self-attributions in Language and Literature. Statistically significant differences were found for the latent profiles in all of the SAS factors (Wilks’ Lambda = 0.831, F(18,922) = 9.74; p < 0.001, η2P = 0.06). The SRB by positive reinforcement profile had the highest mean scores on attributions of success to ability, effort, and external causes, and the lowest means on attributions of failure to ability (see Table 2). It also had the highest mean scores on attributions of failure to external causes. On the other hand, the high mixed SRB profile received the highest mean scores on attributions of failure to effort and external causes.
Table 3 presents the results of the post-hoc tests. These tests revealed statistically significant differences between the low SRB profile and the mixed and high mixed SRB profiles, as well as between the SRB by positive reinforcement profile and the mixed and high mixed SRB profiles. Large effect size differences were found between the low SRB and high mixed SRB profiles in the dimension of reading failure attributions to ability and between the SRB by positive reinforcement and high mixed SRB profiles in the same dimension. In terms of moderate effect size differences between the low and high mixed SRB profiles, the former had higher scores in the dimensions of reading success attributions to ability and external causes and reading failure attributions to external reasons. On the other hand, the high mixed SRB profile had moderate effect size differences with higher scores than the low SRB in the dimension of reading failure attribution to a lack of effort. Furthermore, moderate differences were found between the SRB by positive reinforcement and high mixed SRB profiles in the dimensions of reading success attributions to ability and reading failure attributions to external causes. Finally, minor effect size differences were found between the low and mixed SRB profiles in the dimensions of reading success attributions to ability and effort and reading failure attributions to external reasons; and between the low and high mixed SRB profiles in the dimension of reading success attribution to effort. Moreover, only minor differences were found between the SRB by positive reinforcement and mixed SRB profiles, in the dimensions of reading success attribution to ability, effort and external causes and reading failure attribution to external causes.

5. Discussion

The aim of this study was two-fold: first, to identify SRB profiles using the latent profile analysis considering the potential reasons underlying said SRB based on the functional model; and second, to analyse the relationship between school refusal profiles and academic self-attributions in Language and Literature in Spanish children.
According to the first hypothesis, four profiles were expected to be identified: non-school refusal behaviour, school refusal behaviour by negative reinforcement, school refusal behaviour by positive reinforcement, and school refusal behaviour by mixed or multiple reinforcements. According to our findings, this hypothesis has been partially confirmed, replicating some of the previous profiles identified and recognising new profiles that should be considered. The replicated groups are the mixed SRB and the SRB by positive reinforcement profiles [11,12,18]. Nevertheless, new profiles have been found. On the one hand, the high mixed SRB profile was identified. It has similar characteristics to the mixed SRB profile but with higher scores on the first three factors. This new profile confirms past studies, revealing a group of students characterised by high scores on the first three factors of SRAS-R (mixed SRB profile). In this case, however, this group is determined by highly meaningful scores. On the other hand, the low SRB profile, like the non-SRB profile, which has been mentioned in past research [11,12,13,14], has been found. Nevertheless, in this case, it does not have statistically low scores on all SRAS-R factors. It is important to note that the low SRB profile reached its maximum score of representation between the identified profiles. More than 50% of the total sample, specifically 59.61%, belongs to this group. This may be due to the non-clinical characteristics of the sample.
Regarding the second hypothesis, it was expected that SRB profiles based on anxiety or negative affectivity generated by school would be probable to attribute their failures to an absence of ability and effort, whereas SRB profiles based on positive reinforcement were expected to attribute their successes to their ability. Results support the second hypothesis since students having the highest anxiety levels in scholastic situations were found to have the most maladaptive results since they were more likely to attribute their failures to internal, stable, and uncontrollable causes (e.g., ability) and less likely to attribute their successes to internal causes [35,36]. These findings were in line with those found for Mathematics [28]. In this study, however, knowledge is increased in other basic academic areas such as Language and Literature, according to the attributional styles of the different SRB profiles for this subject.
Among the four latent groups identified, statistically significant differences with large effect sizes were found for reading failure due to lack of ability between the low and high mixed SRB profiles and between the SRB by positive reinforcement and the high mixed SRB profiles. In both cases, the high mixed SRB profile was more likely to attribute their failures to a lack of ability and effort compared to the other profiles. Regarding the attributions of success, statistically significant differences were found among the four groups with small and moderate effect sizes. Specifically, the SRB by positive reinforcement and the low SRB profiles were, respectively, the groups that were the most likely to attribute their successes to ability, effort, and external causes compared to the high mixed and mixed SRB groups. These findings call for a more cautious approach in drawing firm conclusions because these attributional patterns may be affected by other personal and contextual variables. School disengagement, conflictual relationships with peers and teachers, academic failure, or eventual dropout can be other variables affecting the students’ school attendance and their attributional styles [37,38]. All these factors are likely to cause frustration and should be considered in future research.
This research has certain limitations that should be considered for future work. This study should be based on a larger and more diverse sample, considering other key variables such as birth country, health, psychological record, and differences between schools. Different sources of data collection are likely to be included in future surveys, such as interviews, observations, questionnaires, and personal data (family, teachers, and classmates). Furthermore, research should also consider immediate environments and broader contexts that may impact individual behaviour [39]. Finally, although this study has assessed 926 Spanish children, these results cannot be generalised to older age groups or cultures. These findings should be corroborated with those of other age ranges and nationalities, also analysing higher levels of education. Similarities between our findings and those obtained for Mathematics suggest that attributional styles of school refusers may similarly affect different subjects. However, additional research is necessary to analyse other variables such as the teaching style, school climate, or parent-teacher-school partnership, which could affect the students’ academic achievement and attributional style [28,37,38,39,40,41,42].
The associations found between different SRB profiles and academic self-attribution in Language and Literature can be used by professionals as an empirical basis for the development of preventive and intervention actions that promote school adjustment. These findings are of great relevance since they offer practical implications at an educational and psychological level. From an educational perspective, some teaching practices in line with the emerging educational philosophy based on the Sustainable Learning Education framework may help strengthen students’ self-efficacy, motivation, and confidence. Sustainable Learning Education (SLE) is a fairly new term that refers to a set of educational practices in which knowledge is co-created and shared in the community [43]. Teaching with SLE-orientation aids educators in promoting proactive and intentional learning. SLE includes teaching learners to be open-minded, inquire, and rebuild to cope with complex and challenging circumstances that require learning [44]. Innovative methodologies, cooperative learning strategies, self-evaluation, group cohesion, involving students in decision-making processes, and effective coping strategies to address school problems may help improve educational achievement.
From a psychological perspective, interventions based on the positive psychology principles have shown important changes in students’ disposition to make sound personal decisions and prepares them to positively meet imposing present and future challenges [45]. The study of academic variables such as self-attribution that can affect SAPs is essential for the development of responsible behaviours and maintaining good attitudes towards school. Developing cognitive and affective skills, such as empathy and critical thinking, is one of the main objectives of the SLE and can be useful for those students who present a maladaptive academic attributional style.

6. Conclusions

This study offers initial evidence about the practical significance of understanding how academic self-attributional styles influences school refusal behaviour. Although this study has provided useful data suggesting that academic attributional style is a significant variable in explaining the reasons why some students refuse to go to school, further research regarding the relationship between SRB profiles and attributions in the area of Language and Literature is required. Our findings increase the understanding that not all school refusers have identical attributional patterns, and therefore, psychoeducational intervention programs should attempt to correct maladaptive attributional styles and encourage more optimistic beliefs regarding achievement [46,47,48,49]. Appropriate academic attributional styles, in which students attribute successes and failures to effort, are recommended from early childhood [23]. Improving reactions to failure through cognitive interventions can help students have better attitudes toward school [3]. Specifically, attributional retraining interventions must be promoted because they can be easily implemented as a part of developmental guidance programs for any student [50,51]. This would surely increase the internal motivation and self-efficacy of students, preventing school attendance problems.

Author Contributions

Conceptualization, C.G., M.G.-M. and M.V.; methodology, R.S. and M.J.Q.; formal analysis, R.S. and J.M.G.-F.; investigation, C.G. and M.G.-M.; data curation, R.S. and M.J.Q.; writing—original draft preparation, C.G. and M.G.-M.; writing—review and editing, C.G., M.V. and M.J.Q.; supervision, R.S. and J.M.G.-F.; funding acquisition, J.M.G.-F. and C.G. All the authors contributed equally to the research design, data analysis, and revision and approved the final manuscript All authors have read and agreed to the published version of the manuscript.

Funding

This research was funded by the Ministry of Science, Innovation and Universities and Fondos FEDER with the grant number RTI2018-098197-B-I00 awarded to J.M.G.-F. and the project GV/2019/075 awarded to C.G.

Institutional Review Board Statement

The study was conducted according to the guidelines of the Declaration of Helsinki, and approved by the Ethics Committee of University of Alicante (UA-2017-09-05).

Informed Consent Statement

Informed consent was obtained from all subjects involved in the study.

Data Availability Statement

The data presented in this study are available on request from the corresponding author.

Conflicts of Interest

The authors declare no conflict of interest.

References

  1. Ministerio de Educación y Formación Profesional. PISA 2018. Programa para la Evaluación Internacional de los Estudiantes. Informe español; Secretaría General Técnica: Madrid, Spain, 2019. [Google Scholar]
  2. Orozco, J.I.C. Absentismo escolar en España. Datos y reflexiones. Contextos Educ. Rev. Educ. 2020, 26, 121–135. [Google Scholar] [CrossRef]
  3. Kee, T.T.S. Attributional Style and School Truancy. Early Child Dev. Care 2001, 169, 21–38. [Google Scholar] [CrossRef]
  4. Mills, C. From ‘Invisible Problem’ to Global Priority: The Inclusion of Mental Health in the Sustainable Development Goals. Dev. Chang. 2018, 49, 843–866. [Google Scholar] [CrossRef] [Green Version]
  5. Zárate-Santana, Z.-J.; Patino-Alonso, M.-C.; Sánchez-García, A.-B.; Galindo-Villardón, P. Learning Approaches and Coping with Academic Stress for Sustainability Teaching: Connections through Canonical Correspondence Analysis. Sustainability 2021, 13, 852. [Google Scholar] [CrossRef]
  6. Kearney, C.A. School absenteeism and school refusal behavior in youth: A contemporary review. Clin. Psychol. Rev. 2008, 28, 451–471. [Google Scholar] [CrossRef]
  7. Kearney, C.A. Helping Families of Youth with School Attendance Problems: A Practical Guide for Mental Health and School-Based Professionals; Oxford University Press: Oxford, MI, USA, 2019. [Google Scholar]
  8. Kearney, C.A. Helping School Refusing Children and Their Parents: A Guide for School-Based Professionals; Oxford University Press: Oxford, MI, USA, 2008. [Google Scholar]
  9. Kearney, C.A.; Silverman, W.K. Measuring the Function of School Refusal Behavior: The School Refusal Assessment Scale. J. Clin. Child Psychol. 1993, 22, 85–96. [Google Scholar] [CrossRef]
  10. Kearney, C.A. Identifying the Function of School Refusal Behavior: A Revision of the School Refusal Assessment Scale. J. Psychopathol. Behav. Assess. 2002, 24, 235–245. [Google Scholar] [CrossRef]
  11. Gonzálvez, C.; Kearney, C.A.; Jiménez-Ayala, C.E.; Sanmartín, R.; Vicent, M.; Inglés, C.J.; García-Fernández, J.M. Functional profiles of school refusal behavior and their relationship with depression, anxiety, and stress. Psychiatry Res. 2018, 269, 140–144. [Google Scholar] [CrossRef]
  12. Delgado, B.; Martinez-Monteagudo, M.C.; Esteban, C.R.; Rubio, E. Latent Class Analysis of School Refusal Behavior and Its Relationship With Cyberbullying During Adolescence. Front. Psychol. 2019, 10, 1916. [Google Scholar] [CrossRef] [Green Version]
  13. Gonzálvez, C.; Díaz-Herrero, Á.; Sanmartín, R.; Vicent, M.; Pérez-Sánchez, A.M.; García-Fernández, J.M. Identifying Risk Profiles of School Refusal Behavior: Differences in Social Anxiety and Family Functioning Among Spanish Adolescents. Int. J. Environ. Res. Public Health 2019, 16, 3731. [Google Scholar] [CrossRef] [Green Version]
  14. Gonzálvez, C.; Díaz-Herrero, Á.; Vicent, M.; Sanmartín, R.; Pérez-Sánchez, A.M.; García-Fernández, J.M. Subtyping of Adolescents with School Refusal Behavior: Exploring Differences across Profiles in Self-Concept. Int. J. Environ. Res. Public Health 2019, 16, 4780. [Google Scholar] [CrossRef] [PubMed] [Green Version]
  15. Gallé-Tessonneau, M.; Johnsen, D.B.; Keppens, G.A. The relationship between mental health and school absenteeism in a community sample of French secondary school students: Four profiles derived from cluster analysis. Eur. J. Educ. Psychol. 2019, 12, 77. [Google Scholar] [CrossRef]
  16. Zhou, A.; Guan, X.; Ahmed, Z.; Ahmed, O.; Jobe, M.; Hiramoni, F. An Analysis of the Influencing Factors of Study Engagement and Its Enlightenment to Education: Role of Perceptions of School Climate and Self-Perception. Sustainability 2021, 13, 5475. [Google Scholar] [CrossRef]
  17. Egger, H.L.; Costello, J.E.; Angold, A. School Refusal and Psychiatric Disorders: A Community Study. J. Am. Acad. Child Adolesc. Psychiatry 2003, 42, 797–807. [Google Scholar] [CrossRef] [Green Version]
  18. Dube, S.R.; Orpinas, P. Understanding Excessive School Absenteeism as School Refusal Behavior. Child. Sch. 2009, 31, 87–95. [Google Scholar] [CrossRef]
  19. Dembo, R.; Wareham, J.; Schmeidler, J.; Winters, K.C. Exploratory two-level analysis of individual- and school-level factors on truant youth emotional/psychological functioning. J. Educ. Res. 2016, 109, 596–607. [Google Scholar] [CrossRef] [Green Version]
  20. Kearney, C.; Cook, L.; Chapman, G. School Stress and School Refusal Behavior. In Encyclopedia of Stress; Elsevier BV: Amsterdam, The Netherlands, 2007; Volume 3, pp. 422–425. [Google Scholar]
  21. Prabhuswamy, M. To go or not to go: School refusal and its clinical correlates. J. Paediatr. Child Health 2018, 54, 1117–1120. [Google Scholar] [CrossRef]
  22. Weiner, B. An Attributional Theory of Motivation and Emotion; Springer: New York, NY, USA, 1986. [Google Scholar]
  23. Weiner, B. Attribution Theory Revisited; Transforming Cultural Plurality into Theoretical Unity. In Big Theories Revisited: Research on Socio-Cultural Influences on Motivation and, Learning; McInerney, D., Van Etten, S., Eds.; Information Age Publishing: Greenwich, CT, USA, 2004; pp. 13–29. [Google Scholar]
  24. Weiner, B. Attribution Theory, Achievement Motivation, and the Educational Process. Rev. Educ. Res. 1972, 42, 203–215. [Google Scholar] [CrossRef]
  25. Weiner, B. Human Motivation: Metaphors, Theories, and Research; SAGE: Newbury Park, CA, USA, 1992. [Google Scholar]
  26. Genç, G. Attributions to Success and Failure in English Language Learning: The Effects of Gender, Age and Perceived Success. Eur. J. Educ. Stud. 2016, 12, 26–43. [Google Scholar] [CrossRef]
  27. Weiner, B.; Graham, S. Attribution in personality psychology. In Handbook of Personality: Theory and Research; Pervin, L.A., John, O.P., Eds.; Guildford Press: New York, NY, USA, 1990; pp. 605–628. [Google Scholar]
  28. Gonzálvez, C.; Sanmartín, R.; Vicent, M.; Inglés, C.J.; Aparicio-Flores, M.P.; García-Fernández, J.M. Academic self-attributions for success and failure in mathematics and school refusal. Psychol. Sch. 2018, 55, 366–376. [Google Scholar] [CrossRef]
  29. Gonzálvez, C.; Kearney, C.A.; Martín, N.L.-S.; Sanmartín, R.; Vicent, M.; Inglés, C.J.; García-Fernández, J.M. School refusal assessment scale-revised: Factorial invariance and latent means differences across gender and age in Spanish children. Front. Psy. 2016, 7, 2011. [Google Scholar] [CrossRef] [Green Version]
  30. Marsh, H.W. Relations among dimensions of self-attribution, dimensions of self-concept, and academic achievements. J. Educ. Psychol. 1984, 76, 1291–1308. [Google Scholar] [CrossRef]
  31. GonzálezPumariega, S.; Núñez, J.C.; González-Pienda, J.A. Atribuciones causales en alumnos con y sin dificultades de aprendizaje. Magister 1996, 14, 217–244. [Google Scholar]
  32. World Medical Association. Declaration of Helsinki. In Ethics of Research with Human Subjects; Sugarman, I.J., Mastroianni, A.C., Kahn, J.P., Eds.; University Publishing Group: Frederick, MD, USA, 1998; pp. 14–18. [Google Scholar]
  33. Spurk, D.; Hirschi, A.; Wang, M.; Valero, D.; Kauffeld, S. Latent profile analysis: A review and “how to” guide of its application within vocational behavior research. J. Vocat. Behav. 2020, 120, 103445. [Google Scholar] [CrossRef]
  34. Cohen, J. Statistical Power Analysis for the Behavioral Sciences, 2nd ed.; Lawrence Erlbaum Associates: Hillsdale, NJ, USA, 1988. [Google Scholar]
  35. Baten, E.; Pixner, S.; Desoete, A. Motivational and Math Anxiety Perspective for Mathematical Learning and Learning Difficulties. In International Handbook of Mathematical Learning Difficulties; Fritz, A., Haase, V.G., Räsänen, P., Eds.; Springer: New York, NY, USA; pp. 457–467.
  36. Ramirez, G.; Shaw, S.T.; Maloney, E.A. Math Anxiety: Past Research, Promising Interventions, and a New Interpretation Framework. Educ. Psychol. 2018, 53, 145–164. [Google Scholar] [CrossRef]
  37. Carroll, H. (Tim) The peer relationships of primary school pupils with poor attendance records. Educ. Stud. 2011, 37, 197–206. [Google Scholar] [CrossRef]
  38. Havik, T.; Bru, E.; Ertesvåg, S.K. School factors associated with school refusal- and truancy-related reasons for school non-attendance. Soc. Psychol. Educ. 2015, 18, 221–240. [Google Scholar] [CrossRef]
  39. Park, M.-H.; Yim, H.-W.; Park, S.; Lee, C.; Lee, C.-U.; Hong, S.C.; Jeong, J.-H.; Seo, H.-J.; Jeong, S.H.; Jo, S.-J.; et al. School refusal behavior in South Korean first graders: A prospective observational community-based study. Psychiatry Res. 2015, 227, 160–165. [Google Scholar] [CrossRef]
  40. Bacon, V.R.; Kearney, C.A. School climate and student-based contextual learning factors as predictors of school absenteeism severity at multiple levels via CHAID analysis. Child. Youth Serv. Rev. 2020, 118, 105452. [Google Scholar] [CrossRef]
  41. Hendron, M.; Kearney, C.A. School Climate and Student Absenteeism and Internalizing and Externalizing Behavioral Problems. Child. Sch. 2016, 38, 109–116. [Google Scholar] [CrossRef]
  42. Al-Hail, M.; Al-Fagih, L.; Koç, M. Partnering for Sustainability: Parent-Teacher-School (PTS) Interactions in the Qatar Education System. Sustainability 2021, 13, 6639. [Google Scholar] [CrossRef]
  43. Woolis, D.D. Sustainable Learning Framework; Carey Institute for Global Good: Rensselaerville, NY, USA, 2018. [Google Scholar]
  44. Ben-Eliyahu, A. Sustainable Learning in Education. Sustainability 2021, 13, 4250. [Google Scholar] [CrossRef]
  45. Ampuero, D.A.; Miranda, C.; Goyen, S. Positive psychology in education for sustainable development at a primary-education institution. Local Environ. 2015, 20, 745–763. [Google Scholar] [CrossRef]
  46. Cleary, T.J.; Zimmerman, B.J. Self-regulation empowerment program: A school-based program to enhance self-regulated and self-motivated cycles of student learning. Psychol. Sch. 2004, 41, 537–550. [Google Scholar] [CrossRef] [Green Version]
  47. DiPerna, J.C.; Lei, P.; Bellinger, J.; Cheng, W. Effects of a universal positive classroom behavior program on student learning. Psychol. Sch. 2016, 53, 189–203. [Google Scholar] [CrossRef]
  48. Pincus, R.; Hannor-Walker, T.; Wright, L.; Justice, J. COVID-19’s Effect on Students: How School Counselors Rise to the Rescue. NASSP Bull. 2020, 104, 241–256. [Google Scholar] [CrossRef]
  49. Lee, J.; Lim, H.; Allen, J.; Choi, G. Effects of Learning Attitudes and COVID-19 Risk Perception on Poor Academic Performance among Middle School Students. Sustainability 2021, 13, 5541. [Google Scholar] [CrossRef]
  50. Sukariyah, M.B.; Assaad, G. The Effect of Attribution Retraining on the Academic Achievement of High School Students in Mathematics. Procedia Soc. Behav. Sci. 2015, 177, 345–351. [Google Scholar] [CrossRef] [Green Version]
  51. Wilson, T.D.; Damiani, M.; Shelton, N. Improving the Academic Performance of College Students with Brief Attributional Interventions; Academic Press: New York, NY, USA, 2002; pp. 89–108. [Google Scholar] [CrossRef]
Figure 1. Functional model of school refusal behaviour.
Sustainability 13 07512 g001
Figure 2. School refusal behaviour profiles.
Sustainability 13 07512 g002
Table 1. Data fit of all models.
ModelsAICBICBIC-AdjustedLRT
p
LRT-AdjustedBLRTEntropySize
210,361.2410,424.0410,382.76<0.001<0.001<0.0010.990
310,019.7710,106.7210,049.56<0.001<0.001<0.0010.930
49886.809997.919924.86<0.001<0.001<0.0010.860
59775.549910.809821.88<0.001<0.001<0.0010.871
69690.389849.809745.000.050.06<0.0010.891
79676.079859.649738.950.450.450.670.801
Note. AIC = Akaike Information Criterion; BIC = Bayesian Information Criteria; LRT = Vuong-Lo-Mendell-Rubin Likelihood-Ratio Test; BLRT = Bootstrap Likelihood Ratio Test.
Table 2. Means and standard deviations obtained by the four profiles of school refusal behaviour in SAS dimensions.
SAS
Dimensions
Low
SRB
SRB by Positive ReinforcementMixed
SRB
High Mixed
SRB
Statistical Significance
MSDMSDMSDMSDF(3,922)η2P
Reading Ability Success3.311.093.331.132.881.312.491.5715.58 *0.05
Reading Effort Success3.440.993.451.013.061.163.080.847.54 *0.02
Reading External Success4.030.994.181.123.850.943.521.128.93 *0.03
Reading Ability Failure1.141.071.041.091.781.252.310.9339.46 *0.11
Reading Effort Failure1.551.011.691.111.921.032.310.7016.25 *0.05
Reading External Failure4.410.954.541.034.131.033.831.1212.27 *0.04
Note. SAS = Sydney Attribution Scale; SRB = School Refusal Behaviour; * p < 0.001.
Table 3. Cohen’s d value for post-hoc contrasts between profiles on SAS dimensions.
SAS DimensionsLow SRB vs. SRB Positive ReinforcementLow SRB vs. Mixed SRBLow SRB vs. High Mixed SRBSRB Positive Reinforcement vs. Mixed SRBSRB Positive Reinforcement vs. High Mixed SRBMixed SRB vs. High Mixed SRB
Reading Ability Success-0.380.700.370.65-
Reading Effort Success-0.370.370.360.39-
Reading External Success--0.510.320.59-
Reading Ability Failure-−0.58−1.11−0.64−1.22−0.46
Reading Effort Failure-−0.37−0.78-−0.63−0.42
Reading External Failure-0.290.600.400.67-
Note. SAS = Sydney Attribution Scale; SRB = School Refusal Behaviour.
Publisher’s Note: MDPI stays neutral with regard to jurisdictional claims in published maps and institutional affiliations.

