
Parametric Design and Comfort Optimization of Dynamic Shading Structures


Department of Architecture, Universidad de las Americas Puebla, San Andres Cholula 72810, Mexico
*
Authors to whom correspondence should be addressed.
Sustainability 2021, 13(14), 7670; https://0-doi-org.brum.beds.ac.uk/10.3390/su13147670
Submission received: 24 May 2021
/
Revised: 30 June 2021
/
Accepted: 5 July 2021
/
Published: 9 July 2021
(This article belongs to the Special Issue Green Building Energy System Integration and Eco-Friendly Urban Development)
Abstract
:This work implements parametric tools to optimize the environmental design of urban adaptive shadings through multiobjective evolutionary algorithms that look for solutions of dynamic (time-changing) structures used in open public spaces. The proposal is located in Malecon Cancun Tajamar in the southeast part of Mexico, and the main objective is to enhance the thermal comfort of users as well as to become part of the social dynamics of the place reinforcing identity through appropriation. The proposed workflow includes four steps: (1) geometric modelling by parametric modelling tools; (2) simulation of environmental parameters by using BPS tools; (3) shape optimization by using an evolutionary algorithm; and (4) environmental verification of the results. The Universal Thermal Climate Index (UTCI) was used to assess the outdoor thermal comfort derived from the dynamic shadings. The results showed a significant improvement in the thermal comfort with absolute UTCI differences of 3.9, 7.4, and 3.1 °C at 8, 12, and 16 h, respectively, during the summer; and absolute differences of 1.4, 3.5, and 2 °C at 8, 12, and 16 h, respectively, during the winter. The proposed workflow can help to guide the early design process of dynamic shadings by finding optimal solutions that enhance outdoor thermal comfort.
1. Introduction
Urban livability refers to the quality of life and wellbeing of residents in cities [1]. The concept includes the impact of environmental and climatic factors such as air temperature, air, and water quality, wind speed, relative humidity, solar radiation, and qualitative indicators of quality of life, pleasure, and joy [2,3]. Among these, the consideration of thermal comfort has been a focus of interest as urban climate affects all aspects of the city including building interiors, city architecture, and open spaces [1]. Hence, it has been seen that thermal comfort of urban open spaces promotes social life, interrelations of residents, and economic activities; or contrarily, enhances isolation and social exclusion [4].
Urban livability is also concerned with the aesthetics and physical characteristics of buildings, streets, and development blocks: “Creating pedestrian-friendly enclosures and neighborhoods where residents can conveniently walk from home to school, and parks are central to the vision of livable cities of new urbanists [5].” In addition to this, all the elements that configure the urban public space should contribute to the appropriation of its users; the public space is not only the place of encounter, but also the place where citizenship is built and identity is reinforced [6]. Essentially, this means that when considering the quality of public space, it must be taken into consideration that there are also intangible factors that are key to the success of the intervention in the urban environment.
It is therefore important to create comfortable thermal environments in urban open spaces that promote an intensive use of places boosting its role not only as leisure or resting facilities but also as part of the population’s daily experience. Designers and planners require guides with a comprehensive understanding of outdoor thermal comfort to improve the living conditions of cities. It is important that these elements also take into account its symbolic possibilities.
Shadings are an important factor in urban outdoors since they can block direct solar radiation and affect thermal environments and long-term thermal comfort. The role of shadings on outdoor thermal comfort has been examined in several studies under different climatic conditions [7,8,9,10,11,12]. Most of these studies have been conducted in temperate and cold climates, and some of them were conducted in subtropical humid climates. Their findings have provided valuable information on understanding the effects of outdoor climatic conditions on people’s thermal sensation as well as the use of outdoor spaces.
In [13], researchers discussed the shading effect on long-term outdoor thermal comfort in a hot and humid climate, finding that different shading levels contribute to variation in the thermal perception distribution. They also found that the frequencies of hot discomfort at the shaded locations were significantly lower than that of barely shaded spaces. In the end, the authors recommended multiple shading types and different shading levels for outdoor space design to allow users to choose their preferred thermal comfort condition.
In [14], researchers conducted an investigation in hot and humid regions, reiterating the importance of shade in outdoor environments and discussing the thermal requirements based on characteristics of local residents. They found that few people visit squares when the thermal index is high, whereas the largest number of people visiting the outdoors is when the thermal condition is close to their thermal comfort range. An interesting finding derived from this study was that solar radiation and the level of shading play more important roles than the air temperature and wind speed in outdoor spaces.
Similarly, thermal comfort in outdoor urban spaces was studied in [15], finding that the sun sensation/solar radiation has the most significant influence on human thermal sensation in outdoor spaces in tropical climates. According to [16], the most important parameters that determine the use of public space are air temperature and solar radiation, with differences depending on the time of day. Other authors [17] also pointed out the importance of the shade, together with the geometry, shape, and density of urban morphology to understand the climatic conditions and thermal comfort.
In [18], the authors examined the seasonal effects on urban street shading and long-term outdoor thermal comfort in subtropical climates. The results suggested that a certain shading level is best for urban streets; thus, some shading devices may be added in the summer and removed in the winter. Correlation analysis revealed that thermal comfort is best when a location is shaded in the spring, summer, and autumn; in the winter, thermal comfort is best when a location has little shade.
In [19], a bus stop shade was designed for three different climates that ranged from hot to cold. The aim was to minimize the amount of shade material and to allow occupants to be comfortable. A new method named ComfortCover was proposed, consisting of three main steps. First, the method assessed the radiation falling on a person in order to calculate the solar-adjusted radiant temperature. Then, calculations of the Universal Thermal Climate Index (UTCI) were run to identify ranges of thermal stress. Lastly, sun projections from the location of a person through the shade were considered. In the end, the method demonstrated to be suitable for most design applications and flexible within the visual programming of Grasshopper through Ladybug tools.
Based on the above review, it can be seen that most of the outdoor thermal comfort studies have been traditionally developed in temperate cities [20], but research in tropical or equatorial zones has been increasing [21]. As much urbanization occurs in these low-latitude areas, these settlements are also enhancing their development and management of urban spaces [22]. Therefore, it is worth carrying out a study to evaluate the outdoor thermal environment conditions and human thermal comfort in a tropical climate of Mexico. This particular climatic and geographical region was selected in this work as the first approach to assess the shading effect on outdoor thermal comfort.
From the literature review, it was also observed that many researchers have tested the role of shadings in outdoor environments as an important strategy to improve pedestrian comfort. Conclusions from these investigations indicated the advantages of using ‘different shading levels’ for outdoor spaces allow users to choose their preferred thermal condition. However, these conclusions were projections based on their findings, but neither dynamic nor movable structures were explored. Instead, different types of fixed shading devices were analyzed at representative times over the year. Therefore, it is also worth assessing the environmental and adaptive design of urban shadings through parametric modelling tools that are nowadays integrated into the architectural design process—for example, the use of movable devices that change their design parameters (e.g., rotational and folding angles) according to seasonal variation and times of day.
Today, that research gap can be fulfilled with the advantage of computational tools: (1) The outdoor thermal comfort can be studied through ‘Building Performance Simulation (BPS)’ tools that allow detailed analysis for environmentally conscious architectural designs. (2) The dynamic design (many different solutions) can be systematically tested through the variation of several design parameters by using ‘Parametric Design’. The general idea behind Parametric Design is to use mathematical algorithms to optimize certain design goals against a set of design constraints. (3) The optimization design can be accomplished with the use of ‘Evolutionary Algorithms’ [23]. Among these algorithms, the ‘multiobjective optimization’ has the advantage of running detailed analytic tools coupled with comprehensive selection methods, within the Grasshopper interface.
A large and growing body of literature has investigated the performance of shadings with BPS software. Moreover, a growing body of literature deals with Parametric Design—although most of these studies are not focused on buildings’ environmental performance but on the design of complex geometries and structures [24]. Commonly, findings from these two types of analyses are generalizable and applicable to the projects. It is, however, a relatively small body of literature that is concerned with evolutionary algorithms (they are relatively new). These algorithms are mainly used in industry and in areas such as engineering electrical electronics, computer science artificial intelligence, and automation control systems [23].
This work intends to bridge the gap between the study of outdoor thermal comfort and the implementation of parametric tools to optimize the environmental design of urban adaptive shadings. The focus of this approach is to support the use of evolutionary algorithms for the solution of dynamic (time-changing) shadings used in open public spaces that enhance the thermal comfort of dwellers. It is expected that coupling performance simulation tools with parametric design techniques and multiobjective evolutionary algorithms can guide the early design process to find the optimal solutions.
1.1. Benchmarks of Outdoor Thermal Comfort
“The design of open spaces is very important for the urban environment and an understanding of the wide range of effects influencing thermal comfort in these spaces will assist in designing spaces encouraging public use, at different times of the year [11]”. The wide spatial and temporal variability of environmental conditions, the interactions between the physical environment, and the physical, physiological, and psychological mechanisms should be considered when thermal comfort is considered in the outdoor environment [11,25]. A reliable assessment of the thermal environment should also take into account climate factors such as air temperature, air velocity, humidity, mean radiant temperature, metabolic rate, and thermo-physical properties of clothing [26].
There are several indices used for outdoor spaces that have been validated only under outdoor conditions [26]. According to [27], the four most commonly used models employed are Physiologically Equivalent Temperature (PET) [28], Predicted Mean Vote (PMV) [29], Universal Thermal Climate Index (UTCI) [30], and Standard Effective Temperature (SET) [31]. The PMV and SET have a solid basis for indoor use, whereas the UTCI and PET indices have been primarily designed for outdoor use [8].
UTCI and PET are based on thermal exchanges of the human body with the atmosphere and are calculated from body thermal equations. Both indices are characterized by specific input values, such as air temperature, mean radiant temperature, relative humidity, and wind speed, which make these indices robust and reliable [26]. The main difference between the two indices is the human heat-transfer model used to calculate the physiological responses. PET is based on the two-node Munich Energy-balance Model for Individuals (MEMI [32]) and UTCI is based on Fiala’s multinode model [33].
The latter has made significant improvements, such as employing a self-adaptive clothing model [34] and using an integrated physiological response [35] as a criterion when comparing typical indoor and actual environments. Moreover, UTCI has been validated across a broad spectrum of outdoor climate conditions (including weather extremes), seasons, and scales [30]. It is expected that UTCI should become an international standard [36]. Because of UTCI’s validated accuracy, it has been selected to assess the outdoor thermal comfort derived from the dynamic shadings proposed for open public spaces.
The UTCI equivalent temperature for any combination of the prevailing outdoor climate conditions (that is, air temperature, wind speed, radiation, and relative humidity), is then defined as “the air temperature of the reference environment that would elicit the same dynamic response (strain index value) of the physiological model [30].” UTCI is divided into 10 groups ranging from extreme cold stress to extreme heat stress [36], as Table 1 summarizes.
The ‘Moderate heat stress’ category is often subdivided into two [37]: (a) slight heat stress for UTCI ranges between 26 and 28 °C that is comfortable for short periods of time, and (b) moderate heat stress for UTCI ranges between 28 and 32 °C that is hot but not dangerous. For a whole year, a visual scale of comfort is useful to describe the ‘Condition of Person’, for which a stream of integer values from −3 to +3 can be used to facilitate reading and interpretation [38,39]. Table 2 summarizes the visual scale:
1.2. Benchmarks of Optimization Design
The rapid progress in Computer-Aided Design (CAD) and parametric-enabled computational tools has allowed designers to more systematically explore and compare a wider range of different solutions for a given problem. Parametric design is a process of choosing appropriate parameters for a design problem and setting up the model definition that can be used to explore the solution space; thus, the design space can be explored through the variation of the parameters [40].
Building Performance Simulation (BPS) software allows designers to measure practically anything, from the material use and structural strength to comfort and energy performance aspects such as solar radiation, thermal temperature, humidity, etc. Optimization involves algorithms to identify variables and constraints, determine goals, and run simulations to find solutions with an acceptable performance and constraint satisfaction [41].
Integrating parametric design, BPS software and optimization algorithms can help optimize the projects, providing visual and environmental feedback with quantitative data that support the decision making. Several building projects have integrated parametric design with optimization tools to achieve specific targets, such as, reducing energy consumption, improving indoor daylighting and indoor acoustic, etc. An overview of the technique advances was achieved between 1987 and 2014 in [42].
One of the most popular parametric software is Grasshopper [43,44], which interacts with many environmental plugins. Among them, Ladybug [45] is an open-source interface that unites several validated simulation engines, such as Radiance [46] and EnergyPlus [47]. Ladybug runs within parametric visual scripting interfaces, making the design flexible and automated and allowing the exploration of a variety of designs. Several studies have been conducted with Ladybug tools to model and improve thermal comfort in outdoor spaces [19,48]. From here, it was pointed out that Ladybug is advantageous since it could perform a complete annual analysis in a much smaller time than CFD simulations while helping designers to optimize their solutions based on a thermal performance analysis [49].
Grasshopper also allows the integration of single-objective and multiobjective optimization algorithms. Wallacei X is an evolutionary multiobjective optimization engine that allows users to run highly detailed analytic tools coupled with various comprehensive selection methods, such as the K-means as the clustering algorithm [50,51]. Wallacei X allows users to make more informed decisions at all stages of the evolutionary simulations; including the formulation of the design problem, analysis of the outputted results, and selection of the optimized solutions [52].
2. The Study Area
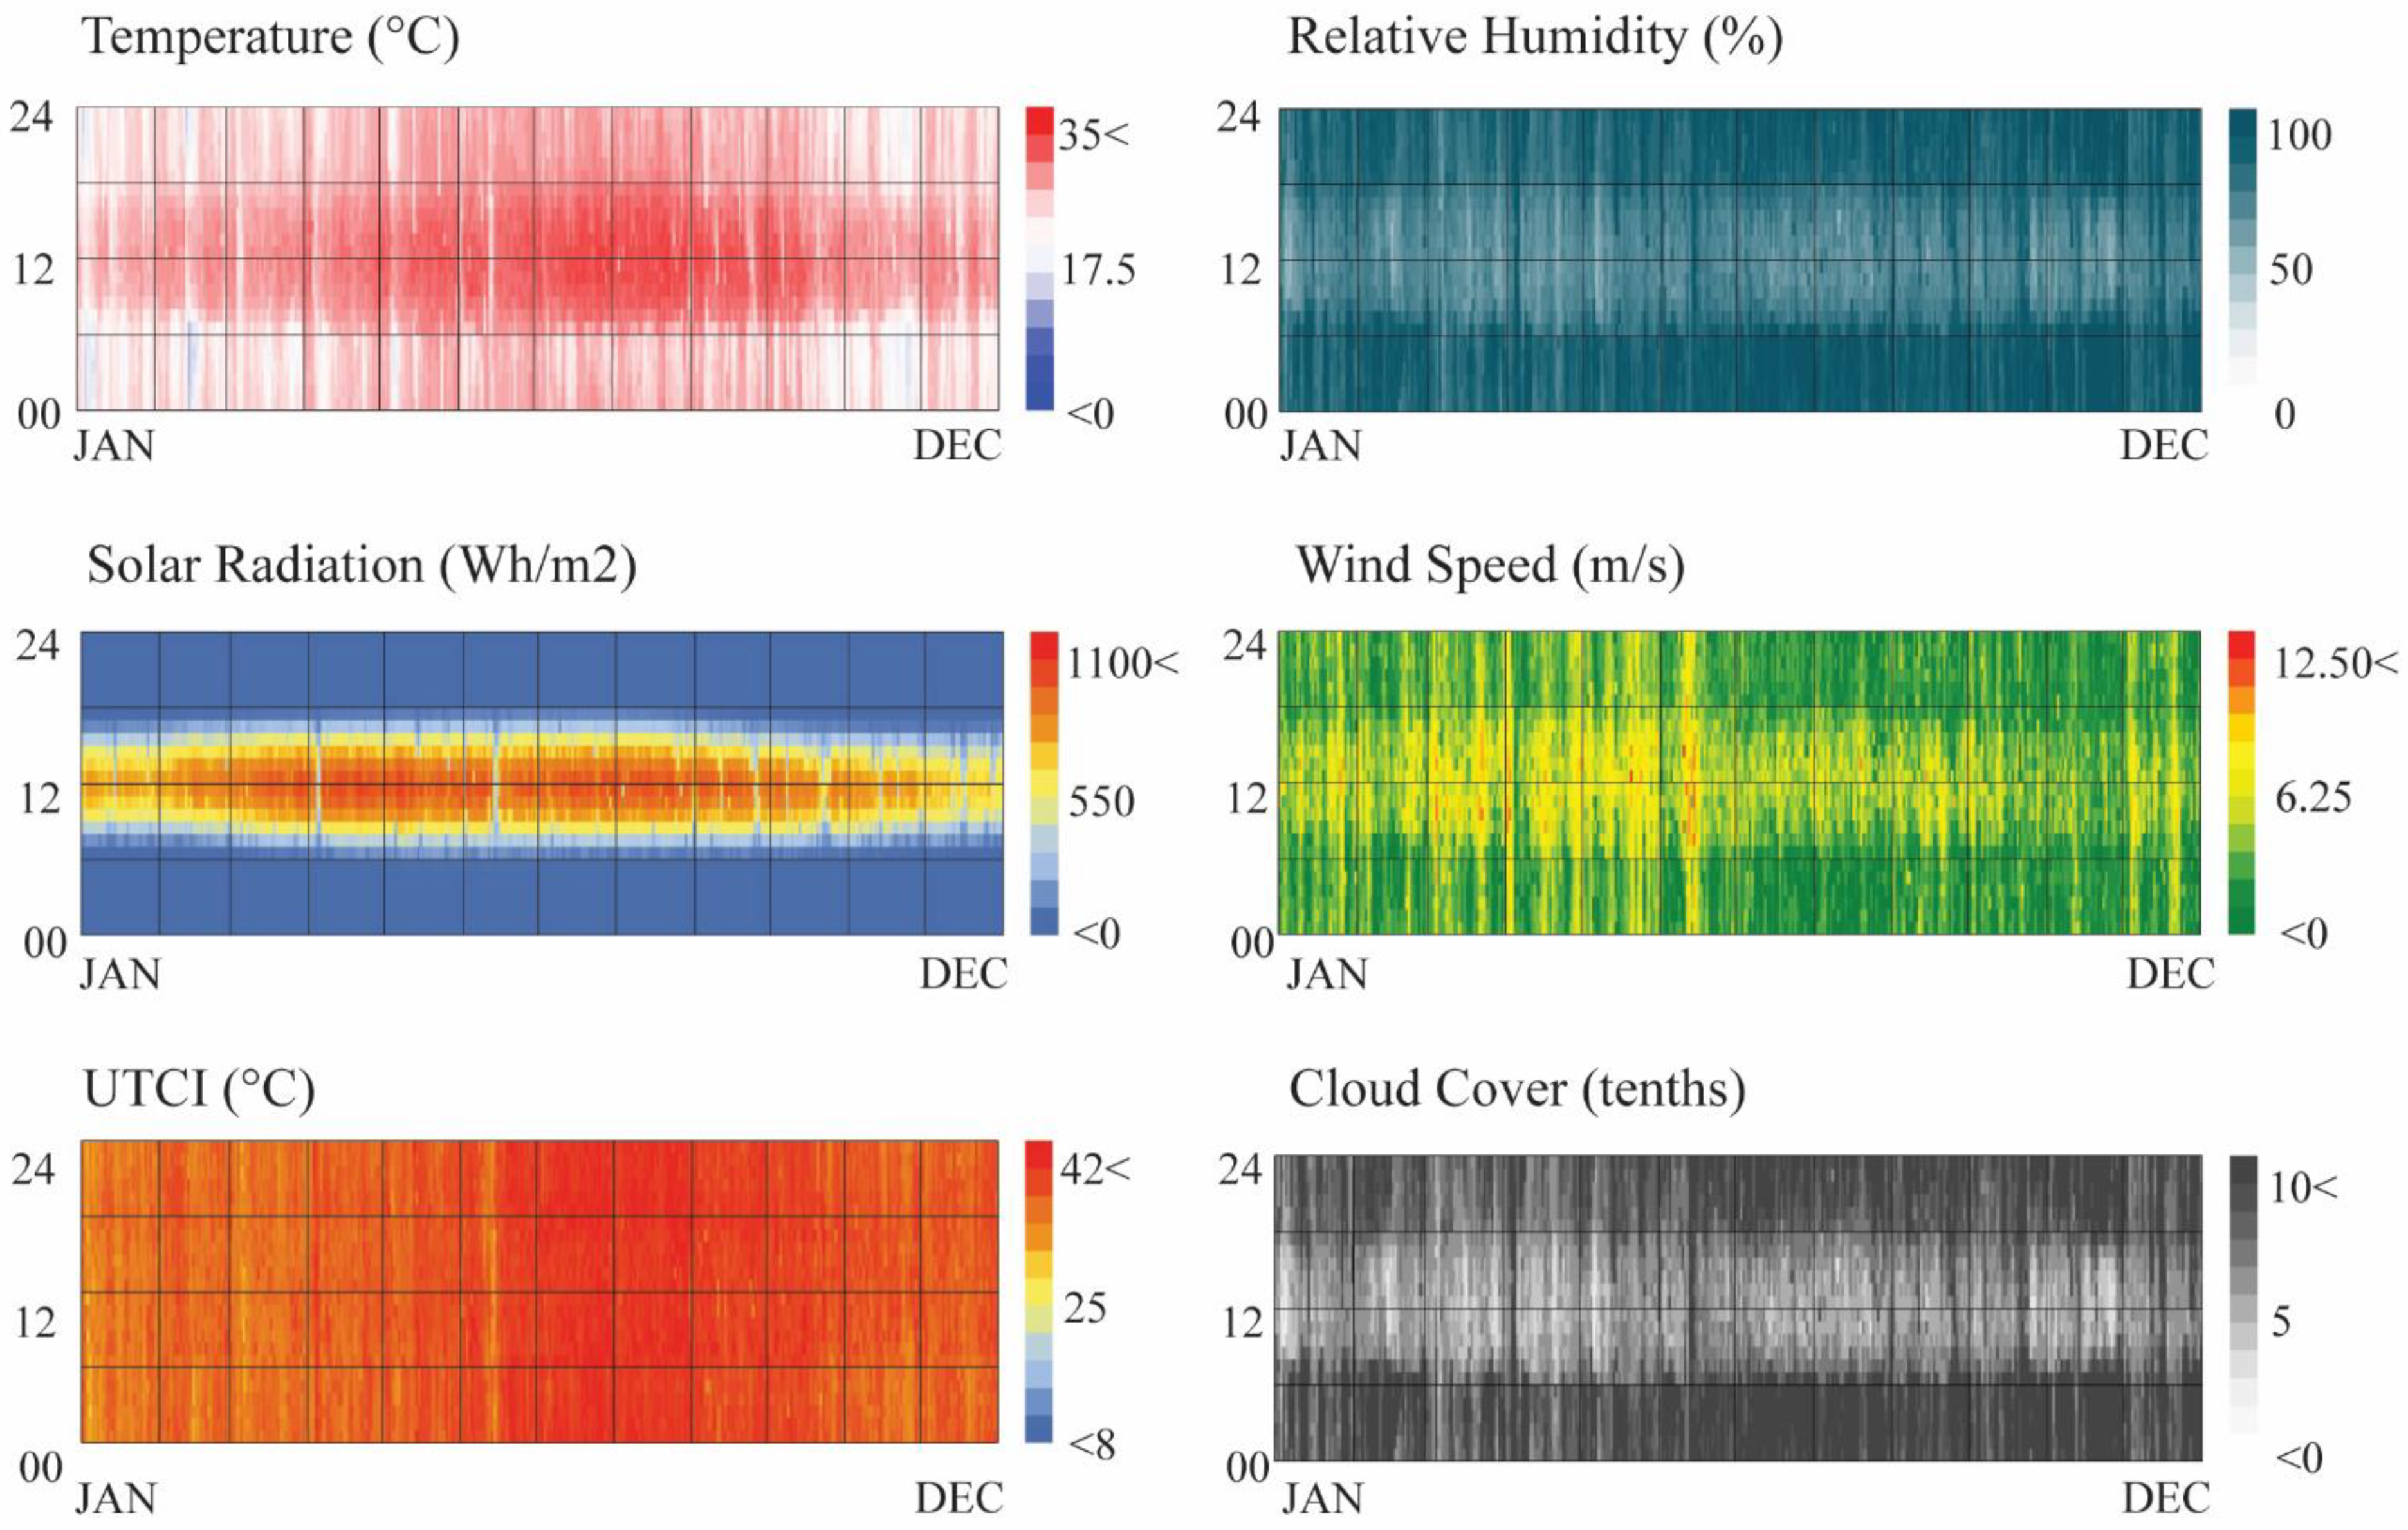
This study was conducted in Cancun, Mexico, a city that is one of the most visited destinations in the Mexican Southeast. Cancun is located at latitude 21°09′ N, with an elevation of ~9 m above sea level. The climate of Cancun is a Tropical Savanna (Aw) according to the Köppen classification. The temperature averages 26.1 °C and the relative humidity 81.5% throughout the year. The EnergyPlus Weather (EPW) file of Cancun was used for the analysis of the climatic factors, which are summarized in Figure 1.
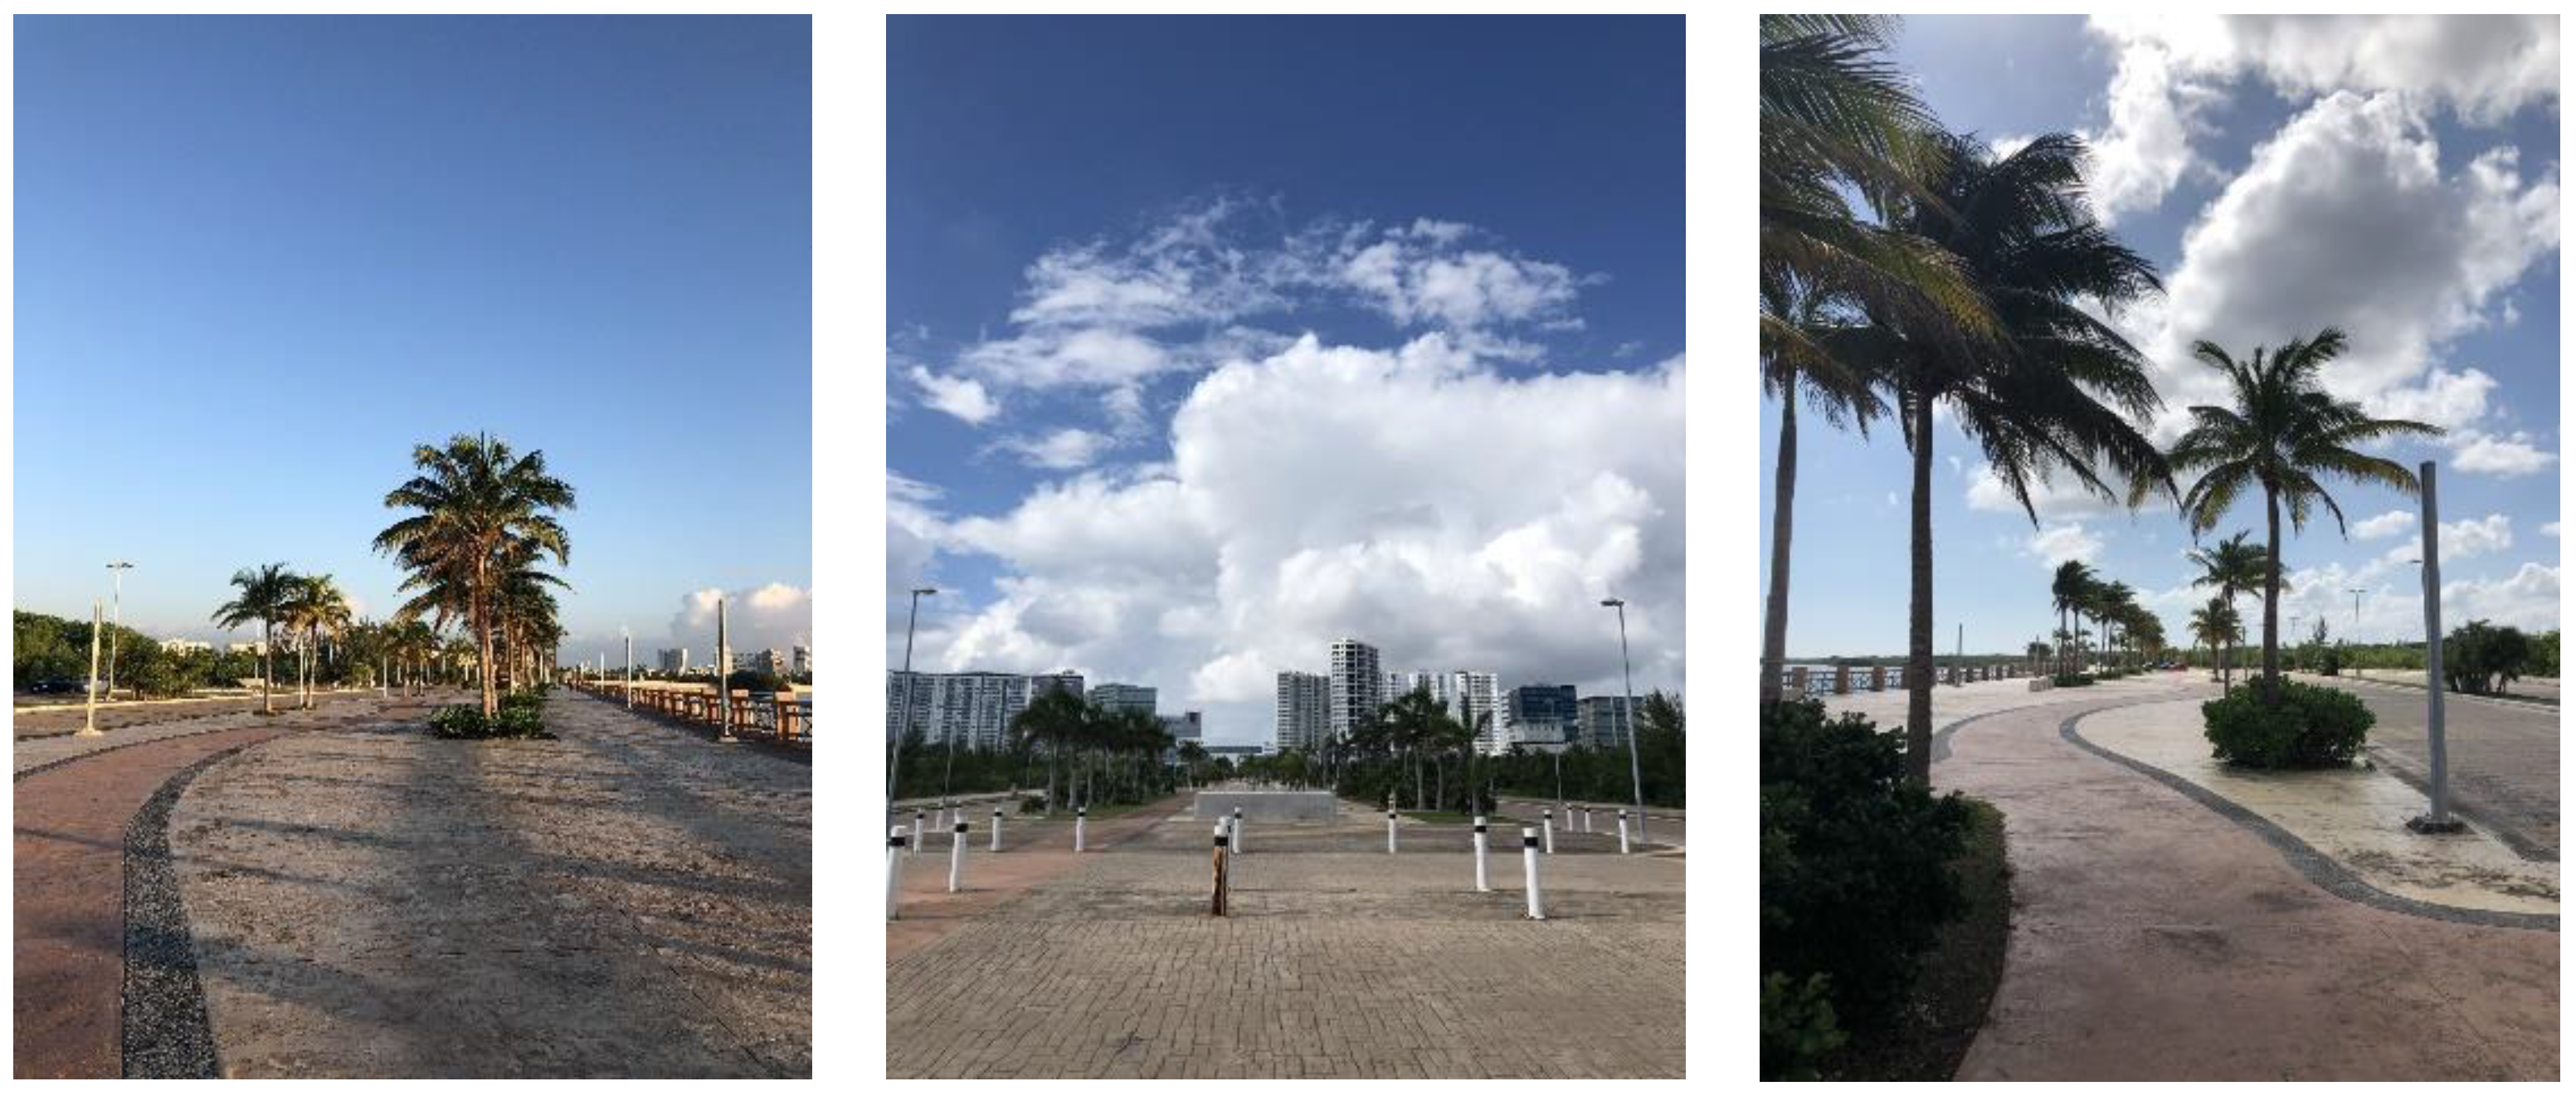
The urban open space selected for this analysis was the Project Malecon Cancun Tajamar. Originally, the Malecon was planned as a real state project, but it only accomplished some paving jobs and sidewalks. The project was interrupted and no buildings were constructed because of the civil society claims that argued the need to protect the existing ecosystems and to preserve the biodiversity of the site. After several negotiations between investors, authorities, and residents, the vocation of the Malecon was changed to be an urban park.
The existing project consists of a boulevard of 617 m length and a median strip of 40 m width, especially for recreational and cultural activities (Figure 2). A public dock will be included in the project, at the Nichupte Lagoon border. Nowadays, the Malecon is mainly visited by locals that enjoy outdoor activities. However, there are no amenities that could help build a richer urban experience.
Considering the potential of this site, it is also important to consider some other aspects concerning urban public space such as those that have to do with appropriation and identity. Thus, the proposed elements should also have the potentiality to become public art structures. Public art aims to develop social dynamics that promote appropriation. This feature should boost its role in the site as not only pieces of urban furniture that enhance the wellbeing of residents and provide a comfortable thermal environment for visitors but also having a symbolic function. They should promote urban decorum. “The possible concept of urban decorum no longer refers to the formal characteristics and rules that make aesthetically appropriate an element (current or historical) or an urban area (current or historical). It derives from the concept of process (artistic, social, therapeutic, communitarian […]), of how this environment or element respects some fundamental rights and values [53]”.
3. Methods
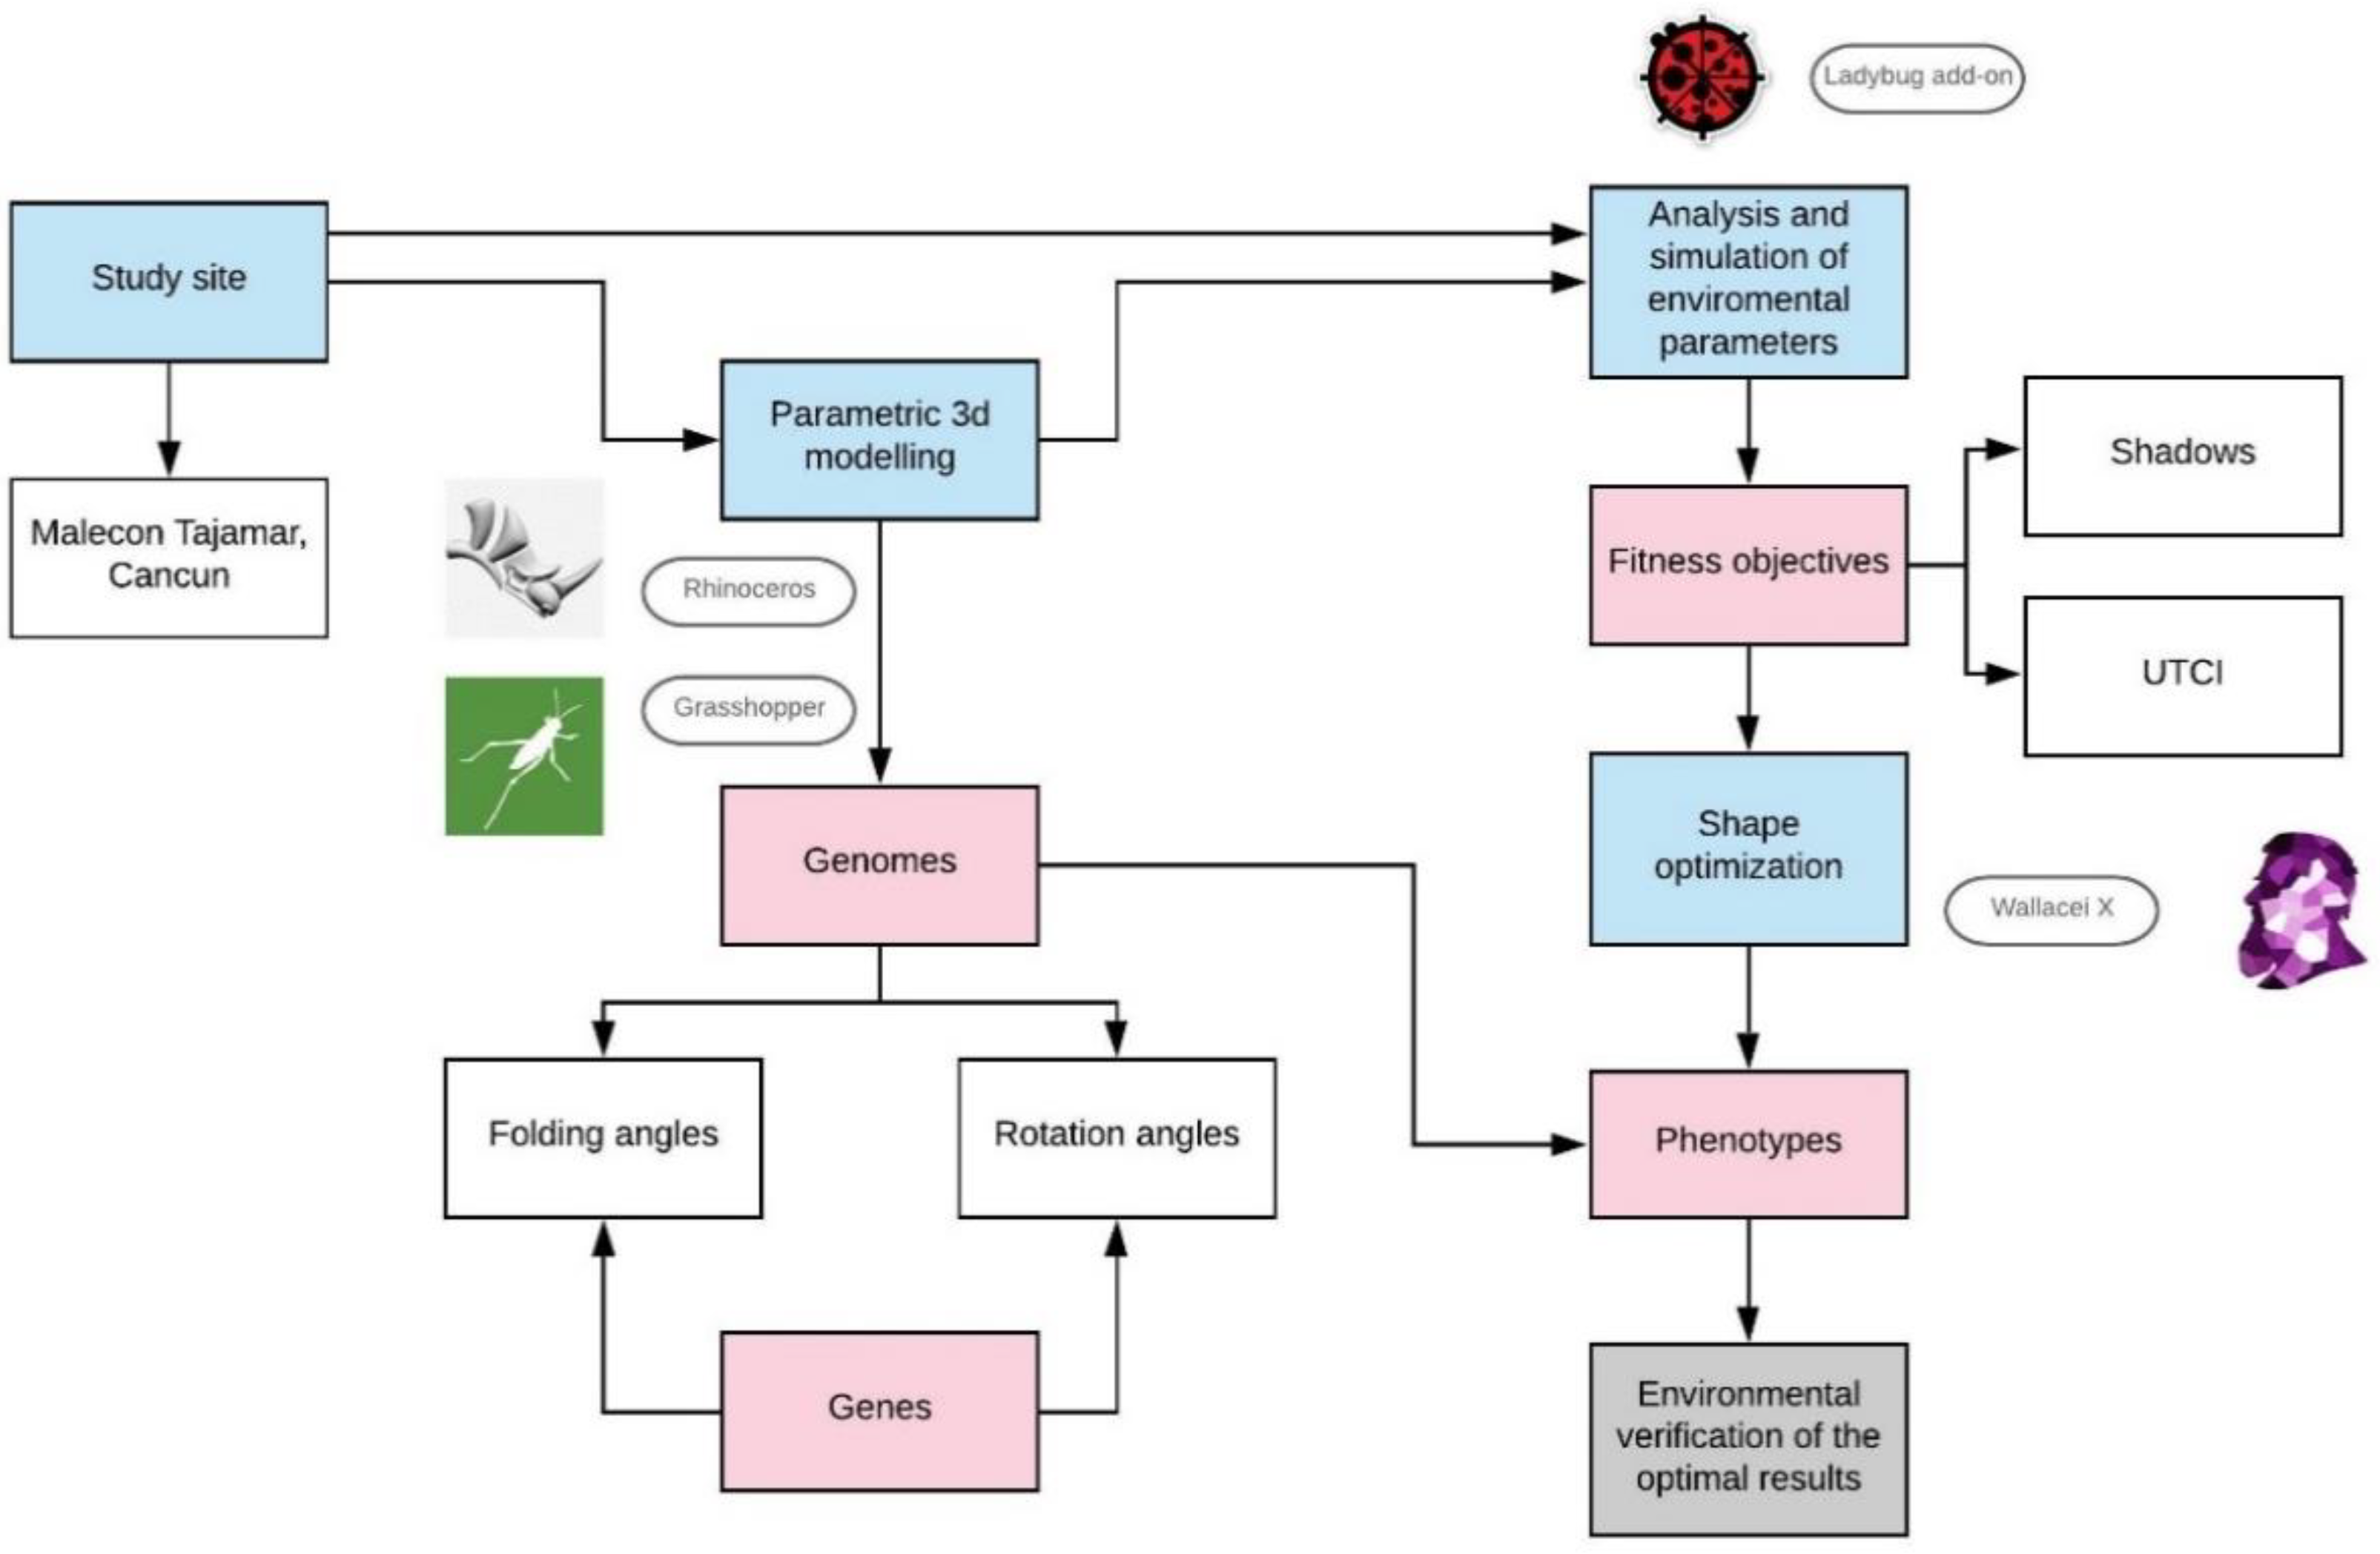
The workflow of this study includes the following four steps (Figure 3): (1) geometric modelling by parametric modelling tools; (2) simulation of environmental parameters by using BPS tools; (3) shape optimization by using an evolutionary algorithm; and (4) environmental verification of the results. In the next sections, an overview of each step is presented.
3.1. Parametric Modelling of the Dynamic Shading Structures
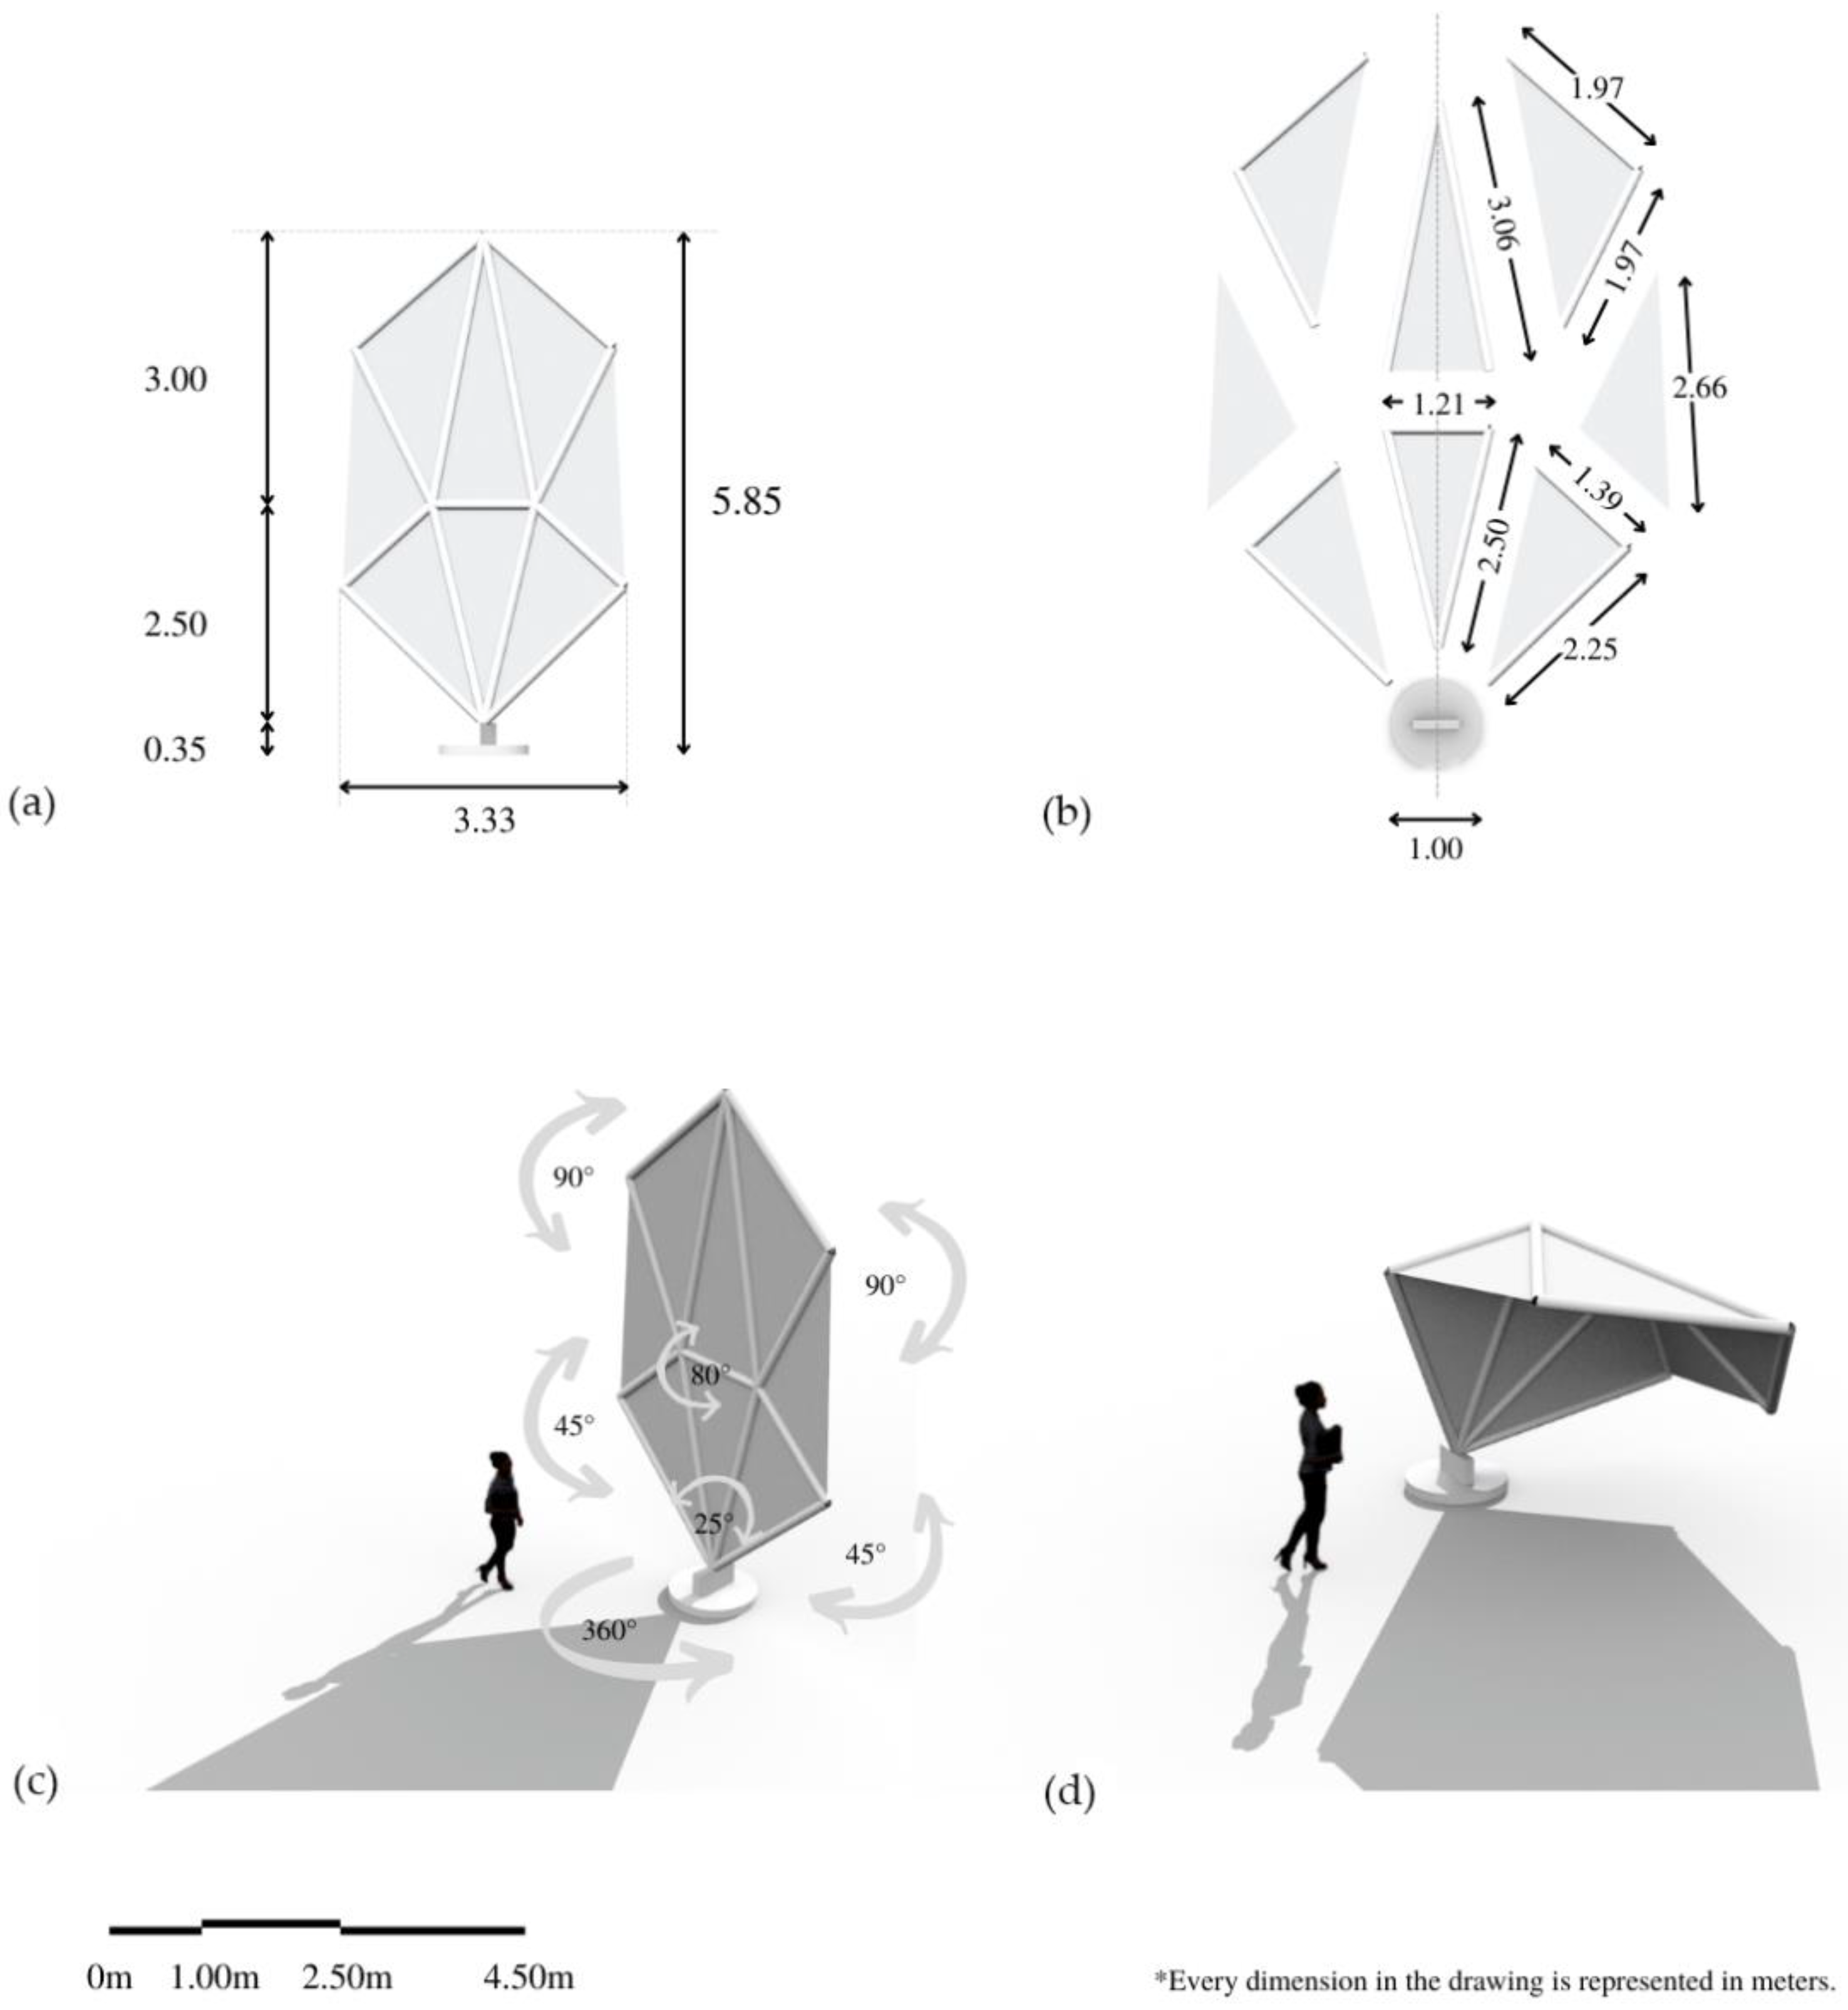
The form of the structure was designed to obtain an easy adaptation to different latitudes and sun trajectories. From previous studies, such as the one presented in [54], it was observed that a triangle works well as a basis for the transformation of the structure. By applying the origami technique, a triangle can be used as the module to be repeated and adapted, allowing easy transformations of the shading structure. Thus, the triangular kinetic modules can work together to achieve folds for the cover. This folding ability helps to maximize the shaded area according to specific sun paths. In addition, the structure support was designed to be easily anchored to the ground, allowing rotational angles on its vertical axis. To sum up, the final structure allows a versatile adaptation to the movement of the sun and subsequent prototyping and manufacturing.
Grasshopper is used to parametrically model the time-changing structure. The following two design parameters were set as dynamic:
- Eight ‘component units’ that form up the dynamic shading. Each unit is triangular shaped with specific dimensions as Figure 4 depicts. Then, six folding axes (80°, 2 × 90°, 2 × 45°, and 25°) are set to allow the structure to bend.
- A vertical axis was used at the center point of the basis structure to allow the entire shading to rotate 360°.
These folding and rotational angles are set as the ‘parametric design variables’ or ‘genes’ that will be changing according to the target indices and different sun positions throughout the year.
3.2. Simulation of Environmental Parameters
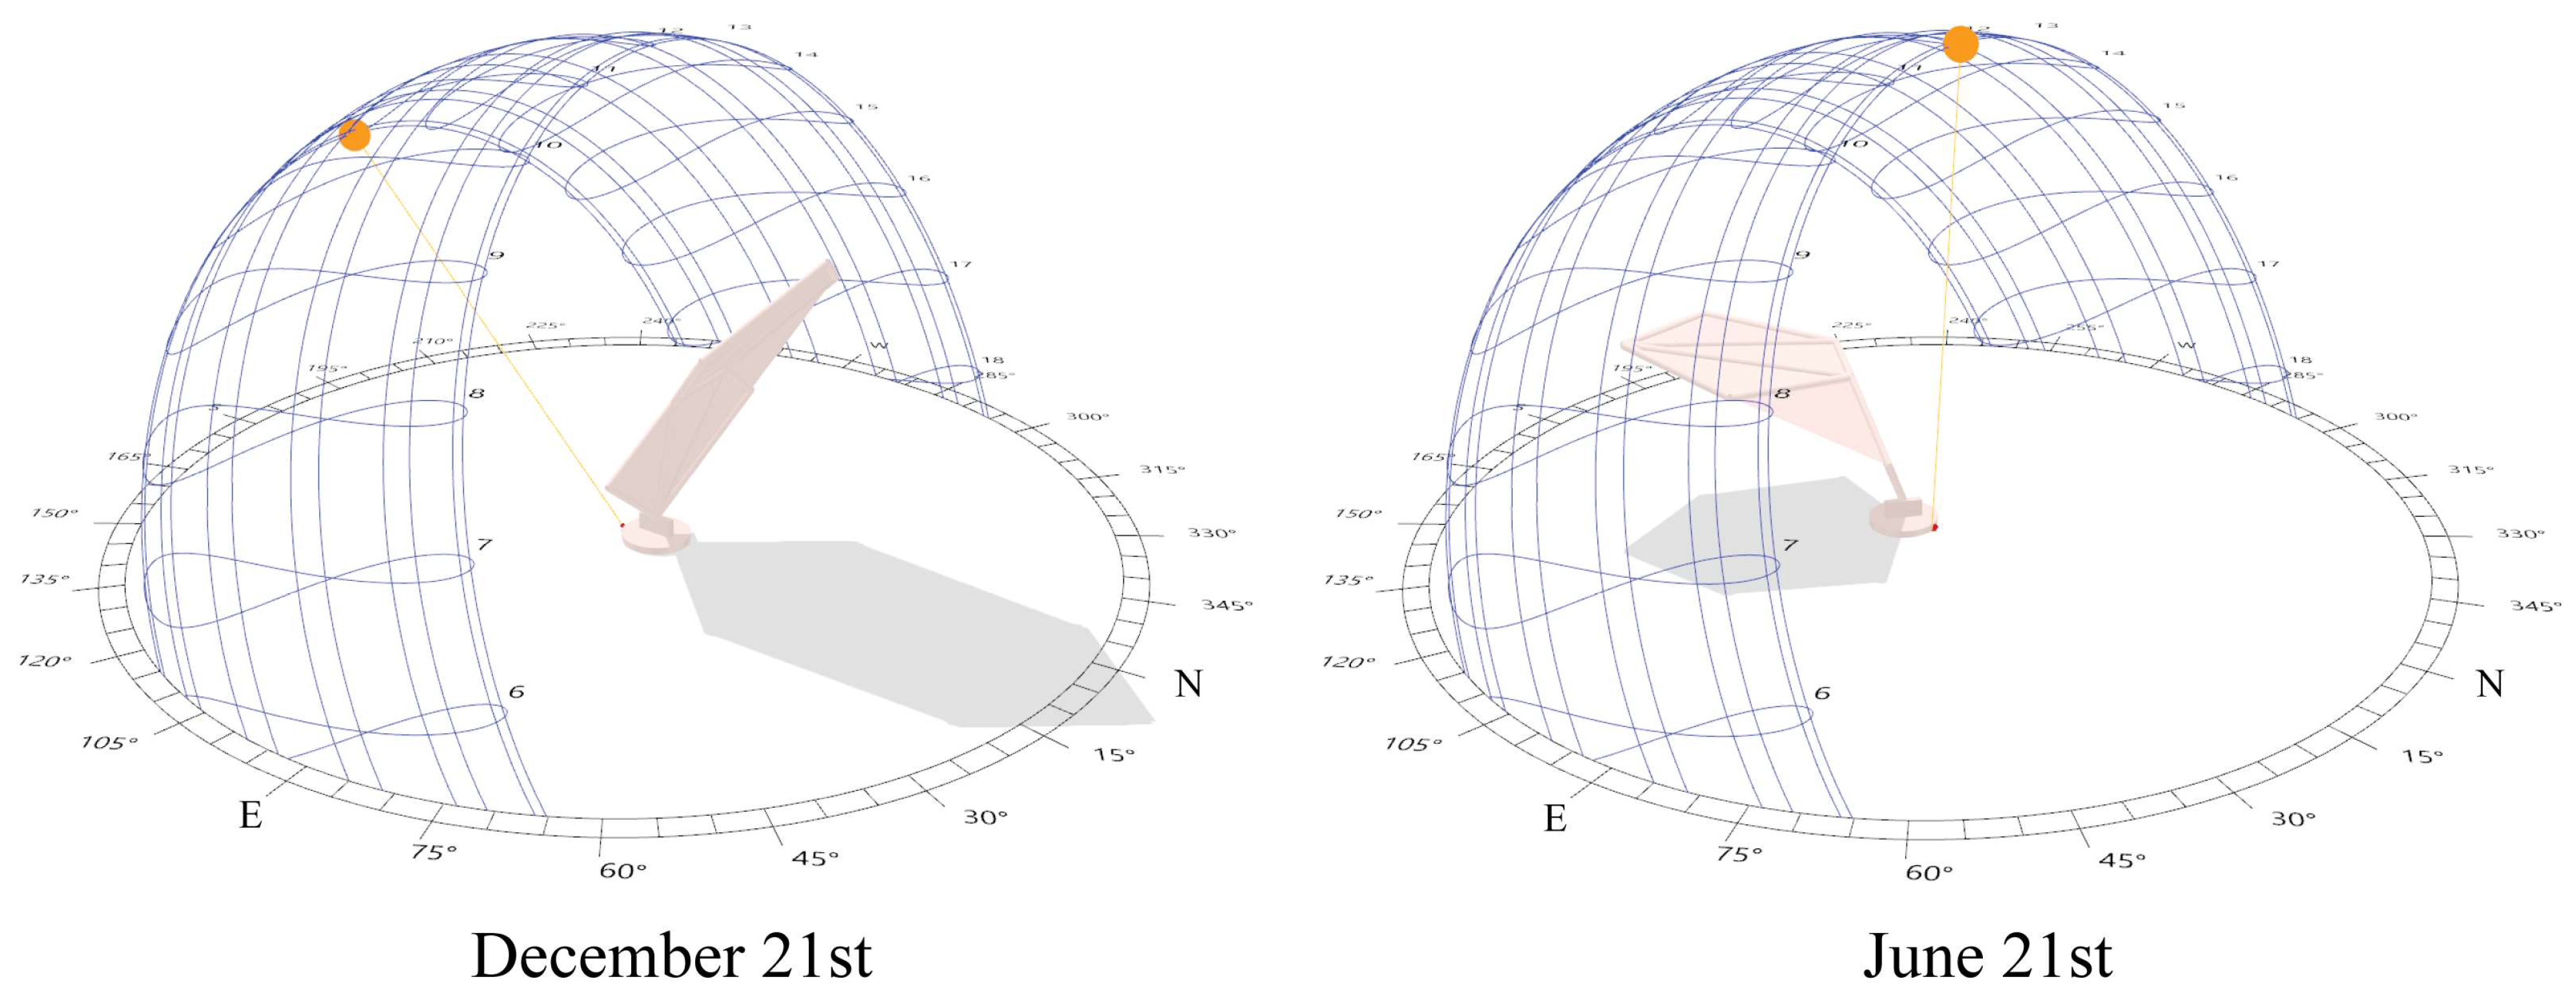
In this step, Ladybug is used to perform detailed analyses of climate data by importing the EPW file of Cancun and to run sunlight-trajectories modeling. To capture the site-specific and dynamic interaction of the shadings, representative days and hours were selected for the quantification of UTCI values and shaded areas: 21st December (winter solstice) and 21st June (summer solstice), both at 8, 12, and 16 h. The sun positions for the assessed times of the year are summarized in Table 3. Additionally, Figure 5 shows the sun positions of the two dates at 12 h, including specific positions of the dynamic shadings.
The targets for the dynamic shadings include providing proper UTCI values (°C) and creating shaded areas (m2) for urban open spaces. As regards the UTCI, the following stress categories were considered as ‘acceptable temperatures’ in this study: no thermal stress (+9 to +26), slight heat stress (+26 to +28), and moderate heat stress (+28 to +32).
The criterion was selected as an analogue method to other outdoor thermal assessments that have used wider temperature ranges (between slight thermal stress and slight cold) as acceptable temperatures in warm and humid climates [15,22,55,56]. These reference studies have concluded that the differences in the ranges of the comfortable perceived temperature are due to the greater degree of thermal adaptation of the residents. The latter derived from a combination of physiological, behavioral, and psychological factors that are likely developed during the acclimatization process. It is important to also consider other factors such as the thermal history, memory, and expectation for outdoor thermal assessments [11].
In Mexico, there is a lack of studies regarding outdoor thermal comfort. However, it has been shown that people are capable to stand at indoor temperatures over 30 °C under warm and hot conditions [57]. Although these last results were oriented to the indoor temperature of comfort, it was expected that they can be considered as the first version of an adaptive thermal comfort model for the Mexican climatic conditions.
When performing the UTCI calculations, specific inputs have to be considered into the Ladybug component ‘Outdoor Comfort Calculator’: mean radiant temperature, dry bulb temperature, wind speed at 10 m high, and relative humidity. The last three inputs are directly read from the EPW file. Regarding the mean radiant temperature, it was adjusted for shortwave solar radiation by using the Ladybug component ‘Outdoor Solar Temperature Adjustor’. The longwave solar radiation was accounted by computing sky temperature and assuming all other surfaces are at the specified base temperature [45].
The solar-adjusted mean radiant temperature accounts for the effect of solar radiation falling directly on people by using the SolarCal method, validated and fully explained in [58]. In short, its calculation uses weather file radiation values and a few coefficients to account for the geometry of the human body. It also considers the sky view factor for which Radiance functions are required to determine the amount of direct and diffuse solar radiation falling on a comfort mannequin. The portion reflected off of the ground to the comfort mannequin is derived from these values of direct and diffuse radiation. The formulas to translate this radiation into an effective radiant field and into a solar-adjusted mean radiant temperature are based on a method developed by [58,59] to evaluate the effect of solar radiation on comfort outdoors. For Radiance calculations, the cumulative sky matrix of Reinhart (580 sky patches) was considered to achieve more accurate results. Other inputs used for the calculation of the solar-adjusted mean radiant temperature are the following: ground reflectivity (0.75 was used in this work to represent concrete pavement), clothing absorptivity (0.5, considering subjects wearing casual clothing throughout the year), and the gravity center of the human body (1 m was used, considering the mean height of Mexican people ~1.65 m).
Regarding the shaded area, it was estimated at the pedestrian height of 1.5 m, considering the dark area (m2) where sunlight is blocked by the shadings. Here, the sun path was a key element to depict the shadows’ projections.
3.3. Shape Optimization with Evolutionary Algorithms
The simulations performed in this work generated a population of dynamic shading structures that have evolved toward two fitness values, also referred as the optimization objectives. Hence, the Non-dominated Sorting Genetic Algorithm (NSGA-II) [60,61] was selected to run the multiobjective optimizations with Wallacei X: an “Evolutionary computation, based on genes and chromosomes containing the code for nature’s designs, uses solution populations competing/co-operating to improve over time through interactions with the environment” [52]. In this work, Wallacei X allows searching for the optimal folding and rotational angles that provide proper UTCI temperatures and enhance the shaded areas (please refer to Section 3.1). After several runs of the same problem, solutions with similar environmental performance are found. This gives flexibility to designers to select the preferred solution between different possibilities with very similar performance.
The fitness values for the evolutionary algorithm are the following:
- Maximize the shaded area within a ground area of 144 m2. This area was pondered from the shaded area produced during winter solstices, which is expected to be the biggest throughout the year (Figure 5).
- Minimize the UTCI (°C) within the shaded area. Proper UTCI values are considered according to the previous step (Section 3.2). Then, the ‘condition of person’ is derived from the UTCI stress categories. To better understand the thermal conditions under the shadings, the grid area of 144 m2 was subdivided into modules of 10 cm × 10 cm. At the center of each module, the UTCI value (°C) was calculated. Then, the resulting UTCI degrees were classified according to the UTCI ranges (Table 1) and their representative modules were stored in subareas corresponding to the UTCI stress categories (Table 1). Lastly, the squared meters of each subarea was reported. In addition, all UTCI values were averaged to obtain a representative value for the entire grid area when no shadings were placed on site. This average value allows further comparison between the outdoor thermal conditions with and without shadings.
At this point, it is necessary to clarify what is meant by some specific terms to better understand the optimization process (Figure 3). The genomes are the individuals of the generations of each optimization. From the genomes, the final genes (in this study, the folding and rotational angles) are collected. The phenotypes are the selected solutions from each optimization that are replicated as final shadings.
As far as the optimization process is concerned, the following two exercises were performed with Wallacei X.
- First, an optimization was performed with a population size of 20 individuals per generation with a total of 50 generations. As a result, a total population size of 1000 genomes was considered. The first exercise took approximately 24 h.
- Second, an optimization was performed with a population size of 10 individuals per generation with a total of 50 generations. From here, a total population size of 500 genomes was evaluated. The second exercise took approximately 14 h.
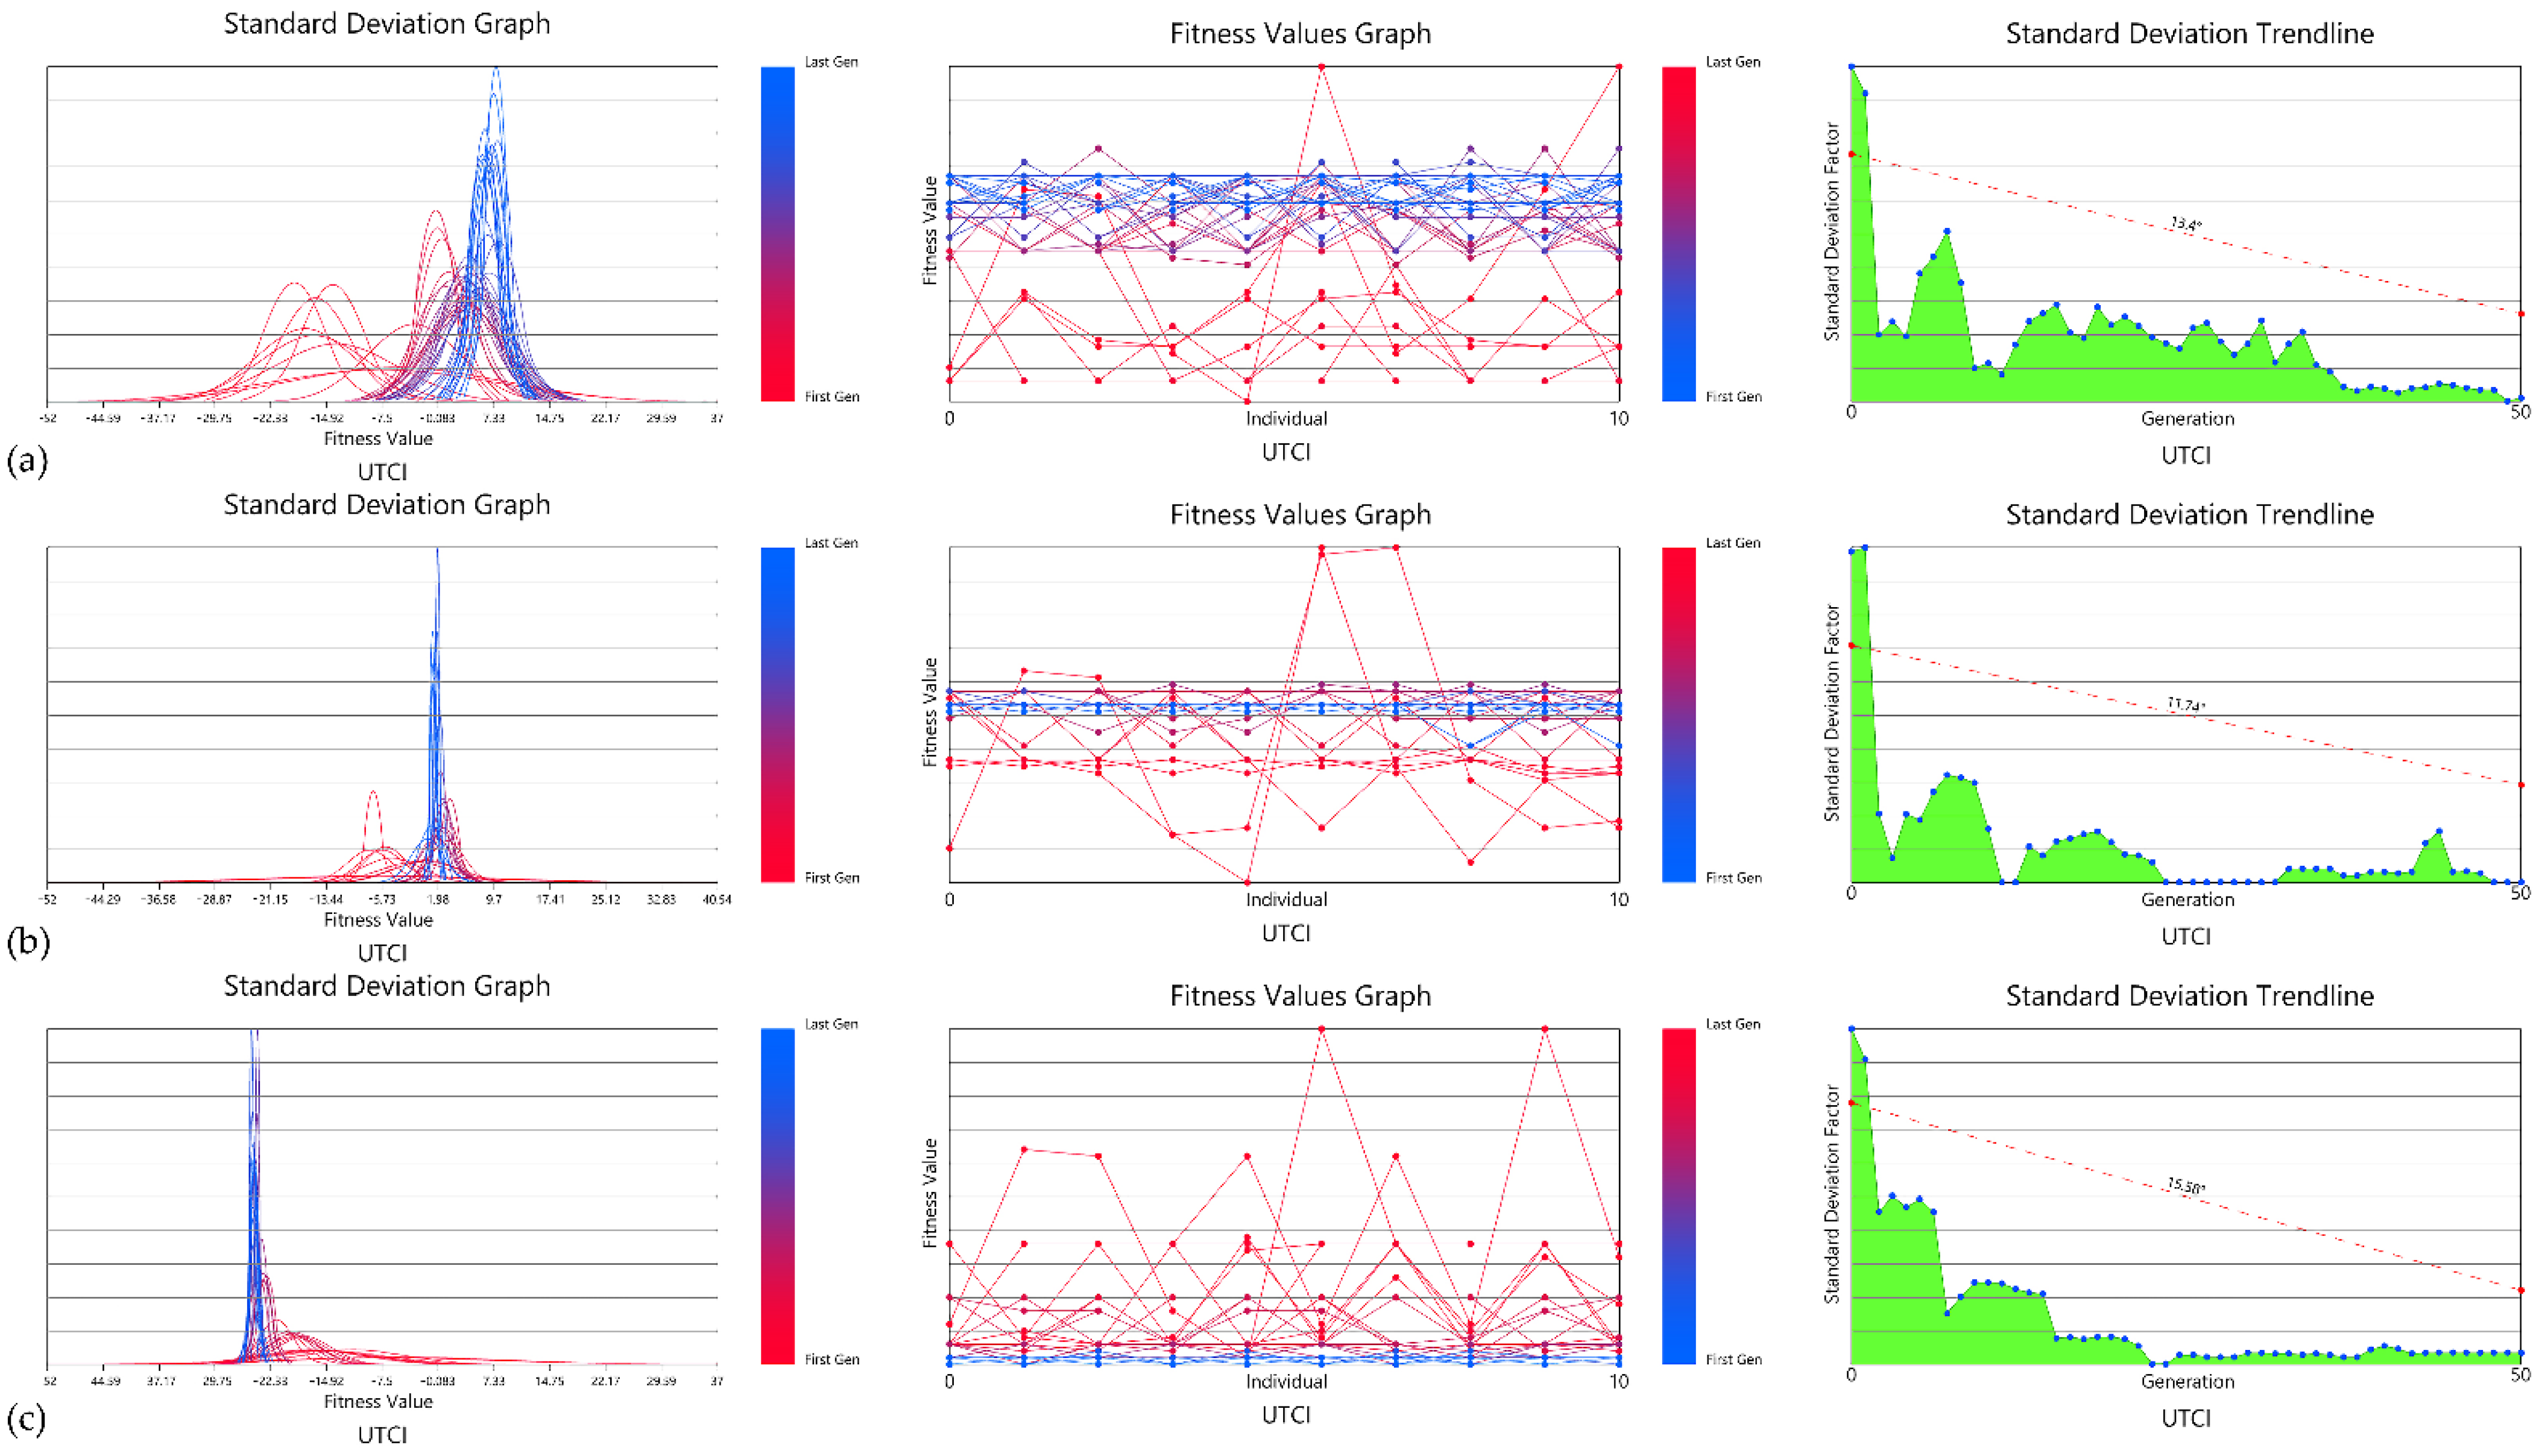
The objective of both exercises was to determine the population size to perform the optimizations. Hence, a stability trend for the fitness of the genomes after the third generation was observed. Thus, the second exercise was selected as the best trade-off between the accuracy of the simulation results and the time to complete computational simulations (Figure 6).
The Standard Deviation Graph in Figure 6 shows the first to the last generation from red to blue. For each fitness objective, the standard deviation chart for all generations in the population is independently drawn. This graph represents the distribution of a set of values from the mean: a low standard deviation factor indicates that most values are clustered around the mean, whereas a high standard deviation factor indicates that the values are spread out farther from the mean. The chart aims to present and analyze the levels of variation for each generation in the population, as well as whether the generations are getting fitter throughout the simulations [61]. From this figure, a stability trend of the fitness objectives is clearly observed for the last generations; this trend was observed during the different times. It was also revealed that the last generations were more dispersed from the mean. What was interesting in the Fitness Values graph was the stability of the last generations. This means that the last generations tend to decrease both the UTCI degrees and the shaded area.
The Fitness Value Graph in Figure 6 shows the first to the last generation from red to blue. It comprises the fitness values for each fitness objective independently across the entire population. The chart aims to visualize how the solutions are performing in relation to one another, both within each generation and across the population [61].
The Standard Deviation Trendline in Figure 6 shows from left to right the first to the last generation. For each fitness objective, the standard deviation trend values for each generation across the entire population are independently plotted. The chart aims to highlight specific trends in the variation of each generation across the population [61].
3.4. Environmental Verification of the Optimal Solutions
After the optimization with Wallacei X, the best-ranked genomes according to each fitness objective (at the specific times studied) were chosen from the entire population of the Pareto Front Solutions (phenotypes). The Pareto Front is used here to calculate the nondominance value for any generation within the population [61].
Once the best genomes were selected, their specific genes were identified in order to test the shadings performance. That is to say, 3D shadings replications were modelled with the genes’ information to further run environmental simulations with Ladybug. The aim here is to compare the obtained results (shaded areas and UTCI values) from the resultant phenotypes against the replicated shadings.
4. Results
4.1. Fitness Values and Optimization Results
Table 4 and Table 5 enlist the optimal genomes for the summer and winter, respectively. As previously explained, the best solutions were ranked according to the fitness values and the process was repeated for each specific date and time. Table 4 and Table 5 also include the simulated results for the shaded area and the UTCI averaged over the unshaded evaluation area (144 m2) to allow for the comparison between the outdoor thermal conditions with and without the shadings. To better interpret the distribution of the thermal conditions over the entire evaluation area (144 m2), the latter was subdivided into five smaller areas that achieved a specific stress category of UTCI (°C):
- No thermal stress (+9 to +26)
- Slight heat stress (+26 to +28)
- Moderate heat stress (+28 to +32)
- Strong heat stress (+32 to +38)
It is important to notice here that the shaded areas comprised different stress categories, depending on the time of the year, as Table 4 and Table 5 indicate. During the summer, the shaded area mostly included the moderate heat stress category. During the winter, the shaded area mostly included the no thermal stress and slight heat stress categories. There were, however, specific daytimes when the shaded area reached moderate heat stress (December at midday).
Results from these tables pointed out that all the optimal genomes achieved similar shaded areas and UTCI stress categories. The most interesting aspect of the data was the considerable improvement of the outdoor thermal conditions: the average UTCI (°C) under the exposed sunlit area vs. that under the shaded areas. To better understand the results, some phenotypes were highlighted in gray shading in Table 4 and Table 5 to exemplify the UTCI improvements. In the summer at 8 h, the unshaded area achieved an UTCI of 37 °C, whereas the shaded area 30.6 °C: an absolute difference of 6.4 °C. In the summer, the maximum difference was 11.3 °C at midday and 8.2 °C at 16 h. In the winter, the maximum differences were 3.4, 6.9, and 2.2 °C at 8, 12, and 16 h, respectively.
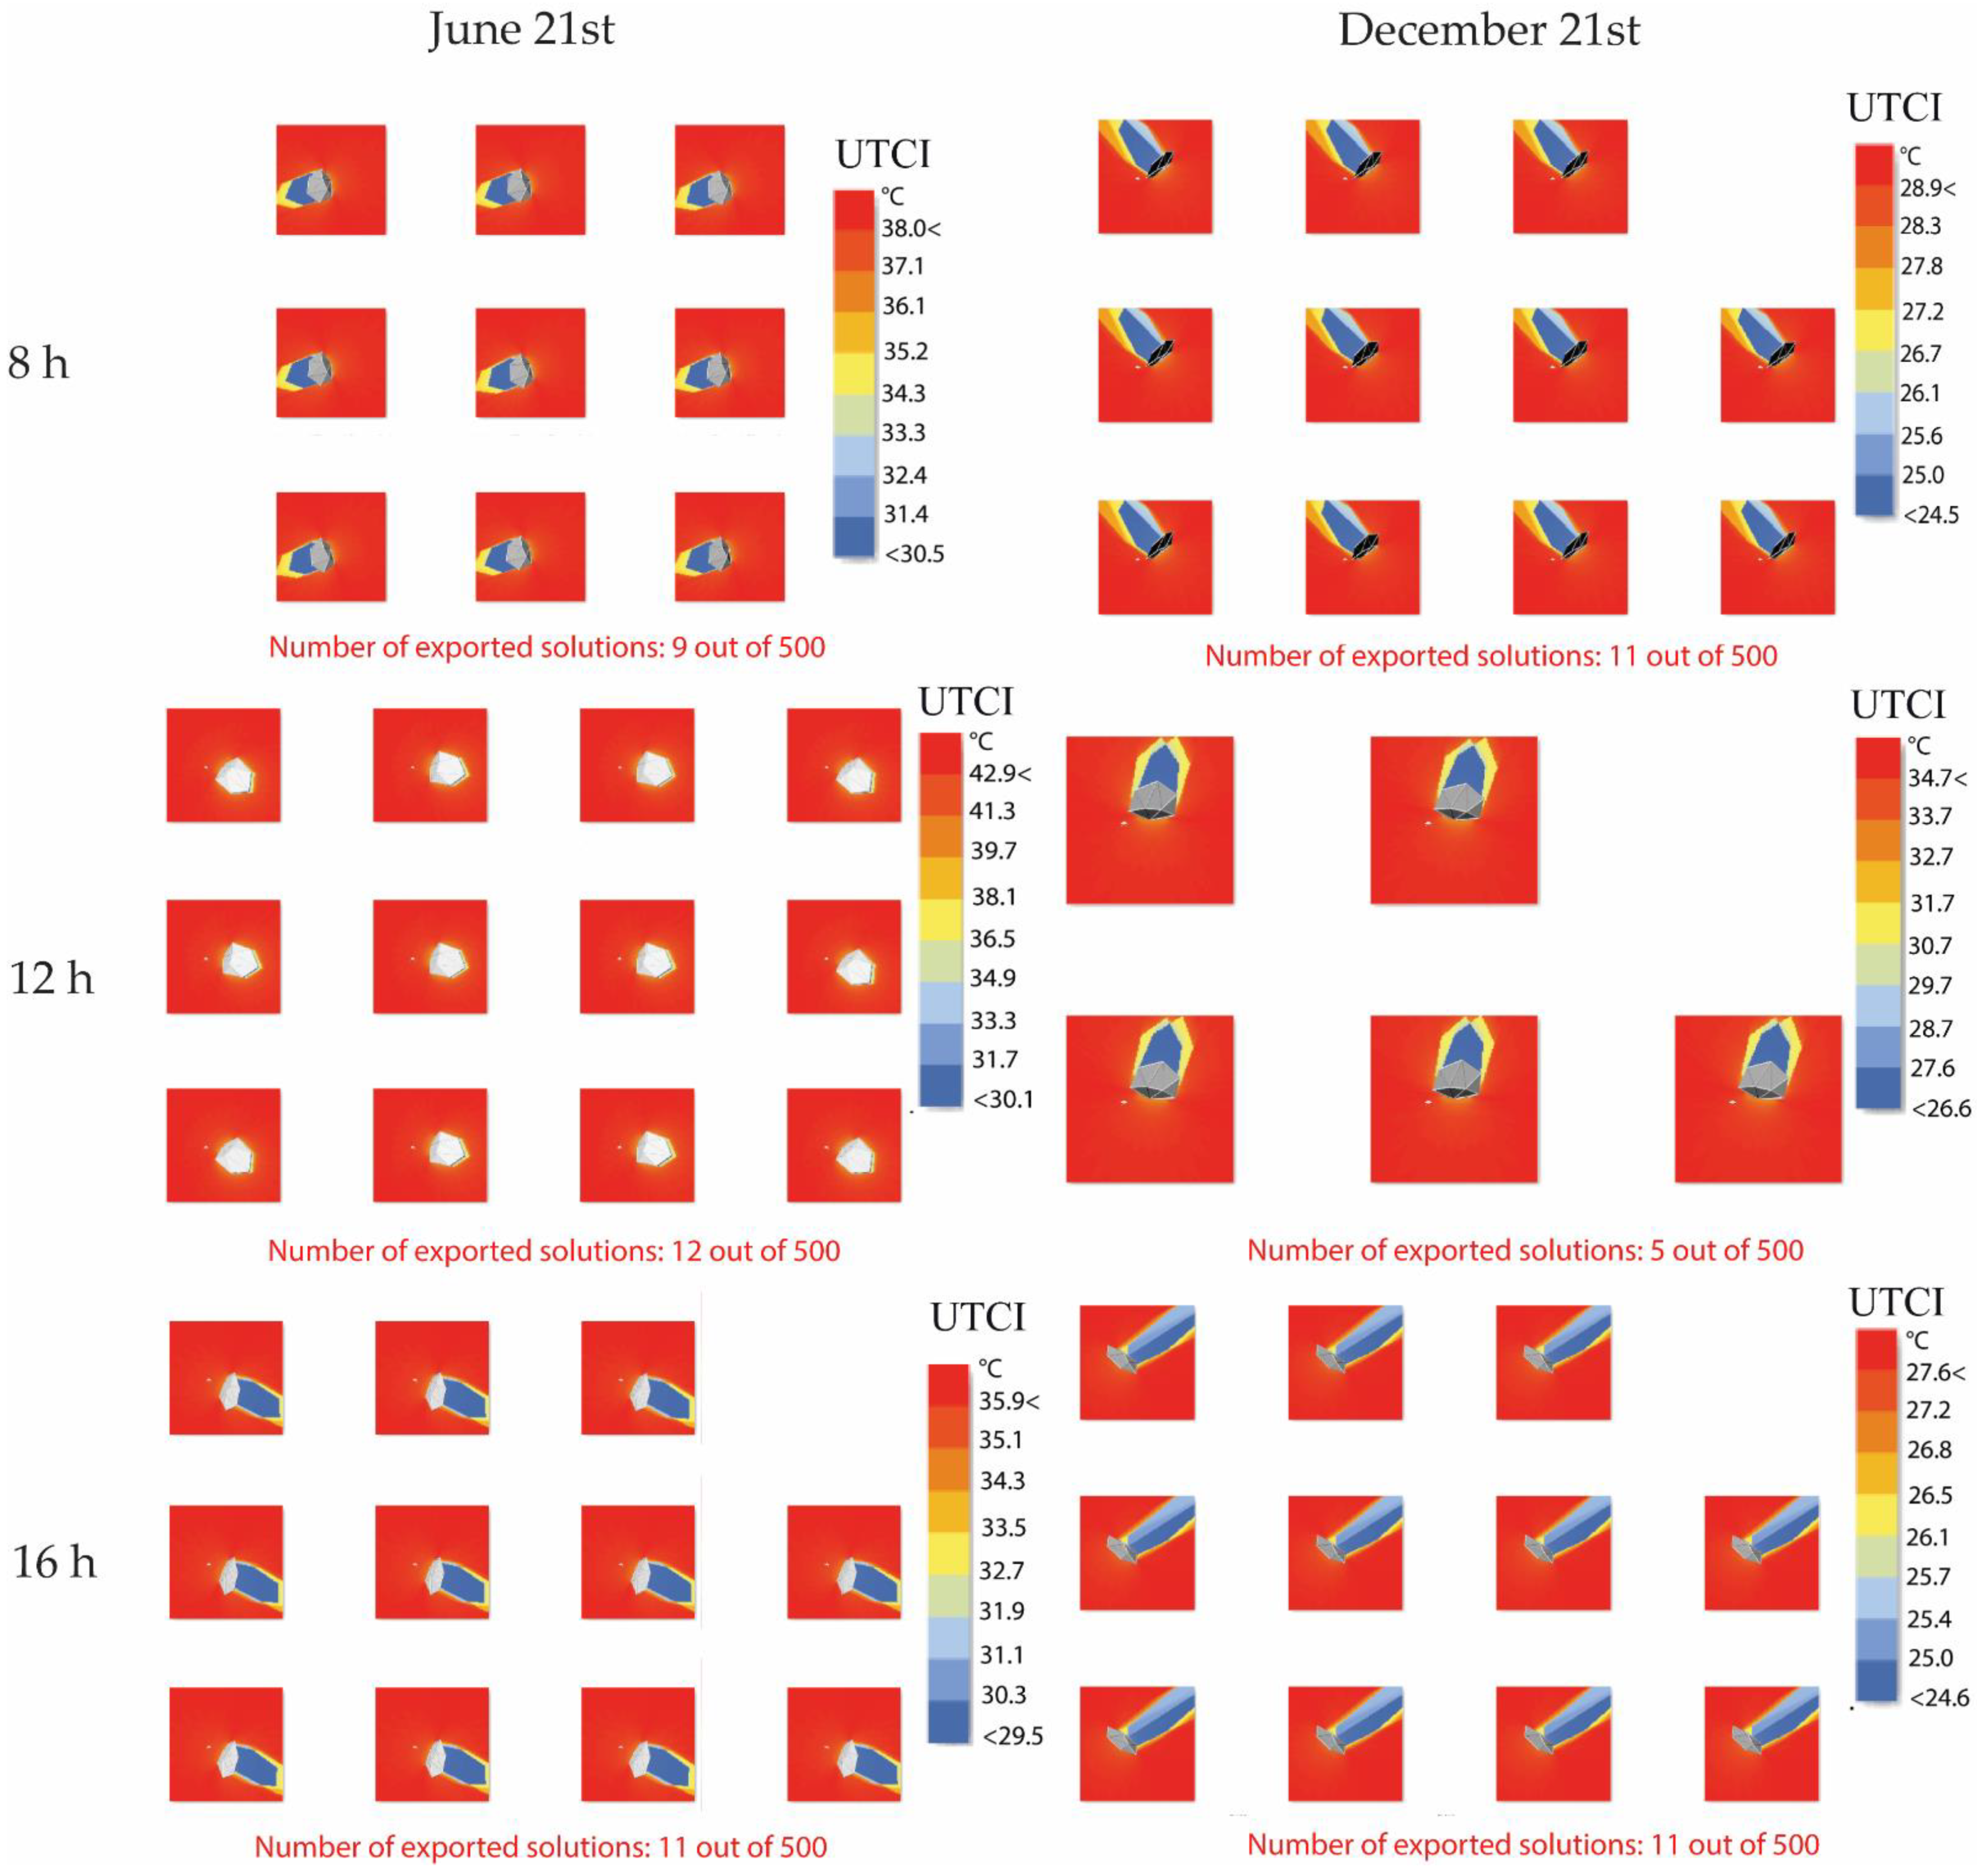
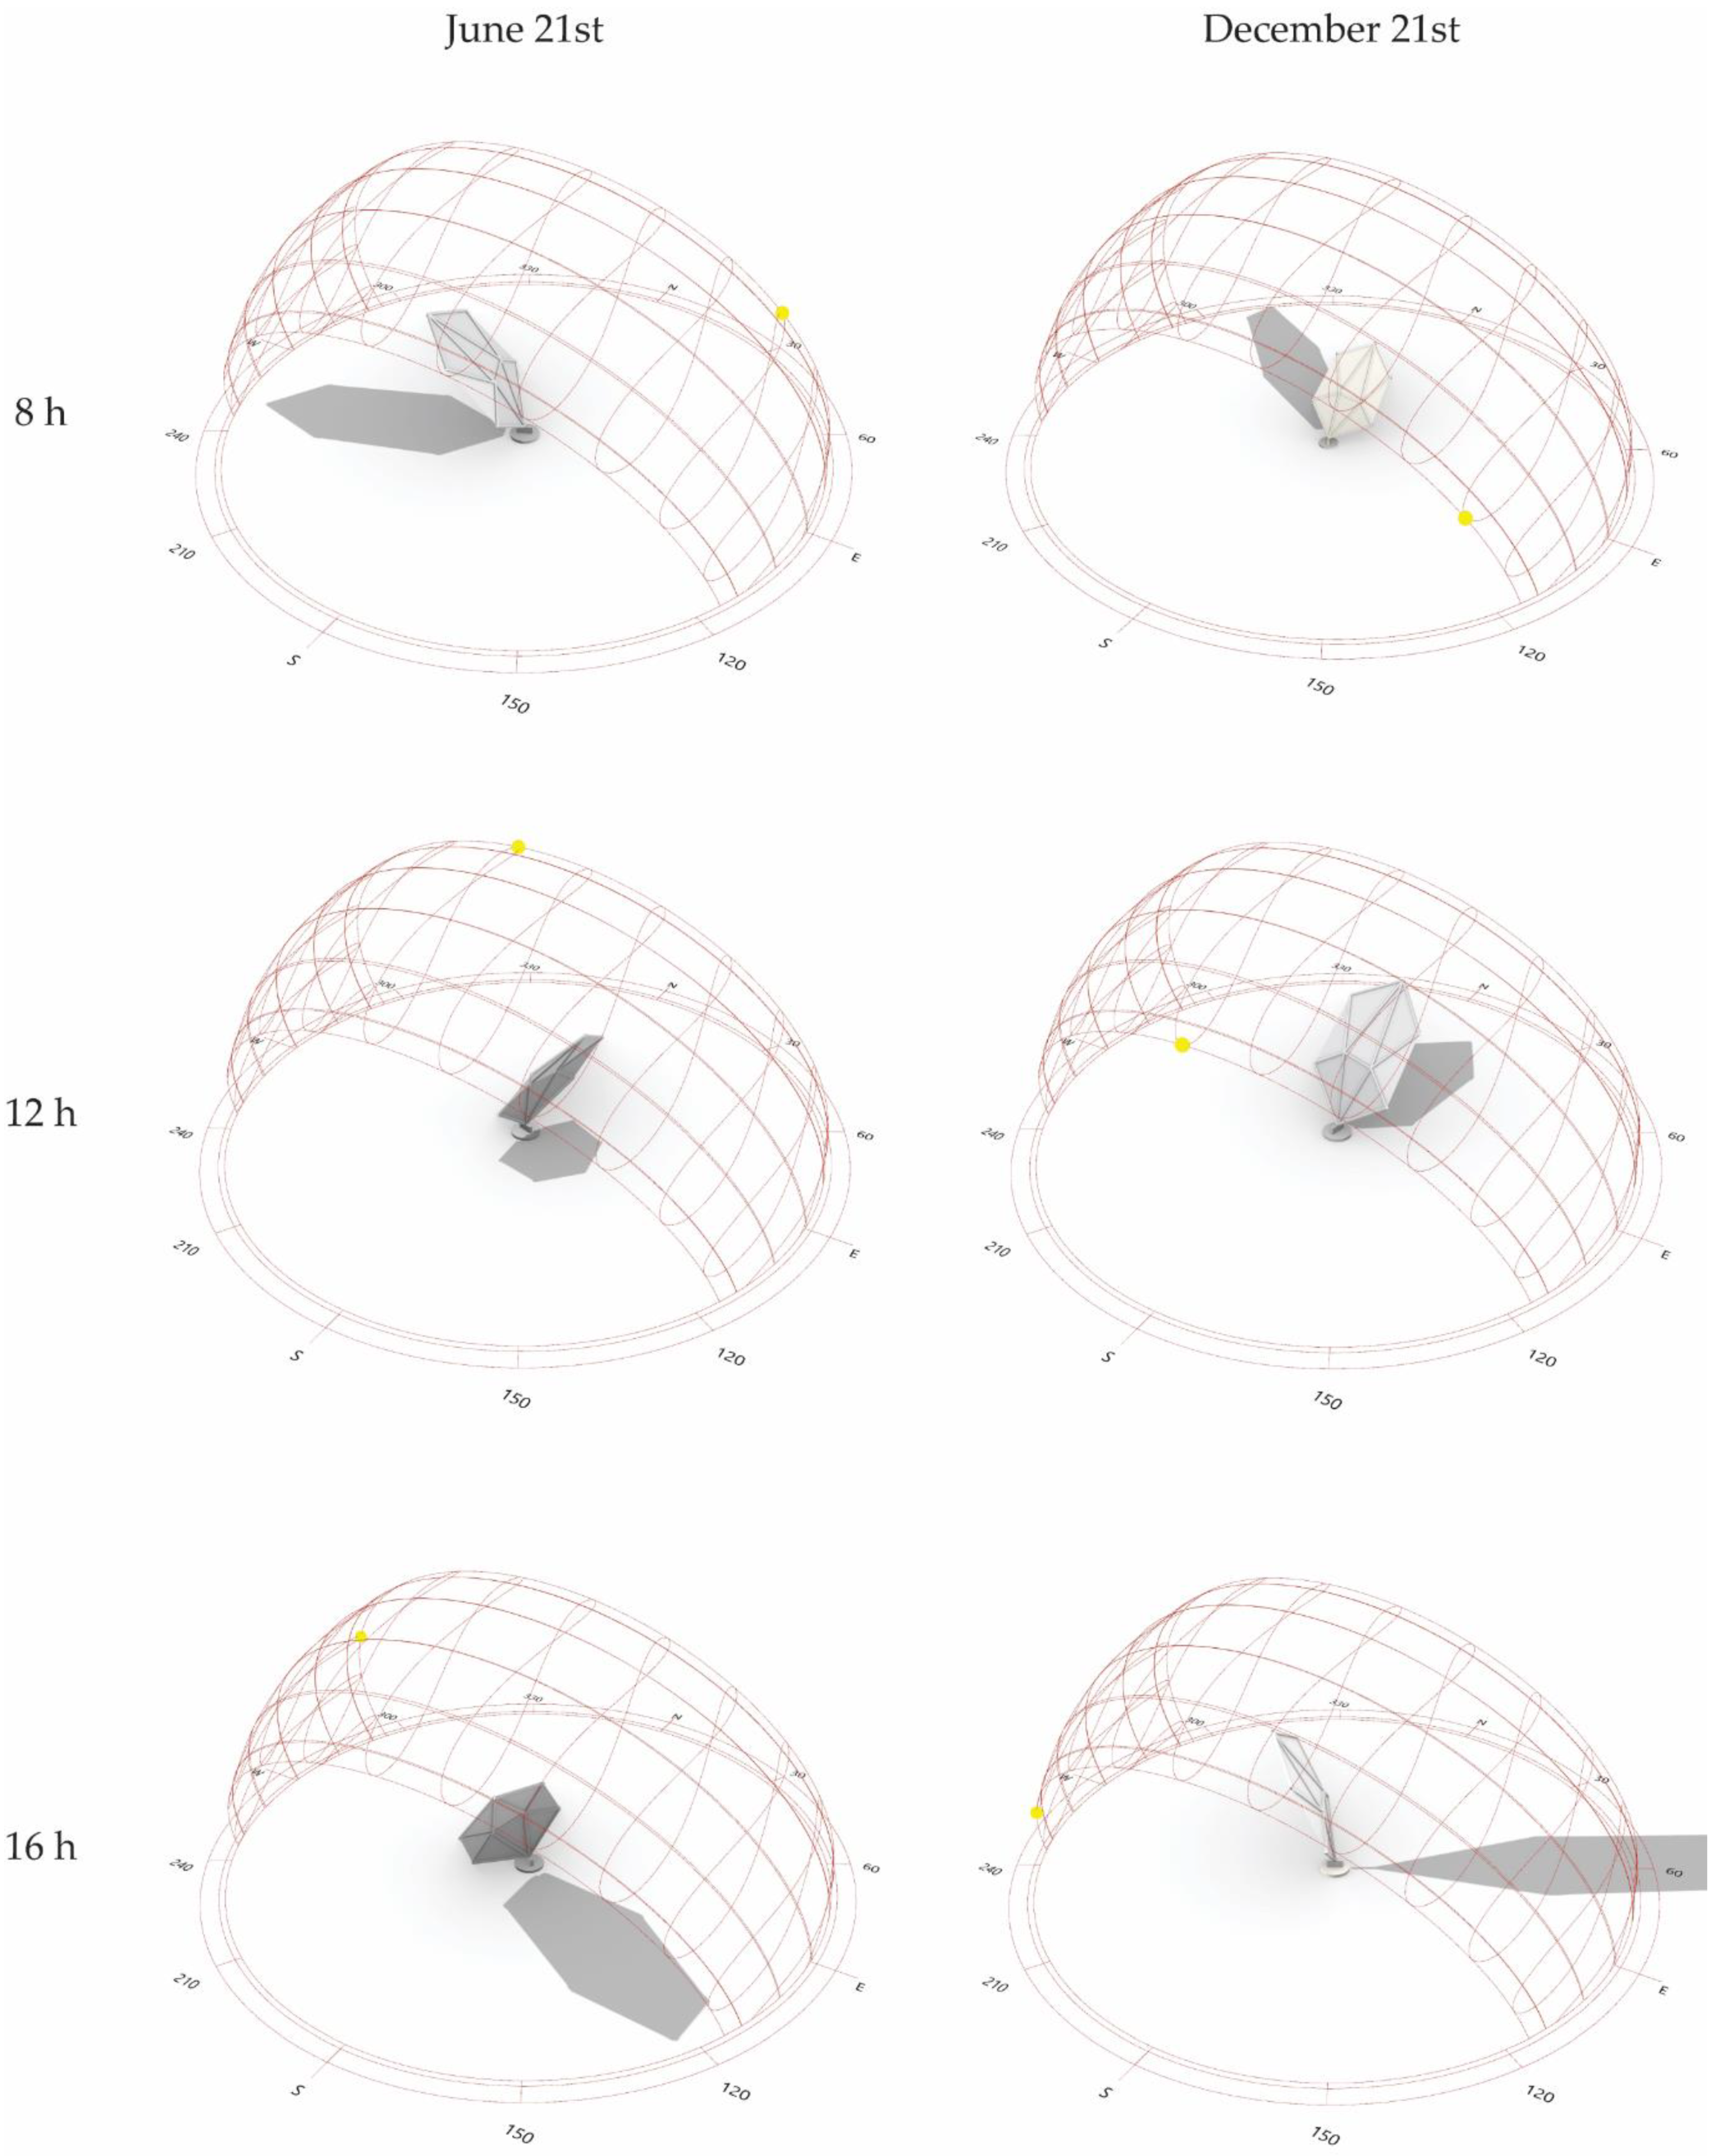
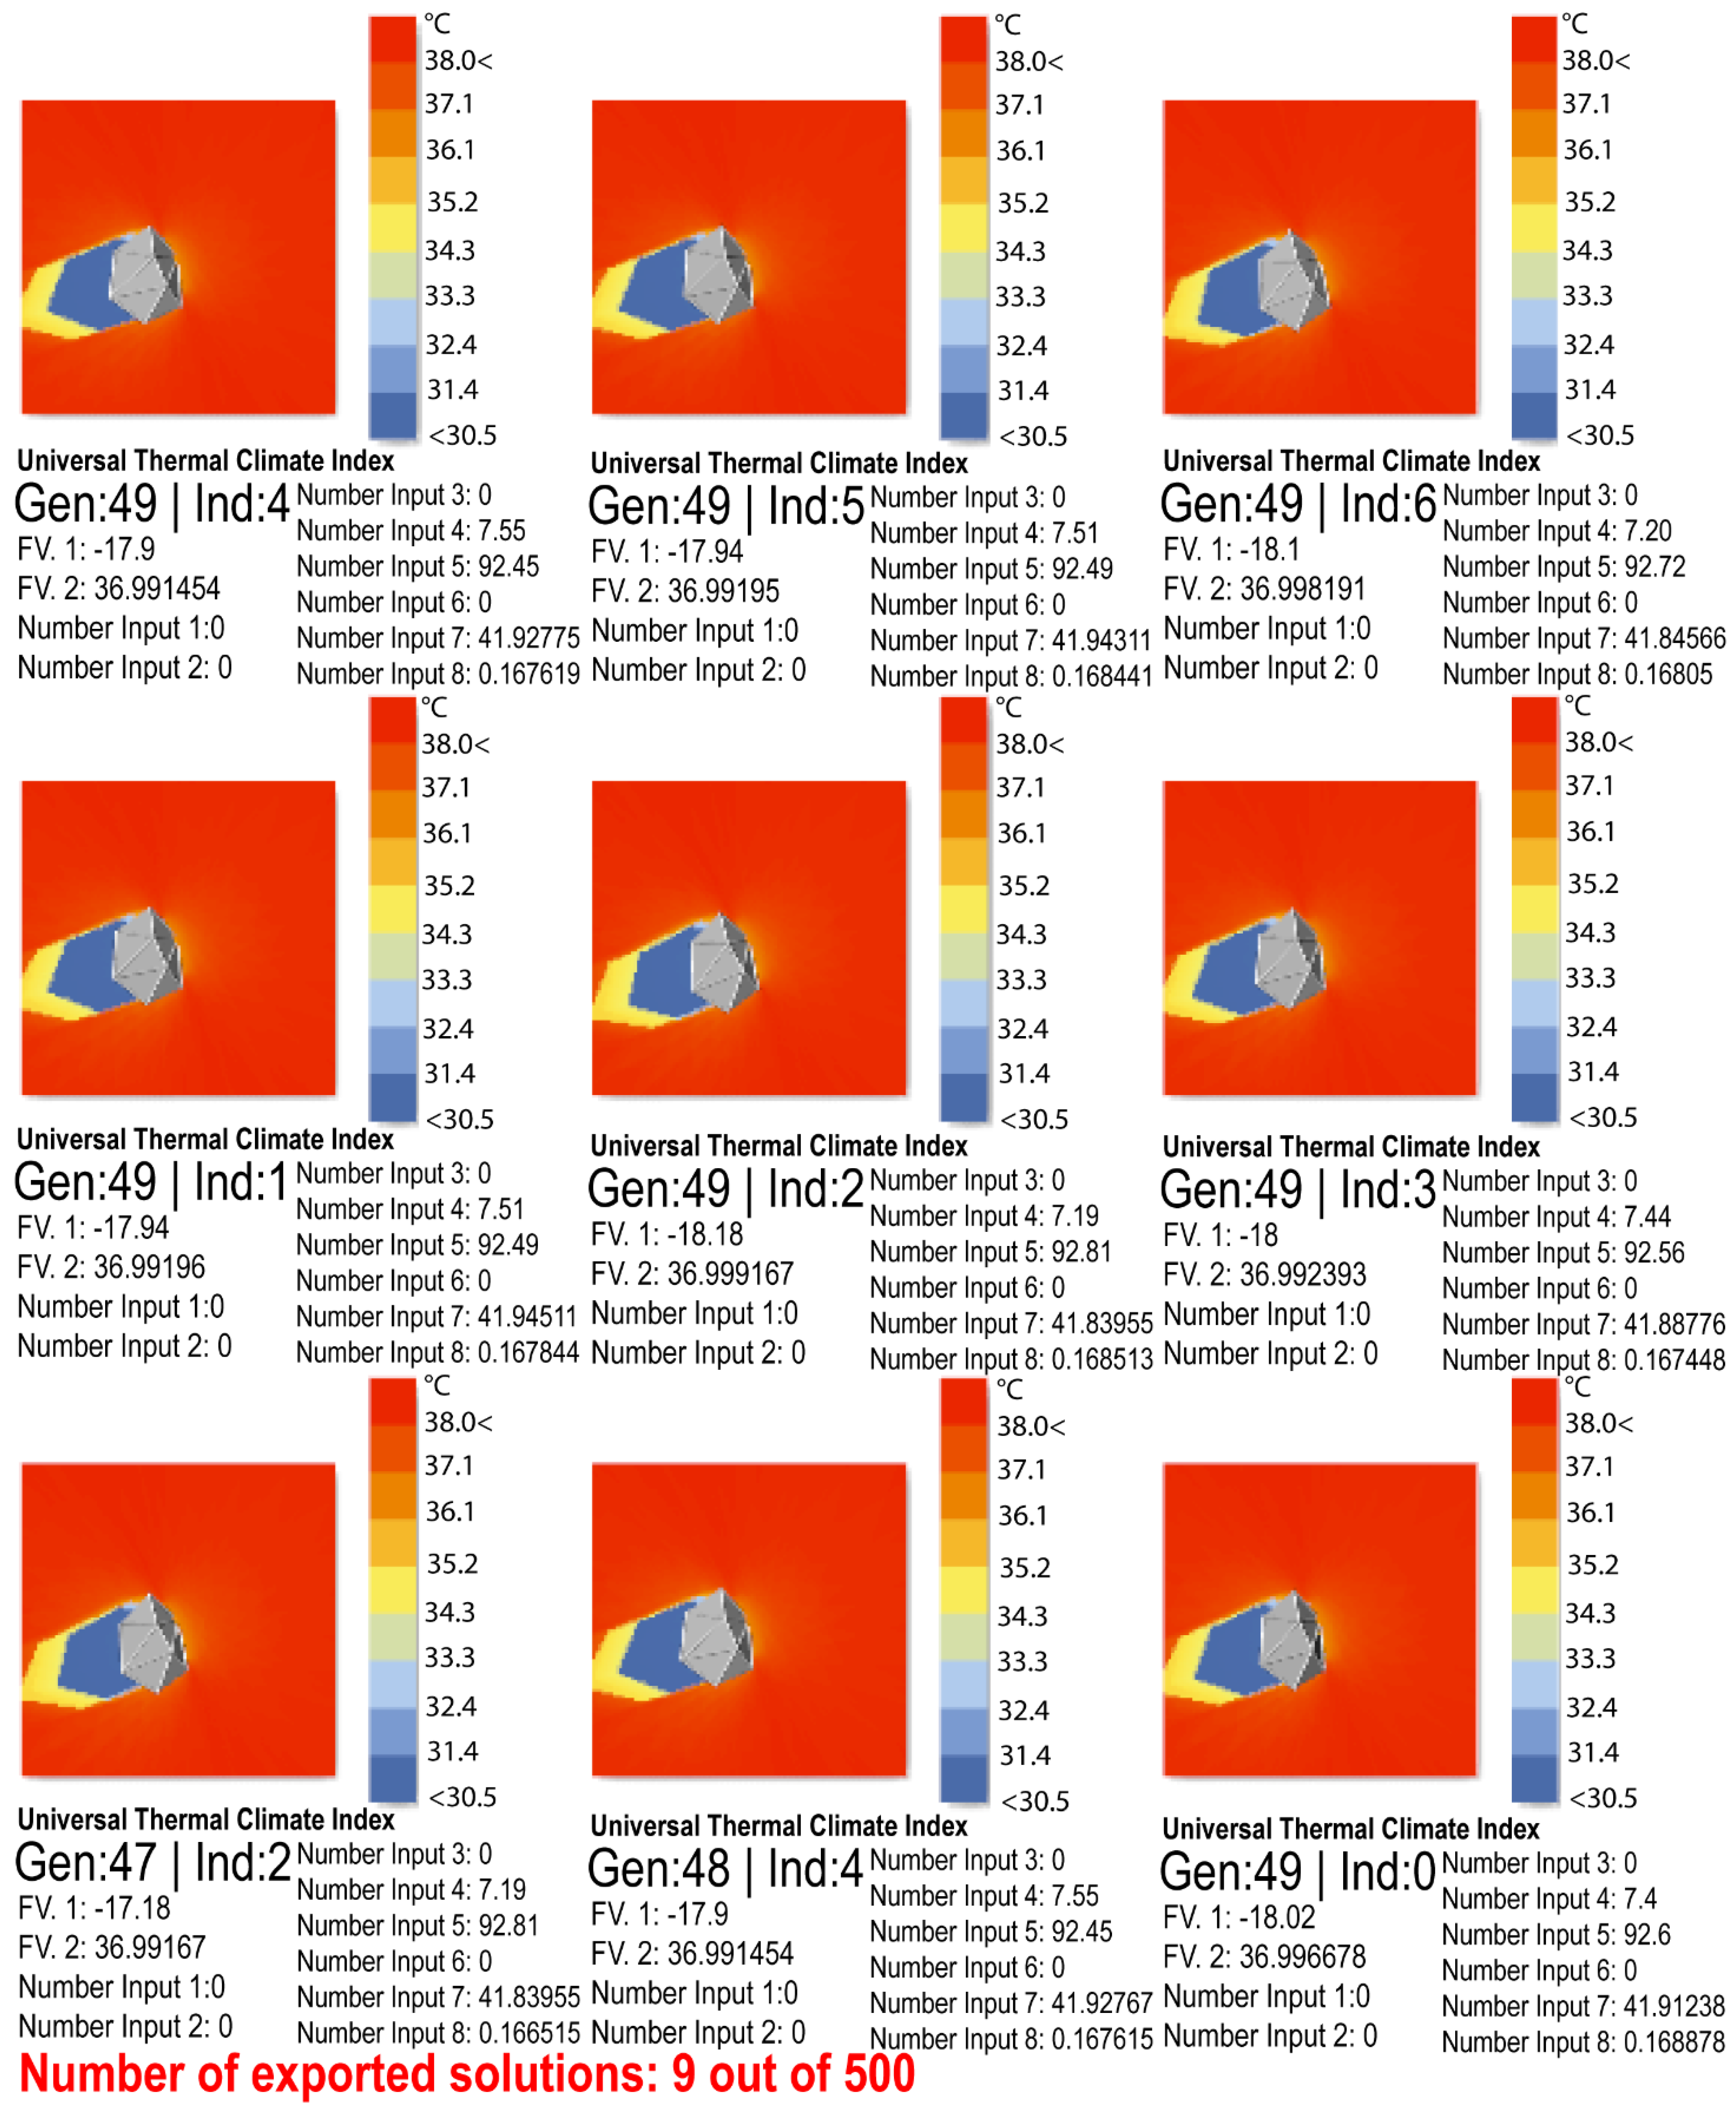
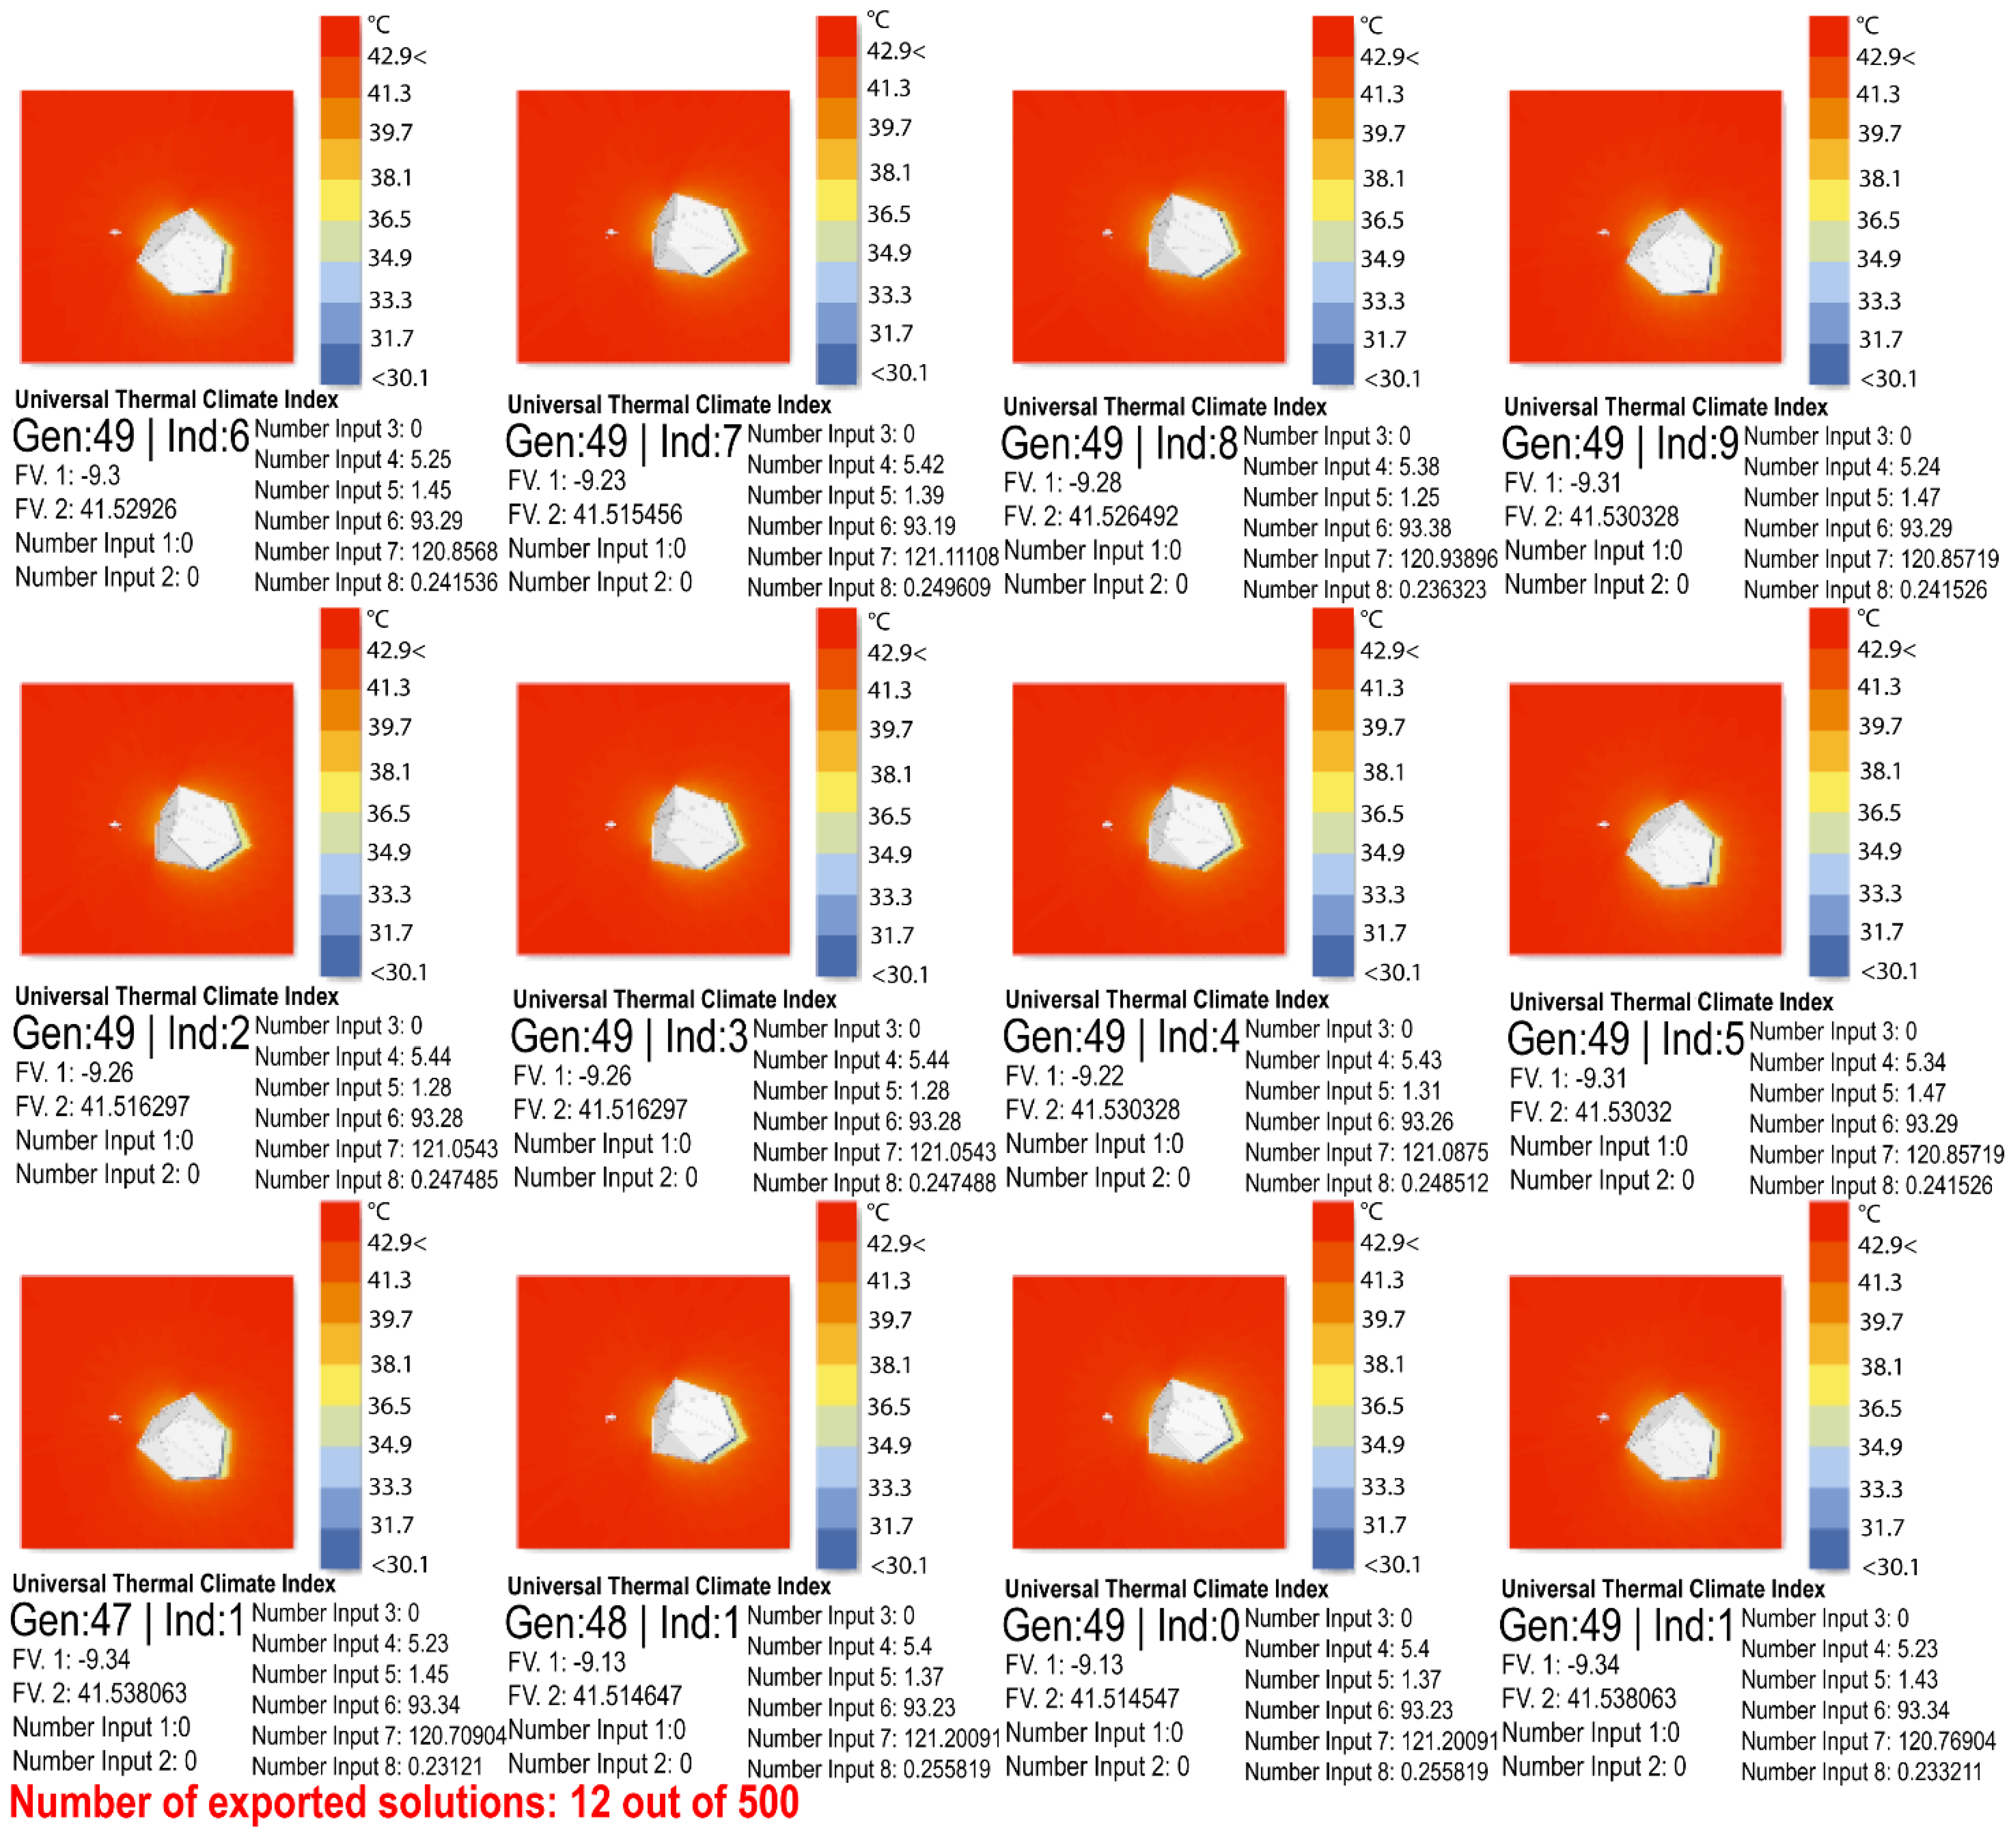
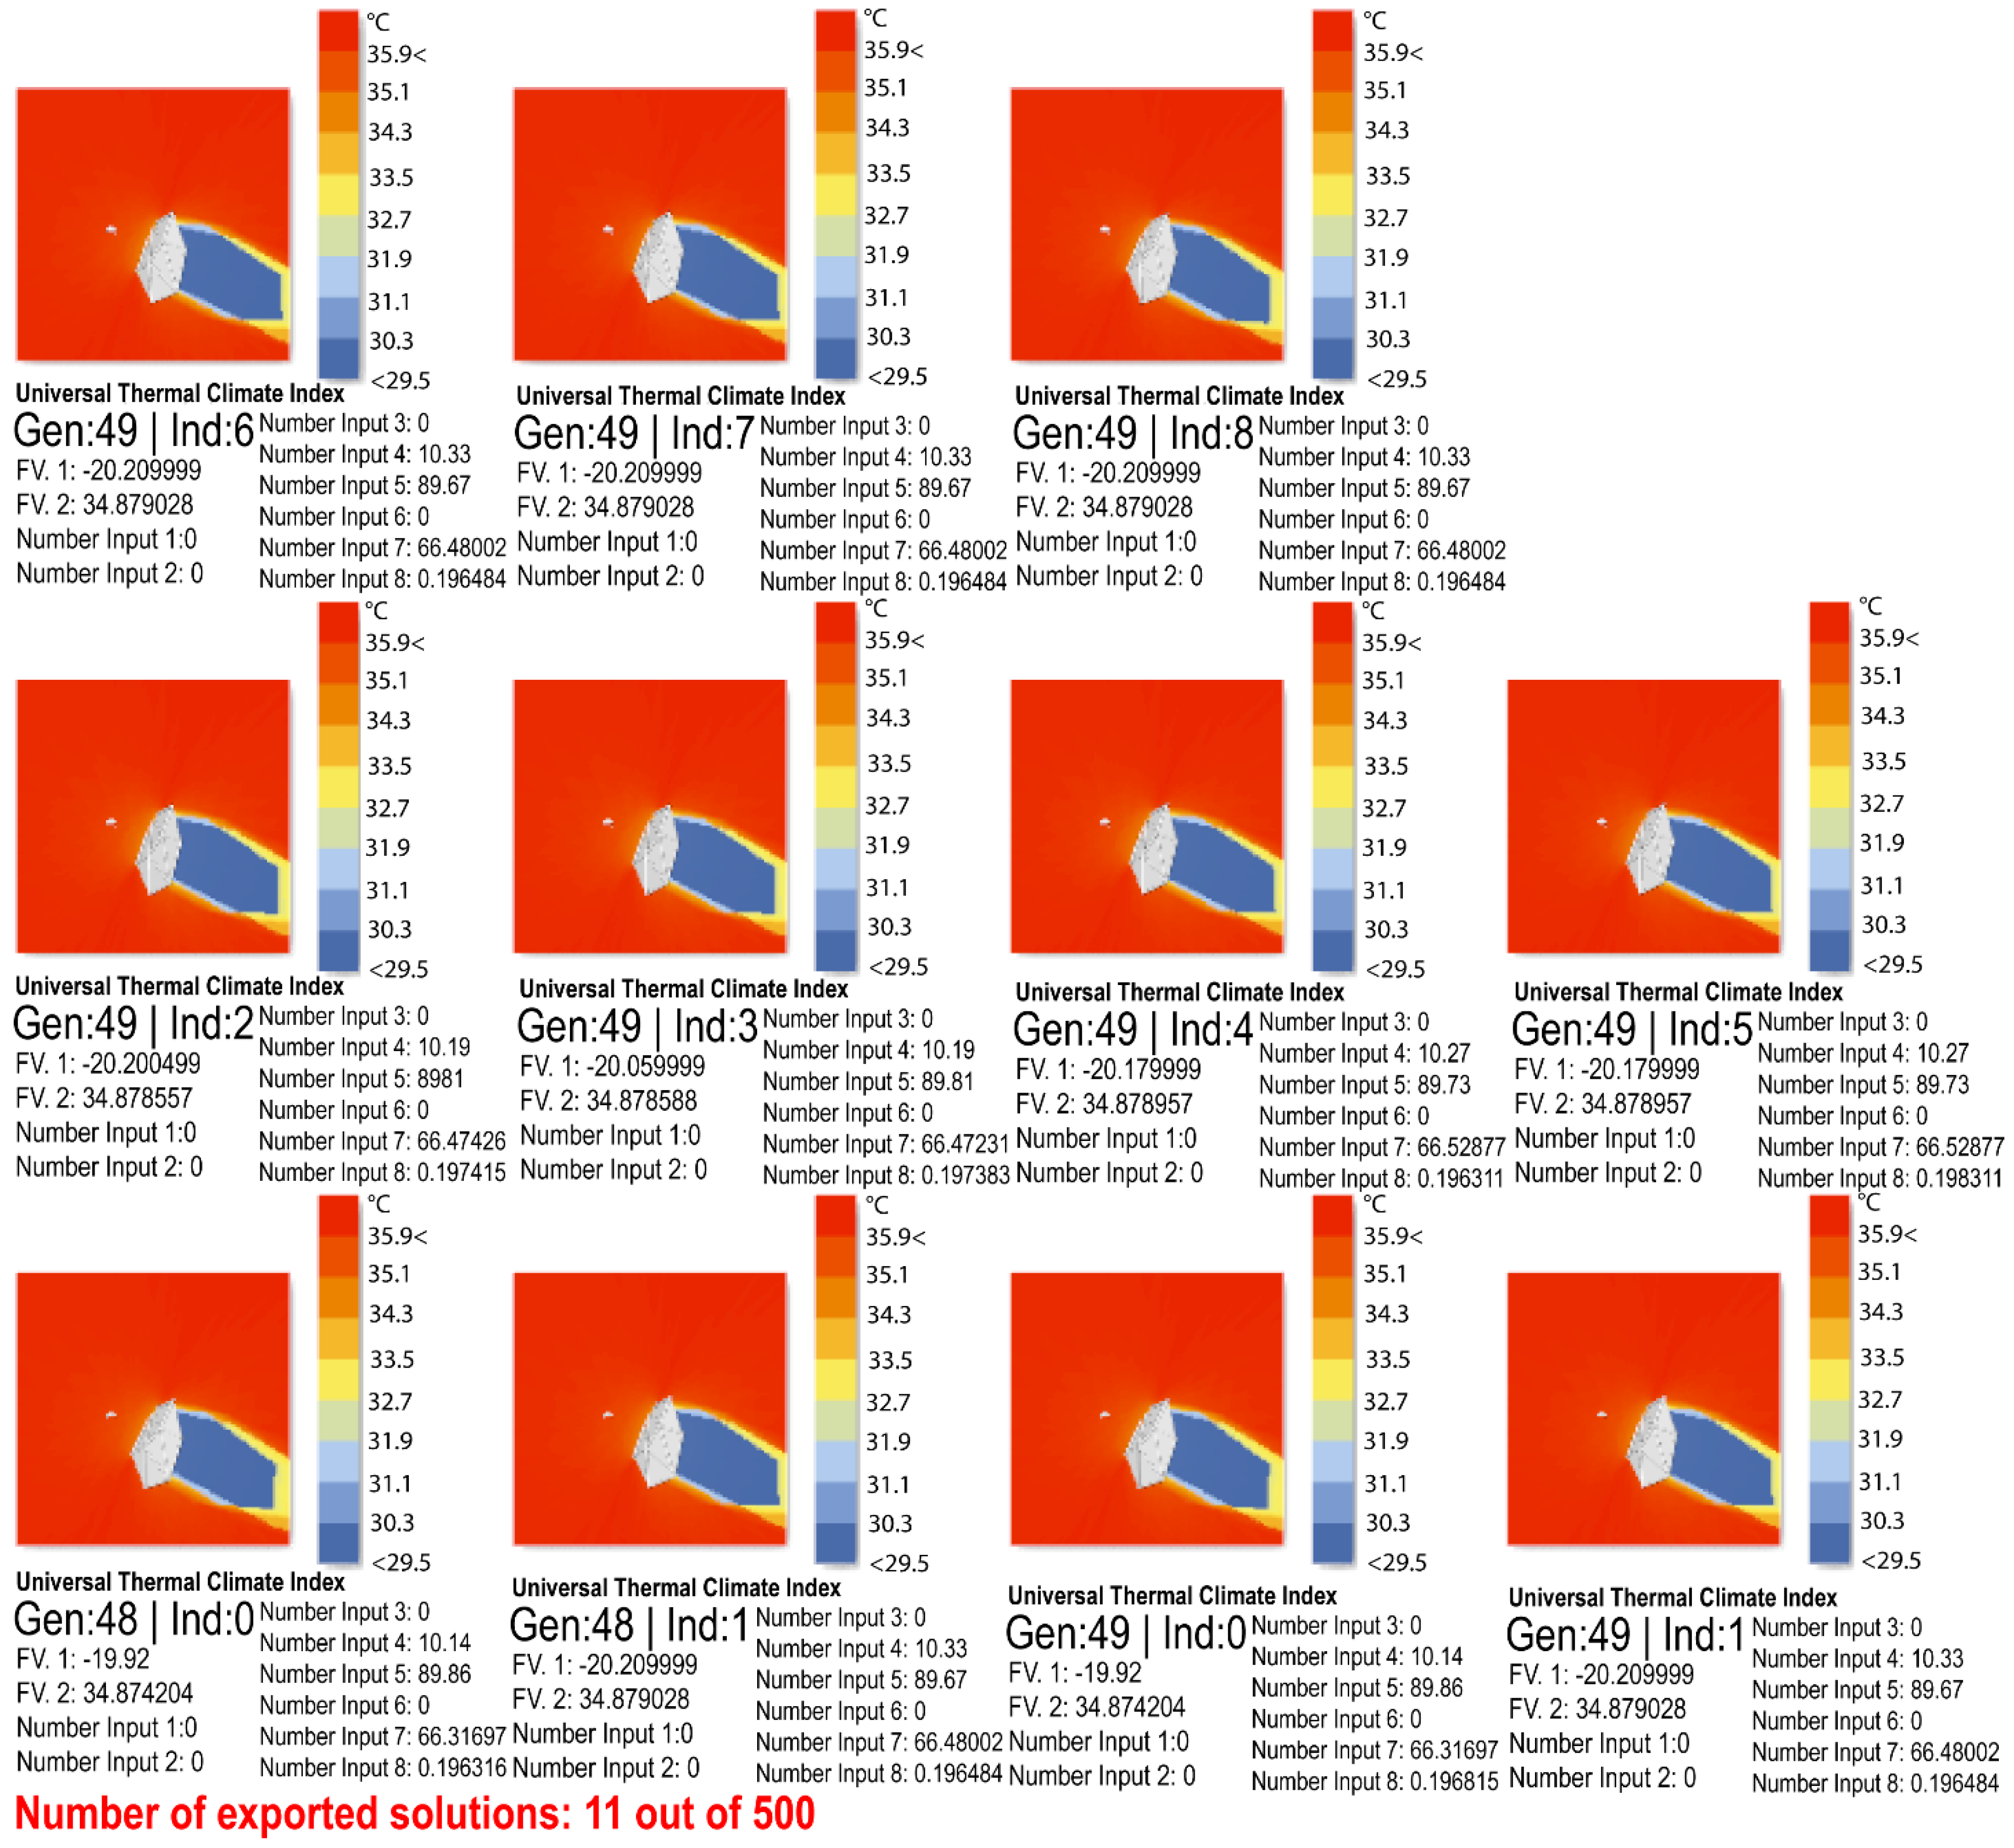
Figure 7 groups visualizations of the phenotypes listed on Table 4 and Table 5. From a plan view, Figure 7 allows an overall comparison among the different shading positions at different times. For a close-up visualization of the different phenotypes, see Appendix A. From the phenotypes, the time-changing positions of the dynamic shadings can be easily observed. To better visualize the variability throughout the day and seasons, some specific phenotypes are selected and presented in Figure 8. Thus, the changes in the folding and rotational angles can be noticed. During the summer, the shading looks inclined during mornings, but almost vertically aligned at middays, and almost horizontally positioned during the afternoon. During the winter, the folding angles are similar to those displayed in the summer, but the rotational angles are different.
4.2. Verification of Results
In order to assess the environmental verification of the results, specific phenotypes were selected from the Pareto Front solutions (Figure 6). The selected phenotypes are listed in Table 6; they were modelled with the genes’ information taken from the Pareto Front. On average, the fitness optimization results showed a good agreement with the replicated shading results. This finding was significant for both the UTCI degrees and the shaded areas. From Table 6, it is observed that shadings affected the average outdoor thermal comfort significantly, particularly during the summer. For example, UTCI achieved 41.5 °C with no shadings but 34.1 °C with shadings, at midday. The absolute differences during the summer were 3.9, 7.4, and 3.1 °C at 8, 12, and 16 h, respectively. The absolute differences during the winter were 1.4, 3.5, and 2 °C at 8, 12, and 16 h, respectively. From here, it is confirmed that shadings contribute to enhancing the outdoor thermal comfort, which in turn influences the perception and satisfaction of the pedestrians. Thus, it is expected that the presence of the shadings in the open urban space also contributes to the overall outdoor thermal comfort due to the decreases in emitting the longwave radiation from the ground.
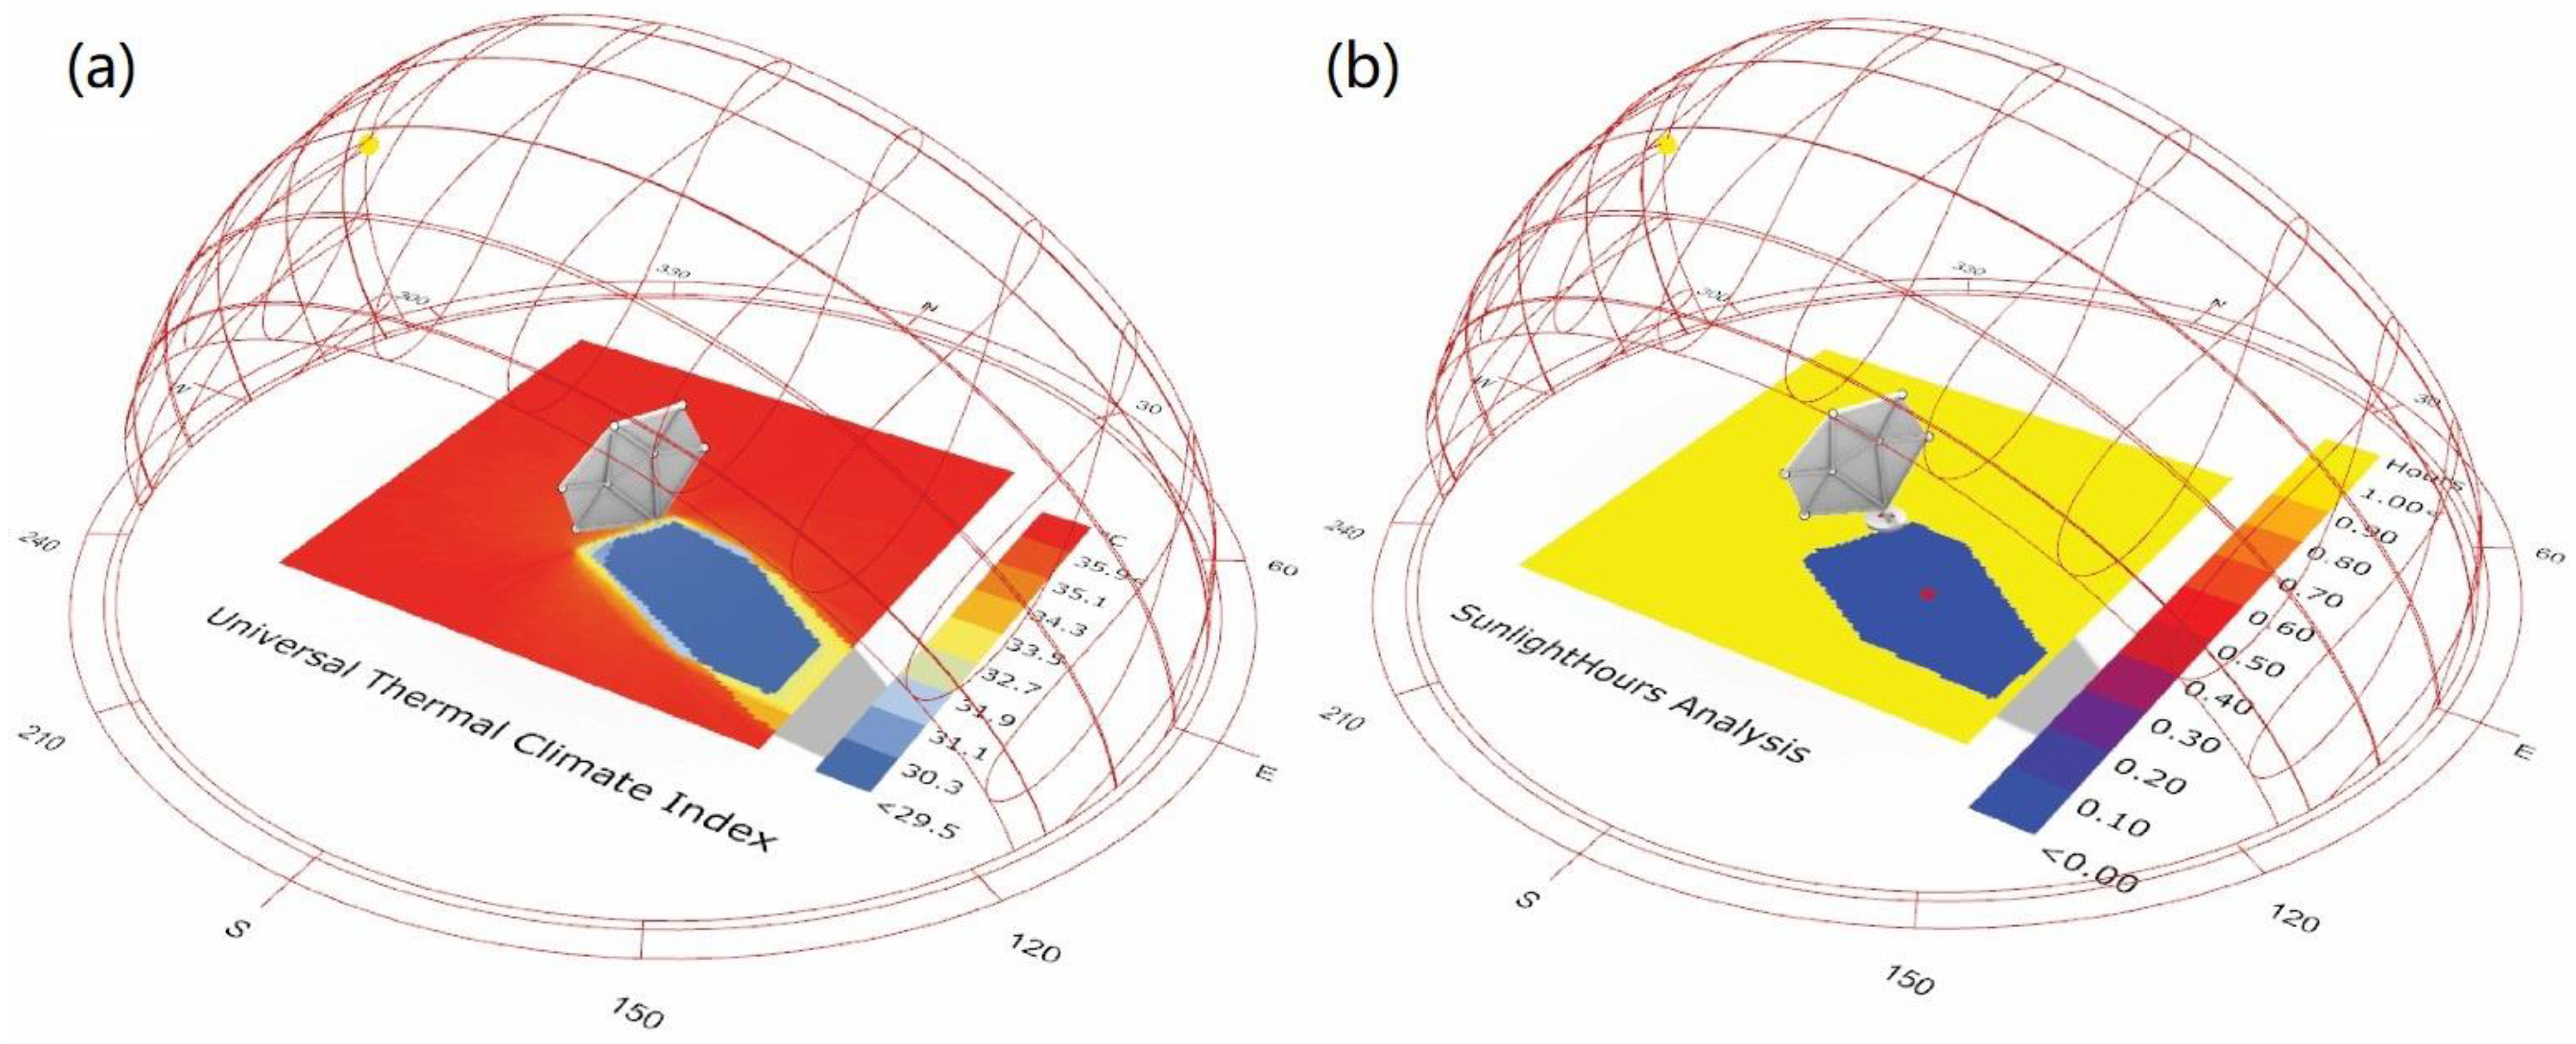
Concerning the environmental results, a specific shading configuration was included in Figure 9. Thus, the simulated results for 21 June, at 16 h, are revealed as an example of a selected phenotype performance.
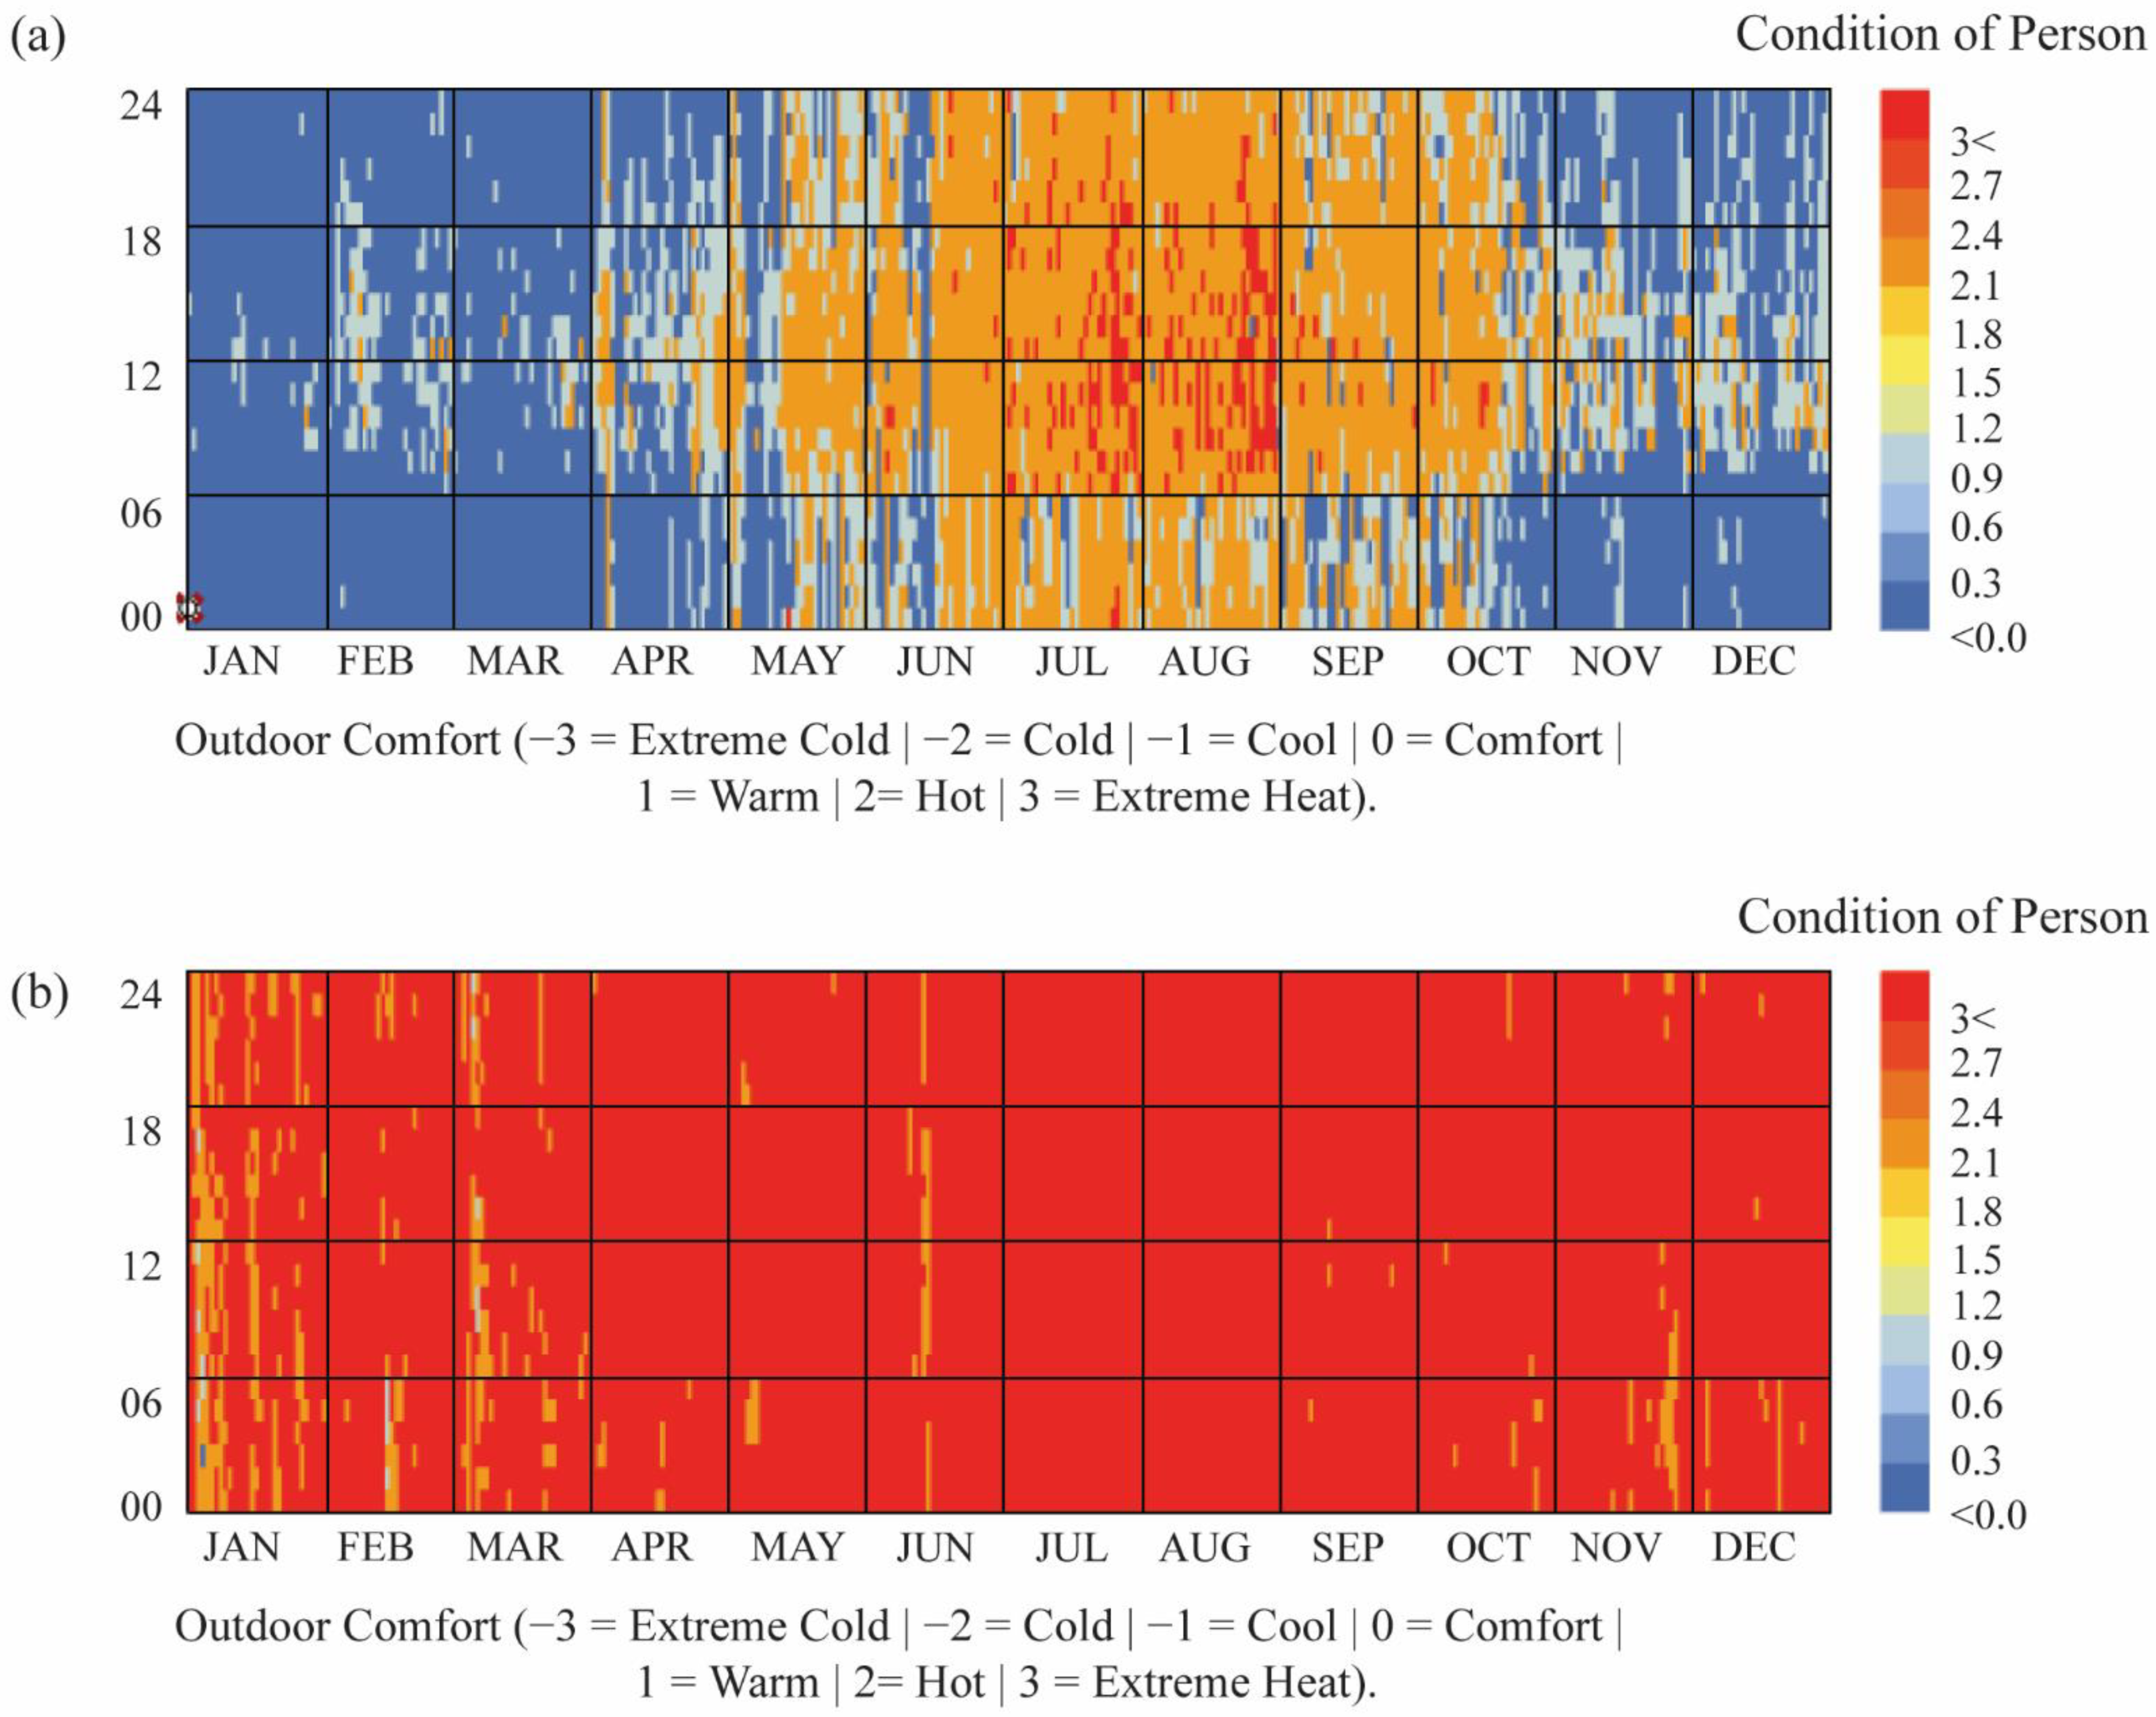
Furthermore, the yearly condition of a person under the shadings vs. under the exposed sunlit area (with no shadings) is compared. As a result, a significant improvement of the pedestrians’ thermal comfort is revealed. Figure 10b indicates a predominant stress category of extreme heat throughout the year when no shadings are placed on the site. This thermal condition is dangerous since it has been recognized as a potential public health hazard with higher-than-normal mortality rates. As observed from the temporal map, this problem would be present, even during the night hours. A possible explanation for this might be that the heat absorbed by the concrete pavement throughout the day is released to compensate for the drop in temperature.
Nevertheless, when the dynamic shadings are working in place, the dominant stress categories varying from comfortable to warm and hot throughout the year, as Figure 10a depicts. According to these categories, the sensation is comfortable or warm but comfortable for short periods; moreover, no public health hazard is recognized. Here, it is important to note that these stress categories coincide with the UTCI degrees considered acceptable for this study context (please refer to Section 3.2).
5. Discussion
This study has been successful as it was able to identify specific shadings positions (folding and rotational angles) for specific times during the year that allow enhancing the outdoor experience of pedestrians in terms of thermal comfort. Hence, the dynamic shadings responded to specific environmental conditions and contributed to reducing the thermal stress and to increasing the shaded areas. To develop a full picture of the adaptive shadings and environmental performance, additional optimizations during the hottest day of each month will be addressed in a continuation of this work.
Furthermore, it is expected that such dynamic shadings can contribute to the urban livability of the studied urban open space. This is an important issue for future research that should be undertaken to investigate how pedestrians interact with a prototype placed on site. Fabrication and assembly are now possible by using other digital electronic prototyping add-ons in Grasshopper, such as Firefly that works in conjunction with Arduino IDE and digital fabrication platforms such as RhinoCAM.
Regarding the time changing of the shadings, it not only provides more comfortable zones but also can make the public space more attractive. These structures are meant to have the potentiality to become part of the public art network of the place. This would add a sense of identity for the place and the users. In this respect, the exploration of the disposition of the structures in the public space is an interesting asset in terms of aesthetics and should be further explored.
In this work, the use of a multiobjective optimization algorithm was very important for identifying the best shading solutions. Hence, Wallacei X allows storing the results to replicate the genes and the 3D shadings for further evaluations. However, Wallacei X does not allow establishing specific ranges for the targets. This means that the function objectives should maximize or minimize a specific single fitness value. This could be considered a disadvantage when performing evaluations for temperate and cold climates, for which the condition of person could range from extreme cold to extreme hot. Other multiobjective optimization algorithms such as Octopus or Goldfish could be tested to find the option that better fits with the study objectives (although these algorithms do not allow storing the results).
From the above, the application of the proposed methodology should be further tested in other climates, unlike from the tropical one. To accomplish that, some adjustments to the fitness objectives should be carried out according to the climate studied. The final objective will be the same: the environmental adaptability of dynamic structures in open public spaces. As mentioned in the literature review, dynamic shadings represent a significant advantage, in comparison with static structures.
Different algorithms could be implemented in further investigations to test if they contribute to reducing the simulation and optimization times. By replicating the shapes derived from single-objective optimizations and comparing them with the shapes derived from multiobjective optimizations, UTCI data and shaded areas could also be compared. The continuous development of new algorithms seems to be quite promising to accomplish this task in the near future.
6. Conclusions
This work proposes a workflow that involves the use of parametric 3D modelling (Grasshopper) together with evolutionary algorithms (Wallacei X) and environmental tools (Ladybug) during the early design process of dynamic shadings used in open urban spaces. The integrated design aims to find optimal shading positions that contribute to enhancing outdoor thermal comfort since the structures are proposed to be time-changing according to specific environmental factors, such as the sun trajectories throughout the year.
The workflow has shown to be versatile in choosing the sample evaluation size, leading to saving time during the optimization process. This versatility also allows analyzing the resulting phenotypes and plotting the results in a fast way within a friendly interface (Phyton in Grasshopper). The multiobjective optimization algorithm, Wallacei X, was advantageous here, as it makes it possible to select one or several optimal solutions from the original sample. The specific information of the genes and genomes taken from the selected phenotypes was then stored for a subsequent replication and evaluation of the environmental targets. This is an important advantage of the implemented algorithm instead of others currently available that do not allow storing the information data.
The workflow has also shown to be efficient by integrating environmental calculations of specific indexes, such as the UTCI (°C) and shaded areas (m2). The UTCI is the result of the world’s leading comfort specialists’ attempt to make an international standard of outdoor temperature sensation that is valid in all climates, seasons, and scales. Therefore, the present work represents a forward step that responds to the urgent need for climate-specific solutions to improve outdoor comfort.
Regarding the optimal phenotypes, they contribute to reducing thermal stress by generating shaded areas that responded to the sun trajectories of the latitude studied. Acceptable temperatures were then achieved for the condition of person throughout the year: comfortable conditions and warm but comfortable for short periods. Although during the summer the achieved conditions were hot (but no public health hazard), it was found from the literature review that people tend to tolerate wider temperature ranges as acceptable temperatures in warm and humid climates due to the greater degree of thermal adaptation of the residents. The absolute differences accounted during the summer were 3.9, 7.4, and 3.1 °C at 8, 12, and 16 h, respectively. The absolute differences during the winter were 1.4, 3.5, and 2 °C at 8, 12, and 16 h, respectively.
The results here presented are linked to the chosen case study. However, it is believed that the workflow here proposed could be extended to analyze different geographical locations where the structures are shaped and adapted according to the specific latitude and weather conditions. More evaluations should be further developed to include a greater variety of climates and to test the time changing of the urban shadings.
The proposed dynamic structures are planned to be prototyped and transferred to different geographical areas where this methodology can be applied in order to generate different simulations and optimizations. This future work will involve the development and fabrication of an electronic prototype at a 1:1 scale, using platforms such as Arduino and Firefly in Grasshopper.
The construction of the prototype will allow further comparison between the simulated results and measurements taken on site. Moreover, important findings are expected to be assessed from the operation of the dynamic structure. Regarding the contribution to the urban livability of open urban spaces, the prototype also allows exploring its possibilities in terms of public art and monitoring the users’ interaction in terms of symbolic and social dynamics.
Author Contributions
Conceptualization, D.A.C. and E.G.M.; methodology, D.A.C. and E.G.M.; software, E.G.M. and D.A.C.; validation, E.G.M. and D.A.C.; formal analysis, E.G.M, and D.A.C.; investigation, D.A.C., E.G.M., R.V. and E.G.J.; resources, E.G.M., D.A.C. and E.G.J.; data curation, D.A.C. and E.G.M.; writing—original draft preparation, D.A.C.; writing—review and editing, D.A.C., E.G.M. and E.G.J.; visualization, E.G.M., D.A.C. and R.V.; supervision, D.A.C. and E.G.M. All authors have read and agreed to the published version of the manuscript.
Funding
This research received no external funding.
Institutional Review Board Statement
Not applicable.
Informed Consent Statement
Not applicable.
Acknowledgments
The authors acknowledge the support of Universidad de las Americas Puebla and CONACYT.
Conflicts of Interest
The authors declare no conflict of interest.
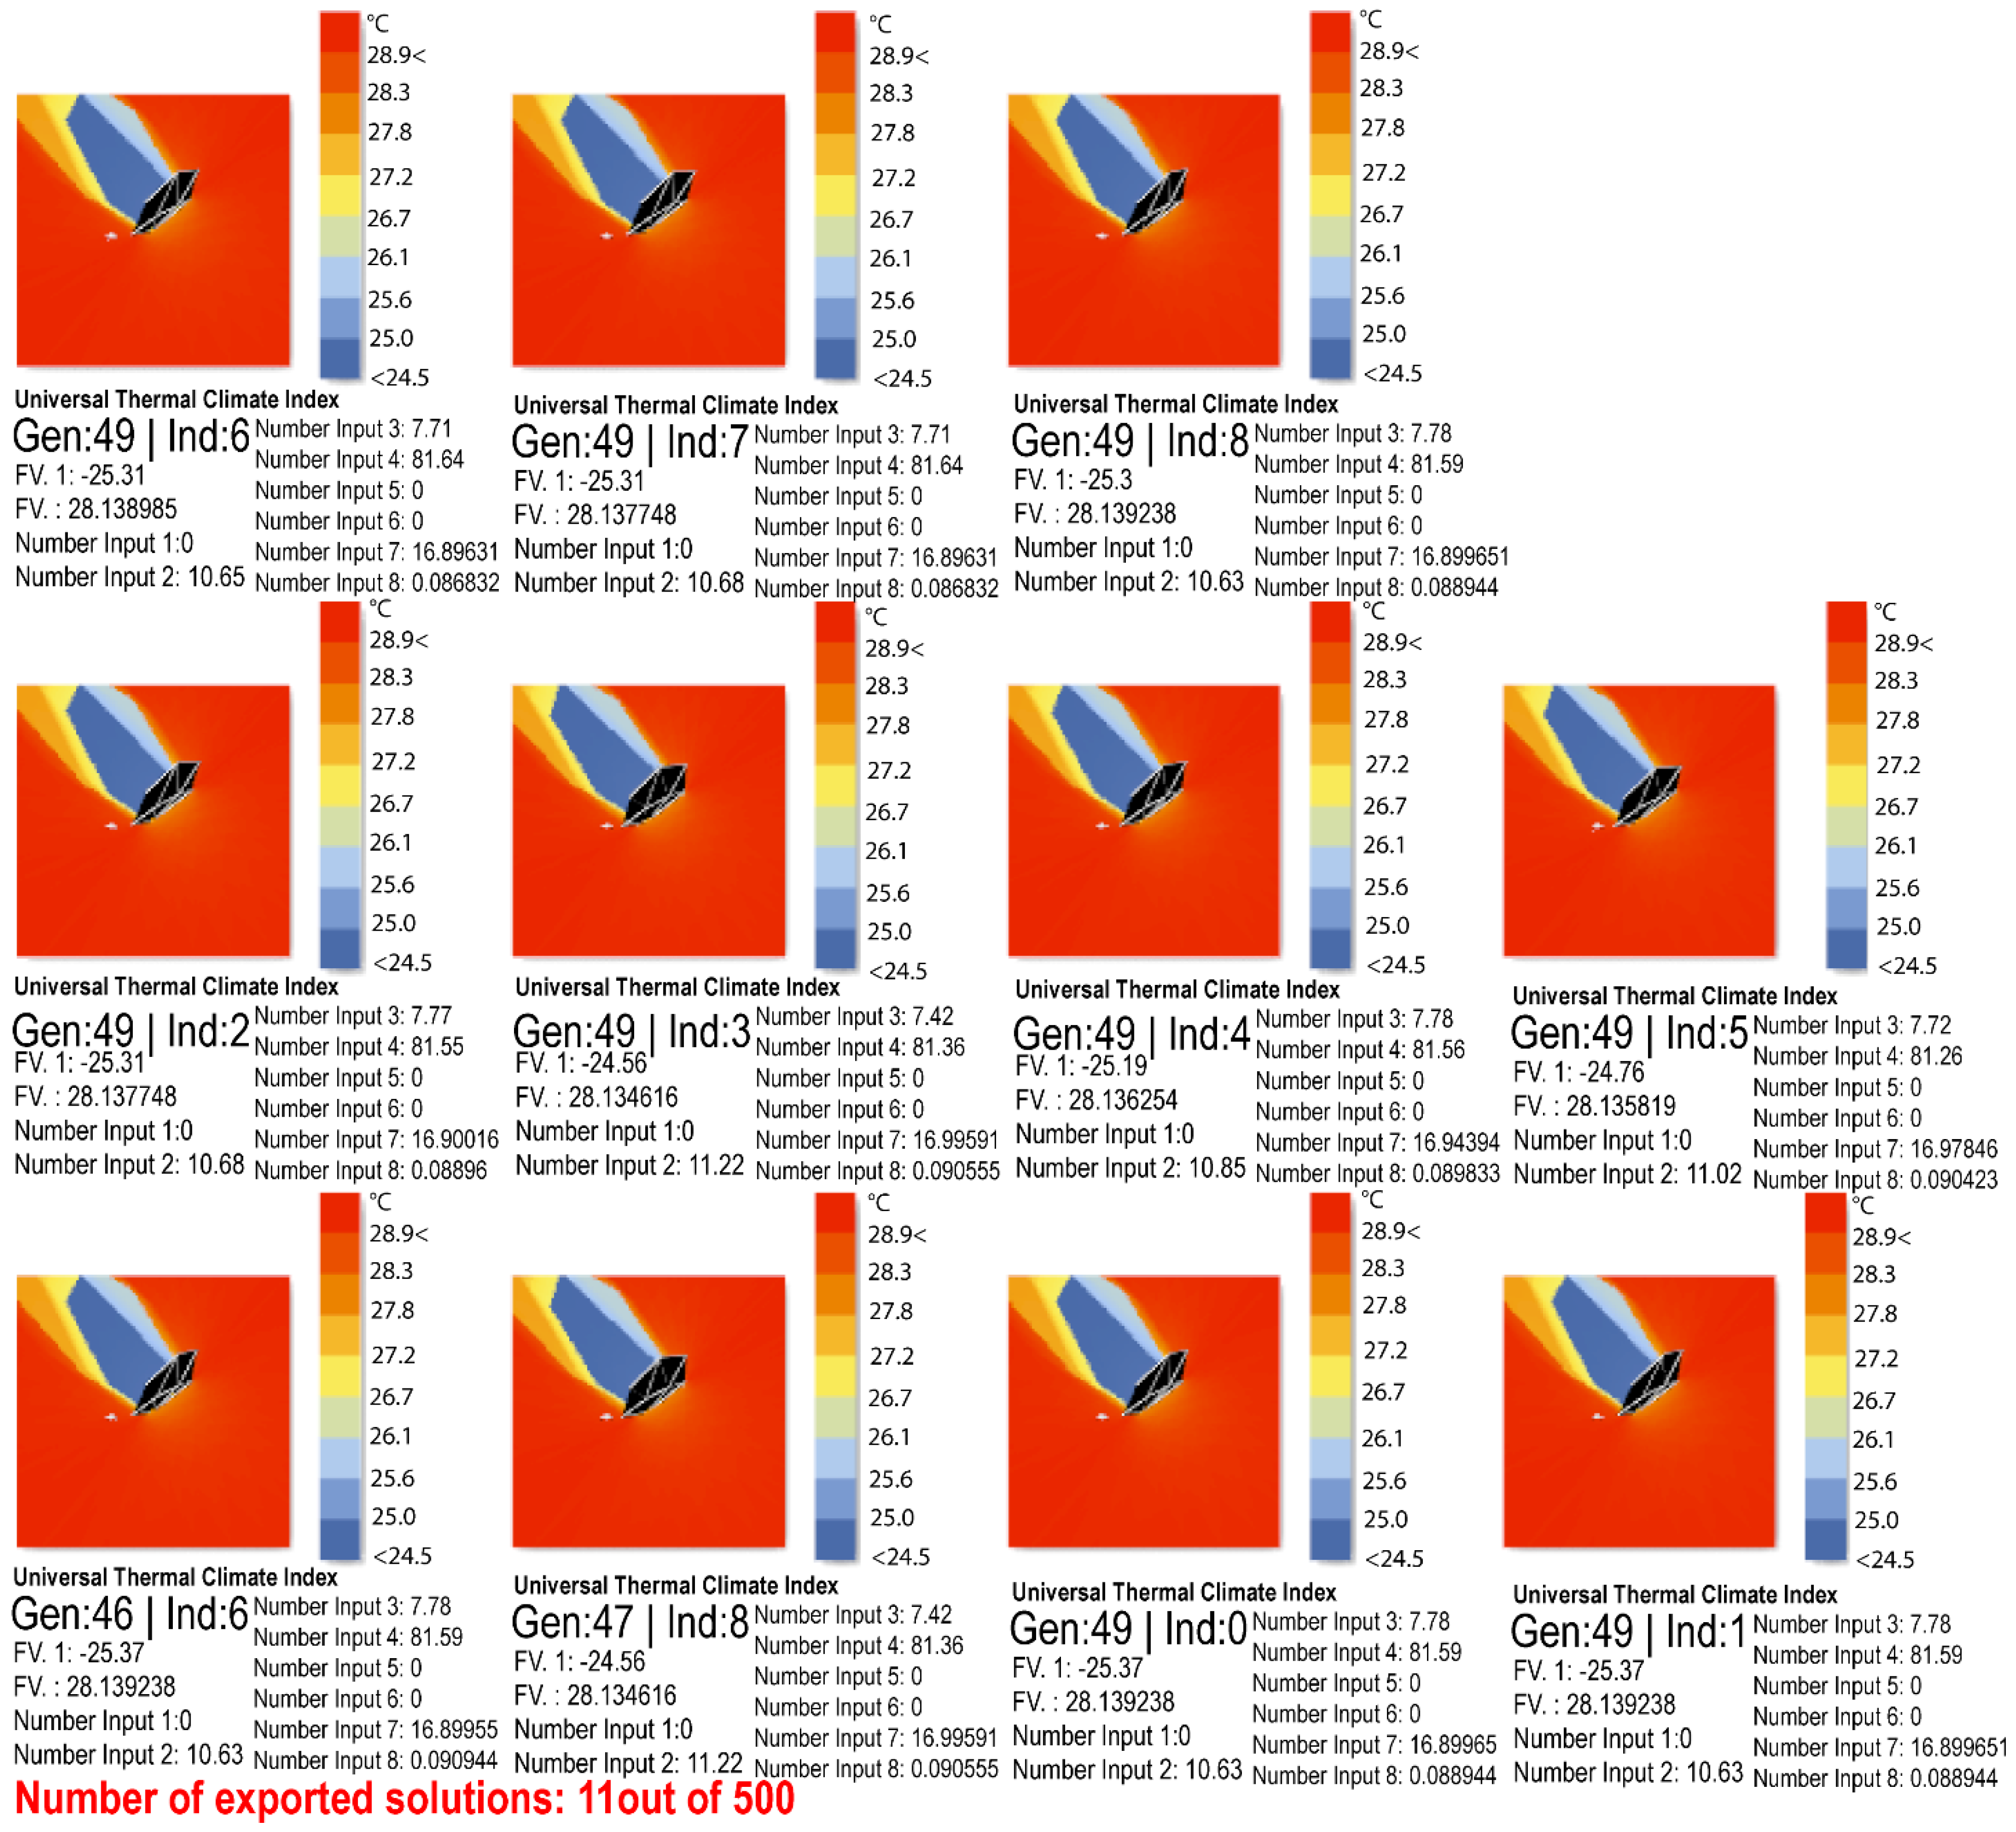
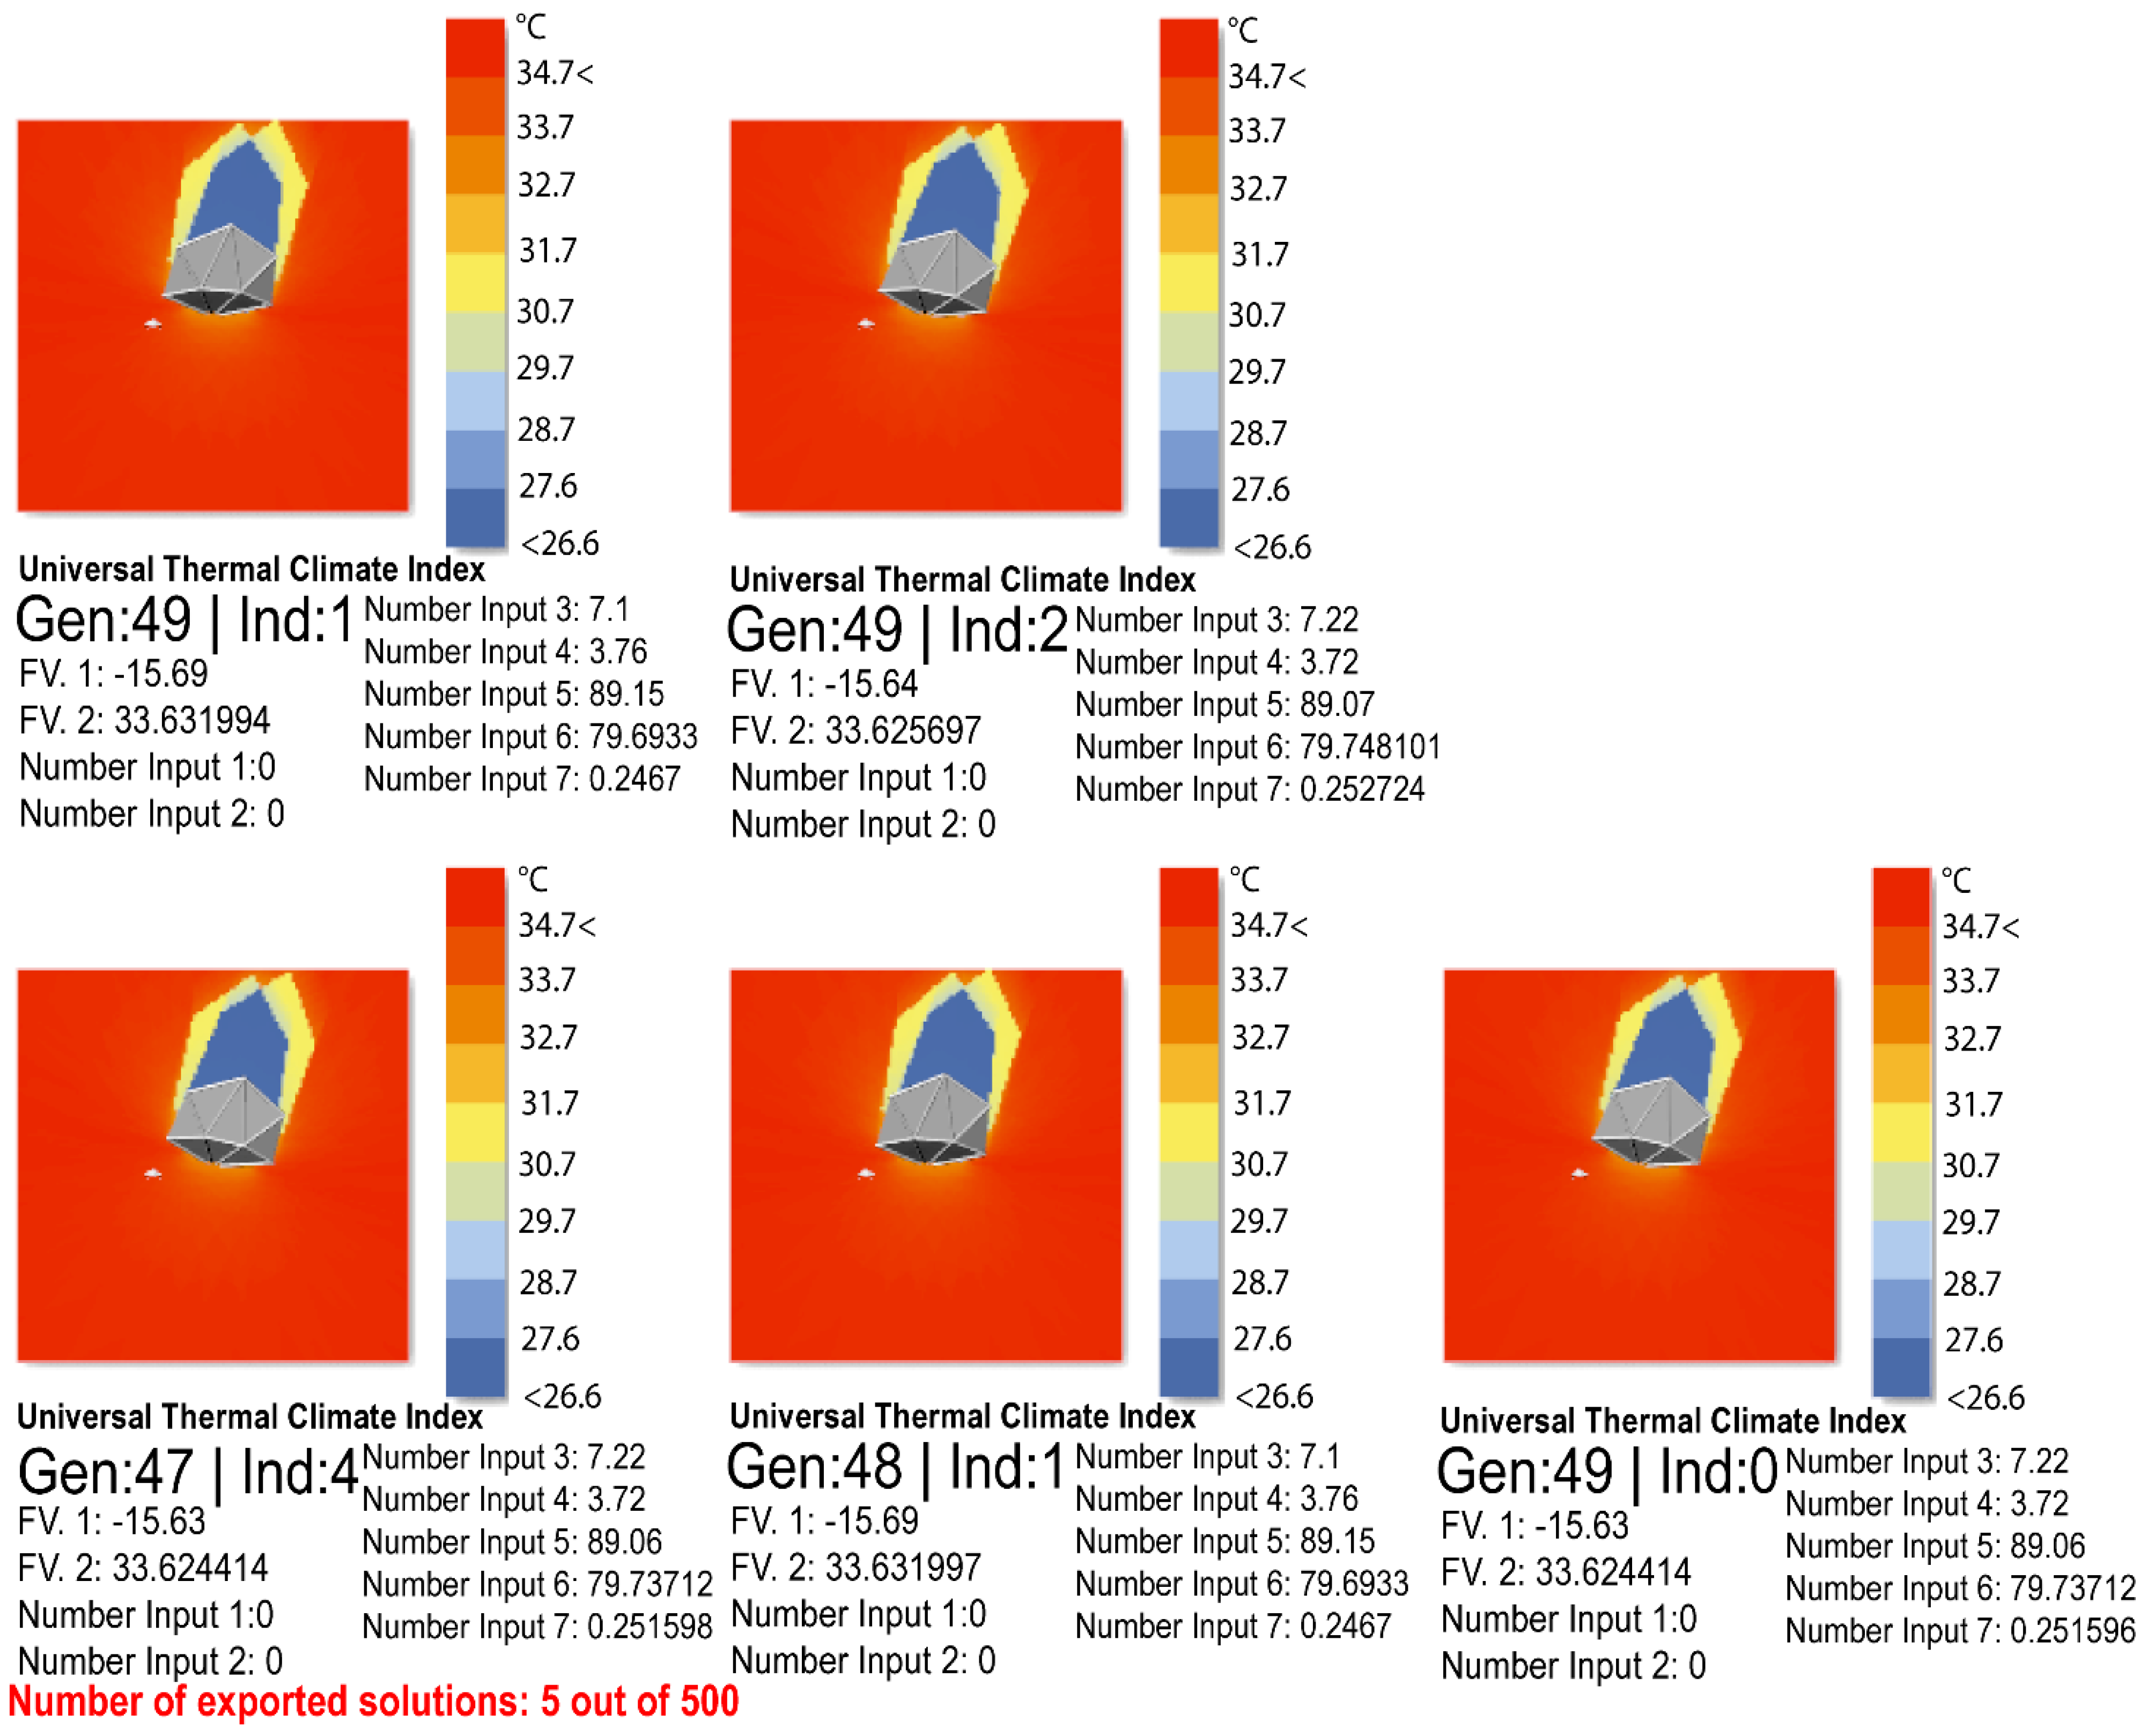
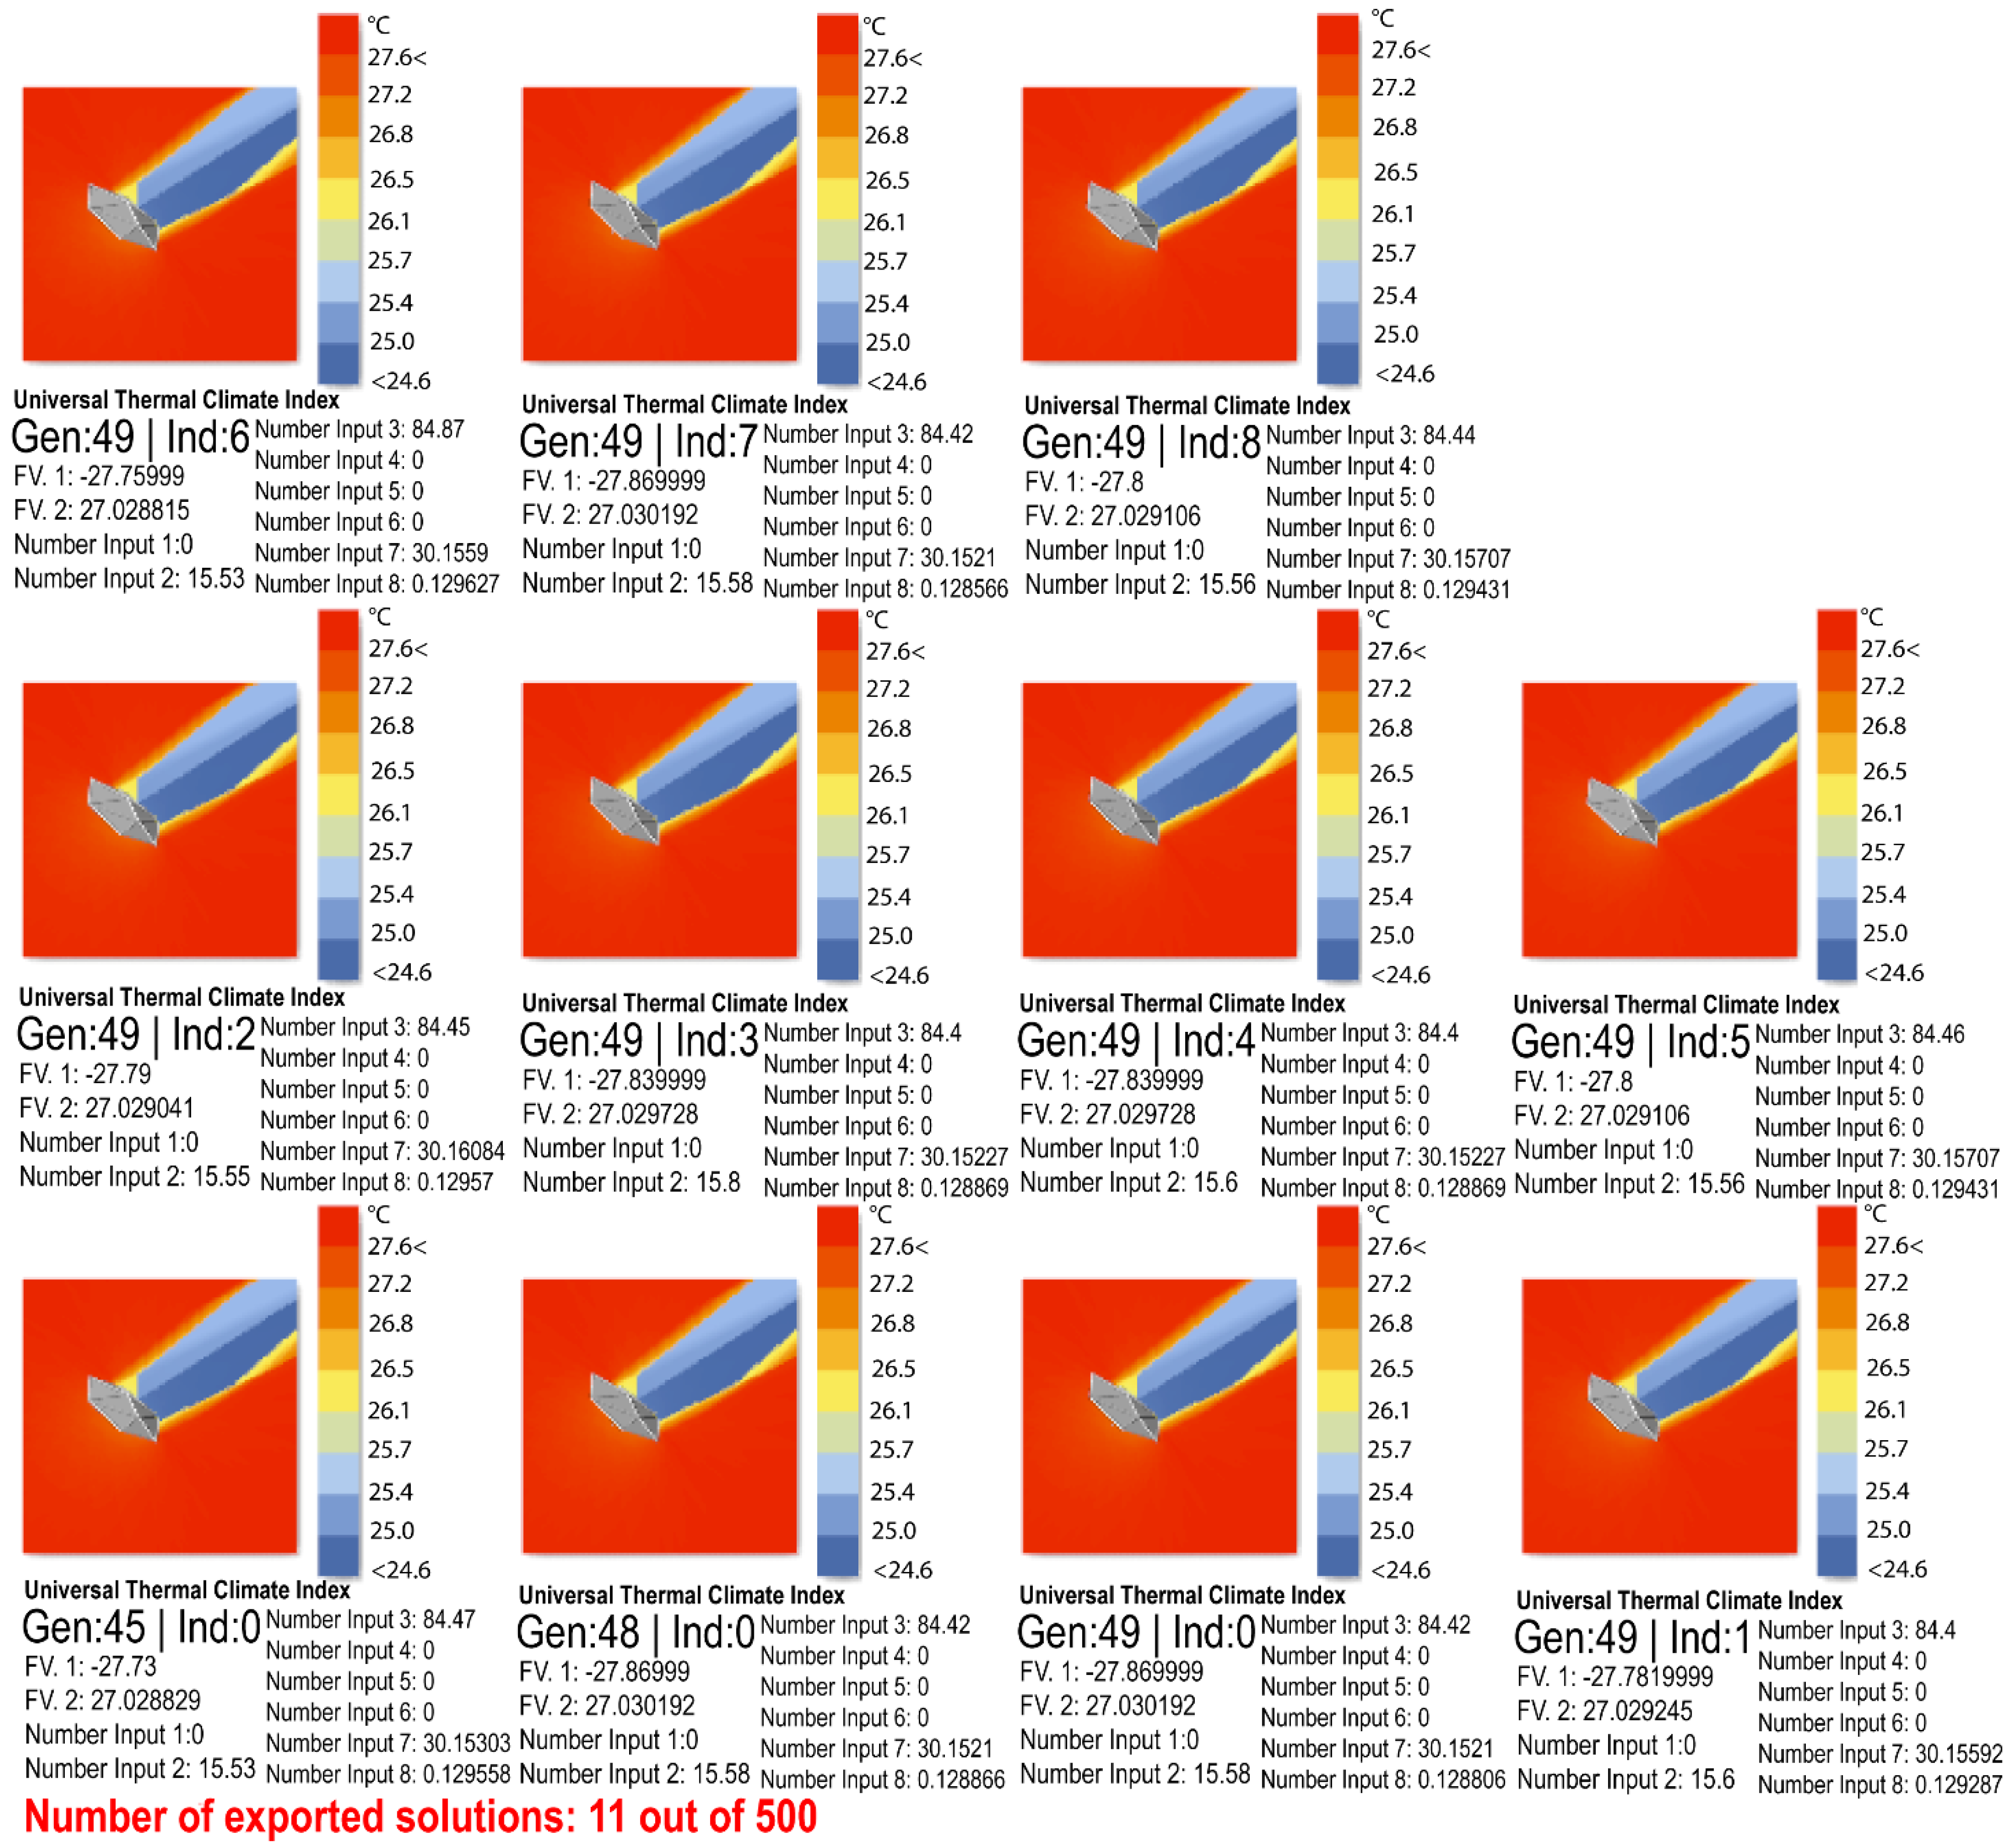
Appendix A
Figure 7 was subdivided into six parts, each containing the replicated phenotypes for the summer and winter times. Thus, the time-changing positions of the dynamic shadings can be easily observed. This appendix presents the 6 subfigures grouping the phenotypes by the daytime studied. Figure A1, Figure A2 and Figure A3 correspond to the phenotypes for the summer day at 8, 12, and 16 h, respectively. Figure A4, Figure A5 and Figure A6 correspond to the phenotypes for the winter day at 8, 12, and 16 h, respectively.
Figure A1.
Pareto Front phenotypes of 21 June, 8:00 h.

Figure A2.
Pareto Front phenotypes of 21 June, 12:00 h.

Figure A3.
Pareto Front phenotypes of 21 June, 16:00 h.

Figure A4.
Pareto Front phenotypes of 21 December, 8:00 h.

Figure A5.
Pareto Front phenotypes of 21 December, 12:00 h.

Figure A6.
Pareto Front phenotypes of 21 December, 16:00 h.

References
- Alijani, S.; Pourahmad, A.; Nejad, H.H.; Ziari, K.; Sodoudi, S. A new approach of urban livability in Tehran: Thermal comfort as a primitive indicator. Case study, district 22. Urban Clim. 2020, 33, 100656. [Google Scholar] [CrossRef]
- Nazarian, N.; Acero, J.A.; Norford, L. Outdoor thermal comfort autonomy: Performance metrics for climate-conscious urban design. Build. Environ. 2019, 155, 145–160. [Google Scholar] [CrossRef]
- Manchanda, S.; Steemers, K. Environmental Control and the Creation of Well-Being; Springer: New York, NY, USA, 2011. [Google Scholar] [CrossRef]
- Katzschner, L. Open Space Design Strategies Based on Thermal Confort Analysis. In Proceedings of the PLEA Conference, Eindhoven, The Netherlands, 19–21 September 2004; pp. 47–52. [Google Scholar]
- Kashef, M. Urban livability across disciplinary and professional boundaries. Front. Arch. Res. 2016, 5, 239–253. [Google Scholar] [CrossRef] [Green Version]
- Borja, J.; Muxí, Z. El Espacio Público: Ciudad y Ciudadanía; Barcelona, D., Ed.; First; Electa Barcelona: Barcelona, Spanish, 2003; ISBN 84-8156-343-9. [Google Scholar]
- Nikolopoulou, M.; Lykoudis, S. Thermal comfort in outdoor urban spaces: Analysis across different European countries. Build. Environ. 2006, 41, 1455–1470. [Google Scholar] [CrossRef] [Green Version]
- Spagnolo, J.; de Dear, R. A field study of thermal comfort in outdoor and semi-outdoor environments in subtropical Sydney Australia. Build. Environ. 2003, 38, 721–738. [Google Scholar] [CrossRef] [Green Version]
- Thorsson, S.; Lindqvist, M.; Lindqvist, S. Thermal bioclimatic conditions and patterns of behaviour in an urban park in Göteborg, Sweden. Int. J. Biometeorol. 2004, 48, 149–156. [Google Scholar] [CrossRef]
- Ng, E.; Cheng, V. Urban human thermal comfort in hot and humid Hong Kong. Energy Build. 2012, 55, 51–65. [Google Scholar] [CrossRef]
- Nikolopoulou, M.; Baker, N.; Steemers, K. Thermal comfort in outdoor urban spaces: Understanding the human parameter. Sol. Energy 2001, 70, 227–235. [Google Scholar] [CrossRef]
- Lai, D.; Lian, Z.; Liu, W.; Guo, C.; Liu, W.; Liu, K.; Chen, Q. A comprehensive review of thermal comfort studies in urban open spaces. Sci. Total Environ. 2020, 742, 140092. [Google Scholar] [CrossRef] [PubMed]
- Lin, T.-P.; Matzarakis, A.; Hwang, R.-L. Shading effect on long-term outdoor thermal comfort. Build. Environ. 2010, 45, 213–221. [Google Scholar] [CrossRef]
- Lin, T.-P. Thermal perception, adaptation and attendance in a public square in hot and humid regions. Build. Environ. 2009, 44, 2017–2026. [Google Scholar] [CrossRef]
- Yang, W.; Wong, N.H.; Jusuf, S.K. Thermal comfort in outdoor urban spaces in Singapore. Build. Environ. 2013, 59, 426–435. [Google Scholar] [CrossRef]
- Nikolopoulou, M.; Steemers, K. Thermal comfort and psychological adaptation as a guide for designing urban spaces. Energy Build. 2003, 35, 95–101. [Google Scholar] [CrossRef]
- Tahbaz, M. Primary stage of solar energy use in architecture-Shadow control. J. Central South Univ. 2012, 19, 755–763. [Google Scholar] [CrossRef]
- Hwang, R.-L.; Lin, T.-P.; Matzarakis, A. Seasonal effects of urban street shading on long-term outdoor thermal comfort. Build. Environ. 2011, 46, 863–870. [Google Scholar] [CrossRef]
- Mackey, C.; Roudsari, M.S.; Samaras, P. ComfortCover: A Novel Method for the Design of Outdoor Shades. In SimAUD 15: Proceedings of the Symposium on Simulation for Architecture and Urban Design; Society for Computer Simulation International: Alexandria, Virginia, 2015; pp. 111–118. [Google Scholar]
- Johansson, E.; Thorsson, S.; Emmanuel, R.; Krüger, E. Instruments and methods in outdoor thermal comfort studies—The need for standardization. Urban Clim. 2014, 10, 346–366. [Google Scholar] [CrossRef] [Green Version]
- Emmanuel, R. Urban Climate in the Tropics: Rethinking, Planning and Design Opportunities; Imperial College Press: London, UK, 2016; ISBN 978-1783268405. [Google Scholar]
- Heng, S.L.; Chow, W.T.L. How ‘hot’ is too hot? Evaluating acceptable outdoor thermal comfort ranges in an equatorial urban park. Int. J. Biometeorol. 2019, 63, 801–816. [Google Scholar] [CrossRef] [Green Version]
- Slowik, A.; Kwasnicka, H. Evolutionary algorithms and their applications to engineering problems. Neural Comput. Appl. 2020, 32, 12363–12379. [Google Scholar] [CrossRef] [Green Version]
- Caetano, I.; Santos, L.; Leitão, A. Computational design in architecture: Defining parametric, generative, and algorithmic design. Front. Arch. Res. 2020, 9, 287–300. [Google Scholar] [CrossRef]
- Nikolopoulou, M. Outdoor thermal comfort. Front. Biosci. 2011, 3, 1552–1568. [Google Scholar] [CrossRef] [PubMed]
- Alfano, F.R.D.; Palella, B.I.; Riccio, G. Thermal Environment Assessment Reliability Using Temperature —Humidity Indices. Ind. Health 2011, 49, 95–106. [Google Scholar] [CrossRef] [PubMed] [Green Version]
- Potchter, O.; Cohen, P.; Lin, T.-P.; Matzarakis, A. Outdoor human thermal perception in various climates: A comprehensive review of approaches, methods and quantification. Sci. Total Environ. 2018, 631–632, 390–406. [Google Scholar] [CrossRef] [PubMed]
- Höppe, P. The physiological equivalent temperature—A universal index for the biometeorological assessment of the thermal environment. Int. J. Biometeorol. 1999, 43, 71–75. [Google Scholar] [CrossRef]
- Fanger, P.O. Thermal Comfort; Hill, M., Ed.; McGraw Hill: New York, NY, USA, 1970. [Google Scholar]
- Jendritzky, G.; De Dear, R.; Havenith, G. UTCI—Why another thermal index? Int. J. Biometeorol. 2011, 56, 421–428. [Google Scholar] [CrossRef] [Green Version]
- Gagge, A.P.; Fobelets, A.P.; Berglund, L.G. A Standard Predictive Index of Human Response to the Thermal Environment. ASHRAE Trans. 1986, 92, 85–101. [Google Scholar]
- Höppe, P.R. Heat balance modelling. Cell. Mol. Life Sci. 1993, 49, 741–746. [Google Scholar] [CrossRef] [PubMed]
- Fiala, D.; Havenith, G.; Bröde, P.; Kampmann, B.; Jendritzky, G. UTCI-Fiala multi-node model of human heat transfer and temperature regulation. Int. J. Biometeorol. 2011, 56, 429–441. [Google Scholar] [CrossRef] [PubMed] [Green Version]
- Bröde, P.; Krüger, E.; Rossi, F.A.; Fiala, D. Predicting urban outdoor thermal comfort by the Universal Thermal Climate Index UTCI—a case study in Southern Brazil. Int. J. Biometeorol. 2011, 56, 471–480. [Google Scholar] [CrossRef] [PubMed]
- Broede, P.; Fiala, D.; Blazejczyk, K.; Holmér, I.; Jendritzky, G.; Kampmann, B.; Tinz, B.; Havenith, G. Deriving the operational procedure for the Universal Thermal Climate Index (UTCI). Int. J. Biometeorol. 2011, 56, 481–494. [Google Scholar] [CrossRef] [PubMed] [Green Version]
- Young, A. Universal Thermal Climate Index; UTCI, 2017; Available online: http://www.utci.org/ (accessed on 12 April 2021).
- Roudsari, M.S. Ladybug: A Plugin for Environmental Analysis (GPL). Available online: https://github.com/mostaphaRoudsari/ladybug (accessed on 10 May 2021).
- Roudsari, M.S. Outdoor Comfort Calculator—Source Code. In Ladybug Primer; Available online: https://mostapharoudsari.gitbooks.io/ladybug-primer/content/text/components/Outdoor_Comfort_Calculator.html (accessed on 16 June 2021).
- Alharthi, M.; Sharples, S. Modelling and Testing Extendable Shading Devices to Mitigate Thermal Discomfort in a Hot Arid Climate. In Proceedings of the 35th PLEA 2020 Planning Post Carbon Cities, A Coruña, Spain, 1–3 September 2020; pp. 654–659. [Google Scholar] [CrossRef]
- Gane, V. Parametric Design—A Paradigm Shift? Master’s Thesis, Massachusetts Institute of Technology, Department of Architecture, Boston, MA, USA, 2004. [Google Scholar]
- Østergård, T.; Jensen, R.L.; Maagaard, S.E. Building simulations supporting decision making in early design—A review. Renew. Sustain. Energy Rev. 2016, 61, 187–201. [Google Scholar] [CrossRef] [Green Version]
- Wang, W.; Zmeureanu, R.; Rivard, H. Applying multi-objective genetic algorithms in green building design optimization. Build. Environ. 2005, 40, 1512–1525. [Google Scholar] [CrossRef]
- Day, M. Rhino Grasshopper. AEC Magazine, X3DMedia. 2010. Available online: https://aecmag.com/news/rhino-grasshopper/ (accessed on 12 April 2021).
- Davidson, S. Grasshopper: Algorithmic Modelling for Rhino. 2019. Available online: http://www.grasshopper3d.com (accessed on 21 January 2021).
- Roudsari, M.S.; Pak, M.; Smith, A. Ladybug: A Parametric Environmental Plugin for Grasshopper to Help Designers Create an Environmentally-Conscious Design. In Proceedings of the 13th Conference of International Building Peformance Simulation Association, Chambery, France, 26–28 August 2013; pp. 3128–3135. [Google Scholar]
- Fuller, D.; McNeil, A. Radiance—A Validated Lighting Simulation Tool—Radsite. Available online: https://www.radiance-online.org/ (accessed on 12 April 2021).
- U.S. Department of Energy (DOE). EnergyPlus Energy Simulation Software Version 9.3.0. 2020. Available online: https://energyplus.net/downloads (accessed on 12 April 2021).
- Mackey, C.; Galanos, T.; Norford, L.; Roudsari, M. Wind, Sun, Surface Temperature, and Heat Island: Critical Variables for High-Resolution Outdoor Thermal Comfort. In Proceedings of the 15th International Building Performance Simulation Association (IBPSA) Conferece, San Francisco, CA, USA, 7–9 August 2017; pp. 985–993. [Google Scholar]
- Elwy, I.; Ibrahim, Y.; Fahmy, M.; Mahdy, M. Outdoor microclimatic validation for hybrid simulation workflow in hot arid climates against ENVI-met and field measurements. Energy Procedia 2018, 153, 29–34. [Google Scholar] [CrossRef]
- Makki, M.; Showkatbakhsh, M. An Evolutionary Multi-Objective Optimization and Analytic Engine for Grasshopper 3D. Available online: https://www.wallacei.com/research (accessed on 10 May 2021).
- Ali, A.K.; Song, H.; Lee, O.J.; Kim, E.S.; Ali, H.H.M. Multi-Agent-Based Urban Vegetation Design. Int. J. Environ. Res. Public Health 2020, 17, 3075. [Google Scholar] [CrossRef]
- Navarro-Mateu, D.; Makki, M.; Cocho-Bermejo, A. Urban-Tissue Optimization through Evolutionary Computation. Mathematics 2018, 6, 189. [Google Scholar] [CrossRef] [Green Version]
- Remesar, A. New Urban Decorum? Aesthetics To and Fro. In Aesthetic Energy of the City; Gralińska-Toborek, A., Kazimierska-Jerzyk, W., Eds.; Wydawnictwo Uniwersytetu Łódzkiego (Łódź University Press): Lodz, Poland, 2016; ISBN 978-83-8088-152-5. [Google Scholar]
- Gonzalez, E.; Chi, D.A.; Gutierrez, E.; Valdivia, R. Performative Shading Structures for Public Spaces Applied in San Andrés Cholula, México. In Proceedings of the International Association for Shell and Spatial Structures (IASS) Annual Symposium, Barcelona, Spain, 7–10 October 2019; pp. 1295–1932. [Google Scholar]
- Chen, L.; Ng, E. Outdoor thermal comfort and outdoor activities: A review of research in the past decade. Cities 2012, 29, 118–125. [Google Scholar] [CrossRef]
- Hirashima, S.Q.D.S.; de Assis, E.S.; Nikolopoulou, M. Daytime thermal comfort in urban spaces: A field study in Brazil. Build. Environ. 2016, 107, 245–253. [Google Scholar] [CrossRef] [Green Version]
- Oropeza-Perez, I.; Petzold-Rodriguez, A.H.; Bonilla-Lopez, C. Adaptive thermal comfort in the main Mexican climate conditions with and without passive cooling. Energy Build. 2017, 145, 251–258. [Google Scholar] [CrossRef]
- Arens, E.; Hoyt, T.; Zhou, X.; Huang, L.; Zhang, H.; Schiavon, S. Modeling the comfort effects of short-wave solar radiation indoors. Build. Environ. 2015, 88, 3–9. [Google Scholar] [CrossRef] [Green Version]
- Arens, E.A.; Gonzalez, R.; Berglund, L. Thermal Comfort under an Extended Range of Environmental Conditions. ASHRAE Trans. 1986, 92, 18–26. [Google Scholar]
- Makki, M.; Showkatbakhsh, M.; Tabony, A.; Weinstock, M. Evolutionary algorithms for generating urban morphology: Variations and multiple objectives. Int. J. Arch. Comput. 2019, 17, 5–35. [Google Scholar] [CrossRef]
- Makki, M.; Showkatbakhsh, M.; Song, Y. Wallacei Primer 2.0. 2019. Available online: https://www.wallacei.com/ (accessed on 12 April 2021).
Figure 1.
Climatic factors of Cancun. Data from EPW file and visualization using Ladybug tools.

Figure 2.
Views of the Project Malecon Cancun Tajamar: actual state.

Figure 3.
Workflow used for the optimization of dynamic shadings.

Figure 4.
Dynamic shadings: (a) dimensions of the shading structure, (b) dimensions of the component units, (c) genes: folding and rotational axes, and (d) perspective view.
Figure 4.
Dynamic shadings: (a) dimensions of the shading structure, (b) dimensions of the component units, (c) genes: folding and rotational axes, and (d) perspective view.

Figure 5.
Example of shadings positions according to the sun trajectories in Cancun, Mexico, at 12 h (UTC-6).
Figure 5.
Example of shadings positions according to the sun trajectories in Cancun, Mexico, at 12 h (UTC-6).

Figure 6.
Second exercise with a population of 500 genomes. UTCI optimization graphs for 21 June: (a) 8 h, (b) 12 h, and (c) 16 h.
Figure 6.
Second exercise with a population of 500 genomes. UTCI optimization graphs for 21 June: (a) 8 h, (b) 12 h, and (c) 16 h.

Figure 7.
Pareto Front phenotypes: Solutions ranked as the best according to the two fitness objectives. For a close-up visualization of the different phenotypes and inputs, see Appendix A.
Figure 7.
Pareto Front phenotypes: Solutions ranked as the best according to the two fitness objectives. For a close-up visualization of the different phenotypes and inputs, see Appendix A.

Figure 8.
Comparison among the phenotypes during specific times.

Figure 9.
Example of the results obtained from a selected phenotype (Generation 49, Genoma 0): (a) UTCI (°C) in 21 June at 16 h, and (b) shaded area (m2), in 21 June at 16 h.
Figure 9.
Example of the results obtained from a selected phenotype (Generation 49, Genoma 0): (a) UTCI (°C) in 21 June at 16 h, and (b) shaded area (m2), in 21 June at 16 h.

Figure 10.
Comparative of the condition of a person throughout the year: (a) Shaded conditions vs. (b) unshaded conditions. Hourly data from the EPW file of Cancun, Mexico.
Figure 10.
Comparative of the condition of a person throughout the year: (a) Shaded conditions vs. (b) unshaded conditions. Hourly data from the EPW file of Cancun, Mexico.


Table 1.
UTCI assessment scale in terms of thermal stress.
| UTCI (°C) Range | Stress Category |
|---|---|
| >+46 | Extreme heat stress |
| +38 to +46 | Very strong heat stress |
| +32 to +38 | Strong heat stress |
| +26 to +32 | Moderate heat stress |
| +9 to +26 | No thermal stress |
| +9 to 0 | Slight cold stress |
| 0 to −13 | Moderate cold stress |
| −13 to −27 | Strong cold stress |
| −27 to −40 | Very strong cold stress |
| <−40 | Extreme cold stress |
Table 2.
Condition of person related to the stress categories of UTCI ranges.
| Integer Value | UTCI (°C) | Condition of Person | |
|---|---|---|---|
| +3 | >+32 | Strong heat stress | Potential public health hazard with higher-than-normal mortality rates |
| +2 | +28 to +32 | Moderate heat stress | Hot but no public health hazard |
| +1 | +26 to +28 | Slight heat stress | Warm but comfortable for short periods of time |
| 0 | +9 to +26 | No thermal stress | Comfortable conditions |
| −1 | +9 to 0 | Slight cold stress | Cool but comfortable for short periods of time |
| −2 | 0 to −13 | Moderate cold stress | Cold but no public health hazard |
| −3 | <−13 | Strong cold stress | Potential public health hazard with higher-than-normal mortality rates |
Table 3.
Solar angles of the different times considered for the shadings analysis in Cancun, Mexico (UTC + 6).
Table 3.
Solar angles of the different times considered for the shadings analysis in Cancun, Mexico (UTC + 6).
| Date | Hour | Altitude | Azimuth | Sun Position |
|---|---|---|---|---|
| 21 December | 8 | 19.31 | 125.90 | Minimum inclination throughout the year |
| 12 | 45.39 | 184.64 | ||
| 16 | 13.82 | 237.76 | ||
| 21 June | 8 | 37.22 | 75.93 | Maximum inclination throughout the year |
| 12 | 86.56 | 314.79 | ||
| 16 | 32.42 | 285.10 |
Table 4.
Data of phenotypes of 21 June.
| Population | Fitness Values | UTCI (Stress Category) | ||||||
|---|---|---|---|---|---|---|---|---|
| Day & Hour | Generation | Genoma | Shaded area (m2) | Average UTCI (°C)— Unshaded Area | Shaded Area | |||
| No Thermal Stress (m2) | Slight Heat Stress (m2) | Moderate Heat Stress (m2) UTCI (°C) | Strong Heat Stress (m2) UTCI (°C) | |||||
| 21 June 8 h | 49 | 0 | 18.02 | 37.0 | 0 | 0 | 10.7 | 7.4 |
| 49 | 1 | 17.94 | 37.0 | 0 | 0 | 10.8 | 7.4 | |
| 49 | 2 | 18.18 | 37.0 | 0 | 0 | 10.4 | 7.8 | |
| 49 | 3 | 18 | 37.0 | 0 | 0 | 10.7 | 7.3 | |
| 49 | 4 | 17.9 | 37.0 | 0 | 0 | 10.9 30.6 | 7.0 37.0 | |
| 49 | 5 | 17.94 | 37.0 | 0 | 0 | 10.8 | 7.1 | |
| 49 | 6 | 18.1 | 37.0 | 0 | 0 | 10.5 | 7.6 | |
| 47 | 2 | 18.18 | 37.0 | 0 | 0 | 10.4 | 7.8 | |
| 48 | 4 | 17.9 | 37.0 | 0 | 0 | 10.9 | 7.0 | |
| 21 June 12 h | 49 | 0 | 9.13 | 41.5 | 0 | 0 | 7.8 30.2 | 1.4 39.2 |
| 49 | 1 | 9.34 | 41.5 | 0 | 0 | 7.5 | 1.4 | |
| 49 | 2 | 9.26 | 41.5 | 0 | 0 | 7.8 | 1.3 | |
| 49 | 3 | 9.28 | 41.5 | 0 | 0 | 7.8 | 1.3 | |
| 49 | 4 | 9.22 | 41.5 | 0 | 0 | 7.8 | 1.3 | |
| 49 | 5 | 9.31 | 41.5 | 0 | 0 | 7.5 | 1.5 | |
| 49 | 6 | 9.3 | 41.5 | 0 | 0 | 7.6 | 1.5 | |
| 49 | 7 | 9.23 | 41.5 | 0 | 0 | 7.8 | 1.4 | |
| 49 | 8 | 9.28 | 41.5 | 0 | 0 | 7.8 | 1.3 | |
| 49 | 9 | 9.31 | 41.5 | 0 | 0 | 7.5 | 1.5 | |
| 47 | 1 | 9.34 | 41.5 | 0 | 0 | 7.5 | 1.4 | |
| 48 | 1 | 9.13 | 41.5 | 0 | 0 | 7.8 | 1.4 | |
| 21 June 16 h | 49 | 0 | 19.92 | 34.9 | 0 | 0 | 14.6 26.7 | 5.3 32.0 |
| 49 | 1 | 20.21 | 34.9 | 0 | 0 | 14.9 | 5.3 | |
| 49 | 2 | 20.05 | 34.9 | 0 | 0 | 14.7 | 5.4 | |
| 49 | 3 | 20.06 | 34.9 | 0 | 0 | 14.7 | 5.4 | |
| 49 | 4 | 20.18 | 34.9 | 0 | 0 | 14.8 | 5.4 | |
| 49 | 5 | 20.18 | 34.9 | 0 | 0 | 14.8 | 5.4 | |
| 49 | 6 | 20.21 | 34.9 | 0 | 0 | 14.9 | 5.3 | |
| 49 | 7 | 20.21 | 34.9 | 0 | 0 | 14.9 | 5.3 | |
| 49 | 8 | 20.02 | 34.9 | 0 | 0 | 14.7 | 5.4 | |
| 48 | 0 | 19.92 | 34.9 | 0 | 0 | 14.6 | 5.3 | |
| 48 | 1 | 20.21 | 34.9 | 0 | 0 | 14.9 | 5.3 | |
Notes: Some phenotypes are highlighted with a gray shading to exemplify the UTCI improvements: unshaded area vs. shaded area. Their UTCI degrees are marked in bold and italic numbers inside the shaded areas.
Table 5.
Data of phenotypes of 21 December.
| Population | Fitness Values | UTCI (Stress Category) | ||||||
|---|---|---|---|---|---|---|---|---|
| Day & Hour | Generation | Genoma | Shaded Area (m2) | Average UTCI (°C)— Unshaded Area | Shaded Area | |||
| No Thermal Stress (m2) UTCI (°C) | Slight Heat Stress (m2) UTCI (°C) | Moderate Heat Stress (m2) UTCI (°C) | Strong Heat Stress (m2) | |||||
| 21 December 8 h | 49 | 0 | 25.37 | 28.1 | 15.3 | 10.1 | 0 | 0 |
| 49 | 1 | 25.37 | 28.1 | 15.3 24.7 | 10.1 27.1 | 0 | 0 | |
| 49 | 2 | 25.31 | 28.1 | 15.4 | 9.9 | 0 | 0 | |
| 49 | 3 | 24.56 | 28.1 | 16.2 | 8.4 | 0 | 0 | |
| 49 | 4 | 25.19 | 28.1 | 15.6 | 9.6 | 0 | 0 | |
| 49 | 5 | 24.76 | 28.1 | 15.9 | 8.9 | 0 | 0 | |
| 49 | 6 | 25.32 | 28.1 | 15.5 | 9.8 | 0 | 0 | |
| 49 | 7 | 25.31 | 28.1 | 15.4 | 9.9 | 0 | 0 | |
| 49 | 8 | 25.37 | 28.1 | 15.3 | 10.1 | 0 | 0 | |
| 46 | 6 | 25.37 | 28.1 | 15.31 | 10.1 | 0 | 0 | |
| 47 | 8 | 24.56 | 28.1 | 16.2 | 8.4 | 0 | 0 | |
| 21 December 12 h | 49 | 0 | 15.63 | 33.6 | 0 | 10.4 26.7 | 5.2 30.0 | 0 |
| 49 | 1 | 15.69 | 33.6 | 0 | 10.2 | 5.5 | 0 | |
| 49 | 2 | 15.64 | 33.6 | 0 | 10.4 | 5.2 | 0 | |
| 47 | 4 | 15.63 | 33.6 | 0 | 10.4 | 5.2 | 0 | |
| 48 | 1 | 15.69 | 33.6 | 0 | 10.2 | 5.5 | 0 | |
| 21 December 16 h | 49 | 0 | 27.87 | 27.0 | 22.4 | 5.4 | 0 | 0 |
| 49 | 1 | 27.82 | 27.0 | 22.5 | 5.4 | 0 | 0 | |
| 49 | 2 | 27.79 | 27.0 | 22.4 24.8 | 5.4 26.0 | 0 | 0 | |
| 49 | 3 | 27.79 | 27.0 | 22.5 | 5.3 | 0 | 0 | |
| 49 | 4 | 27.84 | 27.0 | 22.5 | 5.4 | 0 | 0 | |
| 49 | 5 | 27.8 | 27.0 | 22.5 | 5.3 | 0 | 0 | |
| 49 | 6 | 27.76 | 27.0 | 22.4 | 5.4 | 0 | 0 | |
| 49 | 7 | 27.87 | 27.0 | 22.4 | 5.4 | 0 | 0 | |
| 49 | 8 | 27.8 | 27.0 | 22.4 | 5.4 | 0 | 0 | |
| 45 | 0 | 27.73 | 27.0 | 22.4 | 5.4 | 0 | 0 | |
| 48 | 0 | 27.87 | 27.0 | 22.4 | 5.4 | 0 | 0 | |
| 49 | 0 | 25.37 | 28.1 | 22.5 | 5.3 | 0 | 0 | |
| 49 | 1 | 25.37 | 28.1 | 22.5 | 5.4 | 0 | 0 | |
| 49 | 2 | 25.31 | 28.1 | 22.5 | 5.3 | 0 | 0 | |
| 49 | 3 | 24.56 | 28.1 | 22.4 | 5.4 | 0 | 0 | |
| 49 | 4 | 25.19 | 28.1 | 22.4 | 5.4 | 0 | 0 | |
Notes: Some phenotypes are highlighted with a gray shading to exemplify the UTCI improvements: unshaded area vs. shaded area. Their UTCI degrees are marked in bold and italic numbers inside the shaded areas.
Table 6.
Selected phenotypes.
| Population | Fitness Values | ||||
|---|---|---|---|---|---|
| Day/Hour | Generation | Genoma | Shadows (m2) | Average UTCI (°C)—Shaded Area | Average UTCI (°C)—Unshaded Area |
| 21 June 8 h | 49 | 4 | 17.9 | 33.1 | 37.0 |
| 21 June 12 h | 49 | 0 | 9.13 | 34.1 | 41. 5 |
| 21 June 16 h | 49 | 0 | 19.92 | 31.8 | 34.9 |
| 21 December 8 h | 49 | 1 | 25.37 | 26.7 | 28.1 |
| 21 December 12 h | 49 | 0 | 15.63 | 30.1 | 33.6 |
| 21 December 16 h | 49 | 2 | 27.79 | 25.0 | 27.0 |
Publisher’s Note: MDPI stays neutral with regard to jurisdictional claims in published maps and institutional affiliations. |
© 2021 by the authors. Licensee MDPI, Basel, Switzerland. This article is an open access article distributed under the terms and conditions of the Creative Commons Attribution (CC BY) license (https://creativecommons.org/licenses/by/4.0/).
Share and Cite
MDPI and ACS Style
Chi, D.A.; González M., E.; Valdivia, R.; Gutiérrez J., E. Parametric Design and Comfort Optimization of Dynamic Shading Structures. Sustainability 2021, 13, 7670. https://0-doi-org.brum.beds.ac.uk/10.3390/su13147670
AMA Style
Chi DA, González M. E, Valdivia R, Gutiérrez J. E. Parametric Design and Comfort Optimization of Dynamic Shading Structures. Sustainability. 2021; 13(14):7670. https://0-doi-org.brum.beds.ac.uk/10.3390/su13147670
Chicago/Turabian StyleChi, Doris A., Edwin González M., Renato Valdivia, and Eduardo Gutiérrez J. 2021. "Parametric Design and Comfort Optimization of Dynamic Shading Structures" Sustainability 13, no. 14: 7670. https://0-doi-org.brum.beds.ac.uk/10.3390/su13147670
Note that from the first issue of 2016, this journal uses article numbers instead of page numbers. See further details here.