Article

Comparison Study of Metal Oxides (CeO2, CuO, SnO2, CdO, ZnO and TiO2) Decked Few Layered Graphene Nanocomposites for Dye-Sensitized Solar Cells

by
Satish Bykkam
1,
D. N. Prasad
1,
Muni Raj Maurya
1,2,
Kishor Kumar Sadasivuni
1,* and
John-John Cabibihan
2
1
Center for Advanced Materials, Qatar University, Doha P.O. Box. 2713, Qatar
2
Department of Mechanical and Industrial Engineering, Qatar University, College of Engineering, Doha P.O. Box. 2713, Qatar
*
Author to whom correspondence should be addressed.
Sustainability 2021, 13(14), 7685; https://0-doi-org.brum.beds.ac.uk/10.3390/su13147685
Submission received: 2 June 2021 / Revised: 23 June 2021 / Accepted: 6 July 2021 / Published: 9 July 2021
(This article belongs to the Topic Nanomaterials for Sustainable Energy Applications)

Abstract

:
Recent research is focused on few layered graphene (FLG) with various metal oxides (MOs) as (MOs; CeO2, CuO, SnO2, CdO, ZnO, and TiO2) nanocomposite materials are alternatives to critically important in the fabrication of solar cell devices. In this work, FLG with different MOs nanocomposites were prepared by a novel eco-friendly viable ultrasonic assisted route (UAR). The prepared FLG/MO nanocomposites were performed with various characterization techniques. The crystal and phase compositional were carried out through using X-ray diffraction technique. Surface morphological studies by field emission scanning electron microscope (FE-SEM) and high-resolution transmission electron microscopy (HR-TEM). Spectroscopic methods were done by Raman and UV-Vis Diffuse reflectance spectra (UV-DRS). The prepared FLG/MO nanocomposites materials were used as a photoanode, in the fabrication of dye sensitized solar cells (DSSCs). Compared to TiO2 nanoparticles (NPs) and other FLG/MO nanocomposites, FLG/TiO2 nanocomposites exhibited superior photovoltaic properties. The obtained results indicate that FLG/TiO2 nanocomposites significantly improved the power conversion efficiency (PCE) of DSSCs. The photovoltaic analyses were performed in a solar simulator with an air mass (AM) of 1.5 G, power density of 100 m W/m2, and current density-voltage (J-V) was investigated using N719 dye.

1. Introduction

Solar cells are most likely to be the primary source of energy in the future. For the development of solar cells, various methodologies have been used. Solar cells are divided into three generations: first-generation (1 G), second-generation (2 G), and third-generation (3 G) solar cells. The 1 G solar cells, which contain silicon, are also known as conventional or wafer-based cells (polysilicon and monocrystalline) [1]. Solar cells made of crystalline silicon have achieved a PCE of up to 26.6%. They are, nevertheless, distinguished by difficult preparation conditions and a high cost [2,3]. Thin-film solar cells with direct bandgap semiconductors, such as gallium arsenide (GaAs), cadmium telluride (CdTe), copper indium gallium selenide (CIGS), and copper zinc tin sulphide (CZTS), are used as 2 G solar cells [2]. Compared to silicon solar cells, the production cost of thin-film solar cell is low, but the fabrication technique still involves high-temperature and vacuum vapor deposition processes. Furthermore, poisonous and uncommon metals are a key constraint, restricting their widespread application [4,5]. Third-generation, or 3 G, solution-processed solar cells, such as organic solar cells, quantum dot sensitized solar cells, and dye sensitized solar cells have been developed to address these issues [6]. Later, in some preliminary research, Gratzel and O’Regan [7,8,9,10,11] proposed a low-cost method of producing DSSCs as an alternative to silicon-based solar cells.
The DSSCs are made up of a dye-sensitized mesoporous TiO2 film, interpenetrated by a liquid electrolyte contacting a redox iodine/iodide couple [12,13,14]. Even though the PCE of DSSCs is lower than 1 G and 2 G, the extensive ongoing research in this field has shown potential for improvement in their efficiency. Over the last decade, researchers have been working hard to develop a photoanode (working electrode) with a variety of morphologies in order to improve the efficiency of DSSCs. TiO2 is the most often employed photoanode material in DSSCs due to its porosity and strong catalytic nature for dye loading. Sustainable DSSCs were constructed utilizing flat TiO2 electrodes that produced light currents slowly through dye via adsorption, resulting in lower efficiency of 1% [15].
In this perspective, we introduce FLG/MOs nanocomposites (FLG/CeO2, FLG/CuO, FLG/SnO2, FLG/CdO, FLG/ZnO, and FLG/TiO2) were used as photoanode material in DSSCs as shown in Figure 1. As graphene/MOs (MOs: CeO2, CuO, SnO2, CdO, ZnO, and TiO2) nanocomposites were used as photoanode materials in DSSCs, it appeared to be a possible way to improve charge transfer, reduce charge recombination, and to improve solar cell efficiency. To date, metal oxide semiconductors, such as ZnO, SnO2, TiO2, NiO Fe2O3, and Cu2O, have been added to graphene due to their increased optical absorption, low cost of raw materials, and non-toxicity. Chemical interactions and bonding between graphene sheets and NPs are optimized owing to controlled nucleation and growth. Using nano-sized materials in solar cells and growing NPs on graphene sheets is key to producing nanocomposites. For price reduction and improved DSSCs performance, the researchers focus on exploiting graphene/metal oxide and alternate materials rather than employing ancient graphene.
Present research work FLG/MO nanocomposites prepared by simple technique UAR, followed by calcination with varying temperatures for different MOs (CeO2, CuO, SnO2, CdO, ZnO, and TiO2). The doctor blade (DB) approach was used to coat the FLG/MO nanocomposites (photoanodes) on a fluorine-doped tin oxide (FTO) conductive substrate. The impact of FLG in metal oxides on DSSCs characteristics, including Voc (open circuit voltage), Jsc (current density), FF (fill factor), and PCE (power conversation efficiency) were studied.

2. Materials and Methods

2.1. Materials

Graphene oxide (GO, Sigma Aldrich), ethanol (C2H5OH, >99.5% Sigma Aldrich), hydrazine monohydrate (N2H4, 98% Sigma Aldrich), metal acetates (X (CH3COO)2, (X = Ce, Cu, Sn, Cd, and Zn, >99.9% Sigma Aldrich), titanium tetraisoproapoxide (TTIP, 99.9% Sigma Aldrich), distilled water, FTO-coated glass substrates (Pakington TEC15 ~10 Ω/cm2), de-ionized water, acetone (>99.5%, Sigma Aldrich), titanium dis isopropoxide bis (acetylacetonate) (99.9% Sigma Aldrich), titanium tetrachloride (TiCl4, 99.7% Sigma Aldrich), N719 (ditetrabutylammoniumcis bis(isothiocyanate) bis (2,2′bipyridyl 4,4′ dicarboxylato) ruthenium (II)) dye (Sapala Organic PVT Ltd., Hyderabad, India), bis (isothiocyanate) bis (2,2′bipyidyl 4,4′ dicarboxylato) liquid electrolyte (dimetylpropylimidazolium iodide, iodine, tert-butyl pyridine, lithium iodide in 3-metthoxyacetonitrile, all 99.9% Sigma Aldrich), platinum (Pt) sputtered FTO, and silver paste (>75% Sigma Aldrich).

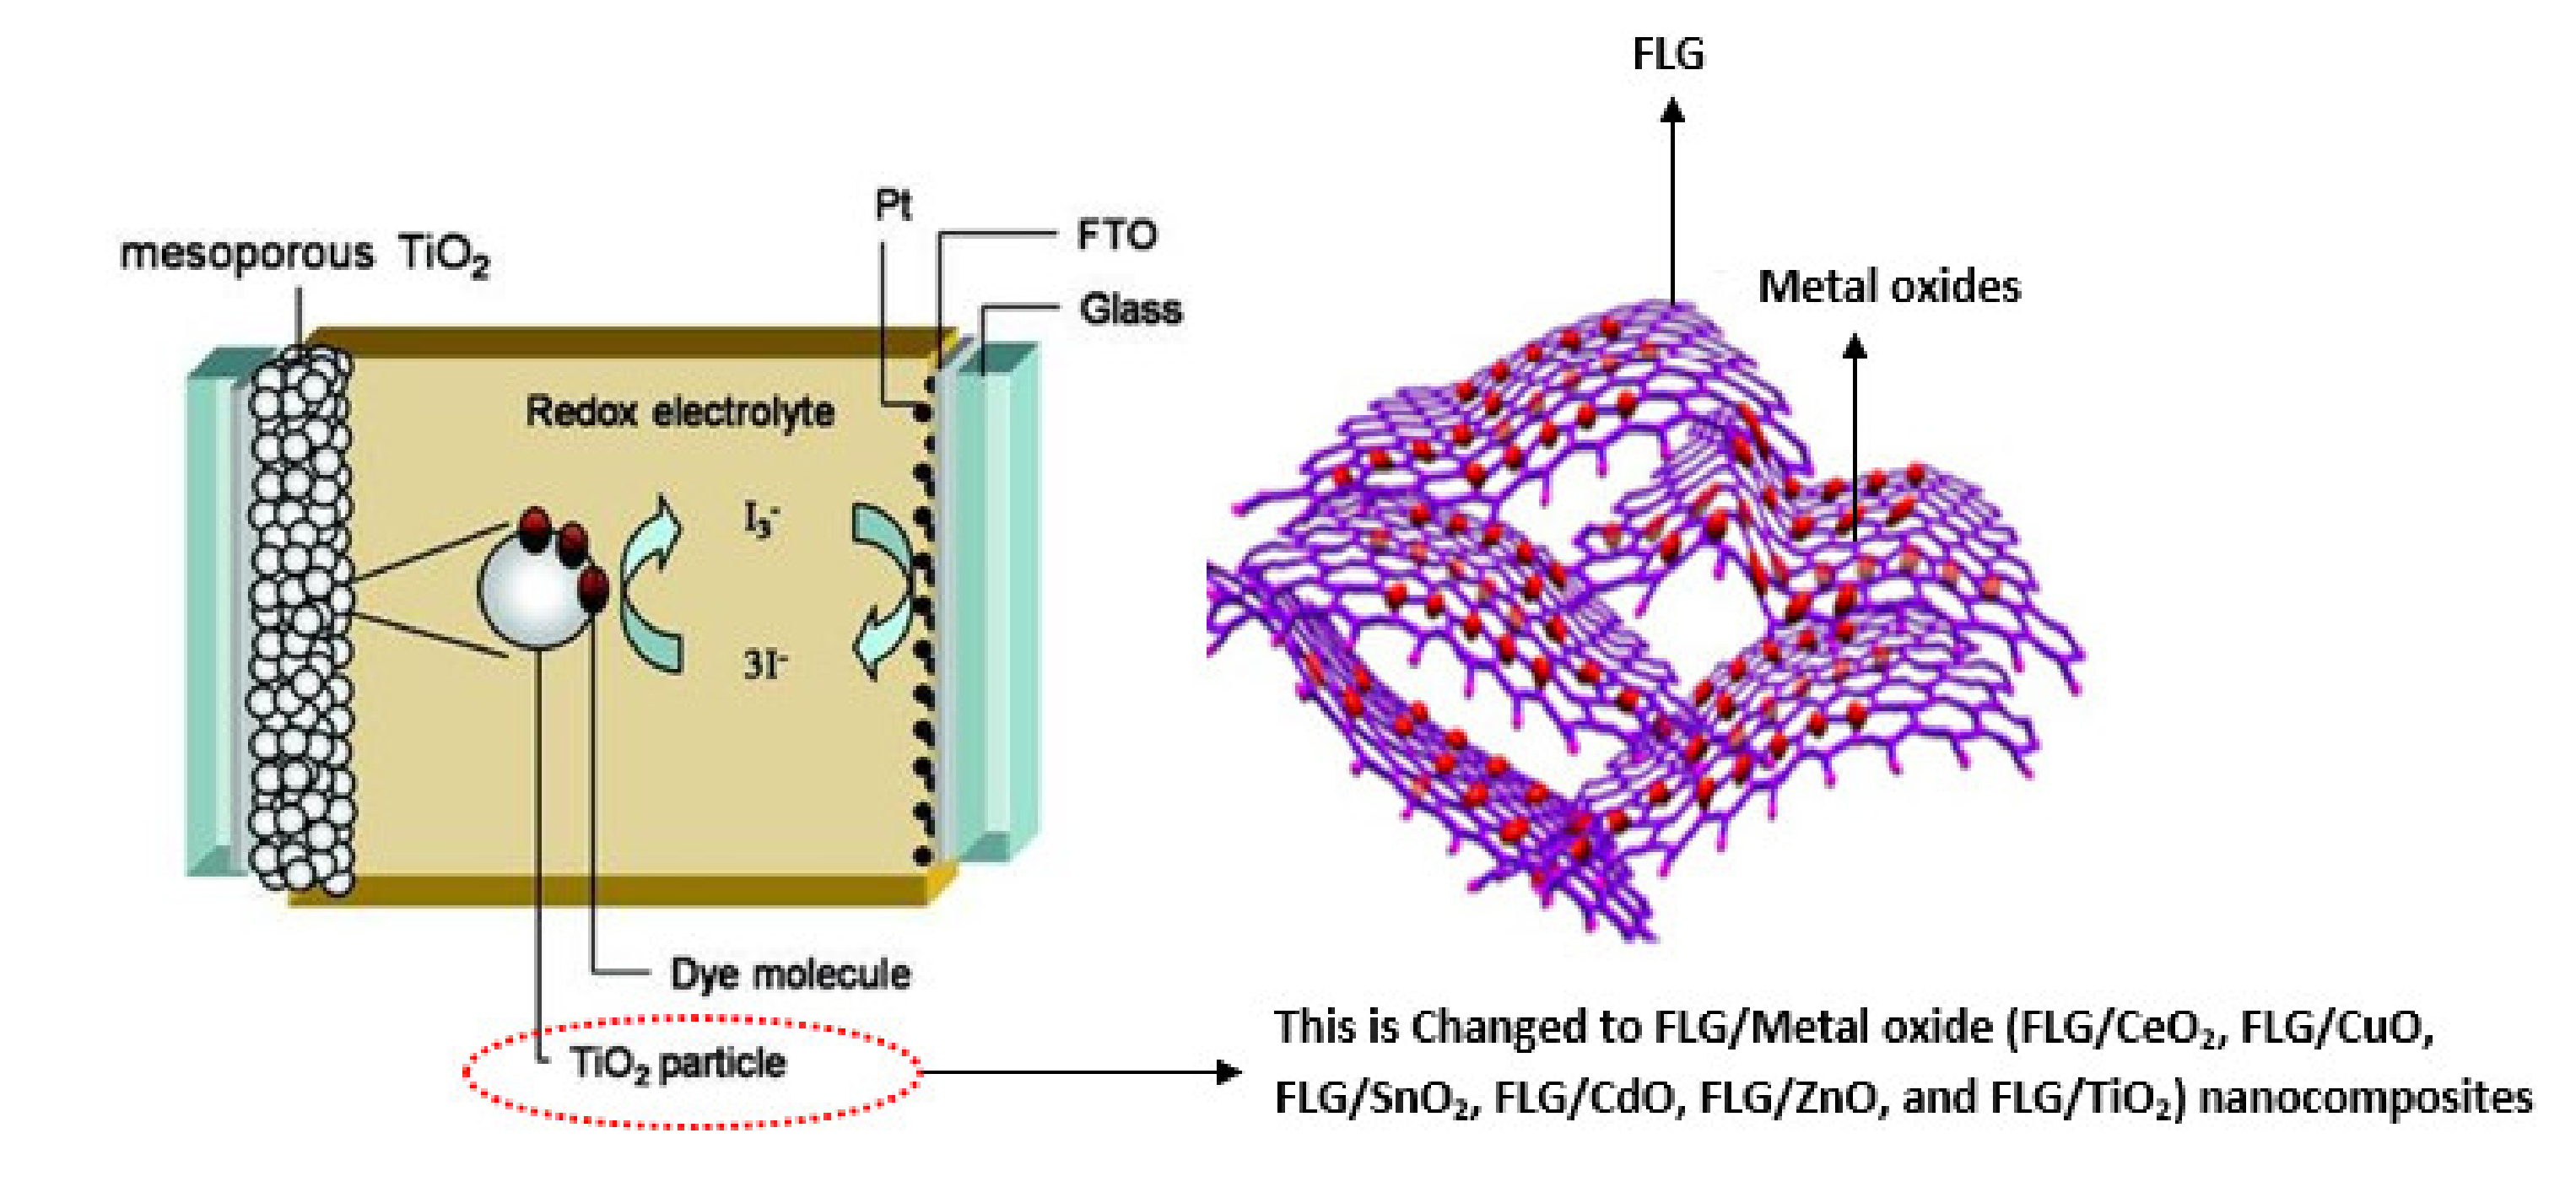
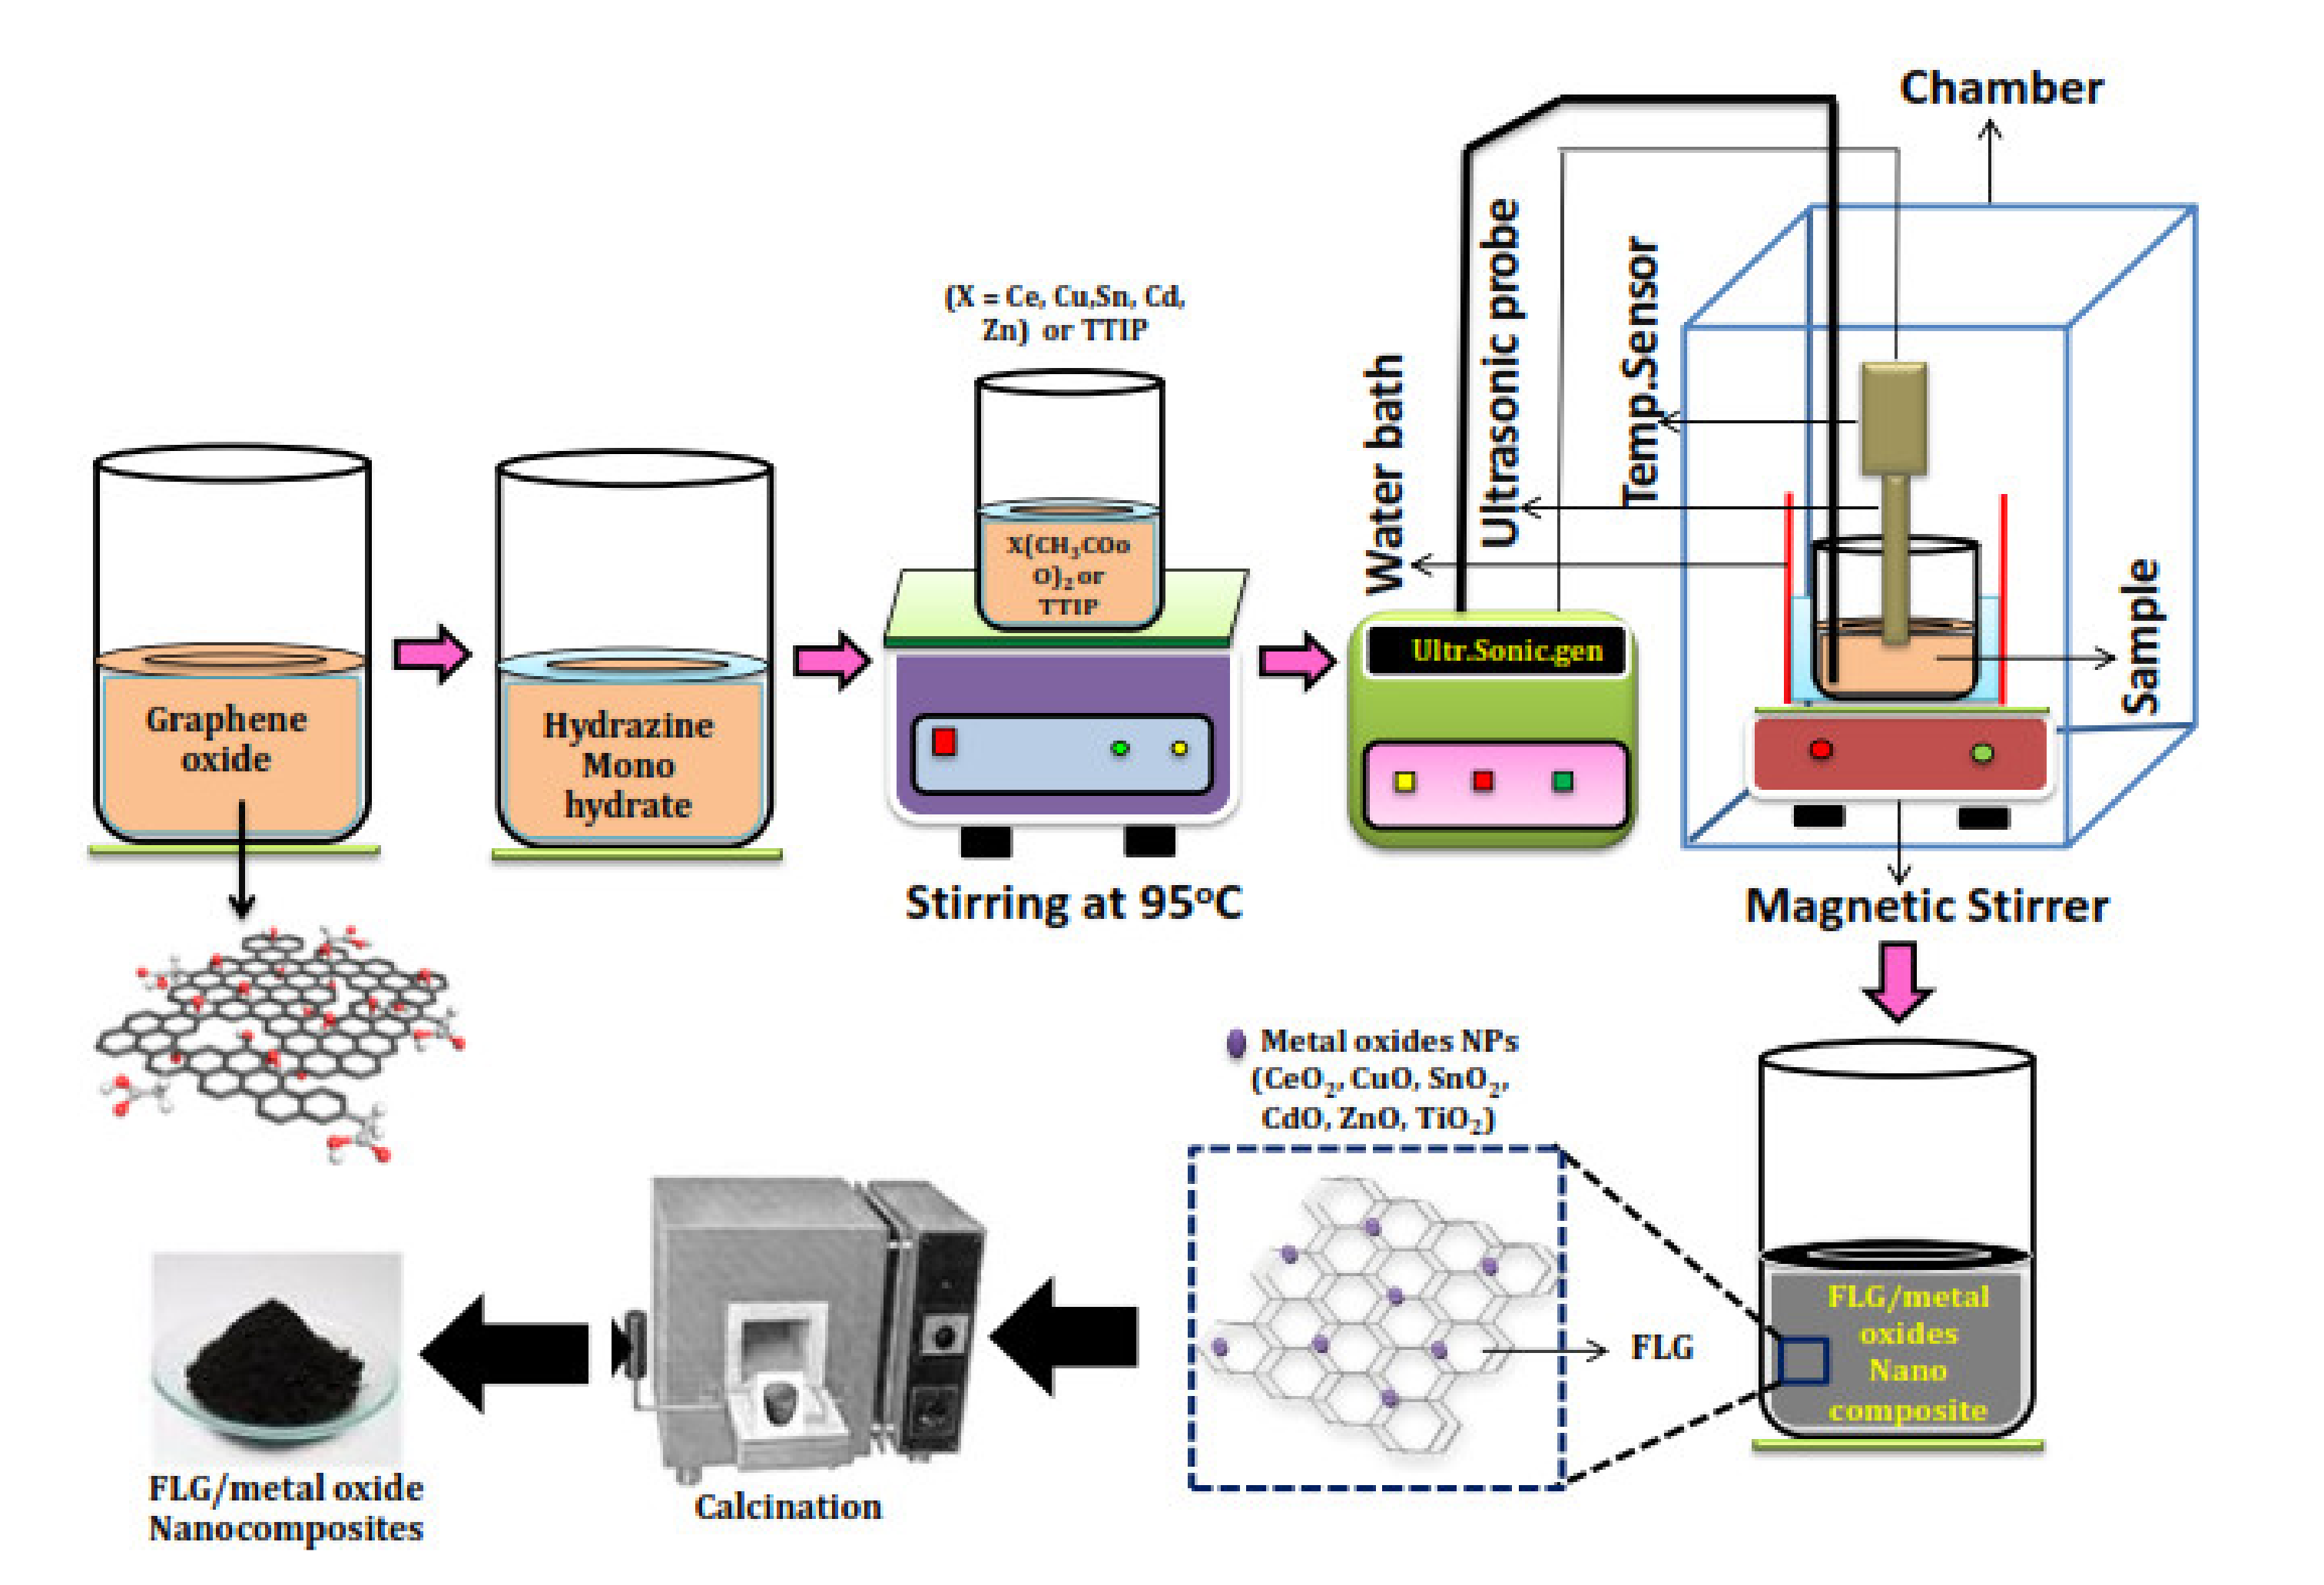
2.2. Synthesis of FLG/Metal Oxide Nanocomposites

The modified hummer’s approach was used to produce GO, which was then dispersed in ethanol using an ultrasonic procedure [16]. Figure 2 shows the FLG/MO (MOs; CeO2, CuO, SnO2, CdO, ZnO, and TiO2) nanocomposites made with an Ultrasonicator (Model No: Q500, 20 KHz Frequency, 500 W). Herein this method, by sonication for 30 min, 0.5 g of GO was disseminated in 200 mL ethanol to obtain a dark brown color. An appropriate amount of metal acetates (Ce, Cu, Sn, Cd, Zn) and TTIP were added to the above GO solution. Final step was to add 2 mL of N2H4 solution to the dispersion. The resultant solution was transfer to a 500 mL level and sonicated for 2 h in an ultrasonic chamber. To avoid moisture, it was filtered and cleaned multiple times with distilled water before being dried in a hot air oven at 90 °C for 5 h. Consequently, the FLG/MOs nanocomposites were calcined in a muffle furnace. Those temperatures were FLG/CeO2 at 600 °C for 4 h [17], FLG/CuO at 600 °C for 4 h [18], FLG/SnO2 at 600 °C for 4 h [19], FLG/CdO at 400 °C for 4 h [20], FLG/ZnO at 400 °C for 12 h [21], and FLG/TiO2 at 400 °C for 2 h [22]. For comparison, pure metal oxide (MOs; CeO2, CuO, SnO2, CdO, ZnO, and TiO2) NPs were also produced by the same technique without GO and followed by different calcination temperatures. During the procedure, GO has transformed into FLG, simultaneously, nano-sized metal oxides (CeO2, CuO, SnO2, CdO, ZnO, and TiO2) decked FLG.

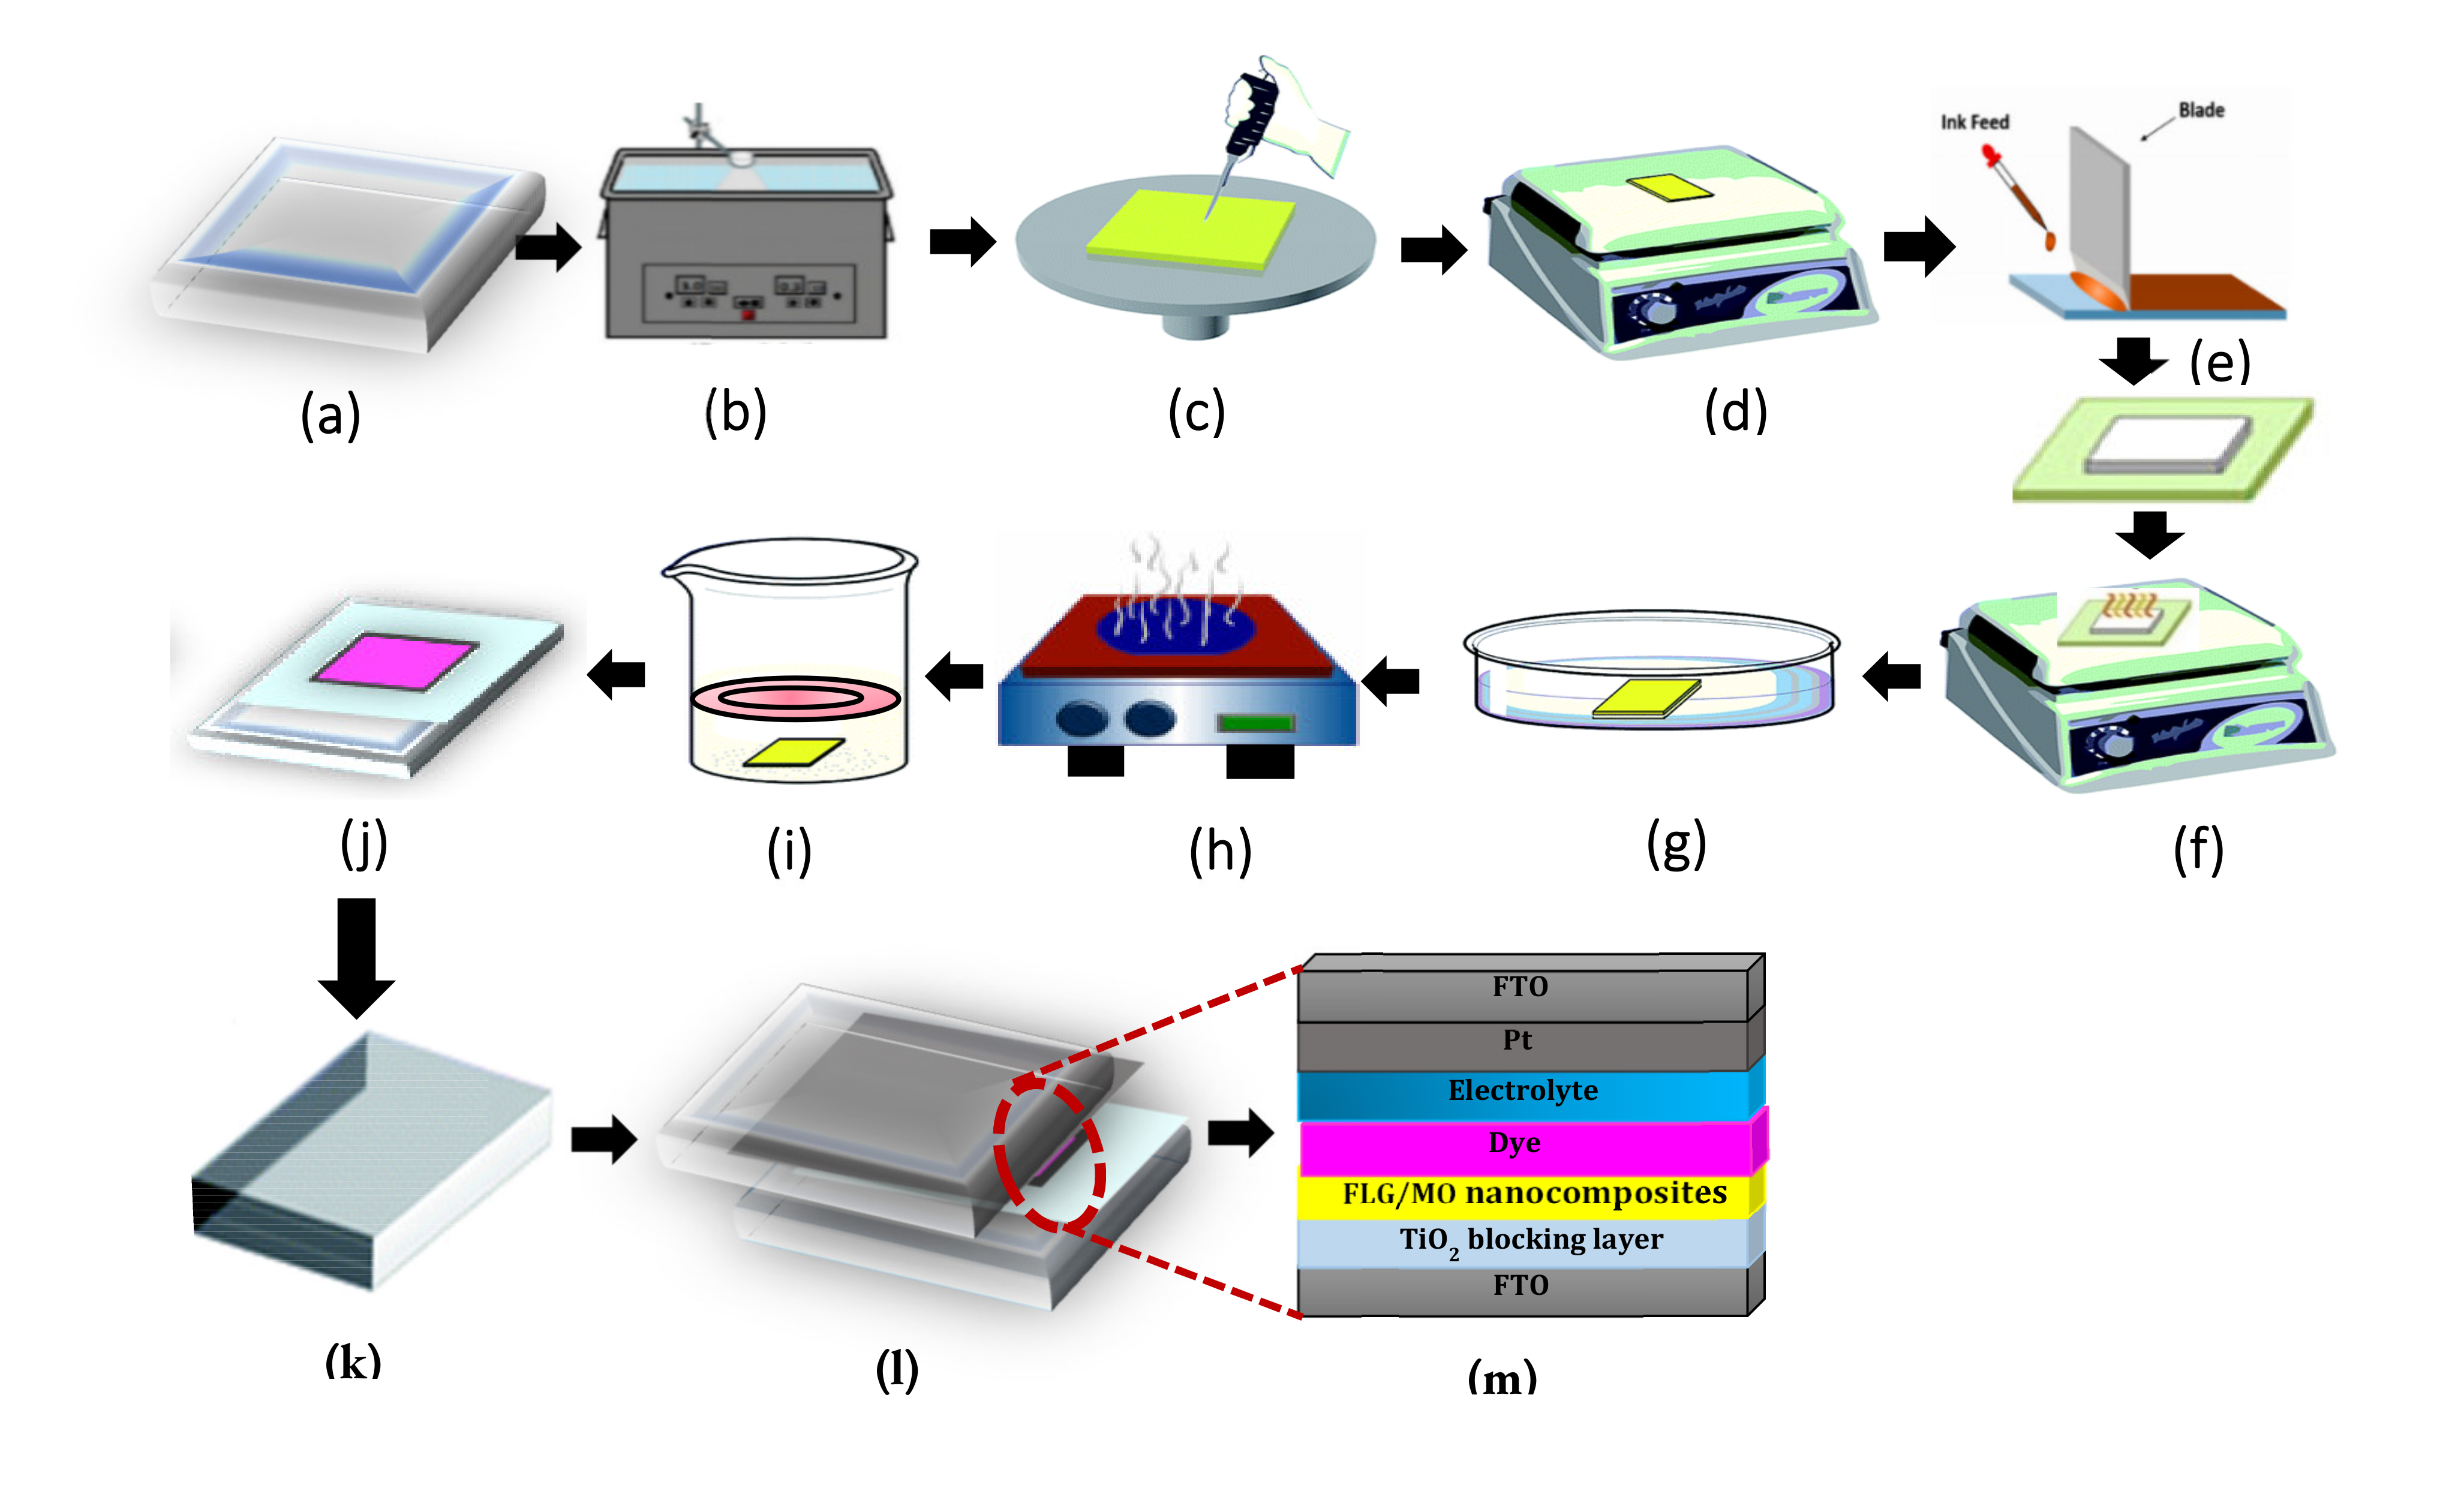
2.3. DSSC Device Fabrication

2.3.1. Preparation FLG/Metal Oxides Nanocomposite Paste

FLG/MOs (FLG/CeO2, FLG/CuO, FLG/SnO2, FLG/CdO, FLG/ZnO and FLG/TiO2) nanocomposites paste used as a photoanode prepared by the following method. In the primary part, 2.0 g of FLG/metal oxides (FLG/CeO2, FLG/CuO, FLG/SnO2, FLG/CdO, FLG/ZnO, and FLG/TiO2) powder was circulated in 20 mL of ethanol and exposed to ultrasonication bath for 30 min. After that, for stable colloidal spreading, the solution was pulverized in a porcelain motor and pestle. Ethanol prevents the coagulation of FLG/MOs (FLG/CeO2, FLG/CuO, FLG/SnO2, FLG/CdO, FLG/ZnO, and FLG/TiO2). Further, 1ml polyethylene glycol (PEG) (MW:10,000) was added for keeping the same viscosity and concentration. Finally, a limited drop of a detergent (Triton X-100) was added to reduce to the paste’s surface tension, make it easier to spread evenly, and prevent the creation of surface cracks. In the second part, MOs NPs (MOs; CeO2, CuO, SnO2, CdO, ZnO, and TiO2) were dissolved in ethanol and ultrasonically dispersed for 30 min to obtain a stable colloidal dispersion, using the similar overhead procedure.

2.3.2. Device Fabrication

FTO-coated conductive glass substrates have been used to fabricate DSSCs, used as a photoanode, shown in Figure 3. FTO were cleaned for 15 min through de-ionized water, acetone, and ethanol before ultrasonication. Then, a blocking layer of titanium dis isopropoxide bis (acetylacetonate) was spin coated at 2000 rpm for 30 s on the cleaned FTO, then annealed at 450 °C for 30 min. The produced FLG/MO nanocomposites pastes were coated on the FTO substrate using the DB technique. After that, the coated films were annealed for 30 min at 450 °C. The films were again annealed at 450 °C for additional 30 min after being soaked in a 30 mM TiCl4 aqueous solution for 30 min at 70 °C. For evaluation, a reference functioning photoanode was created using pure metal oxide paste, without FLG inclusion, using a similar process. The films were then annealed at 450 °C for 30 min, cooled to 35 °C, and then immersed in N719 (Ditetrabutylammoniumcis bis (2,2’bipyridyl 4,4’ dicarboxylato) ruthenium (II) dye solution with a concentration of 0.5 × 10⁻³ M in ethanol for dye absorption for 24 h. After dye absorption, all of the samples were again cleaned with ethanol and distilled water before being employed as a photoanode for DSSCs. The counter electrodes are formed as a sandwich type cell, using two clamps and are constructed of platinum (Pt) sputtered FTO. The organic solvent-based liquid electrolyte was made with a solution of 0.6 M dimetylpropylimidazolium iodide, 0.1 M iodine, 0.5 M tert-butylpyridine, and 0.1 M lithium iodide in 3-metthoxyacetonitrile. The area between the two electrodes (counter and photoanode) was filled with a few drops of the electrolyte using a syringe. The constructed cell’s active area was 0.25 cm2 and electrode contact was created with silver paste.

2.4. Characterizations

X-ray diffraction (XRD, Model No: Bruker D8 Advance), filed emission scanning electron microscopy (FE-SEM, Model No: Carlzeiss ultra-55) and high resolution-transmission electron microscopy (HR-TEM, Model No: JEOL JEM 200 CX) were used to characterize the prepared MOs and FLG/MO nanocomposites, as well as crystal structure and surface morphological analyses. Raman (Model No: A WITec Alpha 330R) was used for spectroscopic approaches and UV-Vis Diffuse reflectance spectra (UV-DRS, Model No: JASCO V-670) will be used to investigate light absorption. The thickness and roughness of the produced MOs and FLG/MO nanocomposite photoanodes thin films were evaluated using an optical profilometer (Model No: PS 50). The (J-V) parameter of the DSSCs were measured using a solar simulator (Model No: Oriel Class 3A) with Kethley 2440 source meter.

3. Results & and Discussion

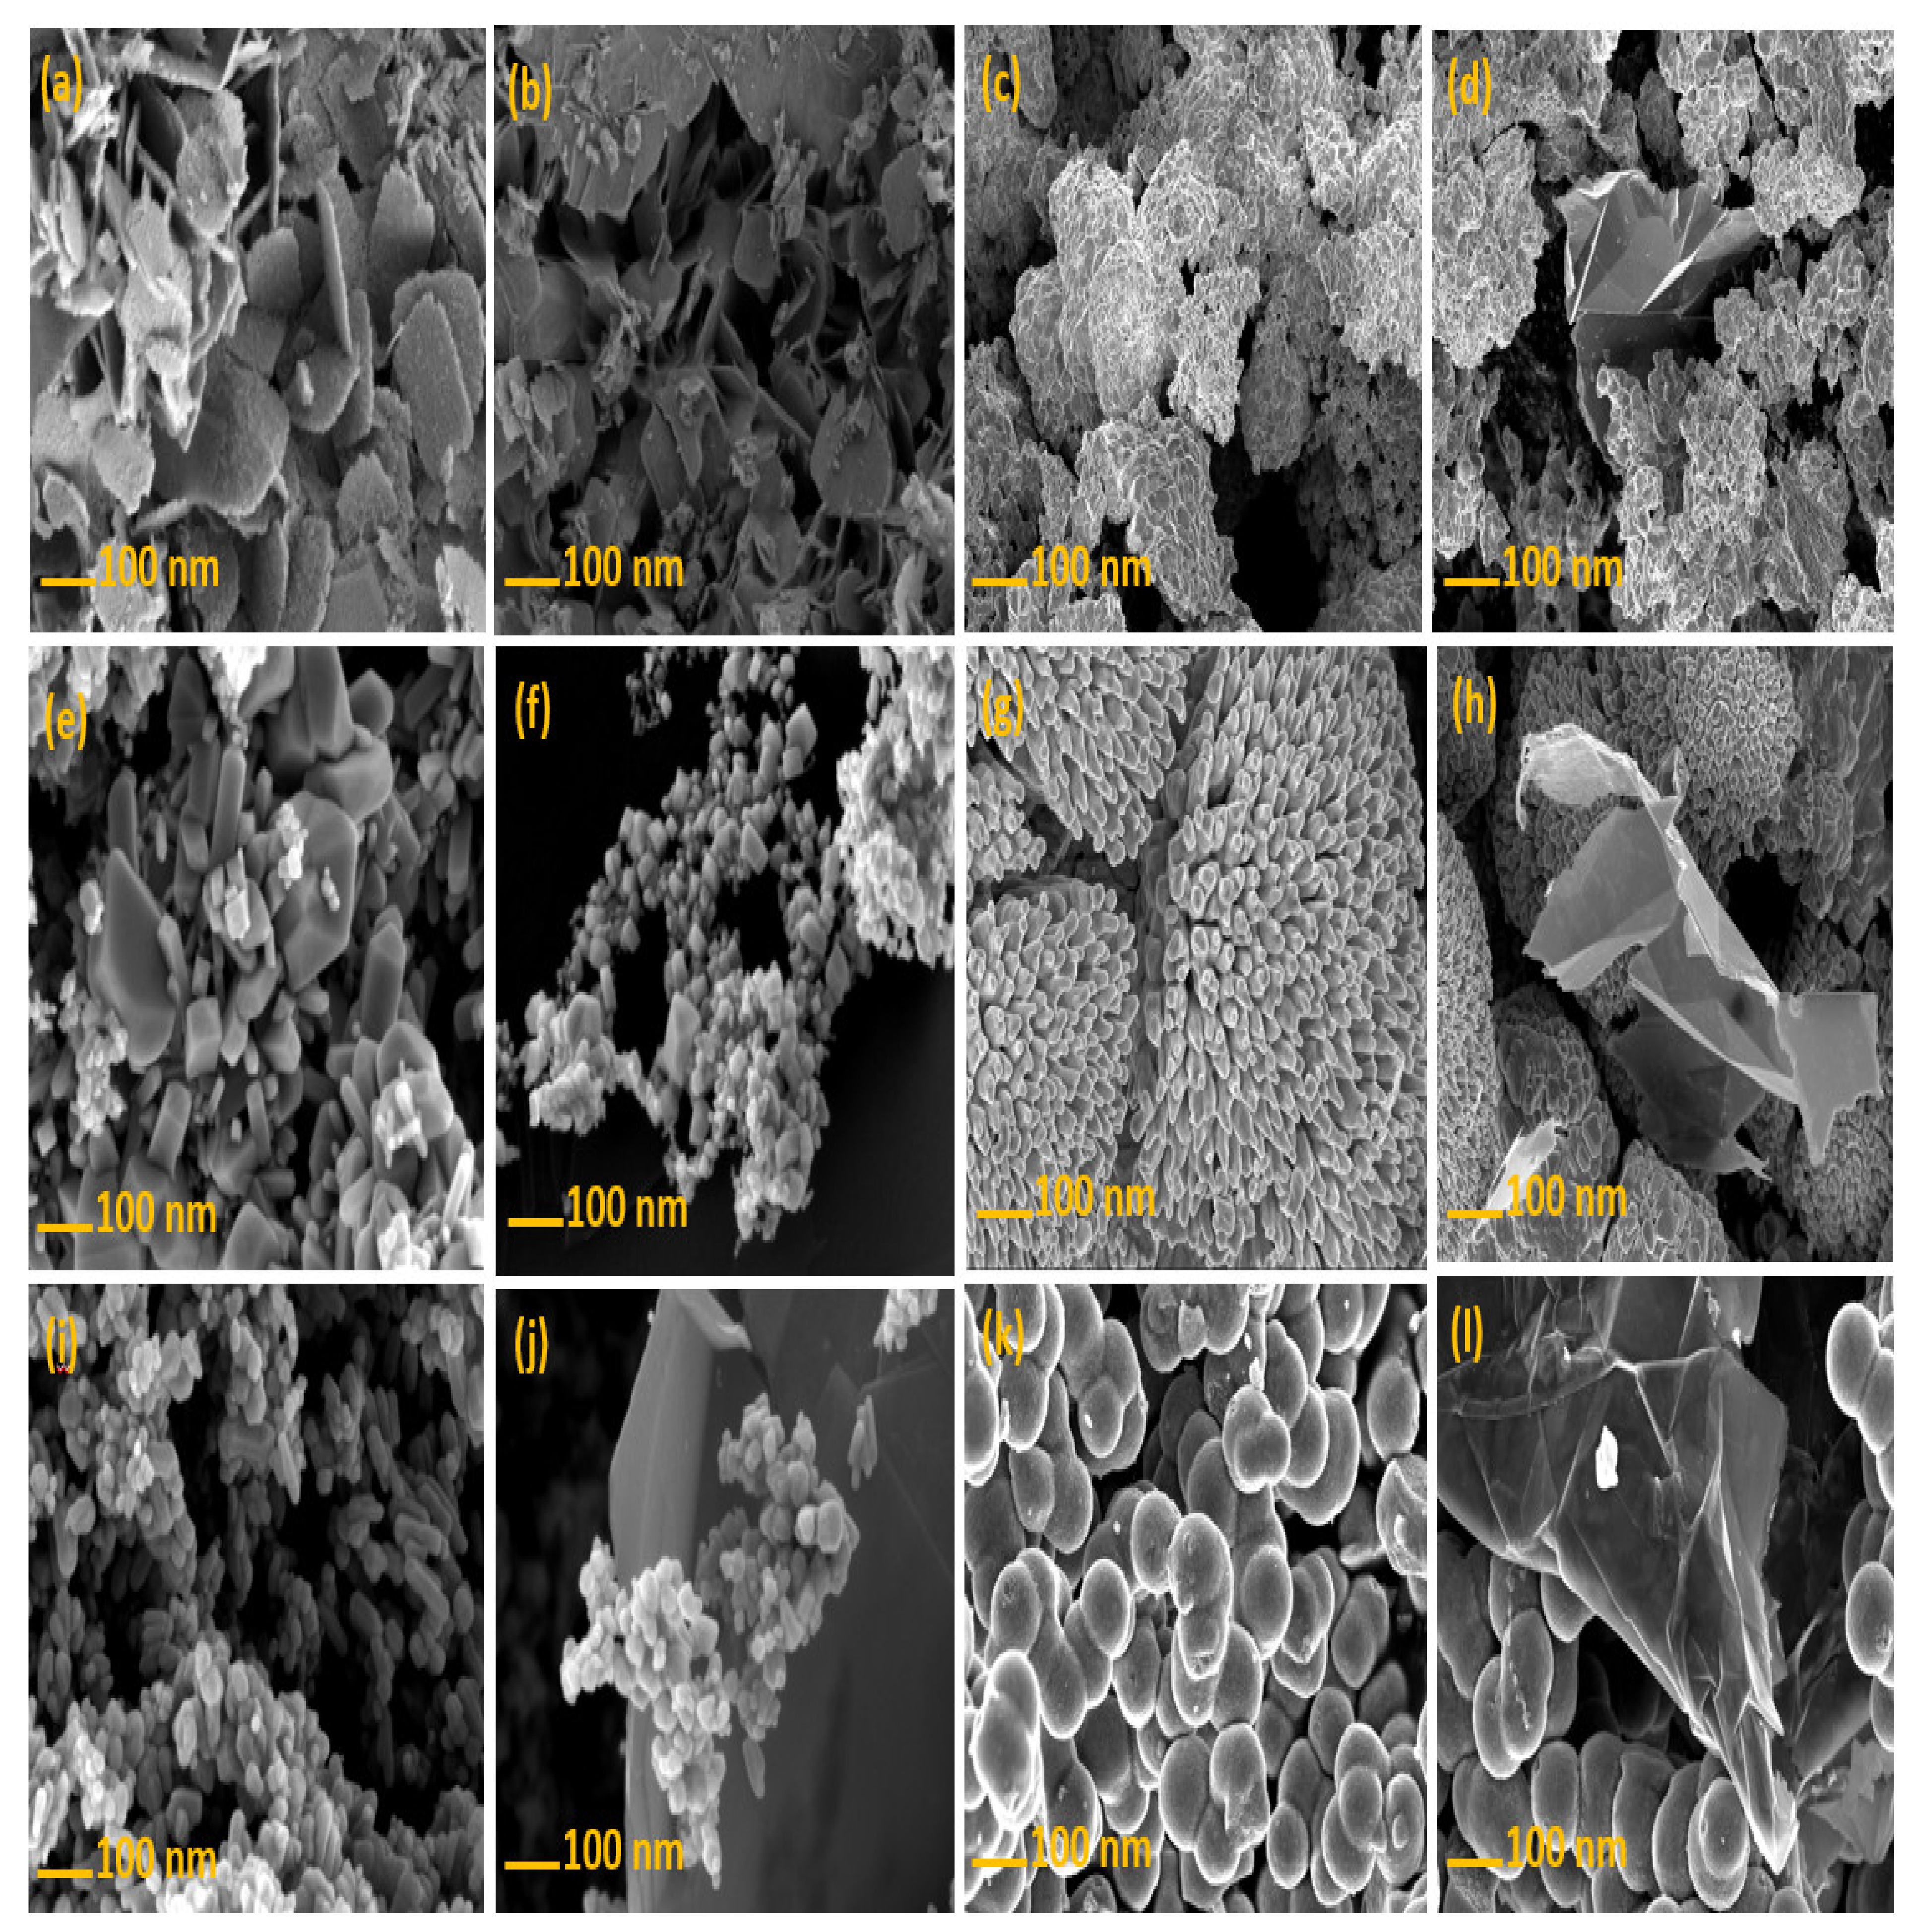
3.1. Structural & Surface Morphological Studies

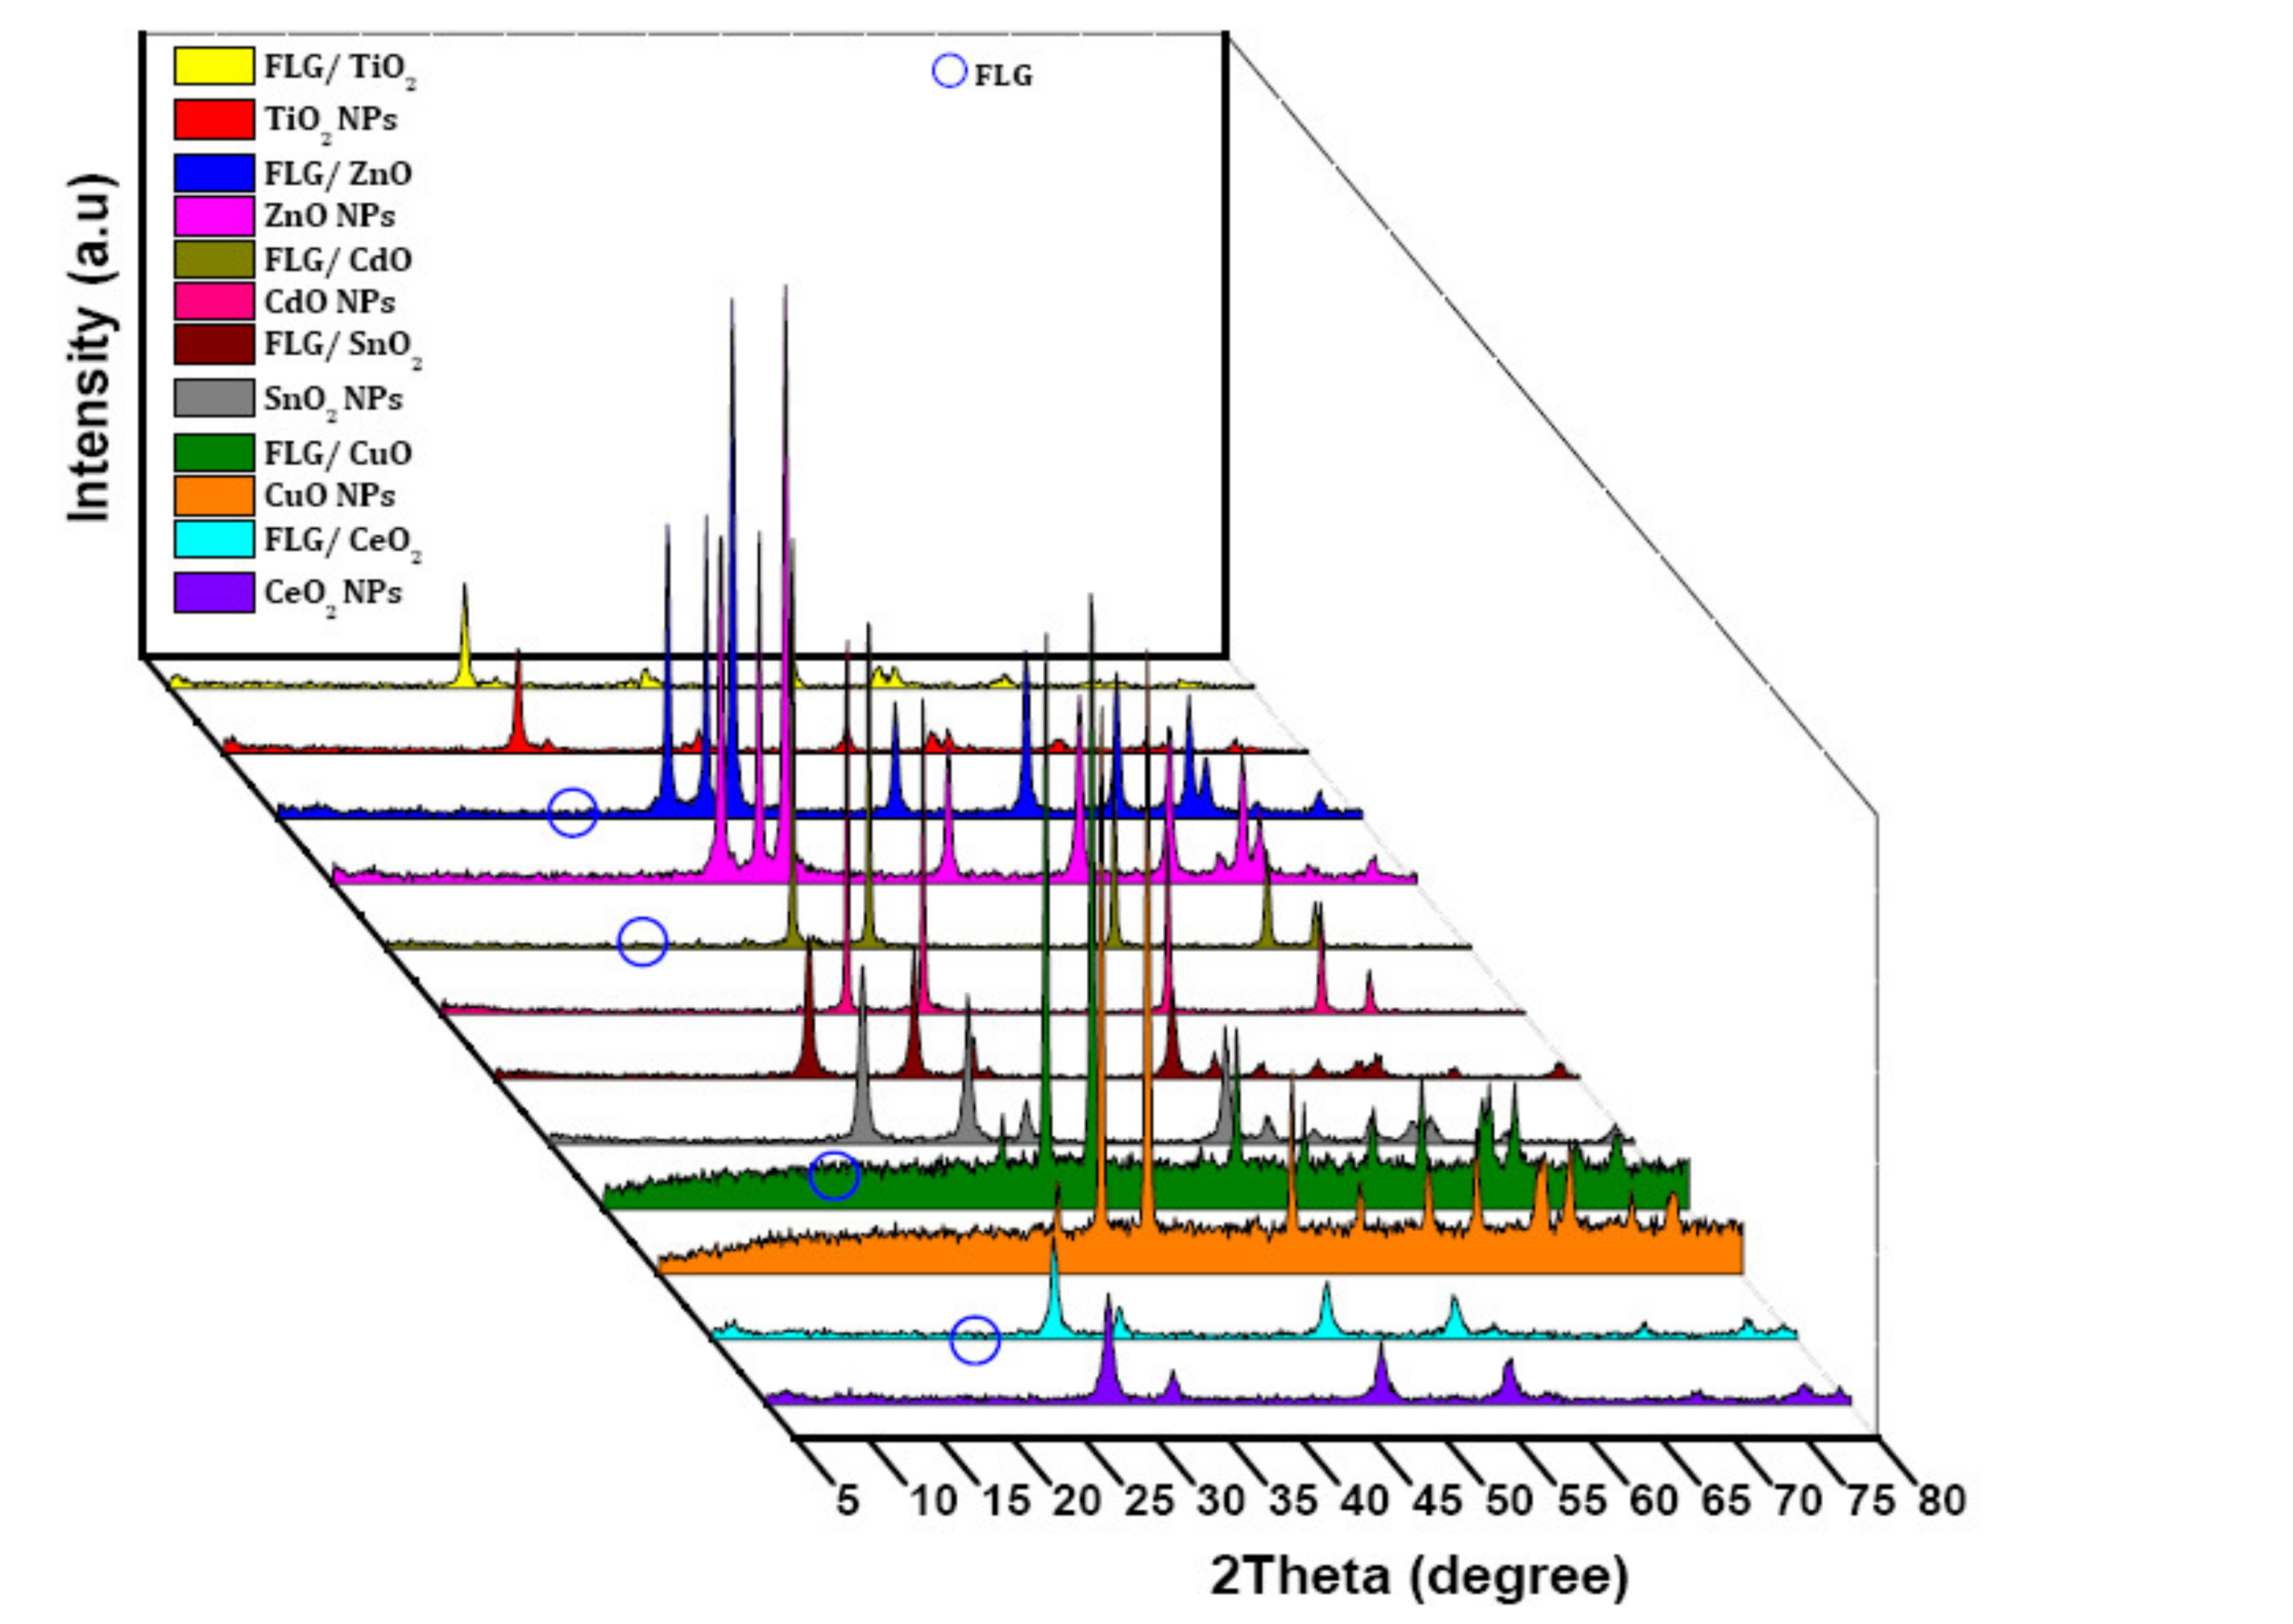
3.1.1. X-ray Diffraction Analysis

Figure 4 shows X-ray diffraction of synthesized MOs (MOs: CeO2, CuO, SnO2, CdO, ZnO and TiO2) and FLG/MO (FLG/CeO2, FLG/CuO, FLG/SnO2, FLG/CdO, FLG/ZnO, and FLG/TiO2) nanocomposites. The CeO2 individual peaks are 2θ values at 28.5°, 33°, 47.7°, 56.3°, 69.4°, 77° and 79° respectively, equivalent to the planes (111), (200), (220), (311), (400) (331), and (420). The results reveals that the CeO2 phase (cubic) obtained outcomes are well aligned with the standard database of the joint committee on powder diffraction standards (JCPDS).
On the other hand, CuO diffraction planes are (110), (111), (111), (202), (020), (202), (113), (022), (022), (311) (220), (311), and (004) were observed with the matching their 2θ values. The outcomes are coordinated with the JCPDS File shows for monoclinic structure. In the case of SnO2, the diffraction pattern exhibited a tetragonal structure. The tetragonal structure showed 2θ peaks at 26.8°, 33.9°, 37.9°, 51.8°, 54.8°, 57.7°, 61.8°, 64.8°, 66.0°, 71.2°, and 78.6°, the corresponding to basal spacing (100), (101), (200), (211), (220), (020), (311), (d112), (301), (202), and (321) planes are well matched with standard values respectively. The prepared CdO exhibited anatase crystalline phase with consistent planes are ((111), (200), (220), (311), and (222), respectively. The outcomes results are coordinated with JCPDF values. ZnO has the diffraction planes (100), (002), (101), (102), (110), (103), (112), (201), (004), and (202) with their associated 2θ values. The XRD data for wurtzite hexagonal phase structures were found to match the JCPDS File. The planes (101), (004), (200), (105), (211), (204), and (220) correspond to the anatase crystalline phase of TiO2. In all FLG/MO nanocomposites, a minor peak is detected at (2θ = 26.1°) which signifies the (002) plane FLG [23]. The distinctive (002) peaks are difficult to recognize in FLG/SnO2 and FLG/TiO2 nanocomposite because the FLG peaks are weak and overlap with the (110) peak of SnO2 (26.4°), and the (101) plane overlaps with TiO2 (26.3°).
The resulting patterns are consistent with the occurrence of pure MOs and their composites. JCPDS files are well-matched with these MOs, and its composites have notable peaks that correlate to their 2θ values. The Debye–Scherrer formula [24] is used to calculate the average crystalline. Table 1 displays the determined average crystalline sizes.
Figure 5 shows the surface morphology of prepared FLG/MO nanocomposites as examined by FE-SEM. Figure 5a, the surface morphology of CeO2 is observed as the rectangular shaped texture, replicating its layer structure. The shape of FLG/CeO2 nanocomposite and the surface area roofed CeO2 decked on FLG sheet is conserved after ultrasonic treatment, as shown in Figure 5b. The CuO and FLG/CuO nanocomposites were shown in Figure 5c,d. In the images, a trend is very conspicuous and can be noted to understand the morphological changes in these materials. The electron micrograph reveals that CuO NPs appear in the form of spheres, shown in Figure 5c, and in FLG/CuO, for Figure 5d, some of the CuO nanoparticles were decorated on the FLG sheet. Figure 5e,f ascribed the image of the SnO2 NPs and FLG/SnO2 nanocomposite. The trigonal rod-like morphology of the SnO2 NPs is observed (Figure 5e), and the surface area is almost covered with pure SnO2 NPs is shown in Figure 5f.
The surface morphology of CdO NPs was discovered to be a spherical shape in Figure 5g, and Figure 5h clearly confirmed that CdO NPs were evenly adorned on the edge of the FLG sheet and that the spherical shape of CdO NPs are inaccurately sitting on FLG sheets. As demonstrated in Figure 5i, the ZnO NPs have appeared as rods, whereas it was changed due to FLG and ZnO interface effects in the composite, as shown in Figure 5j. The ZnO nano rods were predominantly adhered to the FLG sheet edges. Figure 5k clearly shows TiO2 NPs with a spherical shape. In the case of composites, the crumpling nature of the TiO2 NPs covered on FLG sheet at the margins as shown in Figure 5l, is higher in FLG/TiO2 composites than in other nanocomposites. FE-SEM morphologies evidence that MOs NPs are bonding the FLG sheets, especially at edges. HR-TEM furtherly investigated the obtained materials.

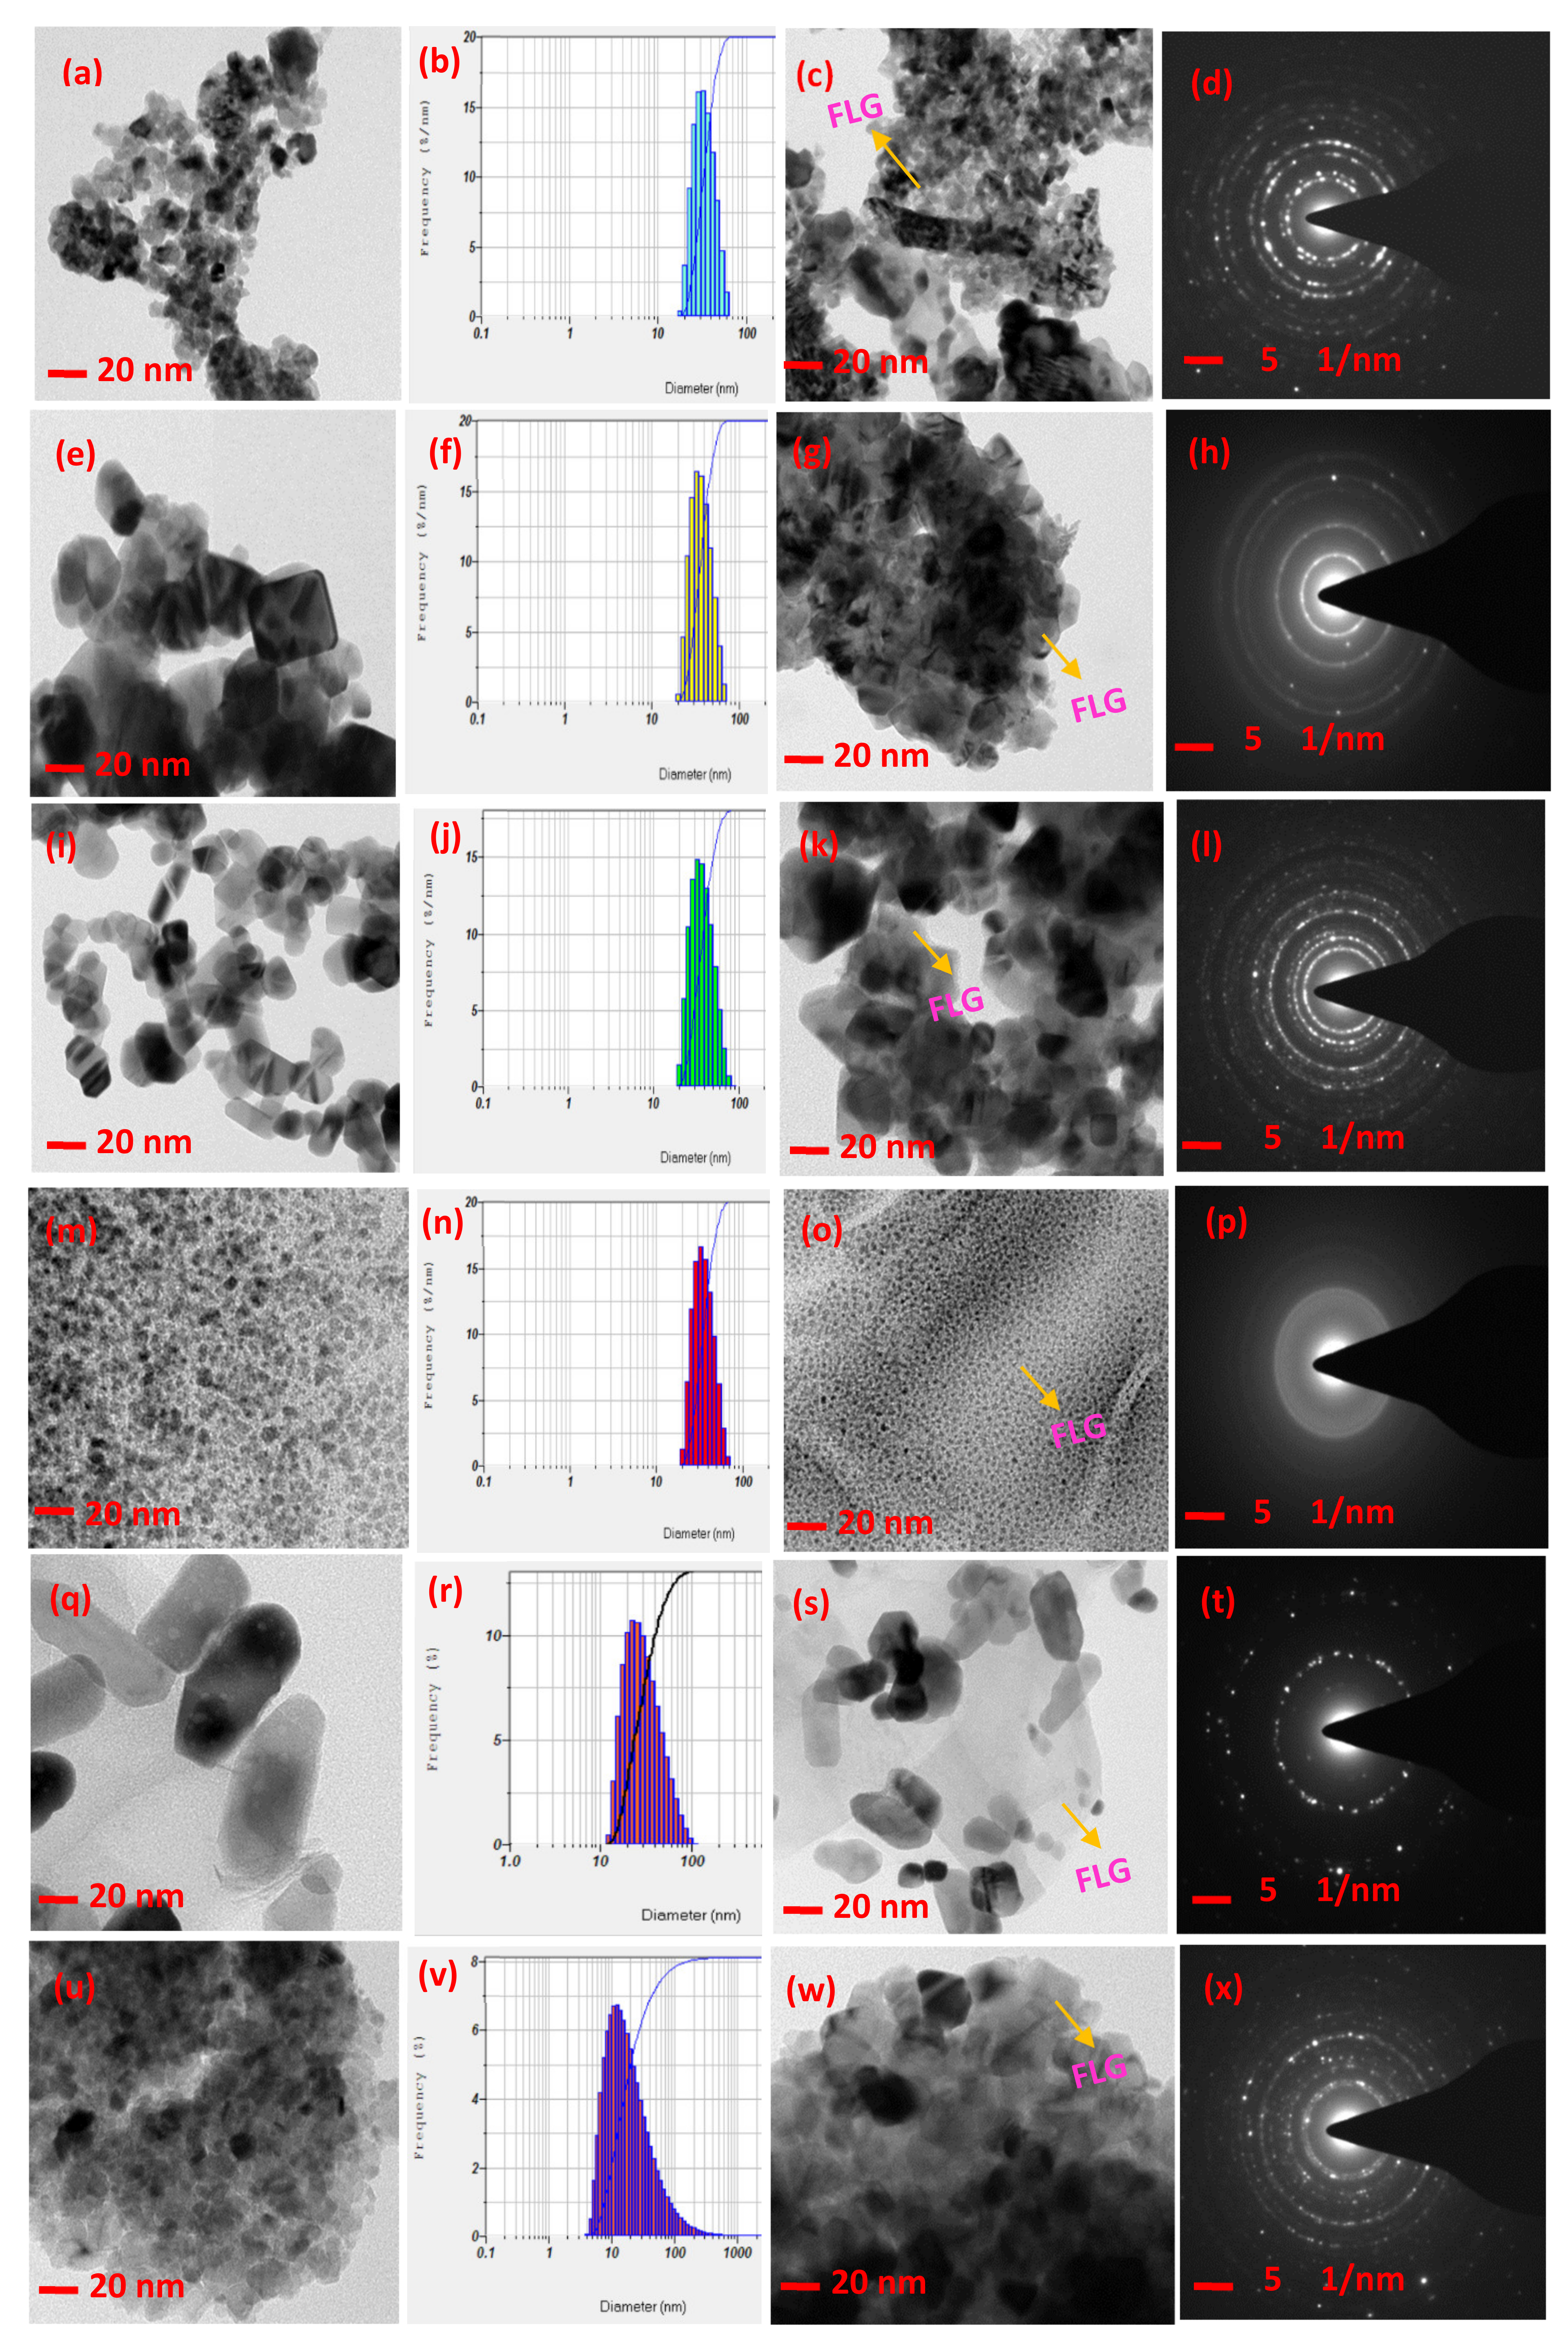
3.1.2. HR-TEM Analysis

The further morphology of prepared FLG/MO nanocomposites were investigated by HR-TEM. Figure 6a–d shows the HR-TEM images of CeO2 NPs and FLG/CeO2 nanocomposite. Figure 6a,b represents the CeO2 NPs and corresponding particle size distribution of the CeO2 NPs i.e., around ~34 nm, respectively. From Figure 6c, it can be observed that CeO2 NPs are uniformly decked with FLG sheet. The corresponding selected area electron diffraction (SAED) pattern of FLG/CeO2 reveals the semi-crystalline nature of the composite, as shown in Figure 6d. The square shapes of CuO NPs are having the particle size around ~37 nm and morphology of square shapes as shown in Figure 6e,f. The CuO NPs are completely decorated on the FLG sheet (Figure 6g), but some locations’ CuO NPs are agglomerated on the FLG sheet. Figure 6h shows that the SAED pattern of FLG/CuO is nanocomposite. The tetragonal structures of SnO2 NPs as shown in Figure 6i, and its particle size is around ~31 nm as shown Figure 6j. Further HR-TEM images show that Figure 6k shows FLG/SnO2 nanocomposite. From this, it is clearly seen that the FLG was observed, and the SnO2 NPs are evenly decorated on FLG in a sandwich type structure. The FLG/SnO2 nanocomposite SAED pattern is shown in Figure 6l. From this result, we observed good crystalline structure. The morphology of irregular and very small spherical shape NPs are observed for CdO NPs and shown in Figure 6m. The particle size around ~30 nm was observed and shown in Figure 6n. The images of FLG/CdO nanocomposites in Figure 6o shows that spherical shape CdO NPs are fully decked on the surface of FLG sheet. Therefore, it shows the distributions of some CdO NPs are agglomerated on the FLG sheet. The corresponding SAED pattern, as shown in Figure 6p, shows the amorphous nature.
In the ZnO NPs, a homogeneous rod-shaped particle was observed, as illustrated in Figure 6q, and their particle size is around ~36 nm as shown in Figure 6r. The rod-shaped ZnO NPs distributed across the FLG was shown in Figure 6s. The results demonstration that FLG sheet is decorated with ZnO NPs and a SAED pattern as shown in Figure 6t. The spherical shape of TiO2 NPs and its particle size around ~28 nm is shown in Figure 6u,v, and the plane sheet nature of FLG is observed at the edges. Except in FLG/TiO2 nanocomposites, as shown in Figure 6w, the SAED pattern of FLG/TiO2 nanocomposite shows the matching lattice fringes, indicating the creation of TiO2 NPs with good semi-crystalline nature as shown in Figure 6x. The above TEM analysis reveals that, except CuO and CdO, which exhibited agglomeration, all other FLG/MO composites were uniformly decked with FLG.

3.2. Spectroscopy & Optical Studies

3.2.1. Raman Analysis

The most substantial intensity peak (Supplementary Information (SI), Figure S1a) at about 459 cm−1 (F2g mode) is considered the symmetric stretching mode of oxygen atoms around cerium-ions. The typical D, G, and 2D bands at 1346 cm−1, 1582 cm−1, and 2732 cm−1 originate in FLG/CeO2 nanocomposites as shown Figure S1b. In the case of CuO NPs, Raman analysis reveals three significant peaks (Figure S1c) at 278, 330, and 614 cm−1 for CuO NPs, which depict the cubic structure, with the peak at 280 cm−1 equivalents to the Ag. It could be part of the C6/2 h space group, with peaks at 332 and 618 cm−1 corresponding to Bg modes. The characteristic D,G and 2D bands were also observed in FLG/CuO nanocomposites as shown in Figure S1d. The Raman spectra of SnO2 NPs mainly show three significant peaks (Figure S1e) at 475, 632, 720 cm−1, which corresponds to E1g, A1g, and B2g modes, respectively. The correspond D, G and 2D bands found in FLG/SnO2 nanocomposites (Figure S1f). The characteristic of CdO NPs three central peaks attained at 267, 392, and 936 cm−1 are shown in the (Figure S1g). However, the FLG/CdO nanocomposites of D, G and 2D bands were observed in Figure S1h. In ZnO, there are three notable vibration peaks at 329, 378, and 438 cm−1 as shown in Figure S1i. Oxygen deficiency is responsible for the peak at 438 cm−1, which is located between the A1 (LO) and E1 (LO) optical phonon modes. The nonpolar E2 optical phonon mode is represented by the peak at 329 cm−1. The 2E2 mode is allocated to the 378 cm−1 peaks attributed to the second-order Raman process. The high strength of this peak indicates that ZnO nanorods formed at room temperature are deficient in oxygen. The D, G, and 2D bands were found in FLG/ZnO nanocomposites as shown in Figure S1j. In TiO2, strong Raman bands were found at 398 (B1g) and 515 (A1g, B1g) (Figure S1k). In the anti-stokes spectra of TiO2, the Eg band at 398 cm−1 was the strongest. The band at 515 cm−1 represents the anatase phase of TiO2. The typical D, G, and 2D bands originate in FLG/TiO2 nanocomposites were shown in Figure S1l, whereas in all FLG/MOs nanocomposites, the prominent bands such as (D ~1346 cm−1), (G ~1582 cm−1), and (2D ~2732 cm−1) were observe corresponding to their frequencies. The Raman spectrums of the nanocomposites strongly suggest the attachment of MOs on FLG sheets with suitable bonding. The number of layers present in the graphene sheet is normally determined by the intensity ration between the D and G bands. The ID/IG ratio information is presented in Table 2.
The decrease in the ID/IG ratio clearly represents few layers in all the FLG/CeO2, FLG/CuO, FLG/SnO2, FLG/CdO, FLG/ZnO, and FLG/TiO2 nanocomposites and these results are well matched with TEM.

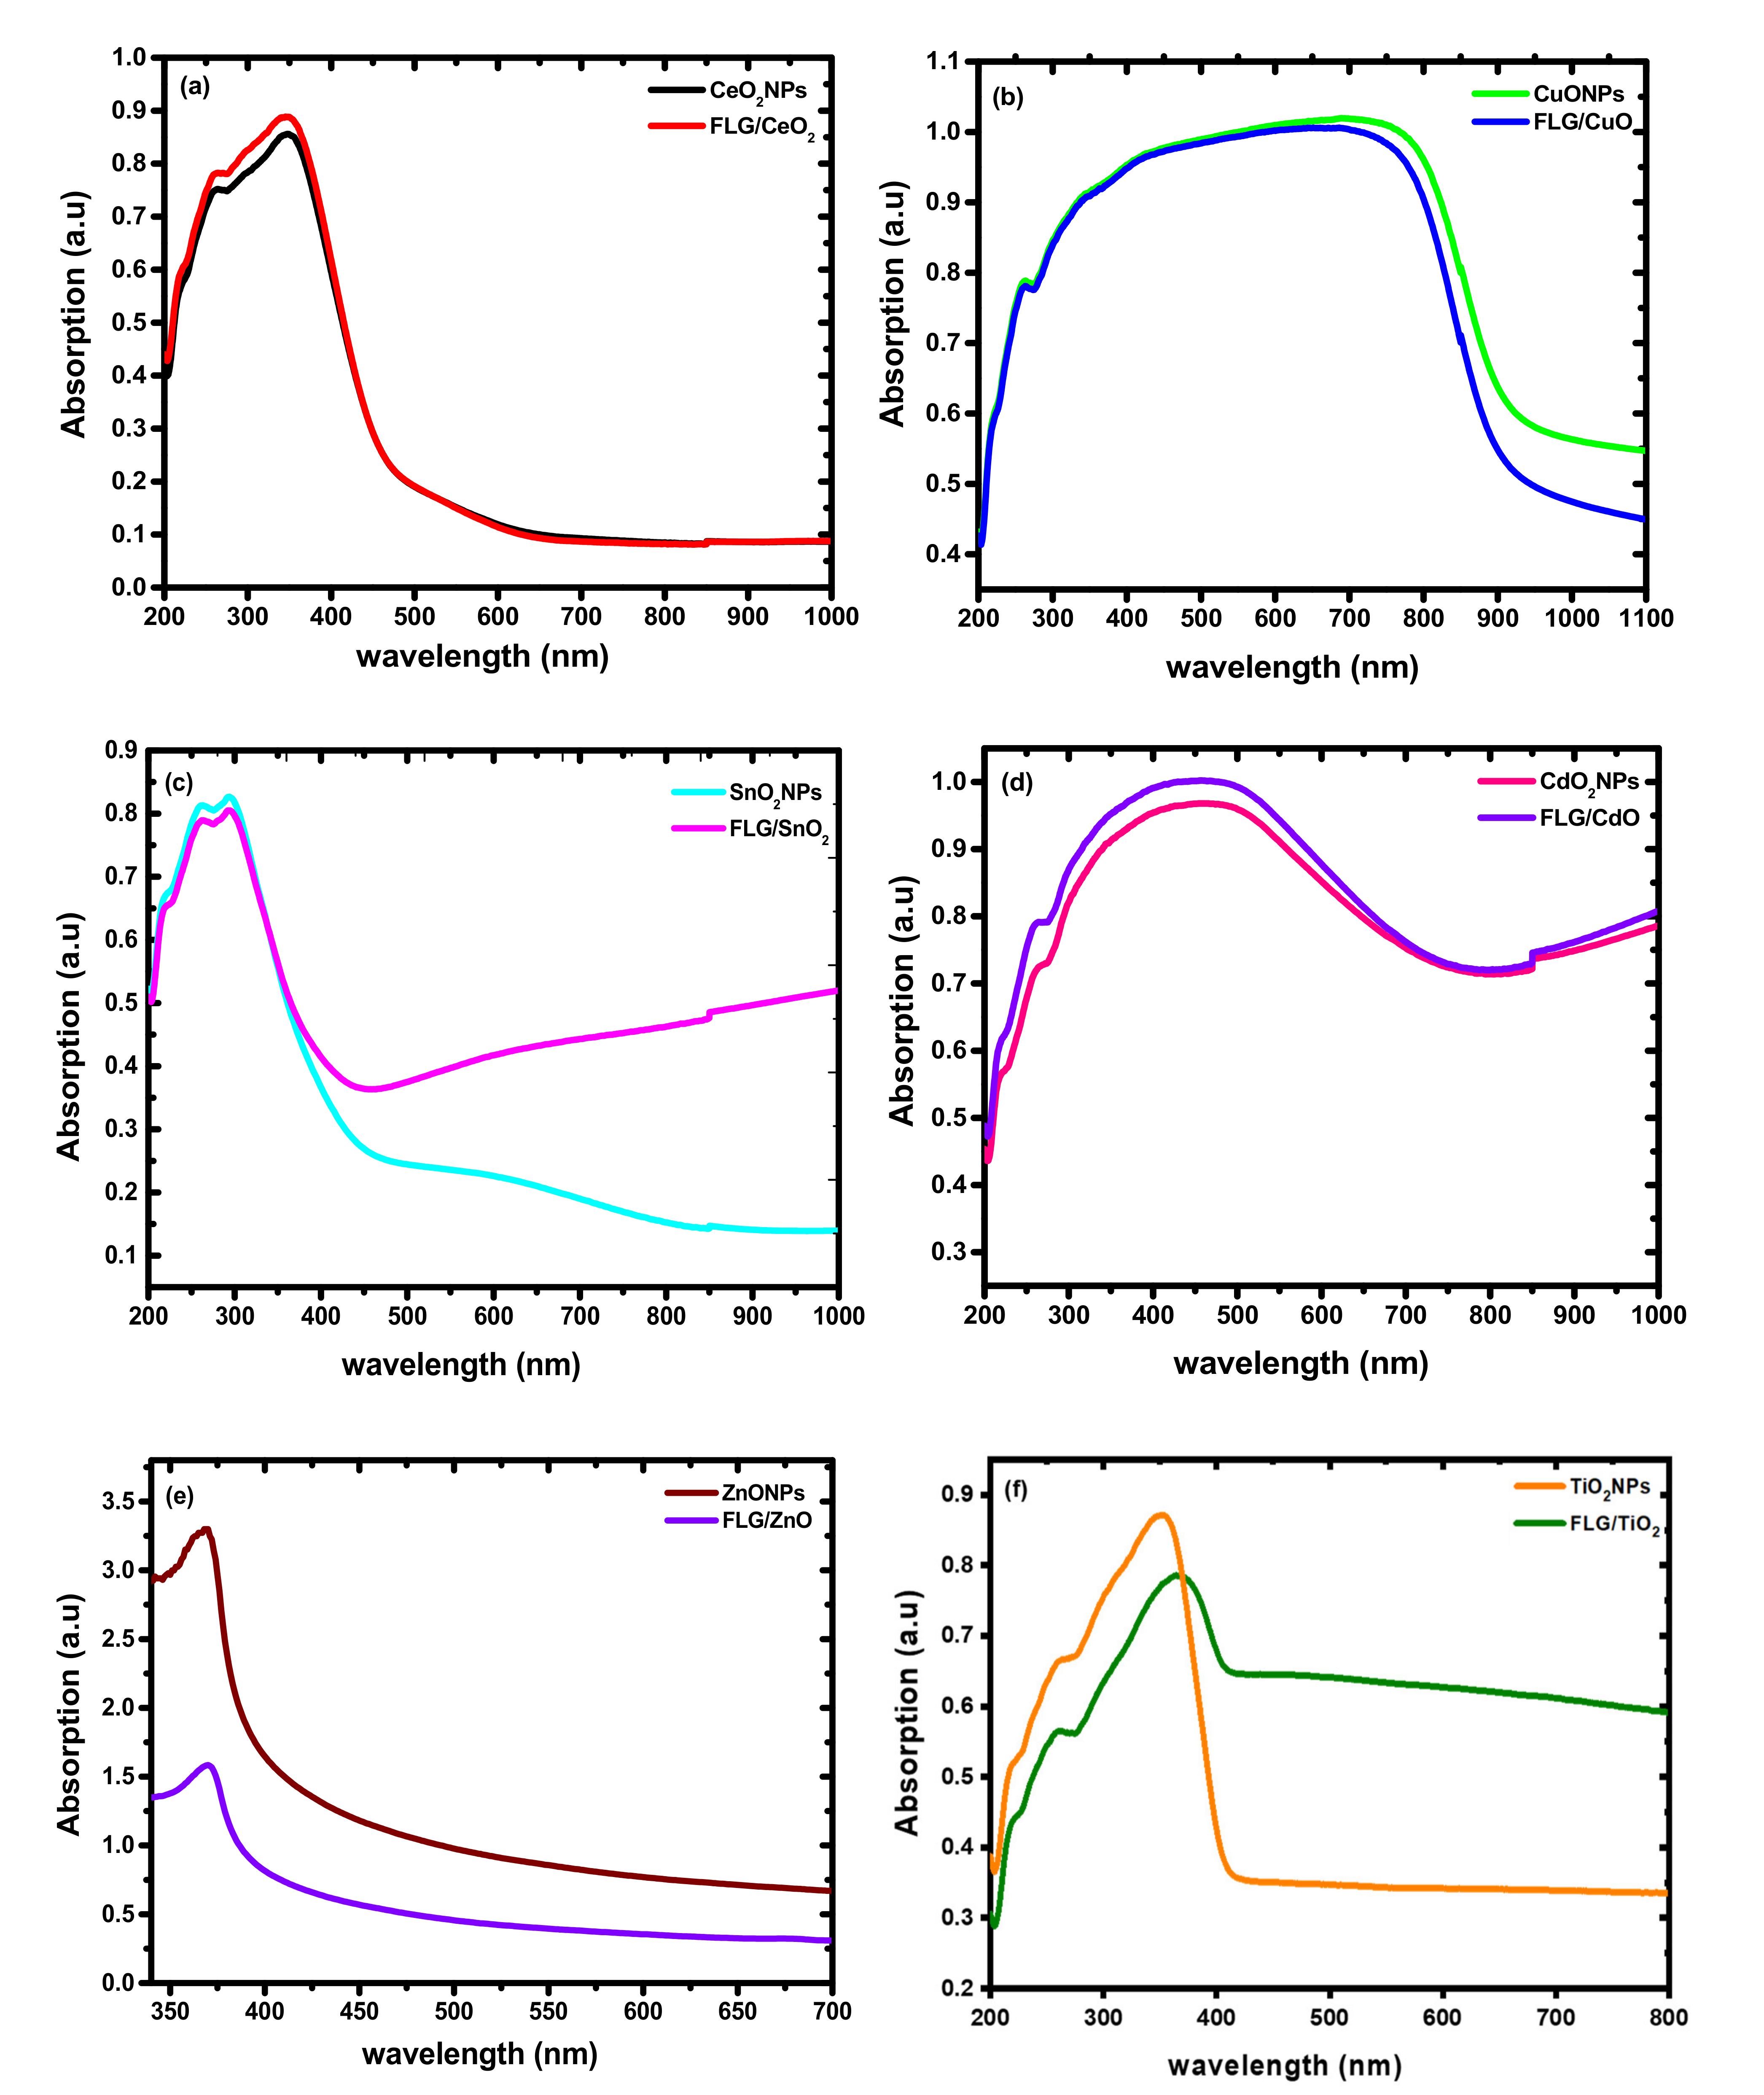
3.2.2. UV-DRS Analysis

The UV-DRS of MOs and FLG/MO nanocomposites are shown in Figure 7. The absorption peak of CeO2 NPs has a significant peak at wave length (λmax) ~364 nm. The FLG/CeO2 nanocomposite absorption peak the λmax was slightly shifted ~366 nm compared to CeO2 NPs, as shown in Figure 7a. The CuO NPs and the λmax shown at ~686 nm, in the case of FLG/CuO λmax at ~689 nm, is shown in Figure 7b. The tetragonal structure of SnO2 NPs absorption peak λmax is observed at ~294 nm. In the spectra of FLG/SnO2 nanocomposites, the λmax at ~298 is shown in Figure 7c. Figure 7d clearly explains that the λmax of CdO NPs was detected at ~454 nm, whereas FLG/CdO nanocomposites λmax at ~457 nm. The ZnO NPs is λmax exhibited at~364 nm, the FLG/ZnO nanocomposites λmax at ~368 nm as shown in Figure 7e. The λmax of TiO2 NPs is displayed at ~362 nm, the λmax of prepared FLG/TiO2 nanocomposites is exhibited at ~398 nm as shown in Figure 7f. In all FLG/MO nanocomposites these λmax values are slightly shifted as a compared with MOs, because of the FLG introduce in MOs.
The band gap of obtained MOs and FLG/MO nanocomposites were shown in Supplementary Information (SI) Figure S2. These materials’ band gaps are recognized from the absorption spectra by the Tauc equation [25]. The estimated band gaps results were assumed in Table 3. The plot of (αhυ)2 vs. hυ (energy bandgap (Eg)) MOs and FLG/MO nanocomposites were shown in Figure S2a–l. The optical bandgap can be calculated by intersecting the abscissa axis with the whole line of the (αhυ)2 vs. hυ plot. The different band gaps were observed in the MOs and FLG/MO nanocomposites. The obtained results show that, with addition of the FLG, the band gap of FLG/MO nanocomposite decreases slightly compared to blank MOs. With addition of FLG content in TiO2, there is an enhanced absorbance in the visible-light region ranging from 400–800 nm (Figure 7f). Furthermore, with introduction of the FLG in the matrix of TiO2, a red shift in the absorption band edge is observed, which indicates the band gap narrowing of TiO2. Similar observations are made for graphene-based semiconductor nanocomposites, resulting from the electronic interaction between graphene and the semiconductor [26,27,28,29,30]. As a result, introduction of FLG in the photo electrode has a substantial impact on the performance of DSSCs, in terms of efficient electron acceptor and transporter.

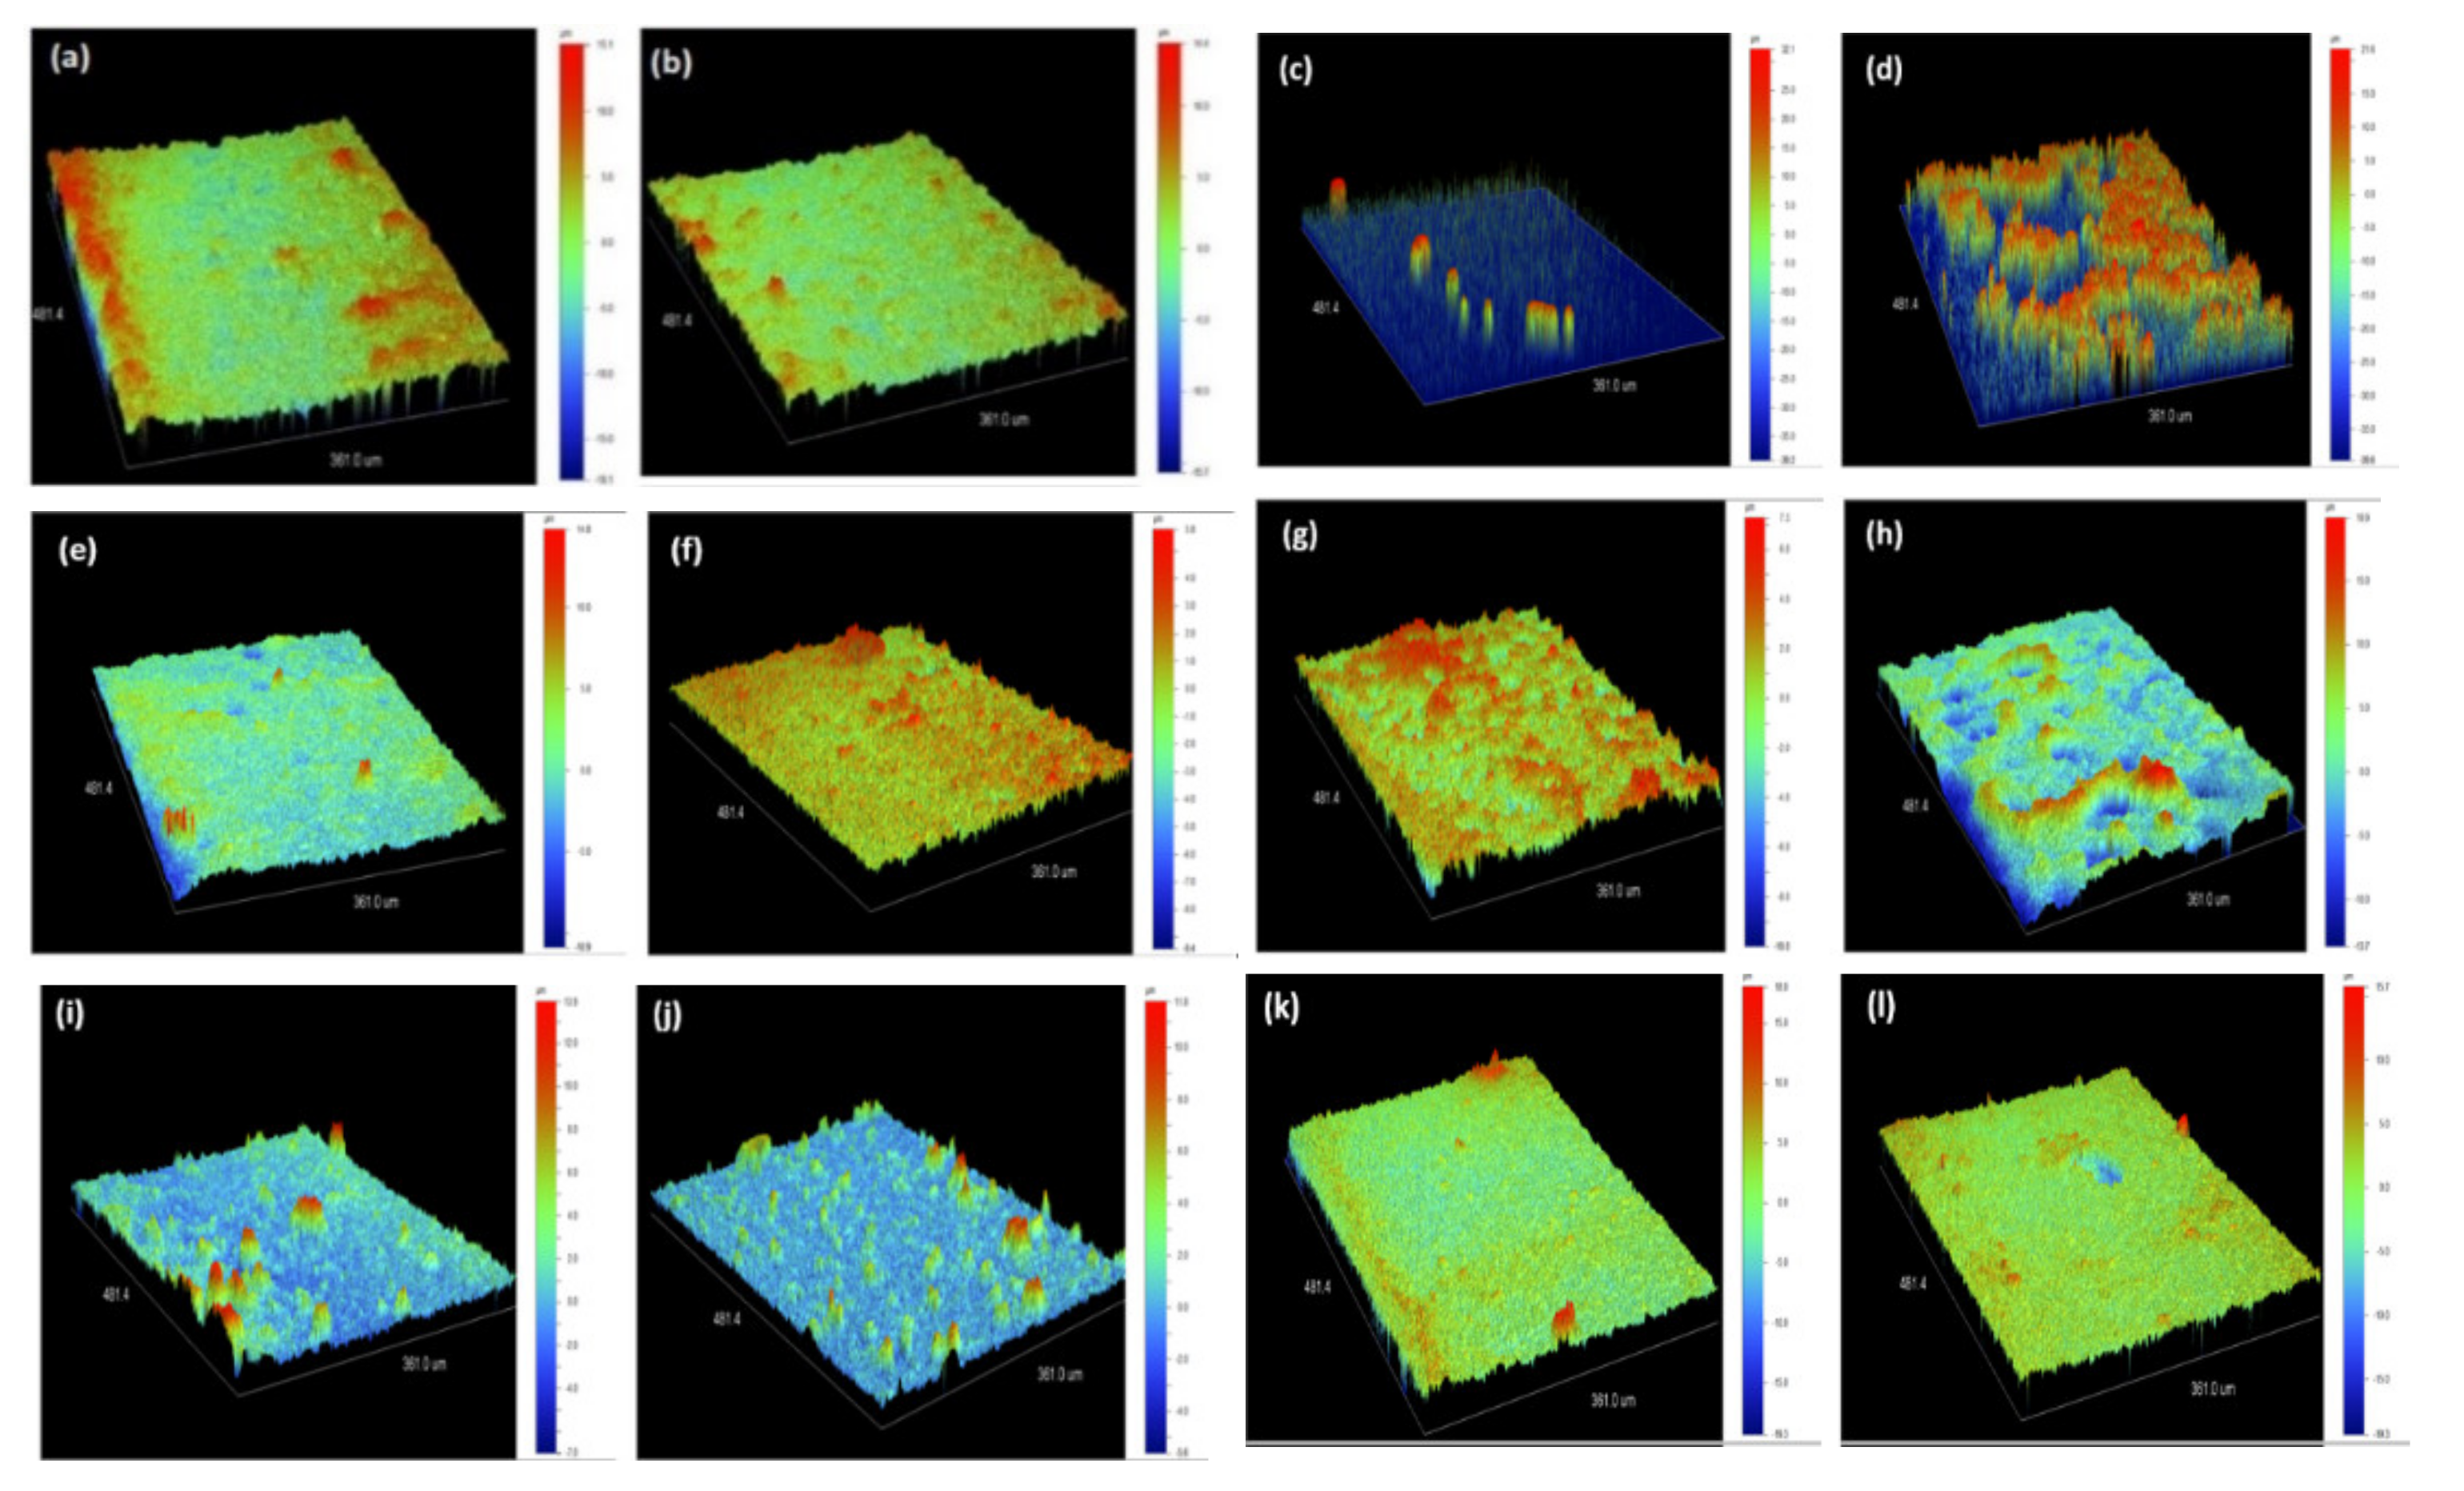
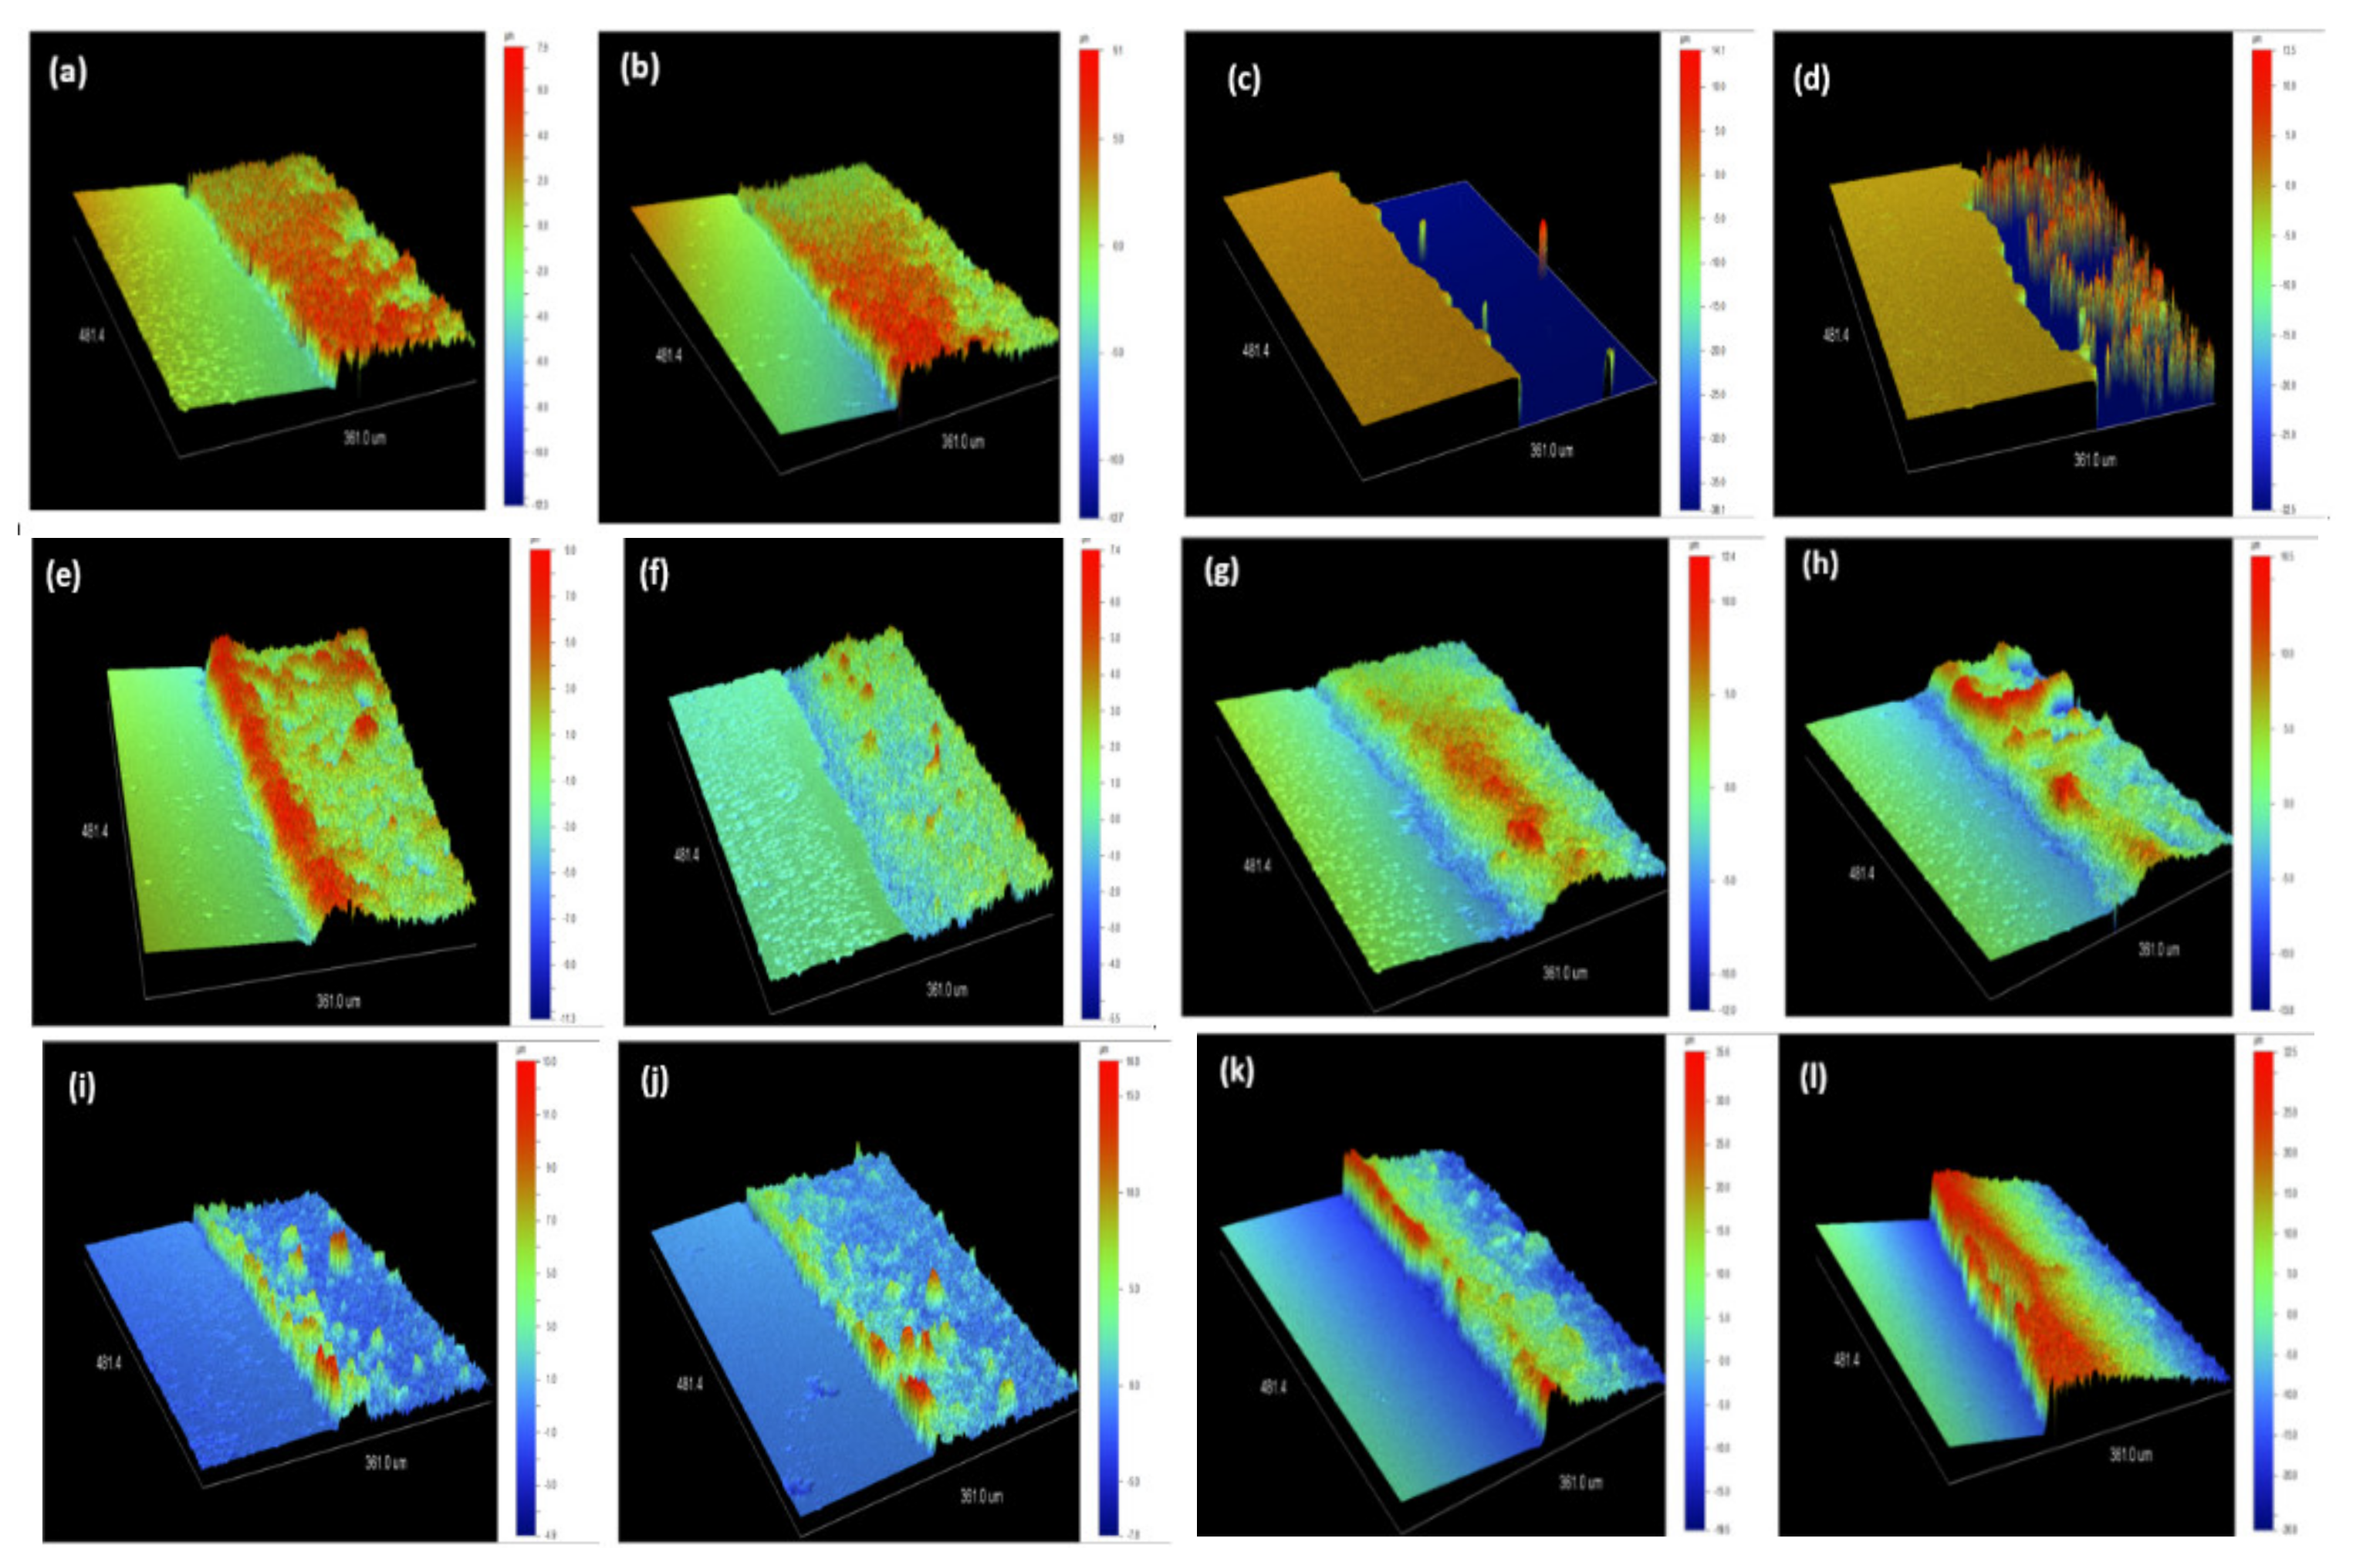
3.3. Film Thickness Measurement

The prepared MOs and FLG/MO nanocomposites thin films were coated on the FTO surface by DB method. The thickness and roughness of these films were examined by optical 3-D surface profilo-meter. The thickness and roughness of metal oxides (MO) and FLG/MO nanocomposite thin films were exposed in Figure 8 and Figure 9. The thickness of the MOs and FLG/MO nanocomposites and the results show that, if the thickness is observed in the MOs and FLG/MO nanocomposites, less thickness results were achieved in all the FLG/MO nanocomposites, as compared to MOs, because the FLG is reduced in thickness, as well as roughness. The thickness and roughness of these film results are described in Table 4.

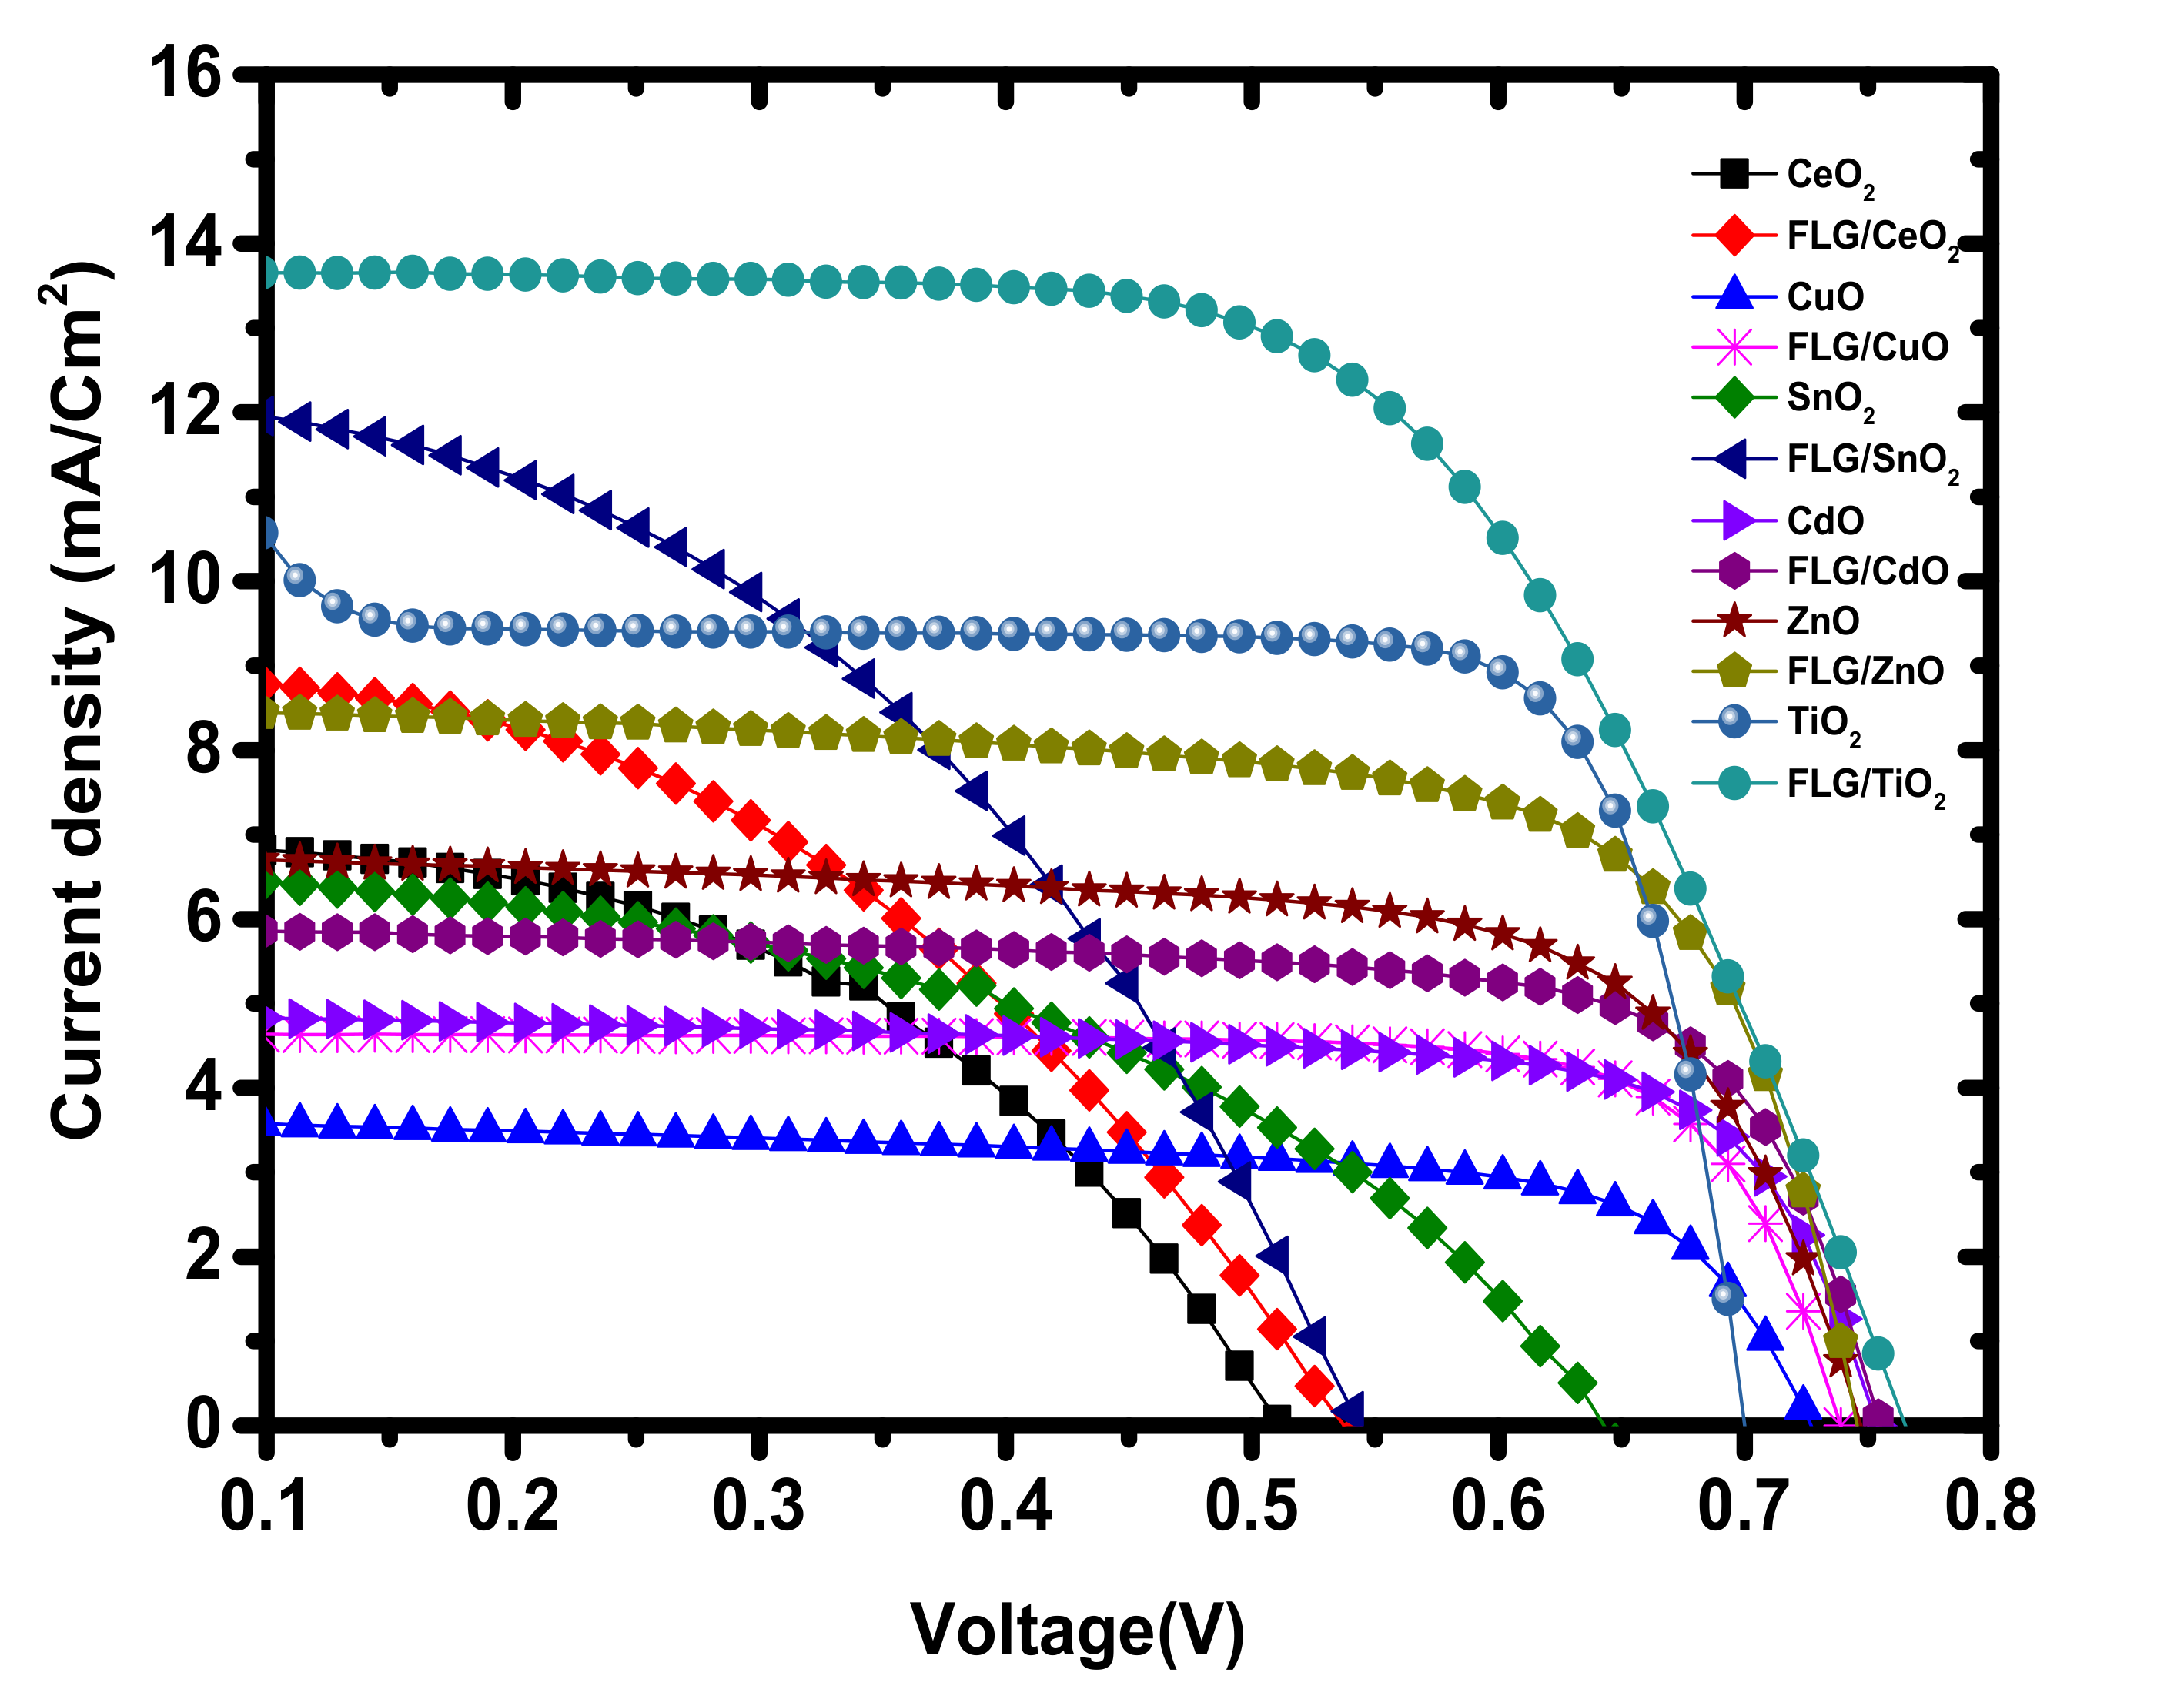
3.4. DSSCs Application

DB method was used to fabricate MOs and FLG/MO nanocomposite photoanode thin films for DSSCs applications. Figure 10 depicts the step-wise energy level band diagram of FLG/MOs nanocomposite photoanodes. The dye molecules are excited from a lower unoccupied molecular orbital (LUMO) to a higher unoccupied molecular orbital (HUMO) when exposed to light (HOMO). Following that, the ejected electrons will transfer to MOs’ conduction band. Finally, an FTO conductive substrate and an external circuit are used to reach the platinum counter electrode.
Figure 11 shows the J-V curves of MO and FLG/MO nanocomposite photoanodes, measured under simulated 100 m W/m2 illumination. The FF and PCE of the device was estimated using the relation given by Equations (1) and (2), respectively.
FF = ((Imax.Vmax))/(Isc.Voc)
where, Imax is maximum current and V max is maximum voltage of power output, Isc is short-circuit current, Voc is open circuit voltage. The PCE was determined using the formula.
PCE = (Vopt.Iopt)/Pin × 100 = ((Voc.Isc.FF))/Pin × 100
where Vopt is optimal voltage, Iopt is optimal current, and Pin is power of incident light.
The measured all cell parameters of Voc, JSC, FF, and PCE results are listed in Table 5. The significant values noted in FLG/MOs nanocomposites compare to various wide bandgap semiconducting metal oxides. Compared to other FLG/MO nanocomposites, FLG/TiO2, exhibited significantly improved device performance. The schematic energy-level diagram for the FLG/TiO2 device cell is depicted in Figure 10. It can be seen that the offset (0.42 eV) between the conduction band minimum of TiO2 and the work function of graphene is sufficient for charge separation. Meanwhile, the FLG will not block the injected electrons flowing down to the transparent electrode because its work function is higher than that of the FTO electrode. Moreover, it has been reported that the addition of graphene sheets can increase the electrical conductivity of the electrodes [31,32]. Therefore, the implanted graphene sheets serve as the electron acceptor and facilitate rapid transport of the photogenerated electrons, thereby decreasing the probability of recombination [33,34]. It results in a low recombination rate at the interface, improving the PCE of the DSSCs.
Mainly, the three reasons that affect the lower PCE in remaining nanocomposite photoanodes are less dye loading in sunlight, strong absorption of light by FLG, and no proper conductive path between them. Furthermore, the J-V curves showed that adding FLG into the MOs can improve the efficiency of DSSC devices. FLG/TiO2 nanocomposite showed a maximum PCE of 6.60%, which is optimized among the nanocomposites. TiO2 based graphene composites have been proved rigorously as an alternative electrocatalyst for DSSCs, and some lower percentages (<1%) of FLG have to be studied immediately.

4. Conclusions

In conclusion, the present research work mainly focused on the synthesis of few layered graphene/metal oxide (CeO2, CuO, SnO2, CdO, ZnO, and TiO2) nanocomposites prepared by novel and straightforward ultrasonic-assisted route. Various characterization techniques were used to investigate the unique characteristics of FLG/Metal Oxides nanocomposites, including structural, surface morphology and optical properties. The doctor blade method was used to fabricate the prepared MOs and FLG/MO nanocomposite thin films. For DSSCs applications, the thin films were used as photoanodes. As compared to other FLG/Metal Oxides (CeO2, CuO, SnO2, CdO, and ZnO) nanocomposites, a significant increase of 6.60% in PCE was accomplished in DSSCs using FLG/TiO2 nanocomposite as photoanode. This unusual result demonstrates that FLG in TiO2 performances as a blocking layer in DSSCs, suppressing back electron-hole recombination and thus improving PCE. The FLG/TiO2 nanocomposite was found to be a superior photoanode for DSSCs application based on I-V results.

Supplementary Materials

The following are available online at https://0-www-mdpi-com.brum.beds.ac.uk/article/10.3390/su13147685/s1, Figure S1: Raman spectroscopy of S1. (a) CeO2 NPs S1.(b) FLG/CeO2 S1.(c) CuO NPs, S1.(d) FLG/CuO, S1. (e) SnO2 NPs, S1.(f) FLG/SnO2, S1.(g) CdO NPs S1.(h) FLG/CdO, S1.(i) ZnO NPs, S1.(j) FLG/ZnO, S1.(k) TiO2 NPs, S1.(l) FLG/TiO2 nanocomposites., Figure S2: Plot of (αhv)2 Vs energy band of S2.(a) CeO2 NPs, S2.(b) FLG/CeO2, S2.(c)CuO NPs, S2.(d) FLG/CuO, S2.(e) SnO2 NPs, S2.(f) FLG/SnO2 S2.(g) CdO NPs, S2.(h) FLG/CdO, S2.(i) ZnO NPs, S2.(j) FLG/ZnO S2.(k) TiO2 NPs, S2.(l) FLG/TiO2 nanocomposites.

Author Contributions

Writing—original draft preparation, methodology, S.B.; formal analysis D.N.P.; writing—review and editing, M.R.M.; supervision, K.K.S.; funding acquisition, J.-J.C. All authors have read and agreed to the published version of the manuscript.

Funding

This work was supported by Qatar National Research Fund under the grant no. NPRP12S-0131-190030. The statements made herein are solely the responsibility of the authors.

Institutional Review Board Statement

Not applicable.

Informed Consent Statement

Not applicable.

Data Availability Statement

This study did not report any data.

Acknowledgments

This work was carried by the NPRP grant # NPRP12S-0131-190030 from the Qatar National Research Fund (a member of Qatar Foundation). The statements made herein are solely the responsibility of the authors.

Conflicts of Interest

The authors declare no conflict of interest.

References

  1. Bagher, A.M.; Vahid, M.M.A.; Mohsen, M. Types of Solar Cells and Application. Am. J. Opt. Photon. 2015, 3. [Google Scholar] [CrossRef]
  2. Yun, S.; Qin, Y.; Uhl, A.R.; Vlachopoulos, N.; Yin, M.; Li, D.D.; Han, X.; Hagfeldt, A. New-generation integrated devices based on dye-sensitized and perovskite solar cells. Energy Environ. Sci. 2018, 11, 476–526. [Google Scholar] [CrossRef]
  3. Zhou, D.; Zhou, T.; Tian, Y.; Zhu, X.; Tu, Y. Perovskite-Based Solar Cells: Materials, Methods, and Future Perspectives. J. Nanomater. 2018, 2018. [Google Scholar] [CrossRef]
  4. Lucas, F.W.D.S.; Zakutayev, A. Research Update: Emerging chalcostibite absorbers for thin-film solar cells. APL Mater. 2018, 6. [Google Scholar] [CrossRef]
  5. Yang, S.; Fu, W.; Zhang, Z.; Chen, H.; Li, C.-Z. Recent advances in perovskite solar cells: Efficiency, stability and lead-free perovskite. J. Mater. Chem. A 2017, 5, 11462–11482. [Google Scholar] [CrossRef]
  6. Thakur, U.K.; Kisslinger, R.; Shankar, K. One-dimensional electron transport layers for perovskite solar cells. Nanomaterials 2017, 7, 95. [Google Scholar] [CrossRef] [PubMed]
  7. Desilvestro, J.; Graetzel, M.; Kavan, L.; Moser, J.; Augustynski, J. Highly efficient sensitization of titanium dioxide. J. Am. Chem. Soc. 1985, 107, 2988–2990. [Google Scholar] [CrossRef]
  8. Liska, P.; Vlachopoulos, N.; Nazeeruddin, M.K.; Comte, P.; Graetzel, M. cis-Diaquabis (2, 2’-bipyridyl-4, 4’-dicarboxylate) ruthenium (II) sensitizes wide band gap oxide semiconductors very efficiently over a broad spectral range in the visible. J. Am. Chem. Soc. 1988, 110, 3686–3687. [Google Scholar] [CrossRef]
  9. Vlachopoulos, N.; Liska, P.; Augustynski, J.; Graetzel, M. Very efficient visible light energy harvesting and conversion by spectral sensitization of high surface area polycrystalline titanium dioxide films. J. Am. Chem. Soc. 1988, 110, 1216–1220. [Google Scholar] [CrossRef]
  10. O’Regan, B.; Grätzel, M. A low-cost, high-efficiency solar cell based on dye-sensitized colloidal TiO2 films. Nature 1991, 335, 737–740. [Google Scholar] [CrossRef]
  11. Wang, P.; Zakeeruddin, S.M.; Exnar, I.; Grätzel, M. High efficiency dye-sensitized nanocrystalline solar cells based on ionic liquid polymer gel electrolyte. Chem. Commun. 2002, 24, 2972–2973. [Google Scholar] [CrossRef] [PubMed]
  12. Park, N.-G.; Kim, K.M.; Kang, M.G.; Ryu, K.S.; Chang, S.H.; Shin, Y.-J. Chemical Sintering of Nanoparticles: A Methodology for Low-Temperature Fabrication of Dye-Sensitized TiO2 Films. Adv. Mater. 2005, 17, 2349–2353. [Google Scholar] [CrossRef]
  13. Lee, K.; Park, S.W.; Ko, M.J.; Kim, K.; Park, N.-G. Selective positioning of organic dyes in a mesoporous inorganic oxide film. Nat. Mater. 2009, 8, 665–671. [Google Scholar] [CrossRef]
  14. Lee, W.; Roh, S.-J.; Hyung, K.-H.; Park, J.; Lee, S.-H.; Han, S.-H. Photoelectrochemically polymerized polythiophene layers on ruthenium photosensitizers in dye-sensitized solar cells and their beneficial effects. Sol. Energy 2009, 83, 690–695. [Google Scholar] [CrossRef]
  15. Memming, R.; Tributsch, H. Electrochemical investigations on the spectral sensitization of gallium phosphide electrodes. J. Phys. Chem. 1971, 75, 562–570. [Google Scholar] [CrossRef]
  16. Hummers, W.S., Jr.; Offeman, R.E. Preparation of graphitic oxide. J. Am. Chem. Soc. 1958, 80, 1339. [Google Scholar] [CrossRef]
  17. Vieira, G.B.; José, H.J.; Peterson, M.; Baldissarelli, V.Z.; Alvarez, P.; Moreira, R.D.F.P.M. CeO2/TiO2 nanostructures enhance adsorption and photocatalytic degradation of organic compounds in aqueous suspension. J. Photochem. Photobiol. A Chem. 2018, 353, 325–336. [Google Scholar] [CrossRef]
  18. Amadine, O.; Essamlali, Y.; Fihri, A.; Larzek, M.; Zahouily, M. Effect of calcination temperature on the structure and catalytic performance of copper–ceria mixed oxide catalysts in phenol hydroxylation. RSC Adv. 2017, 7, 12586–12597. [Google Scholar] [CrossRef]
  19. Ullah, H.; Khan, I.; Yamani, Z.; Qurashi, A. Sonochemical-driven ultrafast facile synthesis of SnO2 nanoparticles: Growth mechanism structural electrical and hydrogen gas sensing properties. Ultrason. Sonochem. 2017, 34, 484–490. [Google Scholar] [CrossRef]
  20. Somasundaram, G.; Rajan, J.; Paul, J. Effect of the calcination process on CdO–ZnO nanocomposites by a honey-assisted combustion method for antimicrobial performance. Toxicol. Res. 2018, 7, 779–791. [Google Scholar] [CrossRef] [PubMed]
  21. Peerakiatkhajohn, P.; Butburee, T.; Sul, J.-H.; Thaweesak, S.; Yun, J.-H. Efficient and Rapid Photocatalytic Degradation of Methyl Orange Dye Using Al/ZnO Nanoparticles. Nanomaterials 2021, 11, 1059. [Google Scholar] [CrossRef] [PubMed]
  22. Almeida, L.A.; Habran, M.; dos Santos Carvalho, R.; Maia da Costa, M.E.H.; Cremona, M.; Silva, B.C.; Krambrock, K.; Ginoble Pandoli, O.; Morgado, E., Jr.; Marinkovic, B.A. The Influence of Calcination Temperature on Photocatalytic Activity of TiO2-Acetylacetone Charge Transfer Complex towards Degradation of NOx under Visible Light. Catalysts 2020, 10, 1463. [Google Scholar] [CrossRef]
  23. Park, S.; An, J.; Potts, J.R.; Velamakanni, A.; Murali, S.; Ruoff, R.S. Hydrazine-reduction of graphite- and graphene oxide. Carbon 2011, 49, 3019–3023. [Google Scholar] [CrossRef]
  24. Klung, H.; Alexander, L. X-Ray Diffraction Procedures; John Wiley & Sons: New York, NY, USA, 1962; Volume 1, 974p. [Google Scholar]
  25. Tauc, J. Amorphous and Liquid Semiconductors; Springer Science & Business Media: Berlin, Germany, 2012. [Google Scholar]
  26. Zhang, N.; Zhang, Y.; Pan, X.; Fu, X.; Liu, S.; Xu, Y.-J. Assembly of CdS Nanoparticles on the Two-Dimensional Graphene Scaffold as Visible-Light-Driven Photocatalyst for Selective Organic Transformation under Ambient Conditions. J. Phys. Chem. C 2011, 115, 23501–23511. [Google Scholar] [CrossRef]
  27. Zhang, Y.; Zhang, N.; Tang, Z.-R.; Xu, Y.-J. Graphene Transforms Wide Band Gap ZnS to a Visible Light Photocatalyst. The New Role of Graphene as a Macromolecular Photosensitizer. ACS Nano 2012, 6, 9777–9789. [Google Scholar] [CrossRef] [PubMed]
  28. Zhang, Y.; Tang, Z.-R.; Fu, X.; Xu, Y.-J. TiO2−Graphene Nanocomposites for Gas-Phase Photocatalytic Degradation of Volatile Aromatic Pollutant: Is TiO2−Graphene Truly Different from Other TiO2−Carbon Composite Materials? ACS Nano 2010, 4, 7303–7314. [Google Scholar] [CrossRef] [PubMed]
  29. Zhang, Y.; Zhang, N.; Tang, Z.-R.; Xu, Y.-J. Improving the photocatalytic performance of graphene–TiO2 nanocomposites via a combined strategy of decreasing defects of graphene and increasing interfacial contact. Phys. Chem. Chem. Phys. 2012, 14, 9167–9175. [Google Scholar] [CrossRef]
  30. Zhang, N.; Zhang, Y.; Pan, X.; Yang, M.-Q.; Xu, Y.-J. Constructing Ternary CdS–Graphene–TiO2 Hybrids on the Flatland of Graphene Oxide with Enhanced Visible-Light Photoactivity for Selective Transformation. J. Phys. Chem. C 2012, 116, 18023–18031. [Google Scholar] [CrossRef]
  31. Tang, Y.-B.; Lee, C.-S.; Xu, J.; Liu, Z.-T.; Chen, Z.; He, Z.; Cao, Y.-L.; Yuan, G.; Song, H.; Chen, L.; et al. Incorporation of Graphenes in Nanostructured TiO2 Films via Molecular Grafting for Dye-Sensitized Solar Cell Application. ACS Nano 2010, 4, 3482–3488. [Google Scholar] [CrossRef] [PubMed]
  32. Yang, N.; Zhai, J.; Wang, D.; Chen, Y.; Jiang, L. Two-Dimensional Graphene Bridges Enhanced Photoinduced Charge Transport in Dye-Sensitized Solar Cells. ACS Nano 2010, 4, 887–894. [Google Scholar] [CrossRef]
  33. Manga, K.K.; Zhou, Y.; Yan, Y.; Loh, K.P. Multilayer Hybrid Films Consisting of Alternating Graphene and Titania Nanosheets with Ultrafast Electron Transfer and Photoconversion Properties. Adv. Funct. Mater. 2009, 19, 3638–3643. [Google Scholar] [CrossRef]
  34. Zhang, H.; Lv, X.; Li, Y.; Wang, Y.; Li, J. P25-Graphene Composite as a High Performance Photocatalyst. ACS Nano 2010, 4, 380–386. [Google Scholar] [CrossRef] [PubMed]
Figure 1. Schematic diagram of DSSCs with FLG/MO nanocomposites as a photoanode.
Sustainability 13 07685 g001
Figure 2. The synthesis process of FLG/MO nanocomposites (MOs; CeO2, CuO, SnO2, CdO, ZnO, and TiO2).
Sustainability 13 07685 g002
Figure 3. DSSCs devices fabrication process; (a) FTO-coated substrate, (b) ultrasonication (c) blocking layer deposited by spin coating technique, (d) annealing process, (e) doctor blade method, (f) again annealing process, (g) TiCl4 treatment, (h) again annealing process, (i) dye immersion (j) After dye absorption (k) platinum sputtered FTO substrate, (l) assembled as a sandwich type cell, (m) DSSCs device of FLG/MO nanocomposites.
Sustainability 13 07685 g003
Figure 4. X-ray diffraction pattern of MOs (MOs; CeO2, CuO, SnO2, CdO, ZnO and TiO2) and FLG/MO (FLG/CeO2, FLG/CuO, FLG/SnO2, FLG/CdO, FLG/ZnO, and FLG/TiO2) nanocomposites.
Sustainability 13 07685 g004
Figure 5. FE-SEM images of MOs and FLG/MO nanocomposites; (a) CeO2 NPs, (b) FLG/CeO2, (c) CuO NPs, (d) FLG/CuO, (e) SnO2 NPs, (f) FLG/SnO2, (g) CdO NPs, (h) FLG/CdO, (i) ZnO NPs, (j) FLG/ZnO, (k) TiO2 NPs (l) FLG/TiO2.
Sustainability 13 07685 g005
Figure 6. HR-TEM images of MOs and FLG/MO nanocomposites; (a) CeO2 NPs, (b) Particle size distribution of CeO2 NPs (c) FLG/CeO2 (d) SAED pattern of FLG/CeO2, (e) CuO NPs, (f) Particle size distribution of CuO NPs, (g) FLG/CuO (h) SAED pattern of FLG/CuO, (i) SnO2 NPs, (j) Particle size distribution of SnO2 NPs, (k) FLG/SnO2 (l) SAED pattern of FLG/SnO2, (m) CdO NPs, (n) Particle size distribution of CdO NPs, (o) FLG/CdO n (p) SAED pattern of FLG/CdO, (q) ZnO NPs, (r) Particle size distribution of ZnO NPs, (s) FLG/ZnO, (t) SAED pattern of FLG/ZnO, (u) TiO2 NPs (v) Particle size distribution of TiO2 NPs, (w) FLG/TiO2 (x) SAED pattern of FLG/TiO2.
Sustainability 13 07685 g006
Figure 7. UV-DRS optical absorption spectra of (a) CeO2 NPs and FLG/CeO2 (b) CuO NPs and FLG/CuO (c) SnO2 NPs and FLG/SnO2 (d) CdO NPs and FLG/CdO, (e) ZnO NPs and FLG/ZnO, (f) TiO2 NPs and FLG/TiO2 nanocomposites.
Sustainability 13 07685 g007
Figure 8. Optical 3D surface profilometer thickness of (a) CeO2 (b) FLG/CeO2 (c) CuO NPs, (d) FLG/CuO (e) SnO2NPs, (f) FLG/SnO2, (g) CdONPs, (h) FLG/CdO (i) ZnO NPs, (j) FLG/ZnO (k) TiO2NPs, (l) FLG/TiO2 nanocomposite thin films.
Sustainability 13 07685 g008
Figure 9. Optical 3D surface profilometer roughness images (a) CeO2 NPs (b) FLG/CeO2 (c) CuO NPs, (d) FLG/CuO (e) SnO2NPs, (f) FLG/SnO2 (g) CdONPs, (h) FLG/CdO (i) ZnO NPs, (j) FLG/ZnO (k) TiO2NPs, (l) FLG/TiO2 nanocomposite thin films.
Sustainability 13 07685 g009
Figure 10. Energy level band diagram of FLG/MOs nanocomposite photoanodes.
Sustainability 13 07685 g010
Figure 11. J-V curves of MOs and FLG/MO nanocomposite photoanodes based DSSC.
Sustainability 13 07685 g011
Table 1. Average crystalline size of MOs and FLG/MO (MOs; CeO2, CuO, SnO2, CdO, ZnO, and TiO2) nanocomposites.
MOs and FLG/MO
Nanocomposites
Average Crystalline Size (nm)Crystal
Structure
JCPDF
Data Base
1.CeO2
FLG/CeO2
25
23
cubic34-0394
2.CuO
FLG/CuO
21
20
monoclinic05-0661
3.SnO2
FLG/SnO2
26
24
tetragonal41-1445
4.CdO
FLG/CdO
20
18
anatase05-0640
5.ZnO
FLG/ZnO
22
20
hexagonal36-1451
6.TiO2
FLG/TiO2
18
16
anatase21-1272
Table 2. ID/IG ratio of FLG/MO (MOs; CeO2, CuO, SnO2, CdO, ZnO and TiO2) nanocomposites.
S. NoMOs and FLG/MO NanocompositesID/IG Ratio
1.
2.
FLG/CeO2
FLG/CuO
0.88
0.86
3.
4.
FLG/SnO2
FLG/CdO
0.85
0.84
5.
6.
FLG/ZnO
FLG/TiO2
0.83
0.81
Table 3. Wave length and energy band gaps of MOs and FLG/MO nanocomposites.
S. NoMOs and FLG/MO
Nanocomposites
Wave Length (λmax)
(nm)
Energy Bandgap (Eg)
(eV)
1.CeO2
FLG/CeO2
364
366
3.10
2.98
2.CuO
FLG/CuO
686
689
1.80
1.79
3.SnO2
FLG/SnO2
294
296
4.23
4.20
4.CdO
FLG/CdO
454
457
2.73
2.71
5.ZnO
FLG/ZnO
364
368
3.00
2.91
6.TiO2
FLG/TiO2
364
398
3.16
2.76
Table 4. Fabricated photoanode film thickness and roughness values of MOs and FLG/MO nanocomposites.
S. NoMOs and FLG/MO Nanocomposite
Photoanode Films
Thickness
(µm)
Roughness
(µm)
1.CeO2
FLG/CeO2
21.8
20.2
1.4
1.3
2.CuO
FLG/CuO
52.2
46.0
13.3
7.0
3.SnO2
FLG/SnO2
20.3
12.9
1.3
0.8
4.CdO
FLG/CdO
42.2
32.4
2.9
1.8
5.ZnO
FLG/ZnO
17.9
14.3
1.2
0.8
6.TiO2
FLG/TiO2
15.0
12.0
1.9
1.8
Table 5. J–V characteristic parameters of MOs and FLG/MO nanocomposite photoanodes.
S. NoMOs and FLG/MO
Nanocomposite Photoanodes
Voc (V)JSC (mA/cm2)FF (%)PCE (%)
1.CeO2
FLG/CeO2
0.50
0.52
6.90
8.60
49.5
45.4
1.74
2.15
2.CuO
FLG/CuO
0.71
0.72
3.63
4.62
67.1
78.2
1.76
2.65
3.SnO2
FLG/SnO2
0.61
0.53
6.62
12.20
46.6
45.5
1.90
3.01
4.CdO
FLG/CdO
0.72
0.74
4.86
6.48
72.2
68.0
2.64
3.53
5.ZnO
FLG/ZnO
0.74
0.73
6.77
8.52
69.4
70.3
3.50
4.44
6.TiO2
FLG/TiO2
0.76
0.75
9.36
13.5
70.2
64.0
5.10
6.60
Publisher’s Note: MDPI stays neutral with regard to jurisdictional claims in published maps and institutional affiliations.

