
Choice Modelling of a Car Traveler towards Park-and-Ride Services in Putrajaya to Create Green Development

 ,
,  , ,
, , 
Abstract
:1. Introduction
2. Study Area
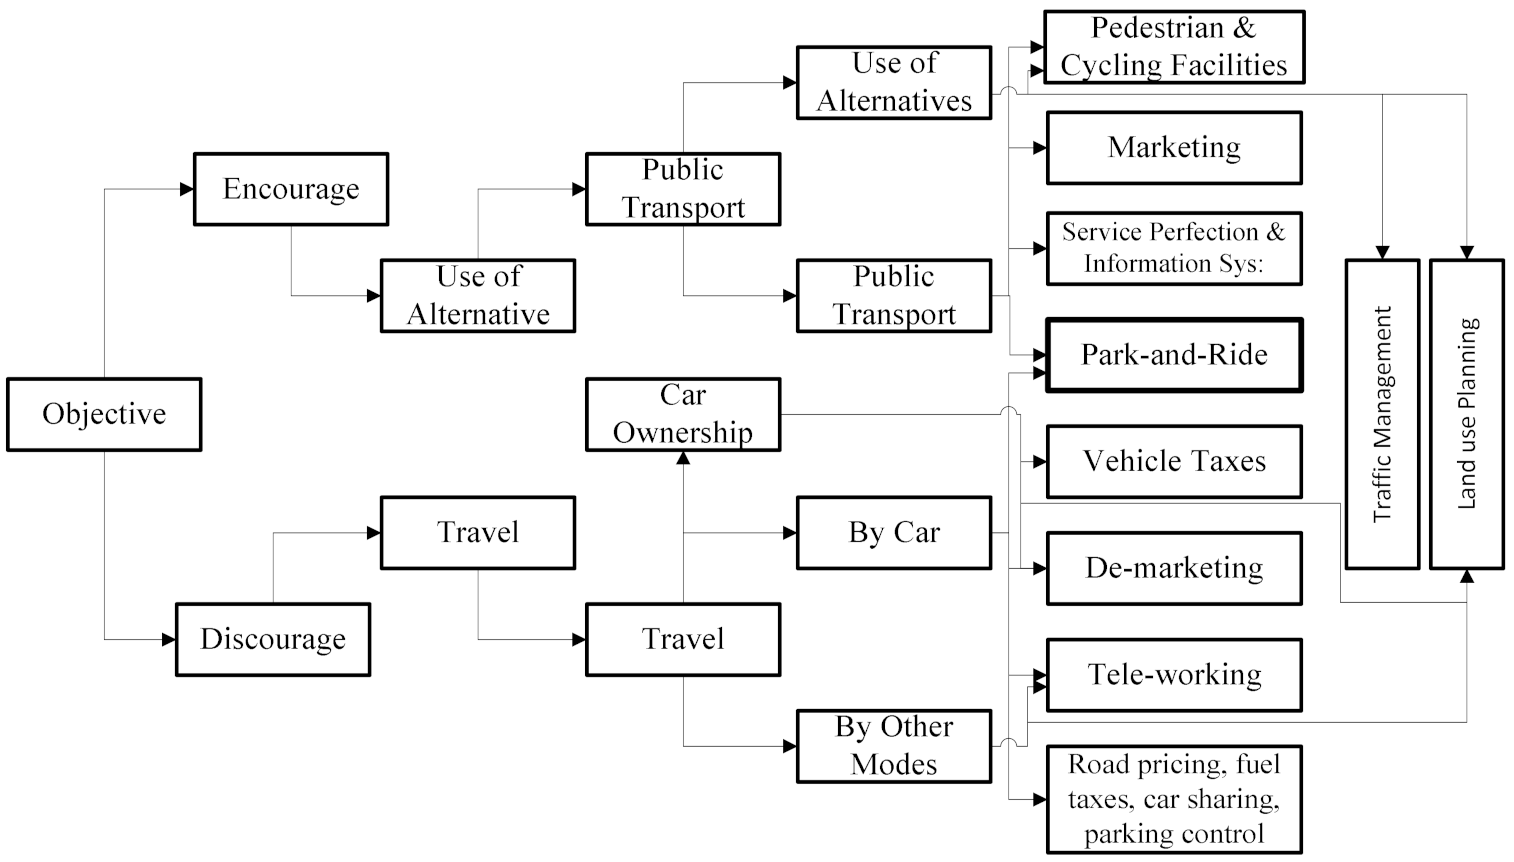
3. Park and Ride Service
4. Influencing Factors Mode Choice
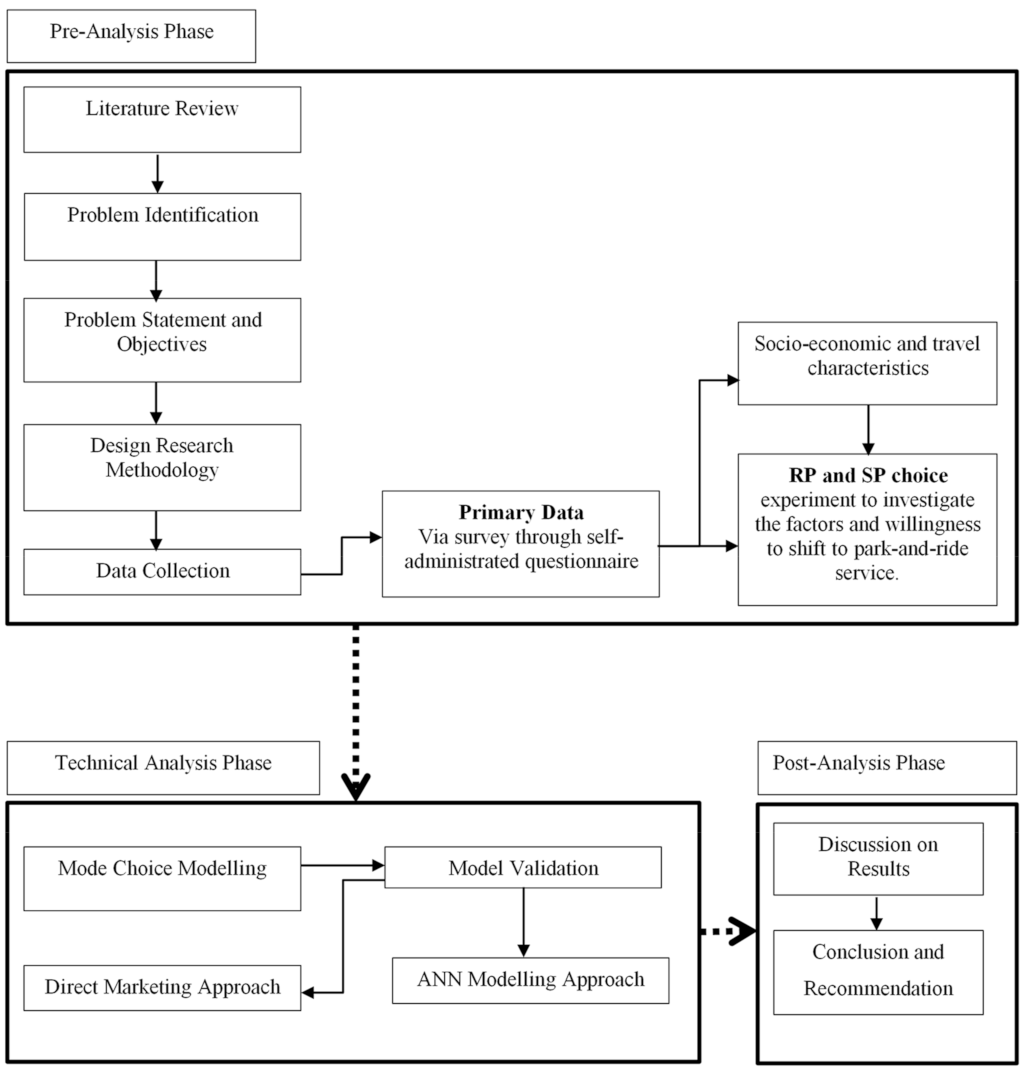
5. Research Methods
Study Variables
6. Results and Discussion
- χ2 (chi-square test statistic): used with the df to compute the p-value of the overall model.
- df (degrees of freedom for the chi-square): refers to the number of values used to calculate a statistic; used with χ2 to compute the p-value.
- p (probability value): gives the probability of obtaining the observed results if the null hypothesis (no relationship between the independent variable(s) and dependent variable) is right.
- β (unstandardized beta): the slope of the predictor with the log-odds of the dependent variable.
- SE (standard error): how much the B is expected to vary.
- OR (odds ratio): gives the factor increase in the likelihood of the dependent variable occurring for every one-unit increase in the predictor; sometimes labelled in statistical output as Exponential (β).
- Dummy-code: performed to add a nominal or ordinal predictor variable into the regression model; turns the one variable into a series of dichotomous “yes/no variables. One for each category; one of the categories is left out of the regression as the reference group to which all other groups are compared.
- Nagelkerke R2: measures the goodness-of-fit of the model. It tends to be more conservative than R2 values utilised in linear regression models. McFadden R2 values of 0.2 or greater indicate an excellent model fit.
- Hosmer and Lemeshow Test: do not need results to be statistically significant, such as 0.05 or below that shows that model is a poor fit. If the value of the result is more than 0.05, it will reflect that model is a good fit.
6.1. Model 1
6.2. Model 2
6.3. Model 3
6.4. Model 4
6.5. Model 5
6.6. Model 6
6.7. Model 7
6.8. Model 8
6.9. Validation of Models
6.10. Training and Testing Approach for Final Model of Putrajaya
7. Conclusions
Author Contributions
Funding
Institutional Review Board Statement
Informed Consent Statement
Data Availability Statement
Conflicts of Interest
References
- Memon, I.A. Mode Choice Modelling to Shift Car Travelers towards Park and Ride Service in the CBD of Putrajaya and Karachi. Ph.D. Thesis, Department of Civil and Environmental Engineering, Universiti Teknologi PETRONAS, 2018. Available online: http://utpedia.utp.edu.my/id/eprint/18372 (accessed on 10 December 2020).
- Peñalosa, E. Why buses represent democracy in action. In TEDCity2.0 Dream Me. Build Me. Make Me Real; Times Center: Manhattan, NY, USA, 2013; 20 September 2013; Available online: https://www.ted.com/talks/enrique_penalosa_why_buses_represent_democracy_in_action?language=en#t-9156 (accessed on 12 December 2020).
- InterestingEngineering. Can Traffic James Truly Be Avoided. Engineers Are Working Hard to Reduce Traffic Jams, But What Causes It in the First Place? Instagram, Ed.; Loukia Papadopoulos: Toronto, ON, Canada, 2021. [Google Scholar]
- Steg, L. Car use: Lust and must. Instrumental, symbolic and affective motives for car use. Transp. Res. Part A Policy Pract. 2005, 39, 147–162. [Google Scholar] [CrossRef]
- Memon, I.A.; Napiah, M.; Talpur, M.A.H.; Hakro, M.R. Mode choice modelling method to shift car travelers towards Park and Ride service. ARPN J. Eng. Appl. Sci. 2016, 11, 3677–3683. [Google Scholar]
- Hiscock, R.; Macintyre, S.; Kearns, A.; Ellaway, A. Means of transport and ontological security: Do cars provide psycho-social benefits to their users? Transp. Res. Part D Transp. Environ. 2002, 7, 119–135. [Google Scholar] [CrossRef]
- Handy, S.; Weston, L.; Mokhtarian, P.L. Driving by choice or necessity? Transp. Res. Part A Policy Pract. 2005, 39, 183–203. [Google Scholar] [CrossRef] [Green Version]
- Gärling, T.; Schuitema, G. Travel Demand Management Targeting Reduced Private Car Use: Effectiveness, Public Acceptability and Political Feasibility. J. Soc. Issues 2007, 63, 139–153. [Google Scholar] [CrossRef]
- Memon, I.; Kalwar, S.; Sahito, N.; Talpur, M.; Chandio, I.; Napiah, M.; Tayyeb, H. Mode Choice Modeling to Shift Car Travelers towards Park and Ride Service in the City Centre of Karachi. Sustainability 2021, 13, 5638. [Google Scholar] [CrossRef]
- Ahmed, Q.I.; Lu, H.; Ye, S. Urban transportation and equity: A case study of Beijing and Karachi. Transp. Res. Part A Policy Pract. 2008, 42, 125–139. [Google Scholar] [CrossRef]
- Lawati, A. Why Expanding Roads Will Not Ease Traffic in Karachi. The Express Tribune. Available online: https://tribune.com.pk/story/1351571/expanding-roads-will-not-ease-traffic-karachi/ (accessed on 3 October 2017).
- Knowles, R.D. What future for light rail in the UK after Ten Year Transport Plan targets are scrapped? Transp. Policy 2007, 14, 81–93. [Google Scholar] [CrossRef]
- Victoria Transport Policy Institute. Park & Ride Convenient Parking for Transit Users; Online TDM Encyclopedia; Victoria Transport Policy Institute: Victoria, BC, Canada, 2014. [Google Scholar]
- Turnbull, K.F.; NCHRP. Synthesis of Highway practice 213. In Effective Use of Park-and-Ride Facilities; National Academy Press: Washington, DC, USA, 1995. [Google Scholar]
- De Jong, M.; Geerlings, H. Roadmap for Infrastructure Appraisal; DUP Science: Delft, The Netherlands, 2004. [Google Scholar]
- Hamid, N.A.; Mohamad, J.; Karim, M.R. Travel behaviour of the park and ride users and the factors influencing the demand for the use of the park and ride facility. In Proceedings of the EASTS International Symposium on Sustainable Transportation Incorporating Malaysian Universities Transport Research Forum Conference 2008 (MUTRFC08), UTM, Skudai, Johor, Malaysia, 12–13 August 2008. [Google Scholar]
- Abdullah, A.Z. Predicting the impact of demand-and supply-side measures on bus ridership in Putrajaya, Malaysia. J. Public Transp. 2006, 9, 4. [Google Scholar]
- Putrajaya, P.; World’s First Intelligent Garden City. Perbadanan Putrajaya. Available online: http://www.putrajaya.gov.my/m_tourist/green_city/ (accessed on 22 October 2013).
- Borhan, M.N.; Rahmat, R.A.A.; Ismail, R.; Ismail, A. Prediction of travel behavior in Putrajaya, Malaysia. Res. J. Appl. Sci. Eng. Technol. 2011, 3, 434–439. [Google Scholar]
- Transportation Research Board; Morpace International. A Handbook for Measuring Customer Satisfaction and Service Quality; Transportation Research Board: Washington, DC, USA, 1999; Volume 47, p. 030906323X. [Google Scholar]
- Norhisham, S.; Sidek, L.M.; Beddu, S.; Usman, F.; Basri, H.; Katman, H. Awareness and Level of Usage for Park and Ride Facilities in Putrajaya, Malaysia. In Proceedings of the EngCon 2012, Engineering Conference, Kuching, Malaysia, 10–12 July 2012. [Google Scholar]
- Nor, N.G.M.; Nor, A.R.M. Predicting the impact of demand and supply side measures on bus ridership in Putrajaya, Malaysia. J. Public Transp. 2006, 9, 5. [Google Scholar]
- Hamsa, A.A.K. Users’perceptions on parking utilization pattern at park-and-ride facility in putrajaya sentral. J. Archit. Plan. Constr. Manag. 2010, 1, 1. [Google Scholar]
- Borhan, M.N.; Syamsunur, D.; Akhir, N.M.; Yazid, M.R.M.; Ismail, A.; Rahmat, R.A. Predicting the use of public transportation: A case study from Putrajaya, Malaysia. Sci. World J. 2014, 2014, 784145. [Google Scholar] [CrossRef] [PubMed] [Green Version]
- Adnan, S.S.; Hamsa, A.A.K. Evaluating the parking demand at park and ride facility at Putrajaya public transportation terminal. In Proceedings of the 2013 International Conference of Eastern Asia Society for Transportation Studies (EASTS), Taipei, Taiwan, 9–12 September 2013. Eastern Asia Society for Transportation Studies. [Google Scholar]
- Memon, I.A.; Napiah, M.; Hussain, M.A.; Hakro, M.R. Influence of factors to shift private transport users to Park-and-Ride service in Putrajaya. In Engineering Challenges for Sustainable Future, Proceedings of the 3rd International Conference on Civil, Offshore and Environmental Engineering, ICCOEE 2016, Kuala Lumpur, Malaysia, 15–17 August 2016, 1st ed.; Wan Abdullah Zawawi, N.A., Ed.; CRC Press: London, UK, 2016; p. 566. [Google Scholar]
- Ahmed, M.I.; Saima, K.; Noman, S.; Madzlan, B.N. Factors that influence travelers’ willingness to use or not park-and-ride service in putrajaya and karachi Cbd. PalArch’s J. Archaeol. Egypt/Egyptol. 2021, 18, 720–734. [Google Scholar]
- Lam, W.H.K.; Holyoak, N.M.; Lo, H.P. How Park-and-Ride Schemes Can Be Successful in Eastern Asia. J. Urban Plan. Dev. 2001, 127, 63–78. [Google Scholar] [CrossRef]
- Adnan, S.; Alyia, S.A.; Hamsa, K.; Azeez, A. Users’ perceptions on parking utilization pattern at park-and-ride facility in Putrajaya Sentral. J. Archit. Plan. Constr. Manag. 2011, 1, 147–165. [Google Scholar]
- Borhan, M.N.; Ismail, A.; Rahmat, R.A.O.; Ambak, K. Effect of transport policies to shifting private car users to park-and-ride in Putrajaya, Malaysia. Aust. J. Basic Appl. Sci. 2011, 5, 303–308. [Google Scholar]
- KonSULT. KonSULT | Policy Guidebook. University of Leeds. Available online: http://www.konsult.leeds.ac.uk/pg/35/ (accessed on 20 February 2017).
- Memon, I.A. Factors Influencing Travel Behaviour and Mode Choice among Universiti Teknologi Malaysia Employees. Master’s Thesis, Department of Urban and Regional Planning, Faculty of Built Environment, Universiti Teknologi Malaysia, Johor Bahru, Malaysia, 2010. [Google Scholar]
- Turnbull, K.; Evans, J.; Levinson, H. Park-and-Ride/Pool: Traveller Response to Transport System Changes; Transit Cooperative Research Program Report; The National Academies Press: Waashington, DC, USA, 2004; Volume 95. [Google Scholar]
- Morrall, J.; Bolger, D. Park-and-Ride: Canada’s Most Effective TDM Strategy. In Proceedings of the Cost Effectiveness through Innovation, 1996 TAC Annual Conference, Charlottetown, PE, Canada, 6–9 October 1997. [Google Scholar]
- Parkhurst, G. Influence of bus-based park and ride facilities on users’ car traffic. Transp. Policy 2000, 7, 159–172. [Google Scholar] [CrossRef]
- Memon, I.A.; Madzlan, N.; Talpur, M.A.H.; Hakro, M.R.; Chandio, I.A. A Review on the Factors Influencing the Park-and-Ride Traffic Management Method. Appl. Mech. Mater. 2014, 567, 663–668. [Google Scholar] [CrossRef]
- Wright, C.; Egan, J. De-marketing the car. Transp. Policy 2000, 7, 287–294. [Google Scholar] [CrossRef]
- Duncan, M.; Christensen, R.K. An analysis of park-and-ride provision at light rail stations across the US. Transp. Policy 2013, 25, 148–157. [Google Scholar] [CrossRef]
- Olsson, A.-L.L. Factors That Influence Choice of Travel Mode in Major Urban Areas. Ph.D. Thesis, Department of Infrastructure, Royal Institute of Technology, Stockholm, Sweden, 2003. Available online: https://www.diva-portal.org/smash/get/diva2:7556/FULLTEXT01.pdf (accessed on 18 April 2016).
- Shaharyar, B.; Ahmed, M.I.; Saima, K.; Noman, S. Predicting the use of public transportation service: The case study of karachi circular railway. PalArch’s J. Archaeol. Egypt/Egyptol. 2021, 18, 4736–4748. [Google Scholar]
- Brohi, S.; Kalwar, S.; Memon, I.A.; Ghaffar, A. Using the Theory of Planned Behavior to Identify the Behavioral Intention to use Public Transportation Service: The Case Study of Karachi Circular Railway. Int. J. Emerg. Technol. 2021, 12, 6. [Google Scholar]
- Papagiannakis, A.; Baraklianos, I.; Spyridonidou, A. Urban travel behaviour and household income in times of economic crisis: Challenges and perspectives for sustainable mobility. Transp. Policy 2018, 65, 51–60. [Google Scholar] [CrossRef]
- Kaffashi, S.; Shamsudin, M.N.; Clark, M.S.; Sidique, S.F.; Bazrbachi, A.; Radam, A.; Adam, S.U.; Rahim, K.A. Are Malaysians eager to use their cars less? Forecasting mode choice behaviors under new policies. Land Use Policy 2016, 56, 274–290. [Google Scholar] [CrossRef]
- Memon, I.A.; Kalwar, S.; Sahito, N.; Qureshi, S.; Memon, N. Average Index Modelling of Campus Safety and Walkability: The Case Study of University of Sindh. Sukkur IBA J. Comput. Math. Sci. 2020, 4, 37–44. [Google Scholar] [CrossRef]
- Ajzen, I. The theory of planned behavior. Organ. Behav. Hum. Decis. Process. 1991, 50, 179–211. [Google Scholar] [CrossRef]
- Fujii, S.; Kitamura, R. What does a one-month free bus ticket do to habitual drivers? An experimental analysis of habit and attitude change. Transportation 2003, 30, 81–95. [Google Scholar] [CrossRef]
- Ajzen, I.; Fishbein, M. Understanding Attitudes and Predicting Social Behaviour; Pearson: New York, NY, USA, 1980. [Google Scholar]
- Ding, C.; Chen, Y.; Duan, J.; Lu, Y.; Cui, J. Exploring the Influence of Attitudes to Walking and Cycling on Commute Mode Choice Using a Hybrid Choice Model. J. Adv. Transp. 2017, 2017, 1–8. [Google Scholar] [CrossRef]
- Kaewkluengklom, R.; Satiennam, W.; Jaensirisak, S.; Satiennam, T. Influence of psychological factors on mode choice behaviour: Case study of BRT in Khon Kaen City, Thailand. Transp. Res. Procedia 2017, 25, 5072–5082. [Google Scholar] [CrossRef]
- Dharmowijoyo, D.B.; Susilo, Y.O.; Karlström, A.; Adiredja, L.S. Collecting a multi-dimensional three-weeks household time-use and activity diary in the Bandung Metropolitan Area, Indonesia. Transp. Res. Part A Policy Pract. 2015, 80, 231–246. [Google Scholar] [CrossRef]
- Jariyasunant, J. Improving Traveler Information and Collecting Behavior Data with Smartphones. Ph.D. Thesis, University of California, Berkeley, CA, USA, 2012. Available online: http://0-search-proquest-com.brum.beds.ac.uk/docview/1081704510?accountid=47520 (accessed on 23 December 2016).
- Louviere, J.J.; Hensher, D.A.; Swait, J.D. Stated Choice Methods: Analysis and Applications; Cambridge University Press: Cambridge, MA, USA, 2000. [Google Scholar]


| S. No. | Research |
|---|---|
| 01. | Title: Predicting the Use of Public Transportation: A Case Study from Putrajaya, Malaysia Summary: To understand commuters’ choice to utilise public transport, a conceptual model has been created to decide the variables that influence them to utilise public transport as opposed to going in their vehicles. Different factors, such as; quality, environmental effect, attitude, and behavioural intentions were examined and tested through the structural equation model (SEM). More research in the future ought to be led to discover the effect of attributes concerning financial hindrances, for example, traffic congestion charges to urge individuals to utilise public transportation in Putrajaya [24]. |
| 02 | Title: Evaluating the Parking Demand at P&R Facility at Putrajaya Public Transportation Terminal Summary: This study analysed two types of parking usability; multi-story and surface parking at Putrajaya public transportation terminal. It is important to analyse the demand for P&R service to know the current usage of P&R facility as well as the travel behaviour of the parking users [25]. |
| 03 | Title: Awareness and level of usage for P&R facilities in Putrajaya, Malaysia Summary: This contextual investigation was to decide the travellers’ attention towards P&R service in Putrajaya, to evaluate the level of utilisation of P&R facilities at Putrajaya, and to recognise the nature of duty for P&R facilities at Putrajaya. Along with the improvement of amenities and bus services, more information about P&R services should be spread [21]. |
| 04 | Title: Users’ Perceptions on Parking Utilization Pattern at P&R Facility in Putrajaya Sentral Summary: This Research founds the users’ discernments on parking utilisation behaviour at Putrajaya Central P&R service. Surface parking services must be affordable for travellers, monthly parking tickets, parking charges, and smart card payment system and promotion must be introduced [29]. |
| 05 | Title: Prediction of Traveling Behaviour in Putrajaya, Malaysia Summary: In this study, the viability of P&R service at Putrajaya region was examined. This examination led to a decrease in the utilisation of private vehicles is to replace SOV users’ trips with different modes of transport. Such as a mix of a private vehicle and public transport called P&R service. Increasing parking charges at the workplace would decrease the usage of private vehicle users [19]. |
| 06 | Title: Effect of Transport Policies to Shifting Private Car Users to P&R in Putrajaya, Malaysia Summary: This research is to inspect the variables which have an impact on SOV users and presenting a few new approaches (dedicated bus lane and high parking price at the workplace) to switch towards P&R service in Putrajaya. The discoveries were examined time, and cost-saving is the relevant variables to impact SOV users to utilise P&R office. The behavioural sciences hypothesis in particular Theory of Planned Behaviour (TPB) will be utilised as a part of comprehension and distinguish the affecting variables to shifting private transport users to adopt P&R service [30]. |
| 07 | Title: Predicting the Impact of Demand-and Supply-Side Measures on Bus Ridership in Putrajaya, Malaysia Summary: This study portrays and discusses the techniques, results, and policy consequences of the research. Econometric estimation demonstrates that improvement in public transportation alone is an inadequate modal choice to accomplish the objective of a 70:30 modal split among public and private transportation [22]. |
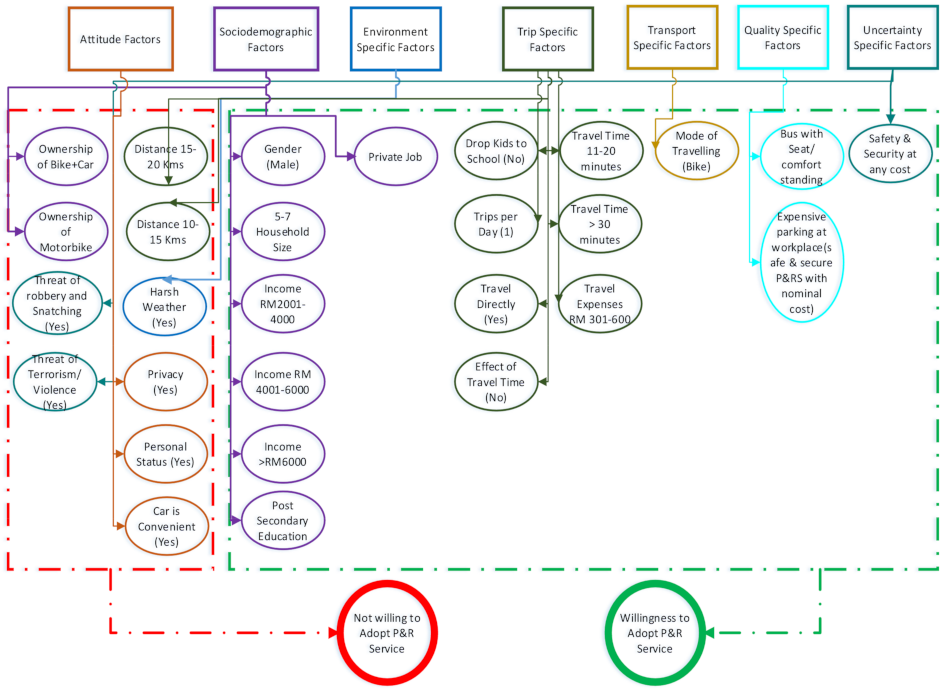
| Socio-Demographic | Environment | Trip | Transport | Quality | Attitude | Uncertainty |
|---|---|---|---|---|---|---|
| Specific Factors with Codes | ||||||
| Gender | Harsh weather (HW) | Travel time per trip (TTPT) | Mode of travelling (MT) | Comfort preference (CP) | Personal status (PS) | Safety and security at P&R (SSP&R) |
| Monthly Income (MI) | Drop kids (DK) | Frequency of Bus (FB) | Expensive parking at workplace (EPW) | Privacy | The threat of terrorism/violence (TTV) | |
| Educational level (EL) | Drop family member (DF) | Improper location of P&R (ILP&R) | Car is convenient (CC) | The threat of robbery/snatching (TRS) | ||
| Household size (HS) | Going shopping (GS) | |||||
| Transport ownership (TO) | Travel directly (TD) | |||||
| Job Nature (JN) | Travel expenses (TE) | |||||
| Workplace Distance (WD) | ||||||
| Effect of travel time (ETT) | ||||||
| Trips per day (TPD) | ||||||
| Socio-Demographic Factors | β | p-Value |
|---|---|---|
| Gender (Male) | 1.751 | 0.001 |
| EL (Post. Sec:) | 0.937 | 0.036 |
| JN (Private) | 0.953 | 0.040 |
| HS (5–7) | 1.942 | 0.029 |
| MI (2001–4000) | 1.789 | 0.013 |
| MI (4001–6000) | 2.777 | 0.005 |
| MI (>6000) | 2.984 | 0.002 |
| TO (M. Bike) | −1.744 | 0.002 |
| TO (Bike + Car) | −1.957 | 0.001 |
| Nagelkerke R2 | 0.456 | |
| Chi-Square | 25.116 | |
| Log-likelihood | 25.116 | |
| df | 08 | |
| Hosmer & Lemeshow | 0.001 |
| Environment Specific Factors | β | p-Value |
|---|---|---|
| HW (Yes) | −3.131 | 0.001 |
| Nagelkerke R2 | 0.677 | |
| Chi-Square | 0.109 | |
| Log-likelihood | 195.52 | |
| df | 03 | |
| Hosmer & Lemeshow | 0.991 |
| Trip Specific Factors | β | p-Value |
|---|---|---|
| DK (Neutral) | 2.994 | 0.005 |
| DK (No) | 4.092 | 0.030 |
| DF (Neutral) | 3.535 | 0.008 |
| ETT (No) | 2.449 | 0.002 |
| TPD (1) | 2.351 | 0.056 |
| TT 11–20 min | 2.729 | 0.006 |
| TT above 30 min | 4.534 | 0.005 |
| TD (Yes) | 1.464 | 0.028 |
| TE RM301–600 | 2.880 | 0.025 |
| WD 10–15 Km | −3.440 | 0.000 |
| WD 15–20 Km | −3.439 | 0.028 |
| Nagelkerke R2 | 0.785 | |
| Chi-Square | 14.504 | |
| Log-likelihood | 142.853 | |
| df | 8 | |
| Hosmer & Lemeshow | 0.070 |
| Transport Specific Factors | β | p-Value |
|---|---|---|
| MT (Bike) | 0.847 | 0.006 |
| FB (15 min) | 1.063 | 0.003 |
| ILP&R (Yes) | −2.591 | 0.000 |
| Nagelkerke R2 | 0.305 | |
| Chi-Square | 11.48 | |
| Log-likelihood | 327.1 | |
| df | 7 | |
| Hosmer & Lemeshow | 0.119 |
| Quality Specific Factors | β | p-Value |
|---|---|---|
| CP (AC bus with seat availability or easy standing) | 1.416 | 0.00 |
| EPW (Safe & secure P&RS with nominal cost) | 1.374 | 0.04 |
| Constant | −2.542 | 0.000 |
| Nagelkerke R2 | 0.603 | |
| Chi-Square | 8.298 | |
| Log-likelihood | 226.5 | |
| df | 7 | |
| Hosmer & Lemeshow | 0.307 |
| Attitude Specific Factors | β | p-Value |
|---|---|---|
| PS (Yes) | −2.6 | 0.000 |
| Privacy (Yes) | −2.1 | 0.000 |
| CC (Yes) | −1.5 | 0.005 |
| Constant | 1.73 | 0.000 |
| Nagelkerke R2 | 0.59 | |
| Chi-Square | 88.851 | |
| Log-likelihood | 229.3 | |
| df | 02 | |
| Hosmer & Lemeshow | 0.00 |
| Safety and Security Specific Factors | β | p-Value |
|---|---|---|
| SSP&R (Yes, I would prefer it at any cost) | 1.465 | 0.020 |
| TRS (Yes) | −2.091 | 0.003 |
| TTV (Yes) | −1.892 | 0.002 |
| Nagelkerke R2 | 0.409 | |
| Chi-Square | 32.73 | |
| Log-likelihood | 295.6 | |
| df | 6 | |
| Hosmer & Lemeshow | 0.00 |
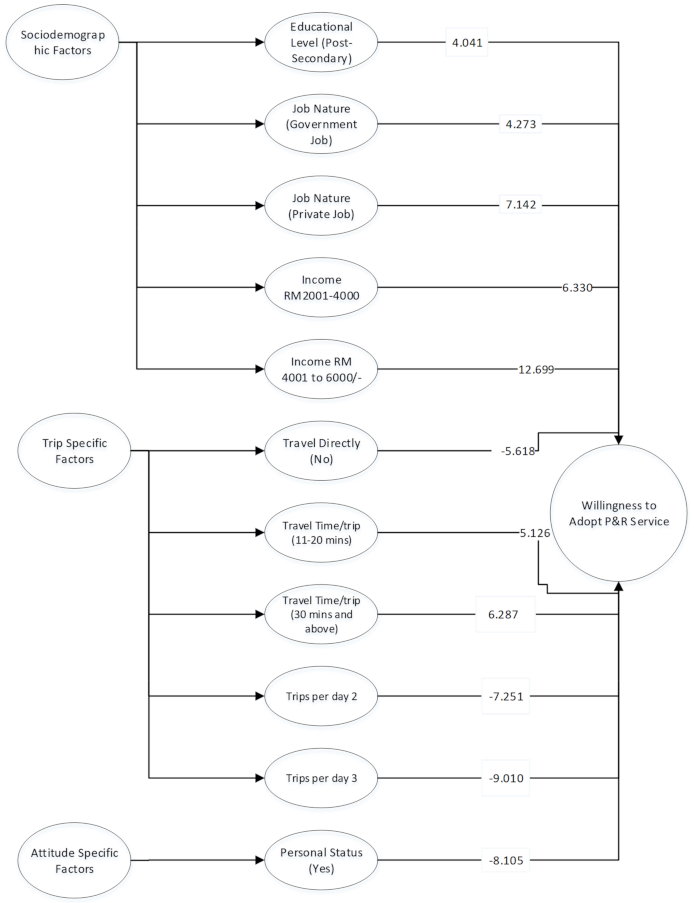
| Final Model’s Variables | β | p-Value |
|---|---|---|
| EL (Post-Secondary) | 4.04 | 0.018 |
| JN (Government Job) | 4.27 | 0.009 |
| JN (Private Job) | 7.14 | 0.001 |
| MI (2001–4000) | 6.33 | 0.027 |
| MI (4001–6000) | 12.6 | 0.001 |
| TPD (2) | −7.25 | 0.000 |
| TPD (3) | −9.01 | 0.001 |
| TTPT (11–20 min) | 5.12 | 0.003 |
| TTPT (30 min & Above) | 6.28 | 0.000 |
| TD (No) | −5.61 | 0.000 |
| PS (Yes) | −8.10 | 0.002 |
| Constant | 1.14 | 0.771 |
| Nagelkerke R2 | 0.875 | |
| Chi-Square | 6.597 | |
| Log-likelihood | 91.39 | |
| Df | 8 | |
| Hosmer & Lemeshow | 0.581 |
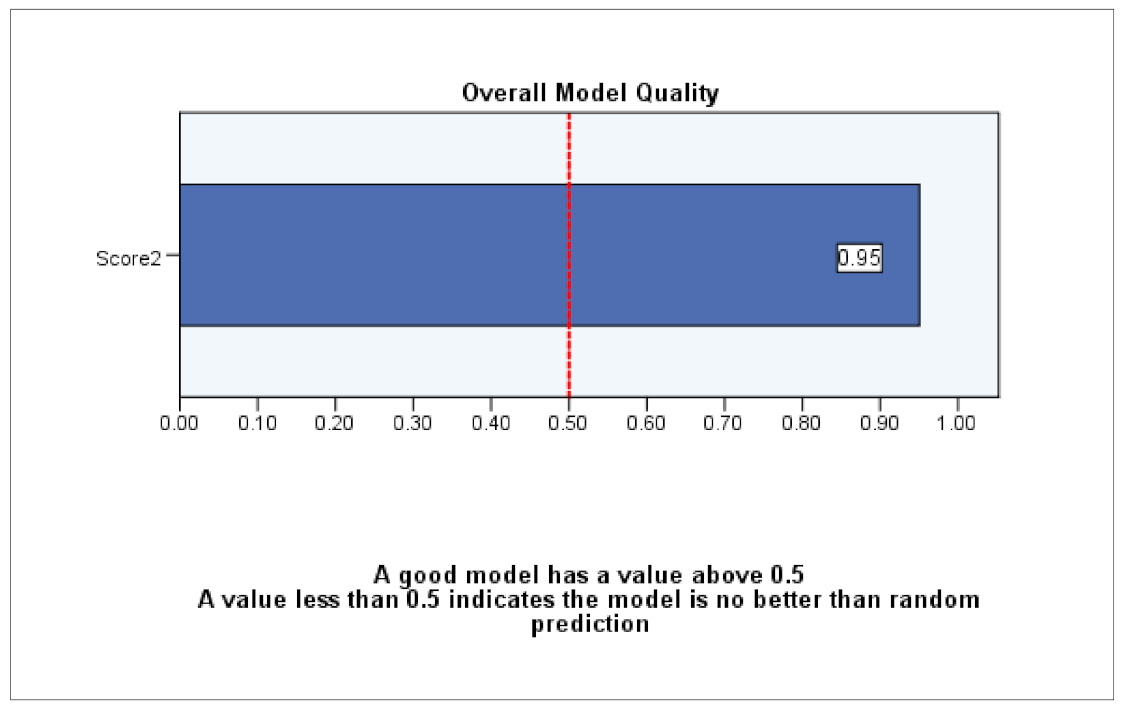
| Observed | Predicted | ||||||
|---|---|---|---|---|---|---|---|
| Training Sample | Testing Sample | ||||||
| Response Recorded (1 = Yes, 0 = No) | Percentage Correct | Response Recorded (1 = Yes, 0 = No) | Percentage Correct | ||||
| No | Yes | No | Yes | ||||
| Response recorded (1 = Yes, 0 = No) | No | 53 | 0 | 100.00 | 63 | 4 | 94.03 |
| Yes | 0 | 80 | 100.00 | 11 | 86 | 89.00 | |
| Overall Percentage | 0.00 | 100.00 | 100.00 | 14.86 | 95.70 | 91.02 | |
Publisher’s Note: MDPI stays neutral with regard to jurisdictional claims in published maps and institutional affiliations. |
© 2021 by the authors. Licensee MDPI, Basel, Switzerland. This article is an open access article distributed under the terms and conditions of the Creative Commons Attribution (CC BY) license (https://creativecommons.org/licenses/by/4.0/).
Share and Cite
Memon, I.A.; Sahito, N.; Kalwar, S.; Hwang, J.; Napiah, M.; Zaly Shah, M. Choice Modelling of a Car Traveler towards Park-and-Ride Services in Putrajaya to Create Green Development. Sustainability 2021, 13, 7869. https://0-doi-org.brum.beds.ac.uk/10.3390/su13147869
Memon IA, Sahito N, Kalwar S, Hwang J, Napiah M, Zaly Shah M. Choice Modelling of a Car Traveler towards Park-and-Ride Services in Putrajaya to Create Green Development. Sustainability. 2021; 13(14):7869. https://0-doi-org.brum.beds.ac.uk/10.3390/su13147869
Chicago/Turabian StyleMemon, Irfan Ahmed, Noman Sahito, Saima Kalwar, Jinsoo Hwang, Madzlan Napiah, and Muhammad Zaly Shah. 2021. "Choice Modelling of a Car Traveler towards Park-and-Ride Services in Putrajaya to Create Green Development" Sustainability 13, no. 14: 7869. https://0-doi-org.brum.beds.ac.uk/10.3390/su13147869