1. Introduction
Space urbanization and population density on relatively small areas could be considered as basic human tendency. Increased population density in small areas (cities) has been the base for civilization development and advancement throughout history. Modern society is not an exception in that direction of historical development. With the increase in population on the planet, the density of people in small spaces increases.
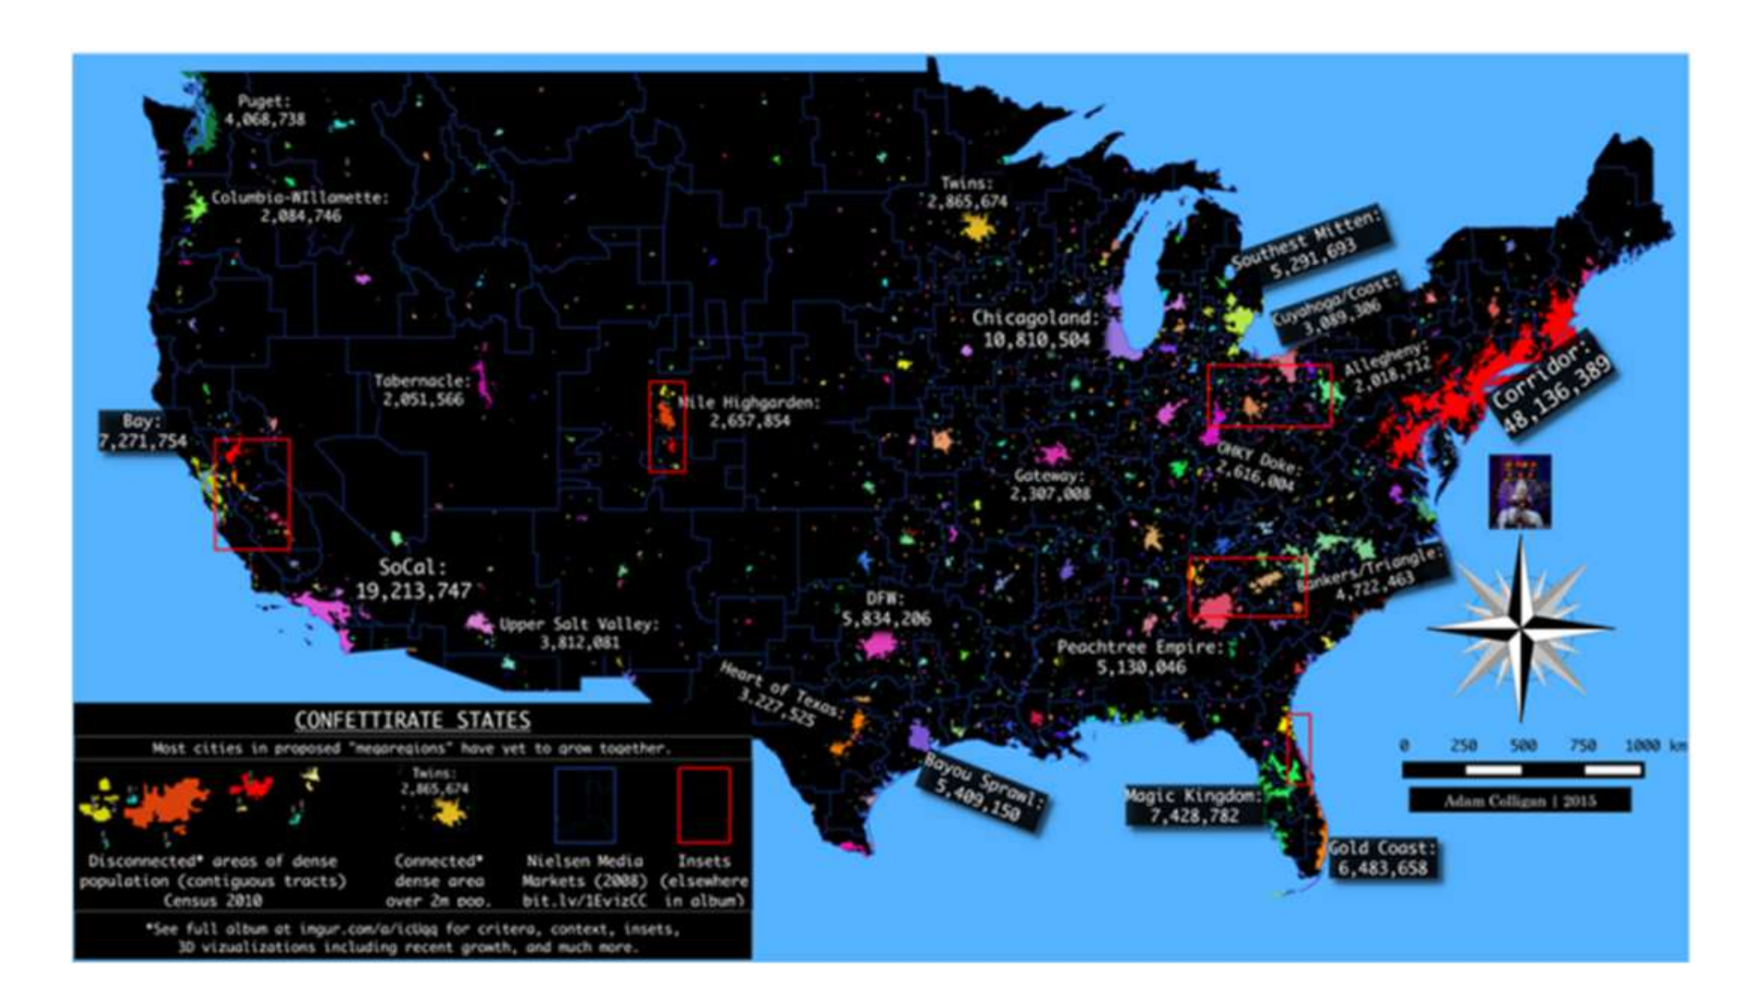
The urbanization achieved was large scale in the middle of the last century when the continuous chains of city areas were observed [
1]. In that time this phenomenon was not unique only to the United States of America but in the whole world. This urban structure, which stretches from the upper north part of Boston to the lower southern part of Washington, had the characteristic of super-metropole. To describe these super urban structures, the expression used was “Megalopolis” which has had different meanings throughout history. In old Greece the expression “Megalopolis” was used to describe “the world of ideas”, and later was introduced to describe the trends in the development of big cities.
Further development of megalopolises led to new research and examination of their characteristics so that they could be understood better. The research of the relations between the forms, size and mutual connections of metropoles led to the revision of the first ideas that the expansion of urban areas does not lead to breaking the liaisons between regions but the creation of new ones [
2]. The analytic synthesis based on geographical theory and the results of empiric research in this paper is described as the “new metropolis” whose key element is the huge size and enabled the apparition of an even bigger trans-metropolitan structure called “megapolitan region”. Megapolitan geography includes the typology which shows variations between regions. The conclusion of these studies is the recommendation that the fragmentary post-modern metropolis can pave the way to a new modern region in which new forms of networks and special connections reintegrate the urban area.
Figure 1 shows urban areas of the USA.
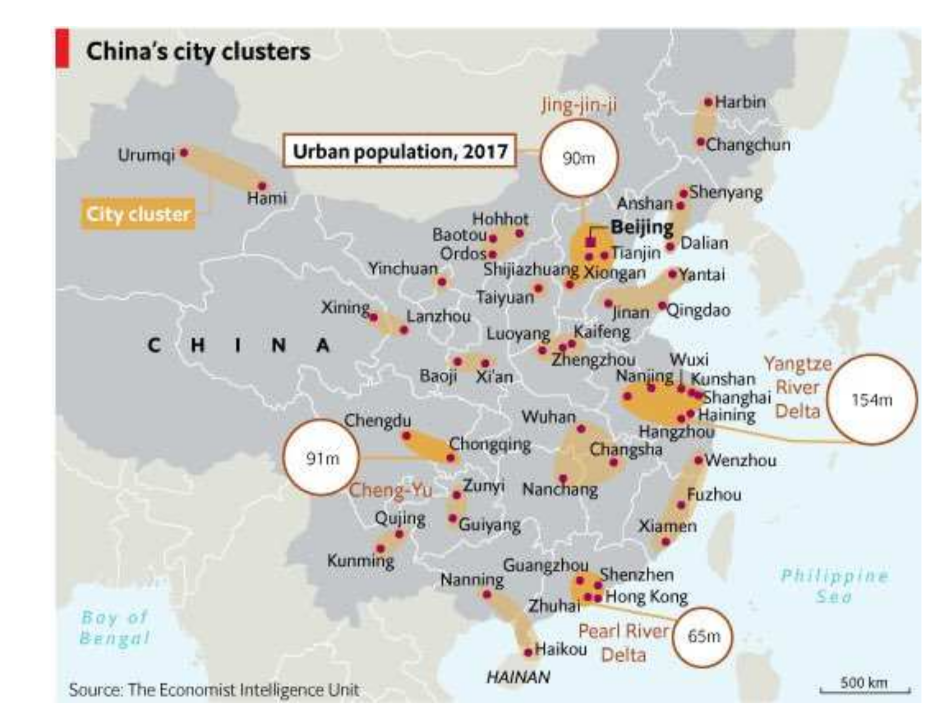
In China, the clusters of cities are developed. The clusters of cities are made of groups of big cities connected to a lot of connected satellite cities and places [
3]. Throughout the last decade of the 20th and first decade of the 21st century, the city clusters had a leading role in the economic growth of the Chinese economy, which was a result of common economic capacity and their interdependence utilization. However, the strong economic growth had as a consequence a drop in environmental quality [
3]. On
Figure 2 the clusters of cities in China are shown.
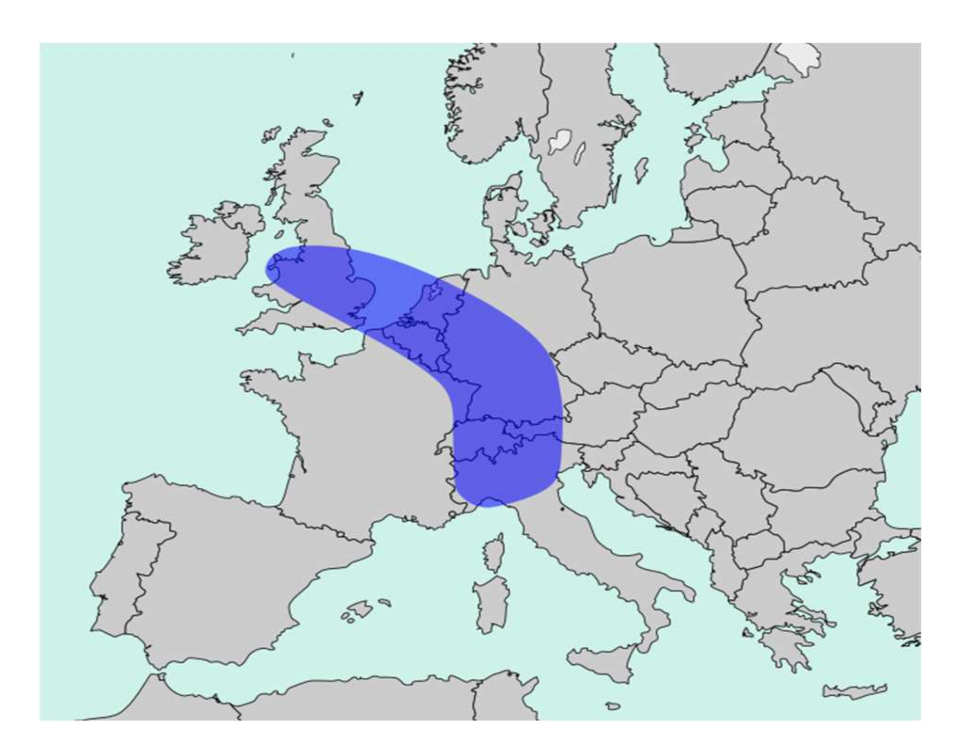
In Europe, the megalopolises are found in the area of “blue banana” which takes up the space from London to Milan and on which the biggest growth and innovation development occurred, while in recent times, “the yellow banana” is also mentioned, which spreads from Paris to Warsaw and is identified as an area of the future European growth in the same time or even after “the blue banana” [
4].
Figure 3 shows the area of “the blue banana” in Europe.
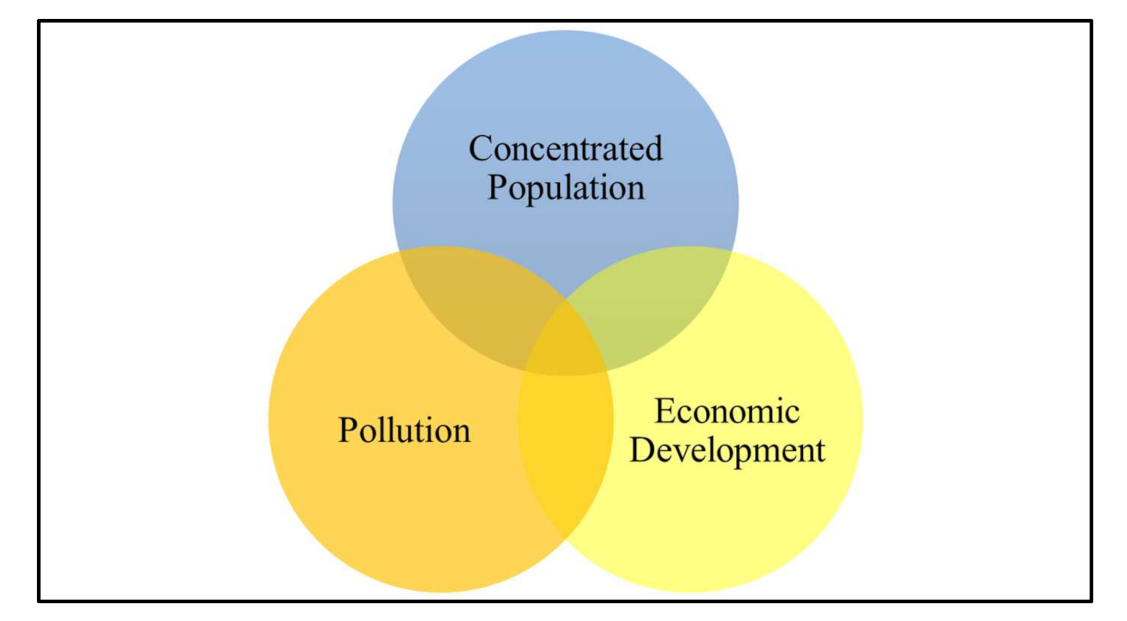
The relation between space urbanization, reduction in environmental quality, and increased pollution in that area is researched and proven in numerous studies and shown in many scientific papers which were used as a reference in this paper. There is also a solid positive correlative connection between economic growth (the generation of worth) and space urbanization. This link is symbolically shown on
Figure 4.
Based on light emissions in the night, from the analysis of satellite photos, in the year 2007 about 40 urban areas, each of which had a minimal economical product of US
$100 billion, were identified. Two of the most prominent megalopolises are Boston-Washington and “blue banana” in Europe [
8].
Figure 5 shows two well-known megalopolises. According to the same source, the number of the citizens is similar (about 37 million) while the productivity of the megalopolis Boston-Washington is significantly higher; it is US
$143,000 in relation to US
$106,000 by employment in the area of the “blue banana”. The disposable income per household in the megalopolis Boston-Washington is double: US
$140,000 in relation to US
$70,000 of “the blue banana” area yearly. The total GDP of the area Boston-Washington is US
$2800 × 10
9 while the “blue banana” area is US
$2100 × 10
9.
The megalopolises offer a big diversification of the economic sector and as such are the source of a multitude of chances for development in different directions. The areas with sector and institutional diversification provide the needed flexibility for the absorption of new tech-economic development and its new combinations [
9] In the Yangtze River Delta, China’s richest region per capita [
10] with a population of 150,000,000 residents the amount of US
$2760 × 10
9 was generated in the year 2016.
The issues with environmental pollution and accompanying diseases are also highly expressed in urban areas. Special attention is given to the air quality because of its existential significance for humanity and high number of polluters. In primary examinations, the simplified atmospheric models are used for describing the modules of air pollution in big urban zones of the megalopolitan corridor Washington-Boston [
11]. In the later phases of these examinations of this problem, different models are also used, including the one for the influence of urban vegetation on the air quality [
12]. Nowadays, there are sensors which register the air quality in real time and across the world. The given results are public and are shown on the internet [
13].
The examination of the connections between urban areas and human health is of great value. It is considered that the modern literature about urban planning also has flaws because it does not take into consideration the layout of health determinants within social groups and between them [
14]. In large urban areas, the risks of cardiovascular and malign diseases are especially developed as a consequence of air pollution. Air pollution is generated from mixing different complex gases, evaporations and matter particles which occur because of human activity (traffic and industry). Epidemic studies show a constant increase in the risk of cardiovascular problems in short- and long-term exposure to particle matter which pollutes the air [
15]. Explicitly underlined are the influences of nitrogen oxides, sulphur dioxide, carbon monoxide and ozone. The increase in the concentration of these gases in the air is proportional to human activity because they can be found in nature in small portions that are not harmful to human health. The intensification of the traffic, especially the internal combustion engines of fossil fuels, increases the risks of cancerous diseases. Studies on Moscow showed that the traffic contributes to risks of cancerous diseases in range from 3 × 10
−4 to 6.53 × 10
−4. Those values are typical for the numerous megalopolises in economically developed countries [
16].
The complexity of urban areas is intricately connected with various risks for people living in them. Risks which occur because of different hazards relate to losses caused by natural forces. Those risks are not permanently present and hazardous events occur quite rarely, require complex analysis and are issue of methods for risk reduction [
17]. Urban heat islands as an attribute of urban areas also affect the people’s health [
18]. It is especially the case when a heat wave is followed by high temperatures lasting for a long time, as it was in Europe in the year 2003 [
19]. The main influence on human health which is permanent in urban system is the air quality. According to a study carried out in 338 Chinese cities in a five-year period [
20], improvement of air quality decreases the health impact.
The process of gentrification in urban areas is also the subject of research and relates to urban greening and health. The results of some research are remarkably interesting and indicative in the sense of urban complexity. In paper [
21] it is stated that urban greening is not a catalyzer of gentrification, but growth in suburbs’ relative income actuates urban greening. According to those statements it seems logical that the growth of incomes causes urban greening but not the opposite, which means that economic motifs come first and after that (after incomes increase) the issue of health becomes important. In paper [
22] another important issue is researched and highlighted, i.e., the measuring of gentrification for population health. It seems that measuring parameters in urban complexes is burdened with uncertainties and should be treated very carefully. Especially when the gentrification and health are related, their causal evidence is limited. Other challenges are described as: there is no consensus on how to measure gentrification using census data, area-level gentrification measure limitations may contribute to weak evidence. The measurement challenges themselves include inconsistency, misclassification, and temporality. However, the efforts of the research studies on gentrification and health can only be improved and there is room for their further development.
The development of urbanization also increases uncertainties and risks, but urban systems are also resilient on a certain level against negative influences. The issue of urban resilience is also a complex issue and it should be treated by utilizing complex theories such as complex adaptive system theory [
23], or, for example, a prediction-adaptation-resilience (PAR) approach [
24]. The complex theories are suitable for a holistic approach in complex urban reality explanation, but they require significant efforts in information acquisition, processing, analyzing and interpretation. Additionally, for proper explication and decision making based on complex analysis, vast logistics are required, including expert knowledge which could be also followed by lowering the efficiency. In this paper, the simplification was made without lowering the accuracy of the conclusion about the economic attractiveness of urban complexes.
Bearing in mind the above facts, we could briefly summarize the results of research as follows:
- -
The people in urban areas are attracted primarily by chances of incomes increase;
- -
There is causality between urban complexes and health impact caused by pollution;
- -
There are challenges in the process of measurement of the relation between urban complexes and health because of a complex process of measuring and data processing.
These conclusions lead to the need of finding a simplified method for measuring the economic attractiveness of the urban complexes which relates economic issues and issues of health. In this paper the authors suggested the utilization of gross domestic products per capita and air quality index as a parameter for determining the economic attractiveness of urban complexes. Those data are available nowadays easily and are determined on the high level of accuracy. It assumed that higher gross domestic product in an urban complex means better infrastructure, a higher level of quality of life and better chances for self-realization for each citizen.
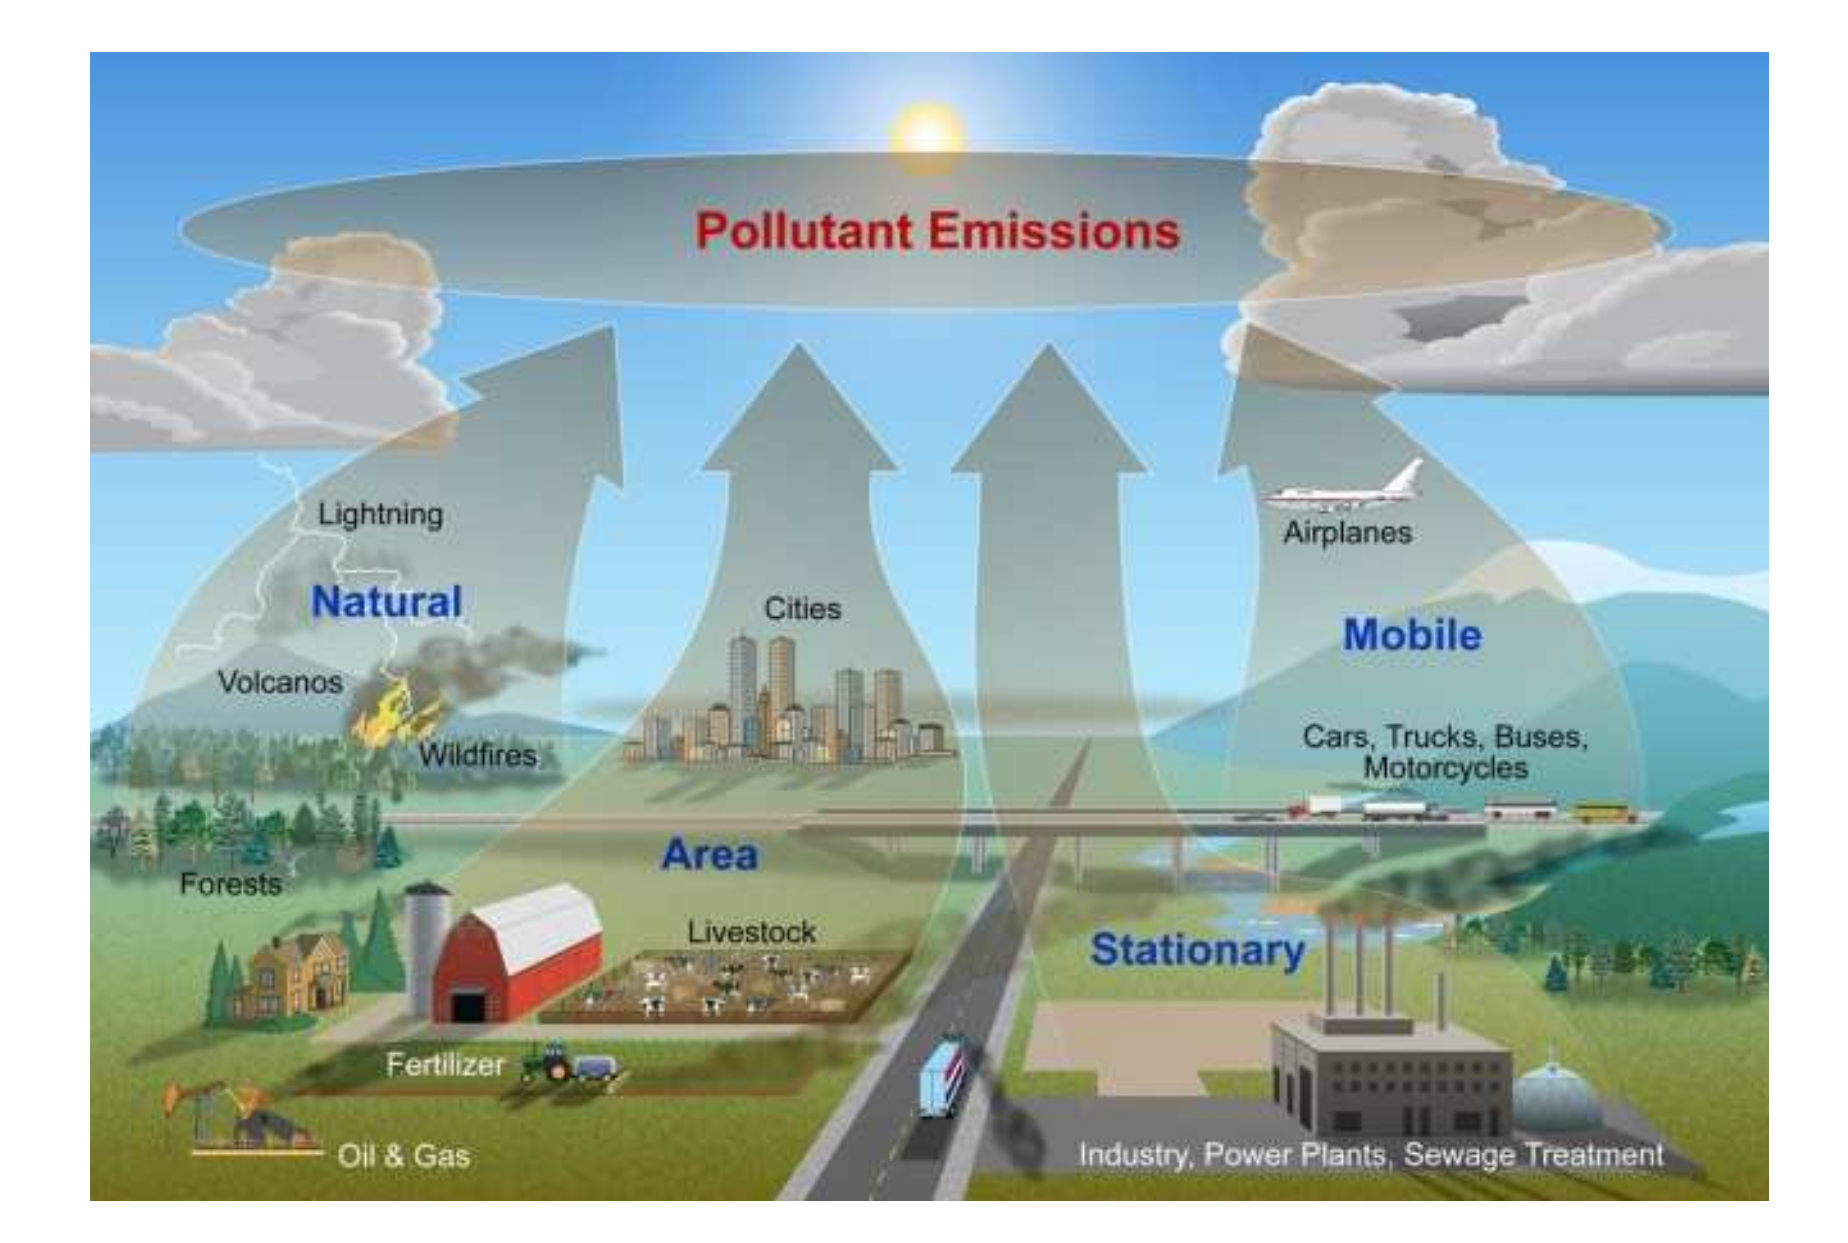
According to [
25] the sources of air pollution are classified in the following main types: mobile, stationary, area and natural.
Figure 6 shows the mine types of air pollution sources.
The awareness of air pollution and its influence on the health of citizens in cities does exist, especially in big cities and it is the subject of regulation [
26] and governmental research [
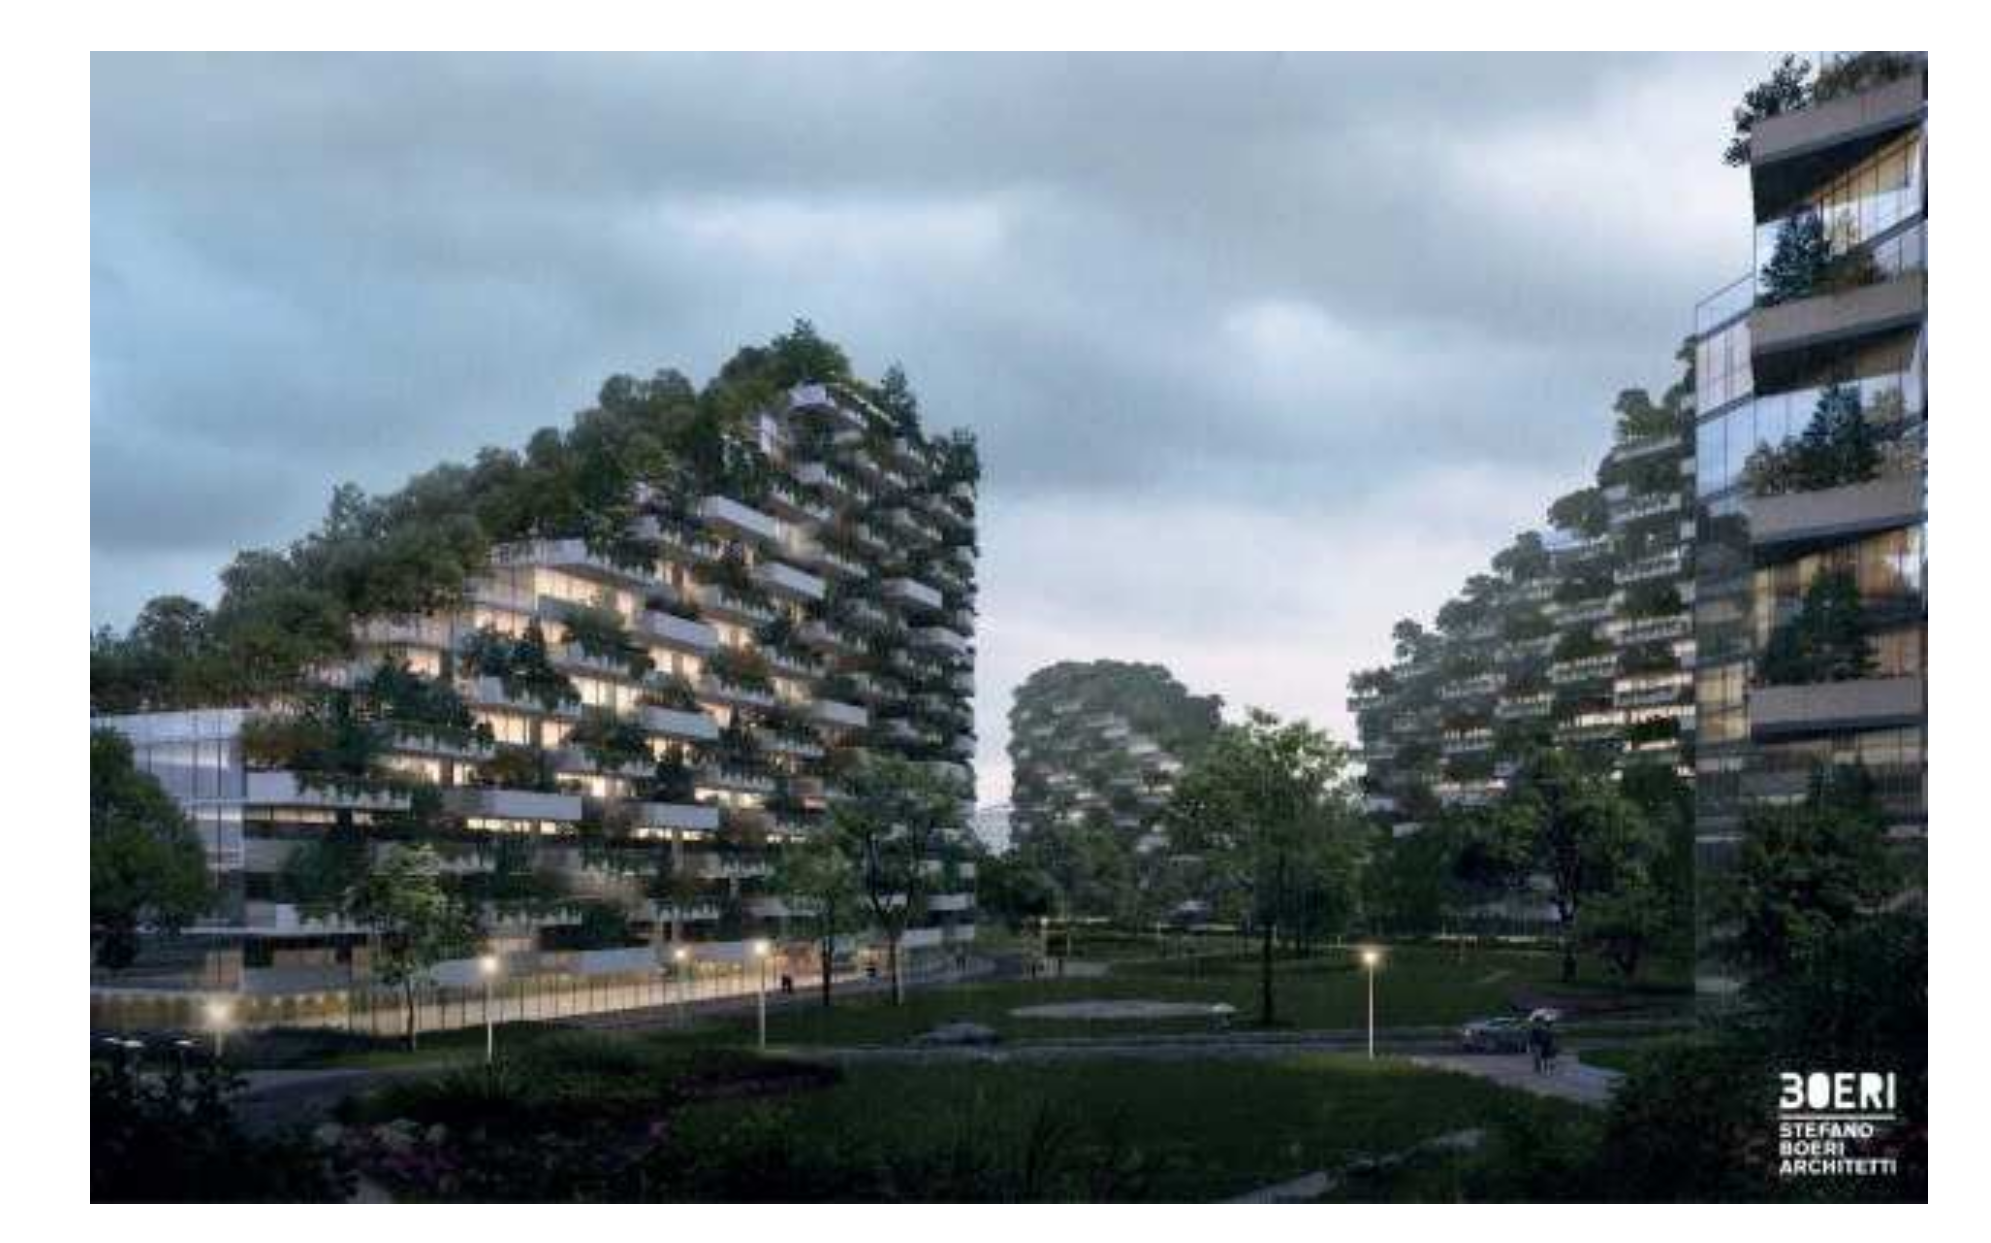
27] in the case of New York. In China, where air pollution is very conspicuous, the solution of this problem is searched for in the domain of constructing biophilic, vertical and forest cities [
28].
Figure 7 shows the example of Liuzhou Forest City in China.
Based on examined studies it is obvious that, no matter the dangers to human health in big cities which naturally occur due to human activity, there is a general human tendency to localize inside big urban structures. The reason is that these big structures offer chances for a better quality of life [
30]. This statement can be relativized and debated because it is general. Better quality of life probably means more possibilities and access to educational, cultural, social, and other contents and values which attract people for whose self-realization in rural areas the conditions do not exist. The given possibilities are at the same time connected to risks of different diseases which occur because of increased air pollution from the concentration of gases and particles as a consequence of a large population and their activity in a relatively small space. In that sense, the research could be simplified and the problem could be reduced to the economic level, i.e., it is possible to research the level of gross domestic product per capita in urban areas depending on the degree of the pollution of those areas. The logic of this research is because higher income per capita enables access to different contents that create the term “quality of life”. The goal of this paper is to determine the relation between the gross domestic product per capita and the level of air pollution in urban areas.
2. Methods and Materials
The methods for determining the level of attractiveness of a specific urban area are based on the gross domestic product per capita and level of air pollution. The air quality is measured by the index of air quality, and economic attractiveness is calculated for each urban area separately and then urban areas are compared by this criterion.
The formula for calculating the degree of economic attractiveness of an urban area (economic model) reads:
where:
- -
—economic attractiveness of urban area;
- -
—Gross Domestic Product per capita and
- -
AQI—Air Quality Index.
The simplicity of Equation (1) is also supported by its stability i.e., the changes of values in ratio will not change the ratio significantly. The sensitivity analysis is given as follows (according to common mathematical and well-known models).
To simplify the Equation (1), we can introduce the shorter notification as follows:
To obtain the variations of result depending on the variations of independent variables we shall find the first derivative as follows:
where the brackets denote |…| absolute values.
Utilizing the above formula, we obtain the increment of economic attractiveness depending on changes of its parameters (gross domestic product per capita and air quality index):
To obtain the standard deviations we shall utilize the following equations:
The modification of this method (or its development) could also be done by using the income per household instead the gross domestic product per capita if there are those kinds of data. The comparison of two urban areas by attractiveness can be also made if the coefficient is determined as follows:
where:
- -
—ratio of attractiveness of two urban areas and (relative coefficient of atractivenes);
- -
—attractiveness of urban area and
- -
—attractiveness of urban area.
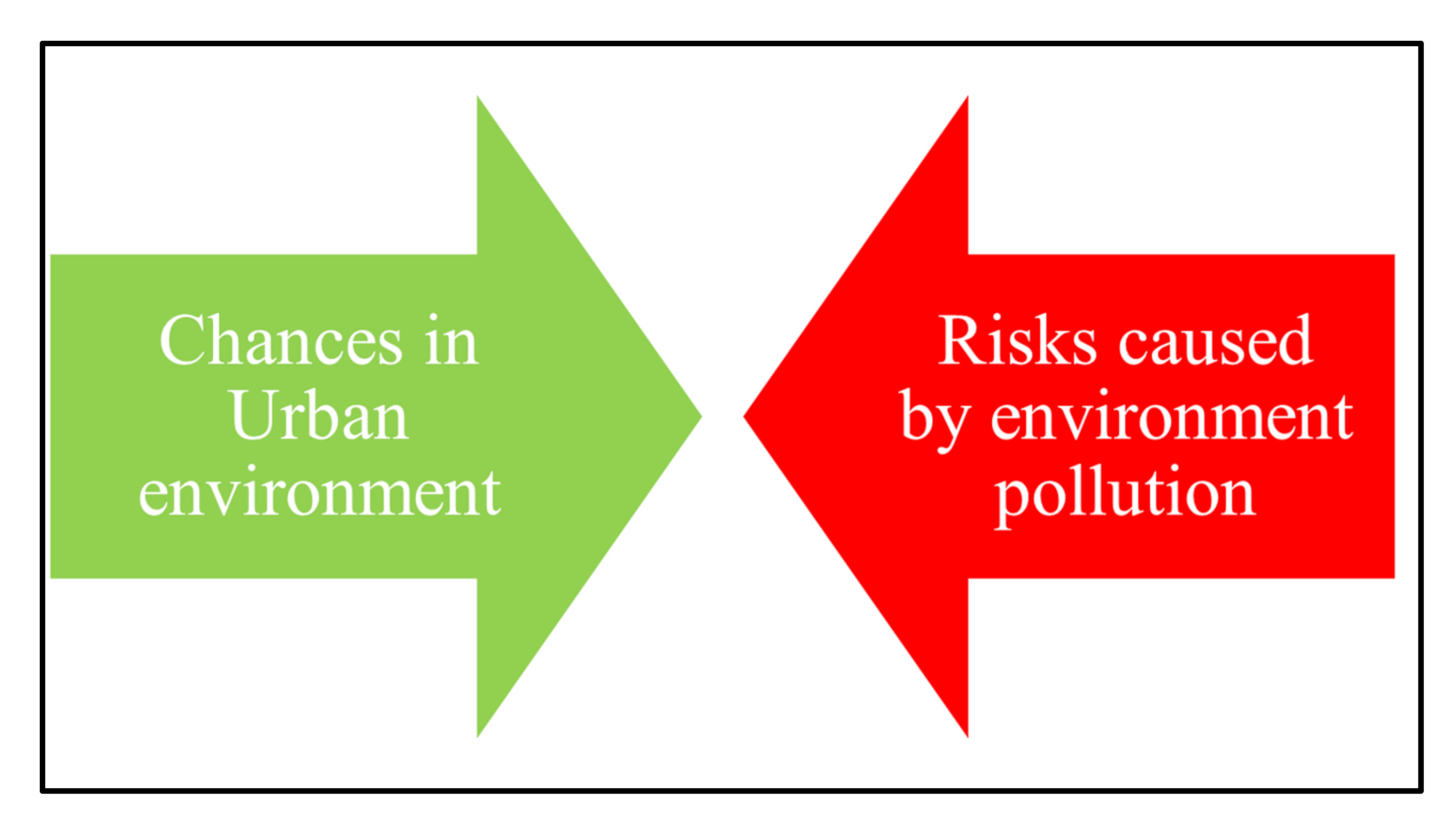
This method assumes that people who want to live in the cities are conscious of the risks to which they are exposed by the pollution of the environment and that the decision they make is based on rational consideration of all options.
Figure 8 illustrates the confronted reasons for and against living in urban areas.
This way, the term “better quality of life” is decomposed into a cluster of potential chances that big urban area residents can take that could not be possible in some other spaces. The cluster of potential chances can be further decomposed into type and number of potential chances. For example: some big urban areas residents will, depending on their income, have a chance to achieve access to educational and cultural contents while some of them will be able to achieve only access to an individual content. However, the chance is viewed as, out of these urban areas, they would not be able to achieve the access to these contents at all or that it would be more expensive or of lesser quality. There is, also, an assumption that the income of residents in the urban areas would be higher considering bigger job opportunities and bigger values produced on those spaces.
The data for calculating the attractiveness of urban areas can be downloaded from available sites since it is considered that the mistakes caused by the variances from the real values would be negligible bearing in mind the data characteristics and the forms of data calculating by Equations (1) and (2).
3. Results and Discussion
For the creation of the case study, the data used were for Boston [
31], New York [
32] and Washington [
33] in United States of America. For the area of “blue ba-nana” in Europe, the data used were for London [
34], Brussel [
35] and Milan [
36]. For China, Shanghai was considered [
37]. The data used for air quality index were taken from the site which shows the current state of index in the whole world. The data for gross domestic product per capita are given in USD (
$). Obtained results are shown in
Table 1.
Table 2 shows the relation between levels of economic attractiveness for different urban areas. Those seven cities are chosen as a representative for big urban areas both for domestic product and geographical affiliation. The assumption is that in these urban areas are living people who are educated enough and aware of potential danger caused by environmental pollution.
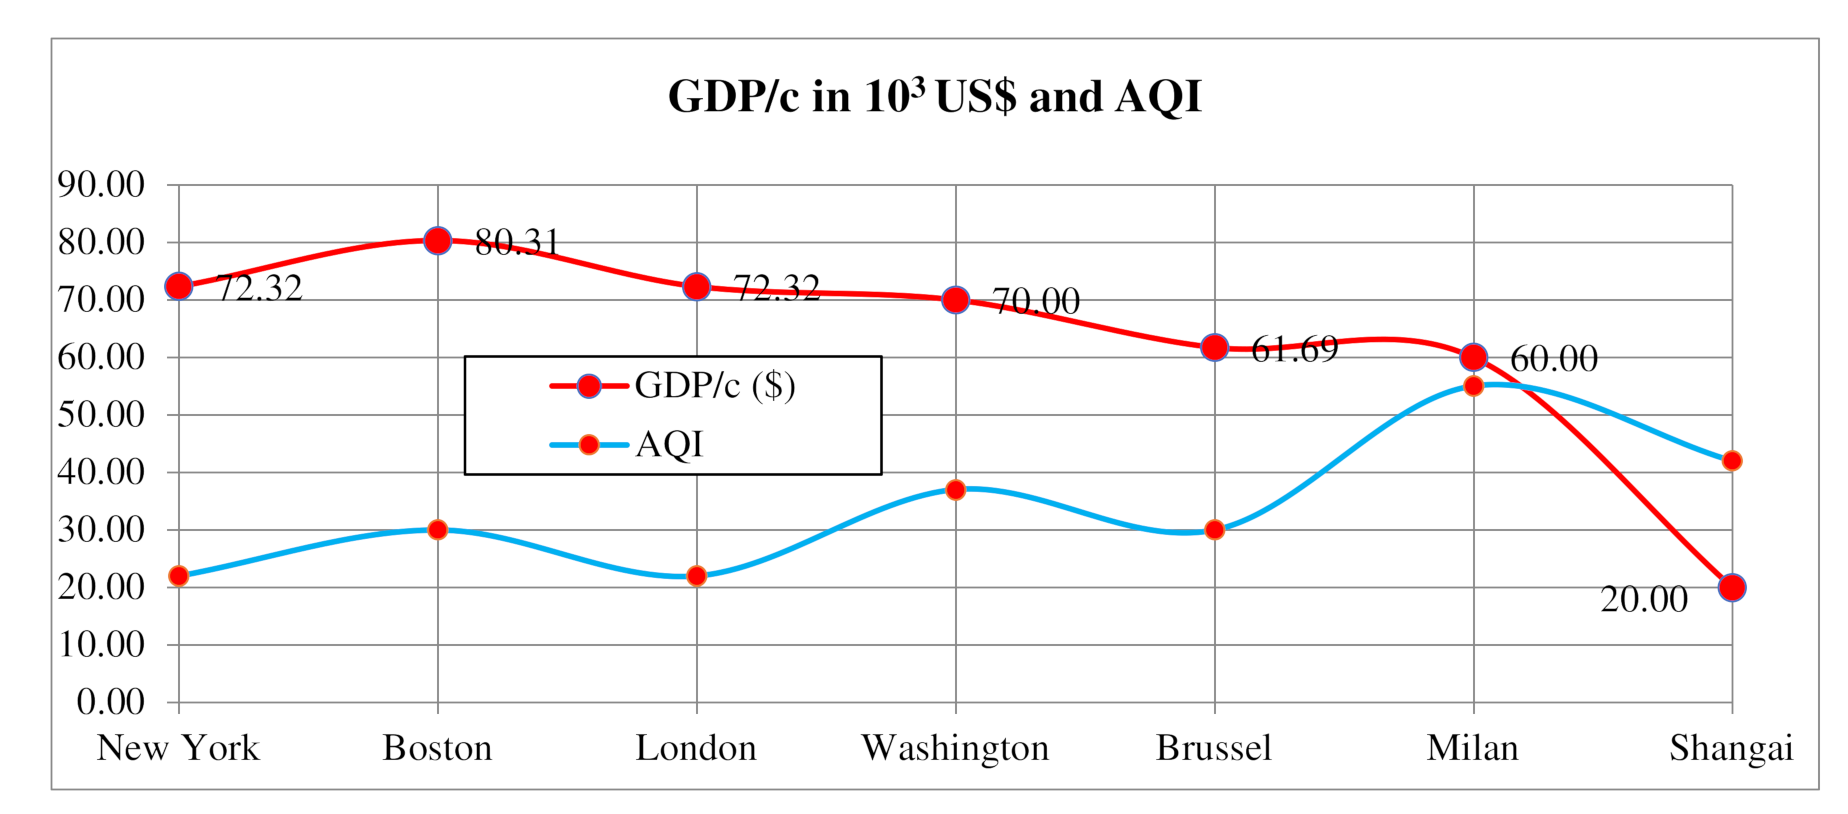
According to the obtained results of economic attractiveness and reserves because of the pollution, the order of urban areas is observed so that first two places are the cities from megalopolises (megapolitan area) in the USA and there is only London from the area of “blue banana” in third place before Washington. Shanghai is in the last place by economic attractiveness based on its low value of gross domestic product per capita as well as for relatively high air quality index. On
Figure 9 the graphic of the cities is shown in descending order by gross domestic product per capita, and at the same time, the air quality index. The gross domestic product per capita is expressed in thousands of US
$ for the adjustment on the ordinate.
Based on the data analysis from
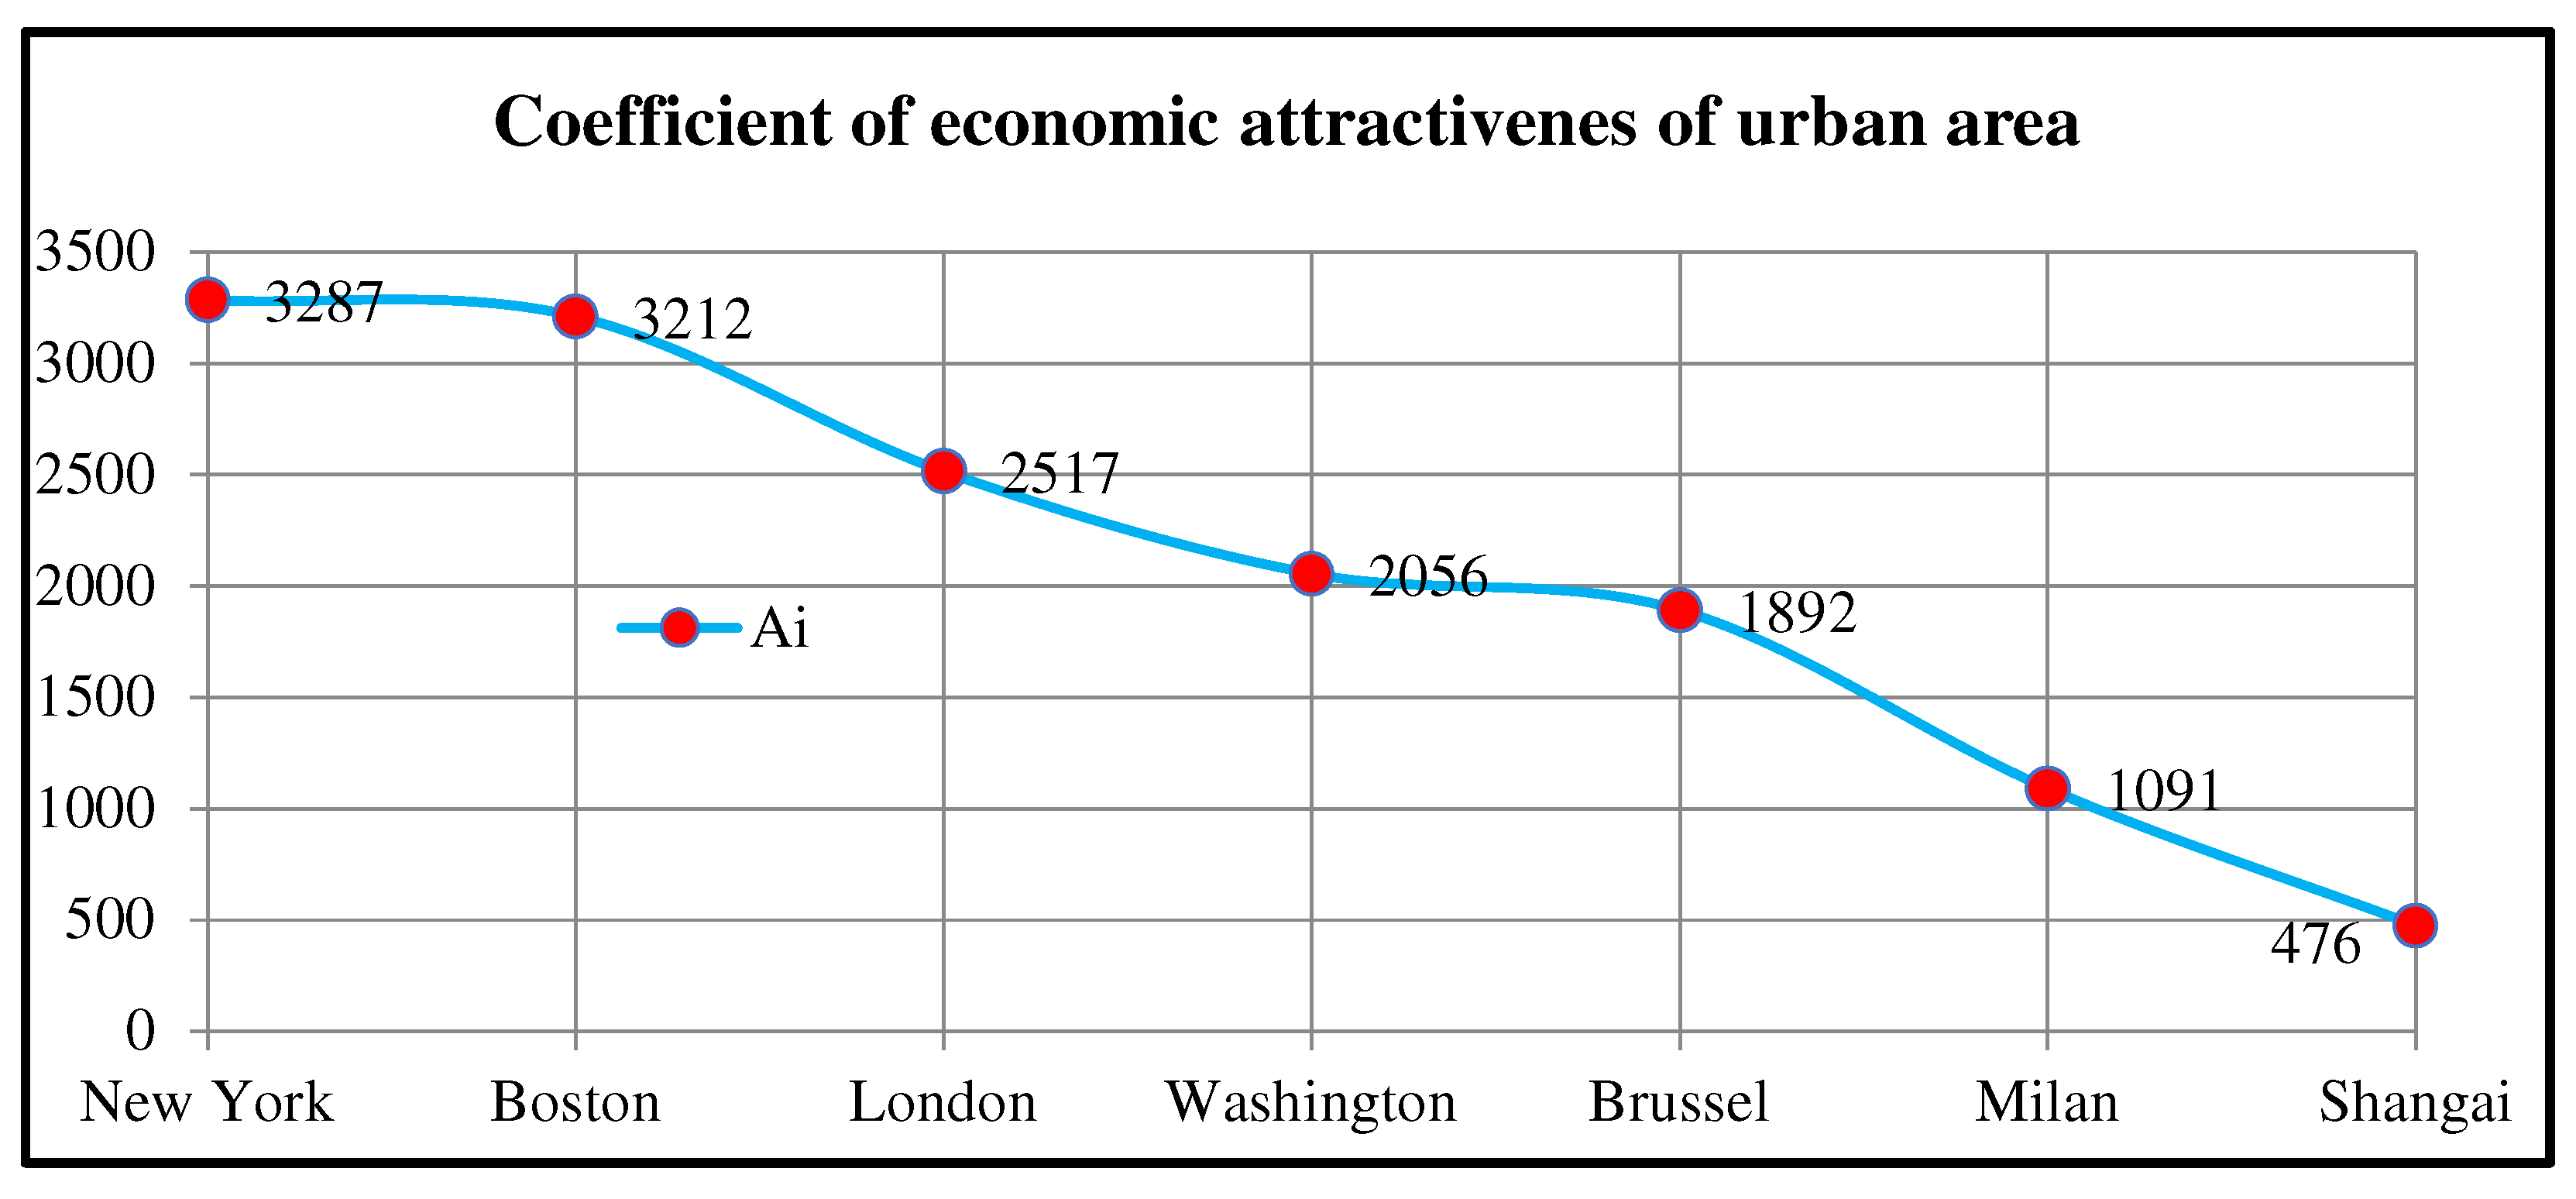
Table 1, it appears that the highest gross domestic product per capita does not always mean the biggest economic attractiveness. On
Figure 10, the graphic of the coefficient of the economic attractiveness of the cities in descending order is shown.
Even though it is a small example from only seven urban areas in the whole world, the coefficient of correlation between gross domestic product per capita and air quality index shows a negative trend, i.e., coefficient of correlation is . That means that the drop in gross domestic product increases the air quality coefficient (air quality decreases, i.e., air pollution grows). The method used in this paper does not take into consideration the long-term trends in air pollution development because that approach would surpass the size of this research. The further method development can include the minimal allowed air quality (maximal allowed pollution) in the history of urban areas as risk factor and should be included in the model of economic attractiveness of urban areas in a longer period of time. This model would then be comprehensive. However, in this phase of model development of economic attractiveness, current values show the short-term risks but not their additive specifications.
The coefficient of economic attractiveness shows that it is not the urban area that has the biggest gross domestic product per capita (GDP/c) that is the most attractive, but the one that has the best ratio of gross domestic product and air quality index.
Sensitivity analysis is based on the adopted values for increments of gross domestic products and air quality index as well as for standard deviation of their determination as follows:
The above equations mean that assumed increments of gross domestic product and air quality could vary by 10% of their real value and their standard deviations (uncertainty of their determination) is 1% of their real values. The results show that the increment of coefficient of economic attractiveness varies by about 10% and standard deviation is less than 1.5%.
Sensitivity analysis for utilized data is given in
Table 3.
Relative ratio between coefficients of attractiveness of specific urban areas shows that the attractiveness of New York is higher than Boston by about 2% while the attractiveness of London is higher than attractiveness of Washington by 22%. The attractiveness for Shanghai is six and seven times lower than for Boston and New York, respectively.


