
Modeling Vessel Behaviours by Clustering AIS Data Using Optimized DBSCAN


Geomatics Engineering, Lassonde School of Engineering, York University, Toronto, ON M3J 1P3, Canada
*
Author to whom correspondence should be addressed.
Sustainability 2021, 13(15), 8162; https://0-doi-org.brum.beds.ac.uk/10.3390/su13158162
Submission received: 10 May 2021
/
Revised: 15 July 2021
/
Accepted: 16 July 2021
/
Published: 21 July 2021
(This article belongs to the Special Issue Navigation and Remote Sensing for Sustainable Development)
Abstract
:Today, maritime transportation represents a substantial portion of international trade. Sustainable development of marine transportation requires systematic modeling and surveillance for maritime situational awareness. In this paper, we present an enhanced density-based spatial clustering of applications with noise (DBSCAN) method to model vessel behaviours based on trajectory point data. The proposed methodology enhances the DBSCAN clustering performance by integrating the Mahalanobis distance metric, which considers the correlation between the points representing vessel locations. This research proposes applying the clustering method to historical Automatic Identification System (AIS) data using an algorithm to generate a clustering model of the vessels’ trajectories and a model for detecting vessel trajectory anomalies, such as unexpected stops, deviations from regulated routes, or inconsistent speed. Further, an automatic and data-driven approach is proposed to select the initial parameters for the enhanced DBSCAN approach. Results are presented from two case studies using an openly available Gulf of Mexico AIS dataset as well as a Saint Lawrence Seaway and Great Lakes AIS licensed dataset acquired from ORBCOMM (a maritime AIS data provider). These research findings demonstrate the applicability and scalability of the proposed method for modeling more water regions, contributing to situational awareness, vessel collision prevention, safe navigation, route planning, and detection of vessel behaviour anomalies for auto-vessel development towards the sustainability of marine transportation.
1. Introduction
Today, maritime transportation represents 90% of international trade volume, and more than 50,000 vessels are sailing the ocean every day. Therefore, systematic modeling and surveillance should be a high priority in the maritime domain to reduce maritime transportation security risks. Statistically, between 75% and 96% of maritime accidents are caused by human error due to fatigue or misjudgment [1,2]. Safe navigation contributes to sustainability by reducing marine transportation accidents, which in turn protects the marine environment from exposure to hazardous chemicals leakage from vessel collisions. In addition, the development of automatic vessels contributes to surveying and transportation efficiency, promoting and facilitating sustainable and cost-saving industries [1,2]. Auto-vessels are one of the most promising automatic vehicles for implementation, as they have fewer barriers to adoption than automobiles [1,2] and unmanned aerial vehicles, which operate in a more complex airspace domain [3]. Vessels equipped with autonomous and semi-autonomous systems can reduce reliance on human intervention, making our oceans and maritime navigation safer. In December 2018, Rolls-Royce and Finferries demonstrated the world’s first fully autonomous ferry [4]. However, the ships were only deployed on simple inland waterways where the waters are calm, the route is simple, and there is no high traffic. Indeed, there is still a long way to go in the design and development of autonomous vessels. This paper proposes an algorithm to generate two models: a clustering model of vessels’ trajectories, and a second model that detects vessel trajectory anomalies, such as unexpected stops, deviations from regulated routes, or inconsistent speed.
To do this, reliable vessel traffic data is needed to study vessel behaviours and generate nautical routes. One data source for this is historical and real-time Automatic Identification System (AIS) data [5,6]. AIS is an automatic tracking system used to identify and locate vessels by exchanging data with nearby ships, AIS base stations, and satellites. According to the Safety of Life at Sea (SOLAS) convention, large ships and passenger vessels must have AIS equipment on board [7]. AIS standards are set by the International Maritime Organization (IMO). As a result, AIS data is abundant, standard, and consistent across the globe. This makes AIS data suitable for global marine transportation traffic modeling and analysis. The AIS data include vessels’ attributes, such as date/time, identity, position, speed, and which direction they are heading in. AIS data are collected by national organizations (e.g., Transport Canada, Canadian Hydrographic Service, and US Coast Guard) and commercial vendors, and are used for navigation safety, monitoring the location and characteristics of vessels in real-time, traffic modeling and analysis, and a variety of GIS-based applications. AIS data can be obtained as open-source or licensed data.
This paper uses open-source AIS data from the Gulf of Mexico as the primary data source for testing the proposed algorithm, and generates models based on big data from the Saint Lawrence Seaway region. Since AIS data always contain inaccurate and uncertain noise, outlier detection and filtering are required when organizing and modeling with AIS data. Additionally, given the significant size of the AIS dataset, unsupervised learning in modeling and anomaly detection processes with a high degree of automation are used.
In this paper, density-based spatial clustering of applications with noise [8] is used as the foundation of marine trajectory modeling. DBSCAN, an unsupervised method, is now widely available in clustering libraries and used in many real-world applications [9,10,11,12]. DBSCAN is a density-based clustering method, and it is considered an effective method to discover clusters of arbitrary shapes and identify outliers [8]. Due to this, DBSCAN has potential applications for marine trajectory clustering. However, the traditional DBSCAN clustering method struggles with the uneven spatial distribution of actual AIS data [13,14,15,16,17,18,19,20,21,22], making it an unreliable method for marine trajectory clustering without optimization. The traditional DBSCAN method requires two input parameters with values determined by the user: MinPts (minimum points; the number of neighbors a point must have to be included in a cluster) and Eps (epsilon; proximity parameter). However, under real-life conditions, it can be difficult to find the optimal parameters when the data and scale cannot be well understood [13,14,15,16,17,18,19,20,21,22]. Furthermore, the traditional DBSCAN method is based on the Euclidean distance metric, which is not always able to process data with complex shapes and distributions [23,24]. To overcome this, intuitive distance metrics need to be proposed to optimize the performance of DBSCAN.
Overall, the model presented in this paper is to enhance the DBSCAN clustering method to solve for the aforementioned limits, and so that it can be applied to historical or real-time AIS data. The proposed model provides foundations for route planning, monitoring vessel behaviours, and detecting anomalies. By organizing similar AIS data and clustering them together, vessel behaviours can be profiled under labeled clusters, with each representing a specific vessel behaviour stage. Within each behaviour stage, the vessel behaviours share maximum similarities and are different from other clusters. Marine transportation route planning can be done by selecting a series of stages provided by the model. The model can monitor vessels by detecting any anomalous behaviours by collecting new AIS data from vessels traveling in the modeled region. The model can also suggest prospective routes and actions based on an autonomous vessel’s location, which contributes to Artificial Intelligence (AI) vessels-based research. Taking advantage of the proposed model, autonomous vessels can remain on a safe route, with a safe speed and direction (heading) whilst following the recommended route. In general, this paper provides a possible process for analyzing, clustering, and modeling AIS data, supporting research into sustainable marine transportation and auto-vessel development. In addition, a similar data-analytic framework can also be applied to other data sources for more general analysis purposes. The result gives a framework for processing unlabeled data beyond AIS data, preparing labeled training data, and generating classification AI models. Furthermore, the enhanced DBSCAN clustering method presented in this paper and the automatic approach for finding the required parameters are also valuable to the machine learning community.
The organization of the paper is as follows. Section 2 provides a review of the current state of the art in marine trajectory data clustering and the DBSCAN method. Section 3 gives details about the developed method and corresponding algorithms. Section 4 presents the testing and evaluation of developed algorithms using synthetic data. Section 5 presents two case studies and the results obtained. Finally, Section 6 highlights lessons learned and concludes the paper with suggestions for future work.
2. Background Information
2.1. Marine Trajectory Data Clustering
Trajectory clustering has attracted growing attention, given the critical role of trajectory data mining in modern intelligent systems for navigation, surveillance, security, abnormal behaviour detection, crowd behaviour analysis, and traffic control [25]. Existing trajectory clustering methods can be categorized into three groups: supervised, unsupervised, and semi-supervised algorithms [26].
Supervised algorithms aim to train a model to determine the labels of observations after learning labeled training data [27,28,29,30,31]. Therefore, supervised algorithms usually have high accuracy but require extensive human efforts. Unsupervised learning methods are self-organized methods that help find previously unknown patterns, hidden structures, and uncover similarities in data sets without pre-existing labels [32,33,34,35,36]. Thus, unsupervised algorithms do not require significant human efforts for preparing massive training data but usually have higher computation costs and need optimization before implementation. Semi-supervised algorithms fall between those two types of algorithms. Semi-supervised algorithms can be developed, starting from unsupervised or supervised algorithms. For example, an algorithm could only require users to prepare a small amount of labeled data to train the model, and then conduct the cluster tasks while updating the model with unlabeled data automatically [37]. In this way, semi-supervised algorithms can be more efficient, combining the advantages of both supervised and unsupervised algorithms.
2.2. DBSCAN Enhancement
Multiple optimizations have been proposed to enhance DBSCAN performance from the research community. Solutions to the drawbacks of clustering unevenly distributed datasets with varied densities have been proposed [38,39,40,41,42,43,44,45]. Methods finding the optimal parameters for corresponding datasets have been presented in [15,16,17,18]. Density clustering methods have also been recommended without requiring any parameters from the user [14,43]. Various methods have also been suggested to increase the algorithm’s computational efficiency when applied to large databases [46,47,48,49,50]. Additionally, various methods presenting new clustering conceptions to DBSCAN can be found in [19,23,24,51].
The proposed density-based clustering algorithm integrates the Mahalanobis distance metric. DBSCAN fundamentals and the various optimizations are introduced in this section to set up the foundational ground. The DBSCAN method discovers clusters and outliers for a spatial dataset [8]. In the case of spatial point clouds, clusters are formed by core points surrounded by a minimum number of points (MinPts) within a given radius (Eps). As shown in Figure 1, DBSCAN iterates through every point to grow the clusters until all points are visited, and the remaining unlabeled points are labeled as outliers. DBSCAN can find arbitrarily shaped clusters, thus showing potential use for marine trajectory clustering. The complexity of traditional DBSCAN can be O(n2) without using any indexing to accelerate the computation. The overall average runtime complexity can be reduced to O(n*log(n)) if an indexing structure is used for executing neighborhood queries.
However, due to the drawbacks of the DBSCAN clustering method, optimizations are required before implementation. For example, the traditional DBSCAN method is very sensitive to the two key parameters selected by the user. Even a slightly different set of them may lead to very different partitions of the dataset [21,22,23]. Usually, the user selects the optimal parameters after a long and repetitive trial-and-error process. However, determining the optimal parameters can be very challenging under real-life conditions when the data and scale cannot be well understood [13,14,15,16,17,18,19,20,21,22]. The application of the traditional DBSCAN clustering method can also underperform with unevenly distributed data, which is challenging to be clustered ideally with a single designated Eps parameter [13,14,15,16,17,18,19,20,21,22]. This leads to unreliable results when applying the traditional DBSCAN method to real AIS data without optimization. Furthermore, the traditional DBSCAN method, based on the Euclidean distance metric, can face challenges with data that have complex shapes and distributions [23,24]. Thus, novel distance metrics need to be proposed to optimize DBSCAN performance.
Most of the existing optimizations are designed for clustering two-dimensional spatial data (i.e., x, y). When the data dimensions grow and the Mahalanobis distance metric is used, the distribution of the dataset becomes different [13,23,24]. Therefore, the existing adaptive parameter method needs to be modified prior to its application to the enhanced DBSCAN method. To do this, optimization is needed to apply high-dimensional DBSCAN clustering using an intuitive distance metric such as the Mahalanobis distance matrix. We integrate the Mahalanobis distance metric into DBSCAN to enhance DBSCAN clustering performance by considering the point correlations. Additionally, an automatic and data-driven approach is proposed to choose the required initial two parameters (MinPts and Eps) for enhanced DBSCAN.
3. Methodology
3.1. Novel Representation of Marine Trajectory Data
This paper proposes applying a semi-supervised method to trajectory clustering for real-world conditions. This work starts by optimizing an unsupervised algorithm, DBSCAN, and then modifies it into a semi-supervised model. As a result, the model can work in an unsupervised way and use labeled data as inputs to speed up the process, sending unlabeled observations to the model so it updates.
The traditional densely based clustering works with two-dimensional data (i.e., location data). Latitude and longitude are the only spatial components to be considered, and the two-dimensional points are clustered together based on their spatial density. Increasing the data dimensions can change the concept of “density reachability” and enhance the clustering model’s ability to find more complex unknown similarities between the data.
Besides latitude and longitude describing the vessels’ geographic location, speed over ground (SOG), course over ground (COG), and heading are also essential parameters to describe vessel behaviours. SOG is defined by the actual speed at which the GPS unit is moving over the ground. The motion direction defines COG with respect to the ground. Heading describes the direction that a vessel is pointed. We propose to extend each 2D trajectory point into a five-dimensional vector, as shown in Equation (1), by complimenting the latitude and longitude with SOG, COG, and heading. Considering SOG, COG, and heading when clustering AIS data can provide deeper insights into marine transportation from the clustering results.
A marine transportation trajectory is defined as a finite point sequence T = ((x1, t1), (x2, t2), …, (xm, tm)). Each data point xi corresponds to a multi-dimensional feature vector representing the moving object by a set of [latitude, longitude, SOG, COG, heading] at time point ti, where ti < ti + 1 for i = 1, …, m − 1.
x = [latitude, longitude, SOG, COG, heading]T
T = ((x1, t1), (x2, t2), …, (xm, tm))
The data is normalized between (−1, 1) as required by most machine learning techniques, including DBSCAN. After normalization, all five attributes share the same mean value, the same variance value, and the same weight when clustering.
3.2. Integration of Mahalanobis Metric to DBSCAN
As mentioned, traditional DBSCAN clustering iterates from point to point calculates the distances among points, identifies core points, and clusters the surrounding points together. However, the traditional DBSCAN using Euclidean Distance has two main shortcomings: (1) high computation costs, and (2) only local characteristics are considered when identifying the cluster. The proposed clustering method, integrated with the Mahalanobis distance metric, resolves the previously mentioned challenges by increasing the computational efficiency and considering the correlation between the points within the cluster.
The Mahalanobis metric calculates distance, taking into consideration the correlation between a group of points. The Mahalanobis distance DM(x, y) from a point x, to another point y, which both are inside a cluster with the covariance matrix, S, is defined by Equations (3), (5) and (6), respectively. The Mahalanobis distance DM(x, C) from a point data, x, to the cluster C with mean, μ, is defined by Equation (4).
μ = [μlatitude, μlongitude, μSOG, μCOG, μheading]T
Sij = cov(xi, xj) = 〈(xi – μi) (xj − μj)〉
The proposed algorithm is composed of two parts: an unsupervised clustering method and a supervised one. The unsupervised algorithm finds the density reachability of the points in the defined high-dimensional space. The unsupervised algorithm component integrates the Mahalanobis distance metric considering the correlations within the whole dataset. In this way, density-based clusters are generated by grouping similar trajectory points. The supervised algorithm component takes advantage of the pre-defined clusters generated from the previous step and the user inputs the Eps parameter using the auto-selection method described in the next section. The preliminary model reads each point to classify them. The Mahalanobis distances to each pre-defined cluster are computed, and the distances are compared with the Eps term. If the Mahalanobis distances are smaller than Eps, the points can be classified into the cluster, and then the cluster gets updated. If the Mahalanobis distances are greater than Eps, then these points are detected as outliers to this cluster. This step can run iteratively until all points are properly labeled.
3.3. Parameters Auto-Selection Method for the Enhanced DBSCAN
As mentioned before, DBSCAN requires users to input two parameters (MinPts and Eps), and the clustering results can be very sensitive to the selection of these parameters. In this work a map-reduce method for handling big data problems is adopted. This requires a universal way to select the parameters so that the clustering results in the first layer from each Maritime Mobile Service Identity (MMSI), which identifies the vessel, can remain consistent. This paper proposes a simple and straightforward way to obtain a good initial set of the two parameters for the proposed enhanced DBSCAN method.
The proposed method finds MinPts by selecting 0.1% of the sample size. The MinPts are required to be at least ten since the data sizes of some datasets are too small to have a valid MinPts parameter. The Eps values are calculated by the distribution of the k-nearest-neighbour distances of each data point. The method is popular for understanding how the data are distributed before setting clustering parameters. Ideally speaking, multiple Eps corresponding to each distance level should be selected to form clusters.
Nevertheless, due to the limitation of the DBSCAN method, we chose the Eps value that would prioritize filtering out outliers. The upper limits of the KNN distribution are selected as Eps. Moreover, the upper limit is defined by the sum of the upper quartile and 1.5 times the interquartile range (IQR). The complexity of the proposed parameter auto-selection method can be O(n*log(n)) with the use of indexing to accelerate the computation.
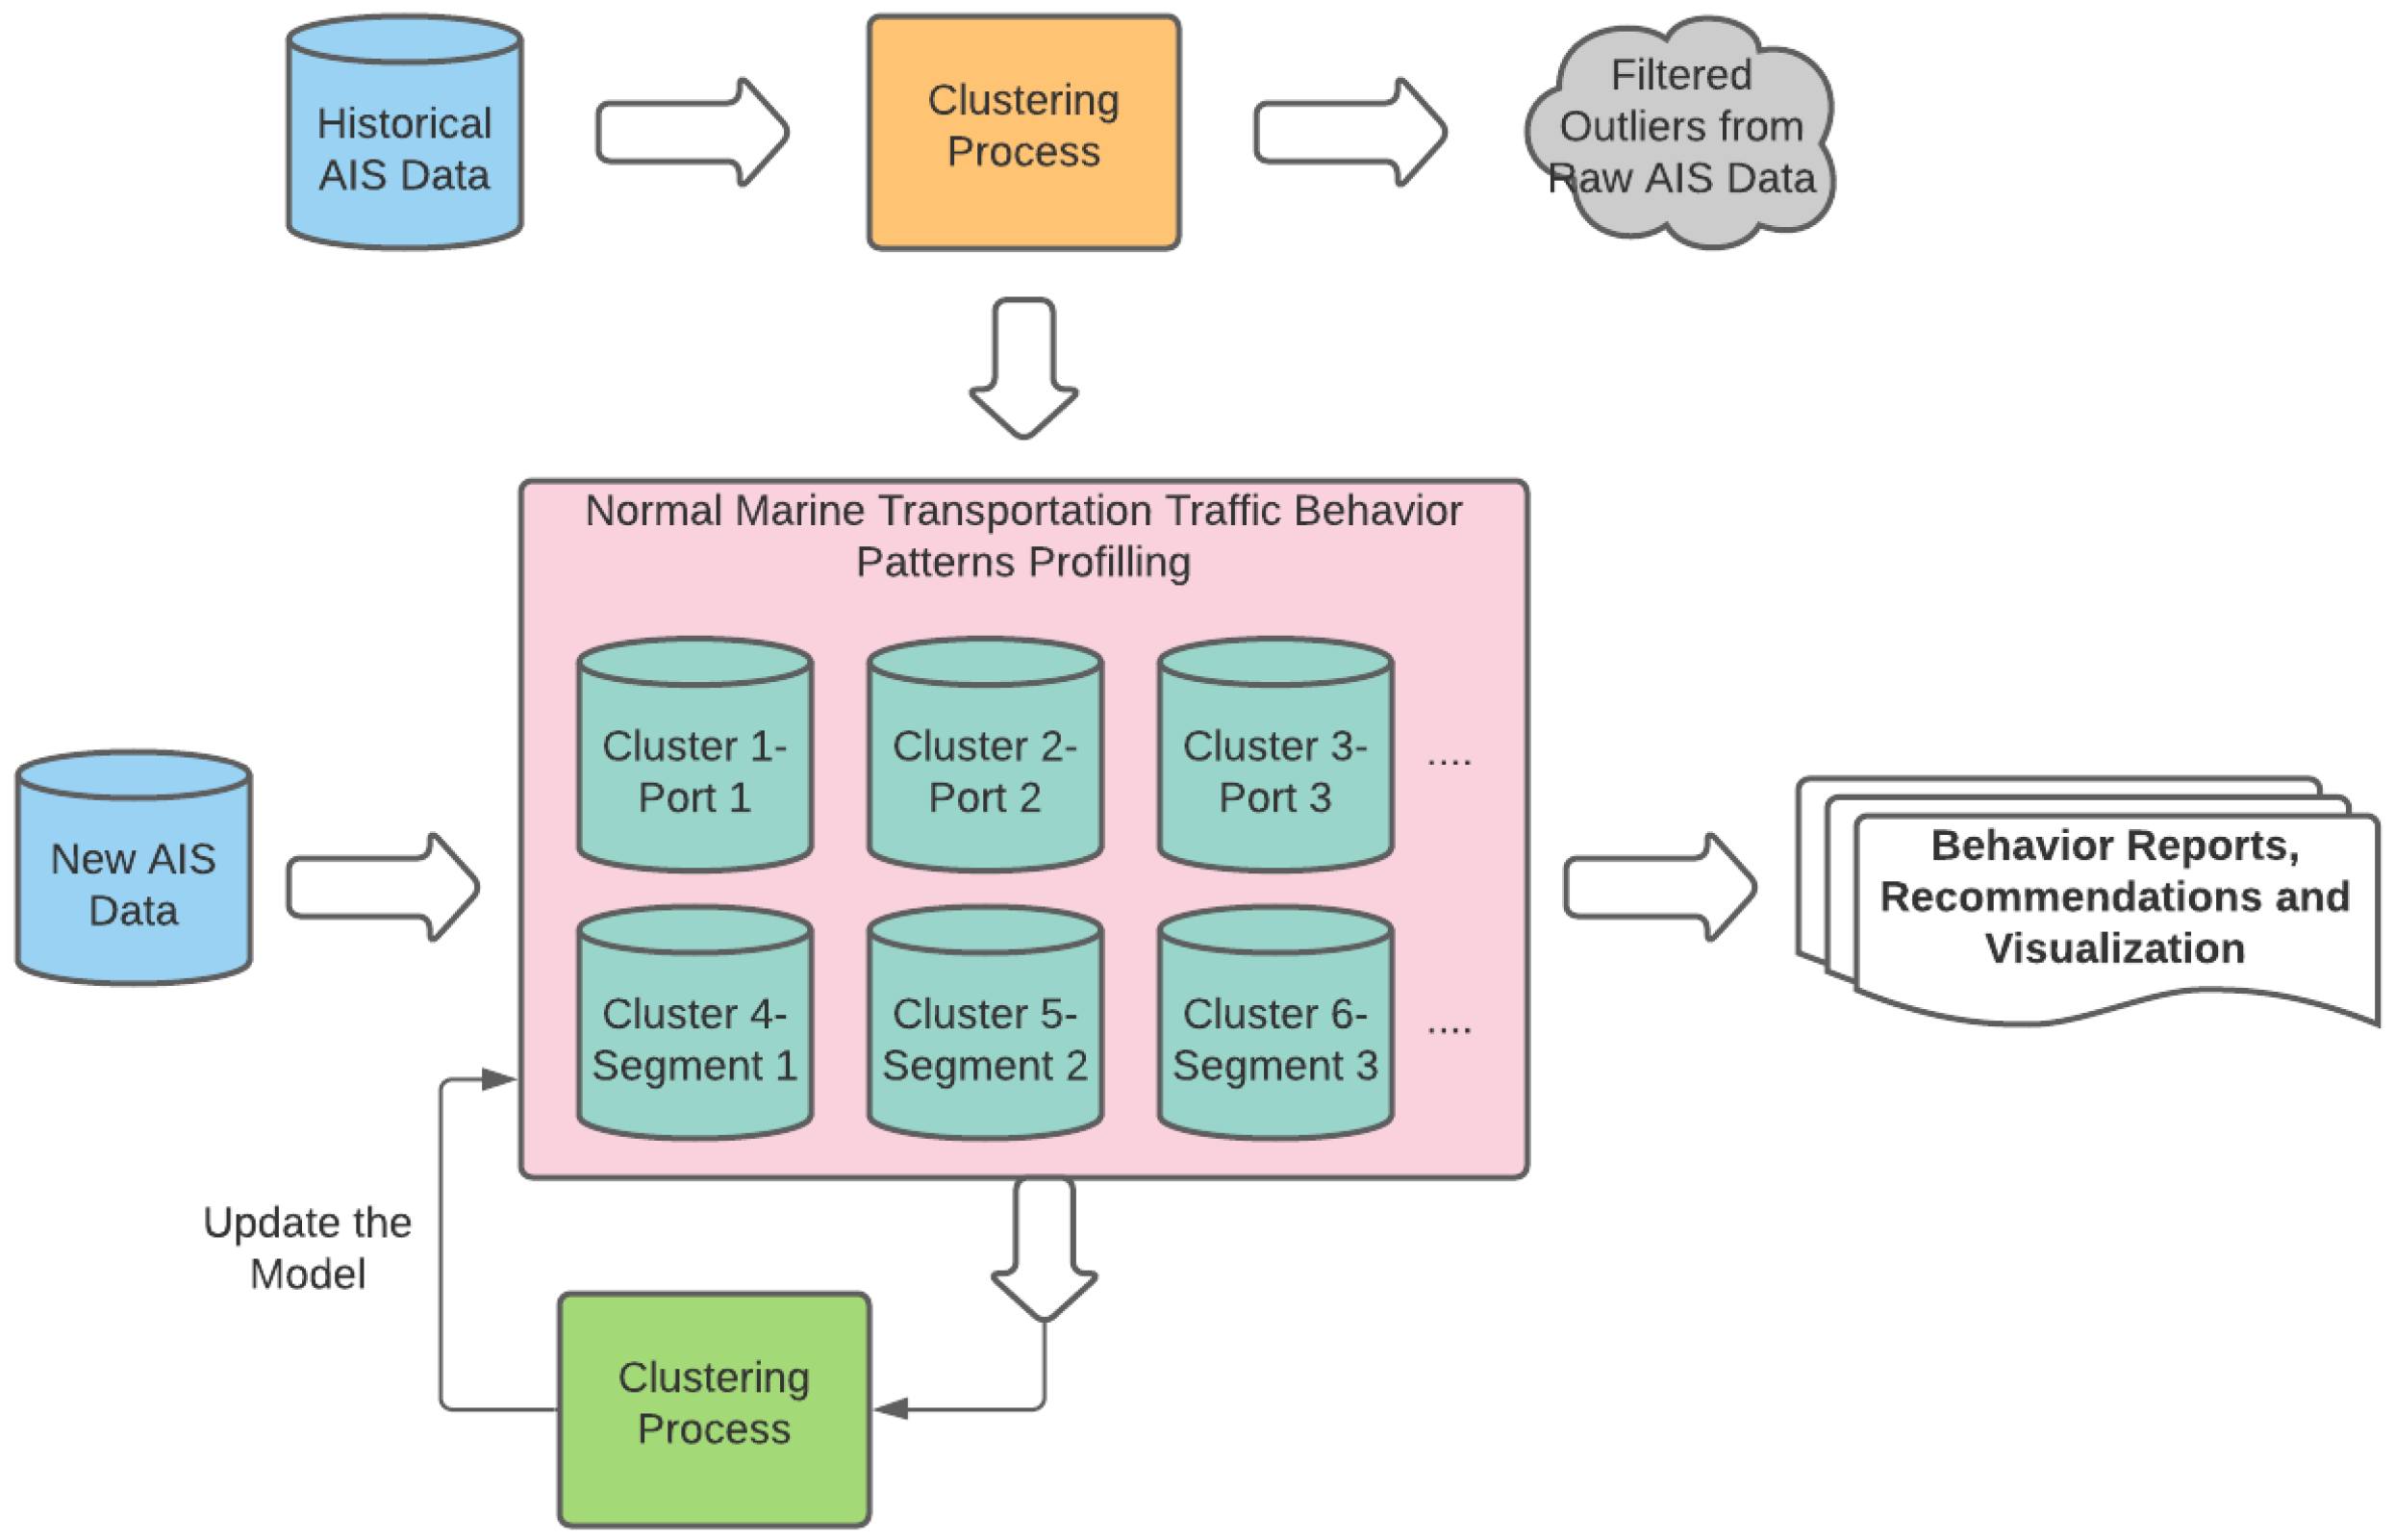
3.4. Extracting Vessel Behaviour Patterns Framework
For this research, frameworks were designed to profile vessel behaviours and detect abnormal vessel trajectories. The frameworks were developed using the proposed clustering algorithm described in Section 3.1, Section 3.2 and Section 3.3. Figure 2 shows the overview for processing historical AIS data to generate the model (represented by a pink square). Using this framework, vessel behaviours can be profiled into behaviour patterns by finding clusters within historical data and generating the model.
Behaviour patterns of marine transportation traffic are profiled based on the clustering results. These clusters are used to model the AIS data within a certain region and monitor vessels with AIS equipment on board. The model can then be applied to new AIS observations to provide the desired outcome, including vessel behaviour reports, action recommendations, and even behaviour prediction. The model also provides monitoring for crewed vessels and determines if the vessel has some anomalous behaviours. Autonomous vessels can also take advantage of the model for planning the route by selecting sequential clusters and getting recommendations for actions.
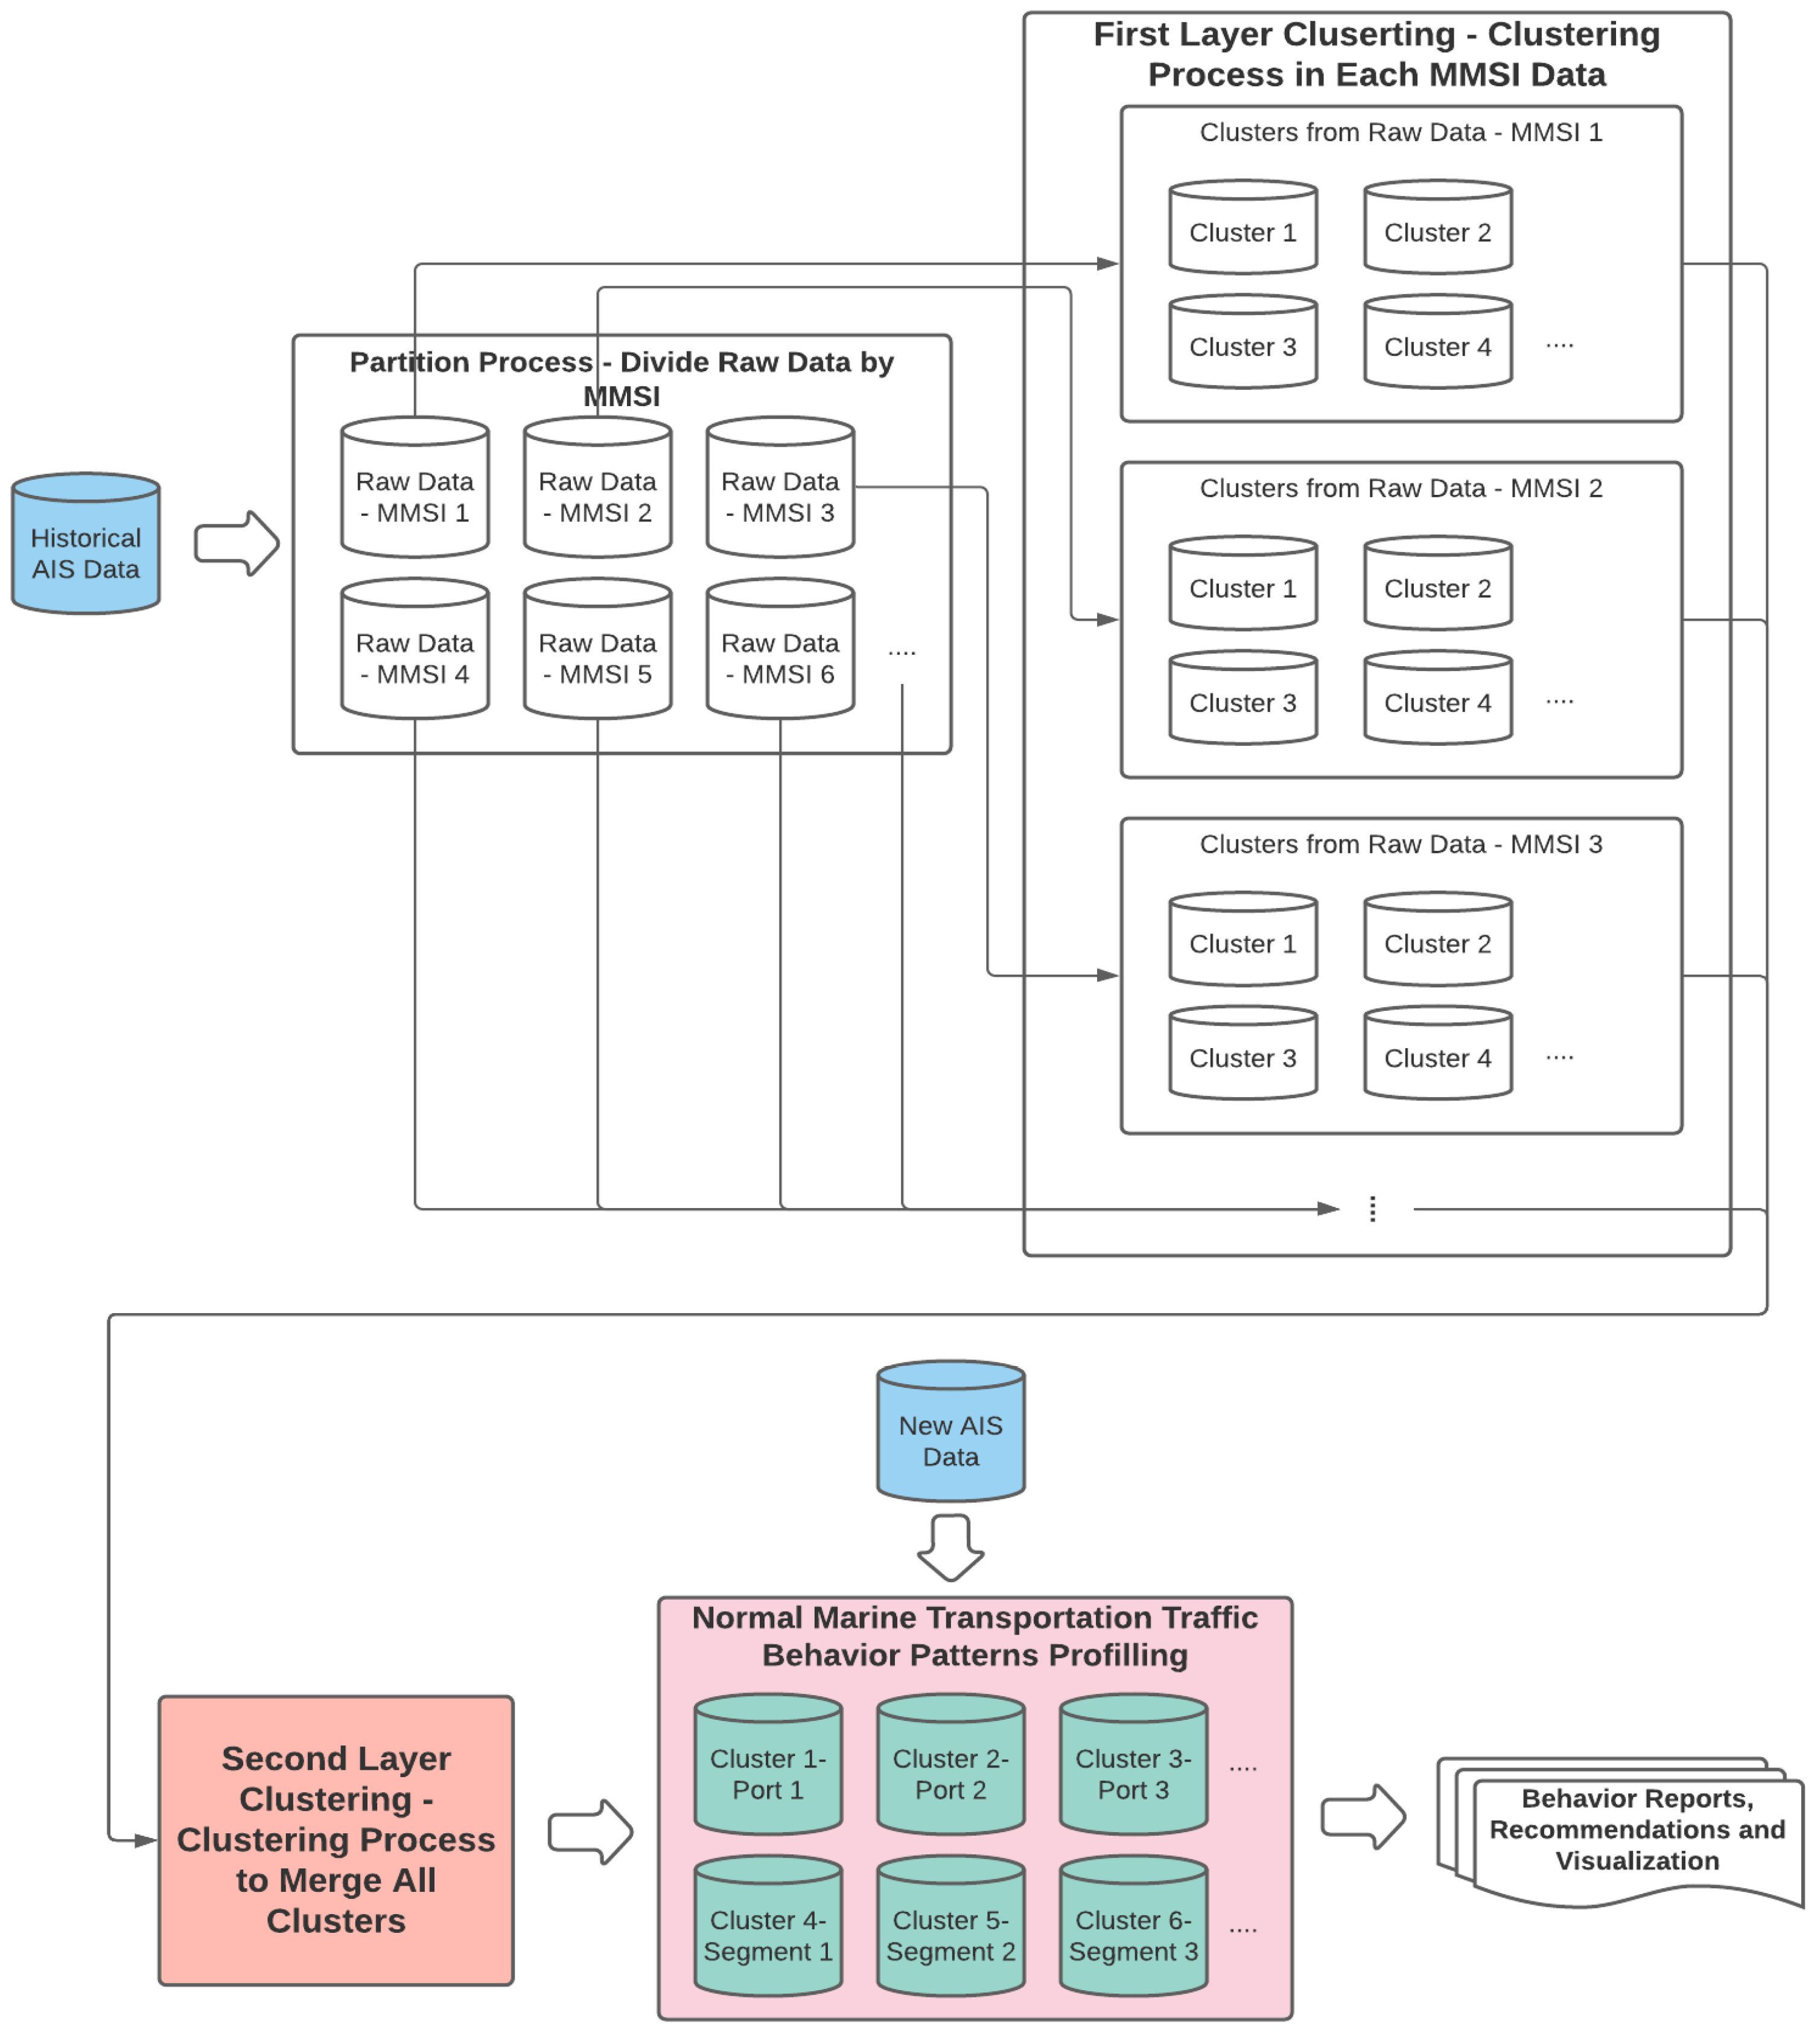
Maritime Mobile Service Identity (MMSI) has been used for identifying individual vessel trajectories. In this research, we adopt a map-reduce framework to cluster smaller pieces of AIS data split from the raw data based on MMSI, then merge them and generate the final classification model, which will be used for reading the new observations. The method assumes that data under each MMSI should have its specific behaviour patterns.
The proposed first-layer-clustering algorithm groups similar trajectory points within each MMSI and defines this specific trajectory stage. The second-layer clustering merges the clusters from each MMSI data piece, combining similar clusters and generating the final clusters. Each cluster from the first-layer clustering has been profiled as a behaviour vector to represent the cluster. The second-layer cluster combines similar clusters by clustering similar behaviour vectors. The same clustering algorithm proposed in Section 3.2 is utilized in this step. The selections of the parameters differ from the method proposed in Section 3.3. Instead of prioritizing filtering out outliers, the parameter setting in this step prioritizes the merging of the most similar clusters. Therefore, the MinPts and Eps are manually adjusted to be much smaller than the recommended value from the proposed parameter auto-selection method.
In this way, the algorithms run efficiently on processing big data. The details of the proposed hierarchy clustering structure are shown in Figure 3, representing the clustering process (orange square) in Figure 2.
The proposed clustering algorithm is a semi-supervised algorithm composed of an unsupervised clustering component and a supervised one. The algorithm can generate labeled data first in an unsupervised way with a smaller portion of the data. Then, the pre-defined model from the last iterative step reads the rest of the inquiry data and keeps updating itself. Figure 4 shows that the unsupervised algorithm component is implemented in Portion 1 (orange) to create pre-defined clusters. The supervised component then reads Portion 2 (green) to update the model into a final model. Using this method, only a small amount of effort is needed in the unsupervised step, which has the highest runtime complexity in the whole clustering process. The two clustering steps follow a similar approach, implementing the Mahalanobis distance metric in the clustering process.
4. Testing and Evaluation Using Synthetic Data
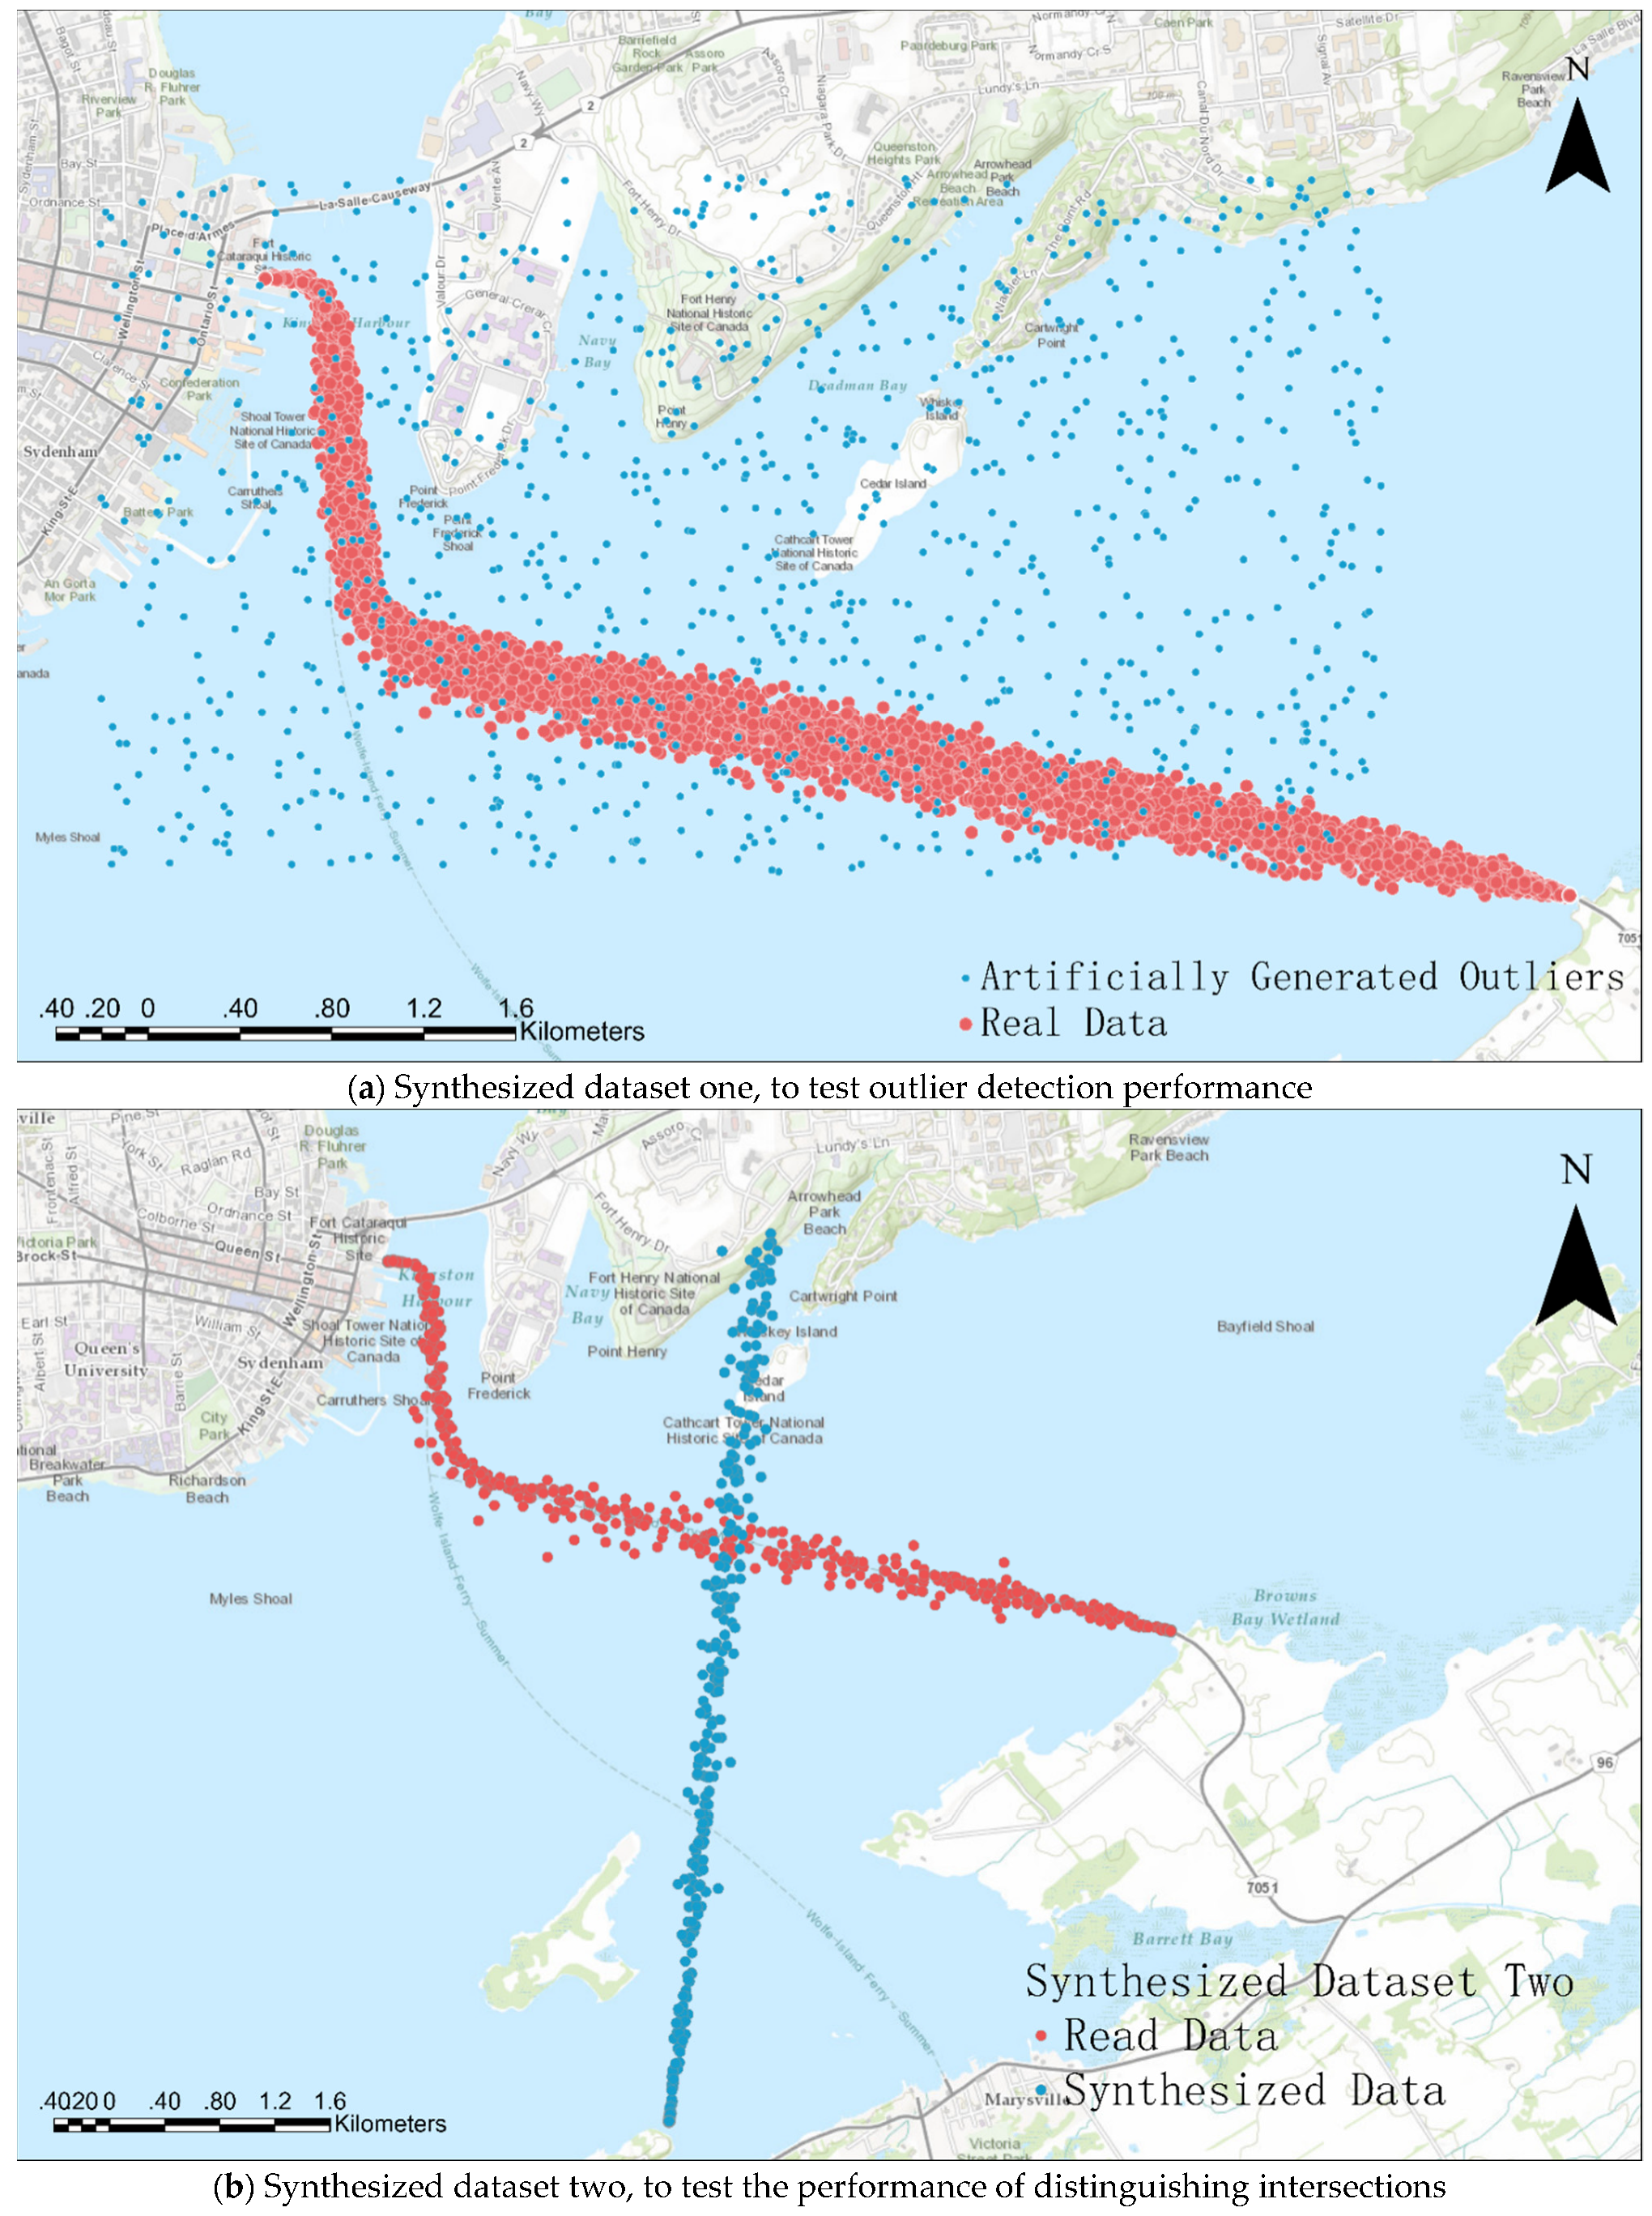
The performance of the proposed approach is tested with two synthetic datasets from Wolfe Island Ferry AIS data in January 2017, as the ferry traveled between Kingston and Wolfe Island. The open-source data was accessed from [52]. Figure 5 shows the real data in red and the synthetic data in blue. One hundred and fifty noisy points were artificially generated around the main trajectory in Figure 5a, while 2000 points were rotated by 90° in Figure 5b. The synthesized datasets were prepared to test clustering performance based on two scenarios. For instance, a good clustering algorithm should identify outliers and noisy points from the main trajectories. Additionally, the algorithm should distinguish different paths from trajectory intersections.
Figure 4 presents the framework for clustering a dataset after integrating the Mahalanobis distance into DBSCAN, representing the first-layer clustering in Figure 3. The raw data are firstly randomly split into two portions ensuring both datasets (Portion 1 and Portion 2) share the same point distributions. Portion 1 is required to contain at least 10,000 trajectory points so that the prepared training data is not biased due to overfitting. Usually, when the raw data is of extremely large size, 5% of the raw data will have more than 10,000 trajectory points, which is large enough to be used for preparing labeled training data.
The evaluation methods can be divided into two categories: internal evaluation and external evaluation. The differences between the two evaluation categories are whether external benchmarks or labels are referred to in the evaluation process. Internal evaluation methods evaluate clustering performance based on the clustering results themselves. External evaluation methods evaluate clustering results based on external pre-defined labels and benchmarks as ground truth. Further, the estimated number of clusters and noises are selected for the evaluation of the algorithms. The metrics selected in this research are: the estimated number of clusters and noises, entropy (homogeneity), purity (completeness), V-measure, adjusted Rand index, F-measure (F1 score), silhouette coefficient, Davies-Bouldin index, and Calinski-Harabasz index.
4.1. Internal Evaluation
The selected internal evaluation methods are the silhouette coefficient, Davies-Bouldin index, and Calinski-Harabasz index. All of them assign a ratio describing the average similarity within a cluster to the difference between clusters. The Davies-Bouldin index measures the similarities within clusters as the average Euclidean distance of all data points to the cluster centroid and measures the difference between clusters as the distance between cluster centroids. The lower the Davies-Bouldin index is, the better the clustering performance is. The silhouette coefficient measures the similarities within clusters as the mean intra-cluster distance and measures the difference as the mean nearest-cluster distance. The silhouette coefficient ranges from +1 (the best) to −1 (the worst). Both the Davies-Bouldin index and silhouette coefficient indicate that a good clustering result should group all closed points while clusters are distant from one another. The score of the Calinski-Harabasz index is calculated by the ratio between the within-cluster dispersion and the between-cluster dispersion. Thus, a good clustering result has a high Calinski-Harabasz index value.
However, the drawback of the internal criteria is obvious. High scores on an internal measure do not necessarily imply a more effective clustering method. Some of the clustering methods, take the k-means method as an example, optimize the clustering result using a similar model. Thus, internal criteria will be biased towards them and naturally assign them higher scores. Therefore, the internal evaluation metrics only provide a reference to understand the structure of the clusters and the clustering performance evaluation cannot entirely depend on them.
4.2. External Evaluation
The external evaluation measures how close the clustering result is to the predetermined ground truth. The selected external evaluation methods are completeness, homogeneity, V-measure, F1 score (F-measure), and adjusted Rand index. Completeness, homogeneity, and V-measure scores are the metrics used to evaluate the clustering performance based on normalized conditional entropy measures of the clustering labeling. Entropy is a measure of the amount of disorder in a vector. Homogeneity score (h) is maximized when all of its clusters contain only data points from a single class. Completeness score (c) is maximized when all the data points from a given class are elements of the same cluster. The V-measure is the harmonic mean between homogeneity and completeness. All three metric scores range from 0 to 1. The greater values indicate better clustering performance. Adjusted Rand index and F1 score measures the clustering results’ overall accuracy compared to the ground truth. The Rand index measures the percentage of correct decisions, which is simply accuracy. The Rand index gives equal weight to false positives and false negatives. However, separating similar documents (FN) is usually worse than putting pairs of different documents in the same cluster (FP). To solve this problem, the F-measure penalizes FN more strongly than FP by selecting a value β > 1, thus giving more weight to recall. The greater the F-measure, the better the clustering results.
However, the external evaluations require the assumption that a factual ground truth exists for any real or synthetic dataset, and human experts can generate them as training data. In addition, the challenge of creating accurate ground-truth data is that the core concept of clustering methods does not entirely fit the assumption. Various clustering methods can group the data while discovering complex but unknown similarities between the data. The given ground truth will exclude any other possibilities for clustering the dataset. In our case, the external evaluation uses subjective ground truth and evaluates how much the clustering results match it. The ground-truth labels are manually pre-defined to the two synthesized datasets.
4.3. Enhanced DBSCAN Algorithm Performance Evaluation
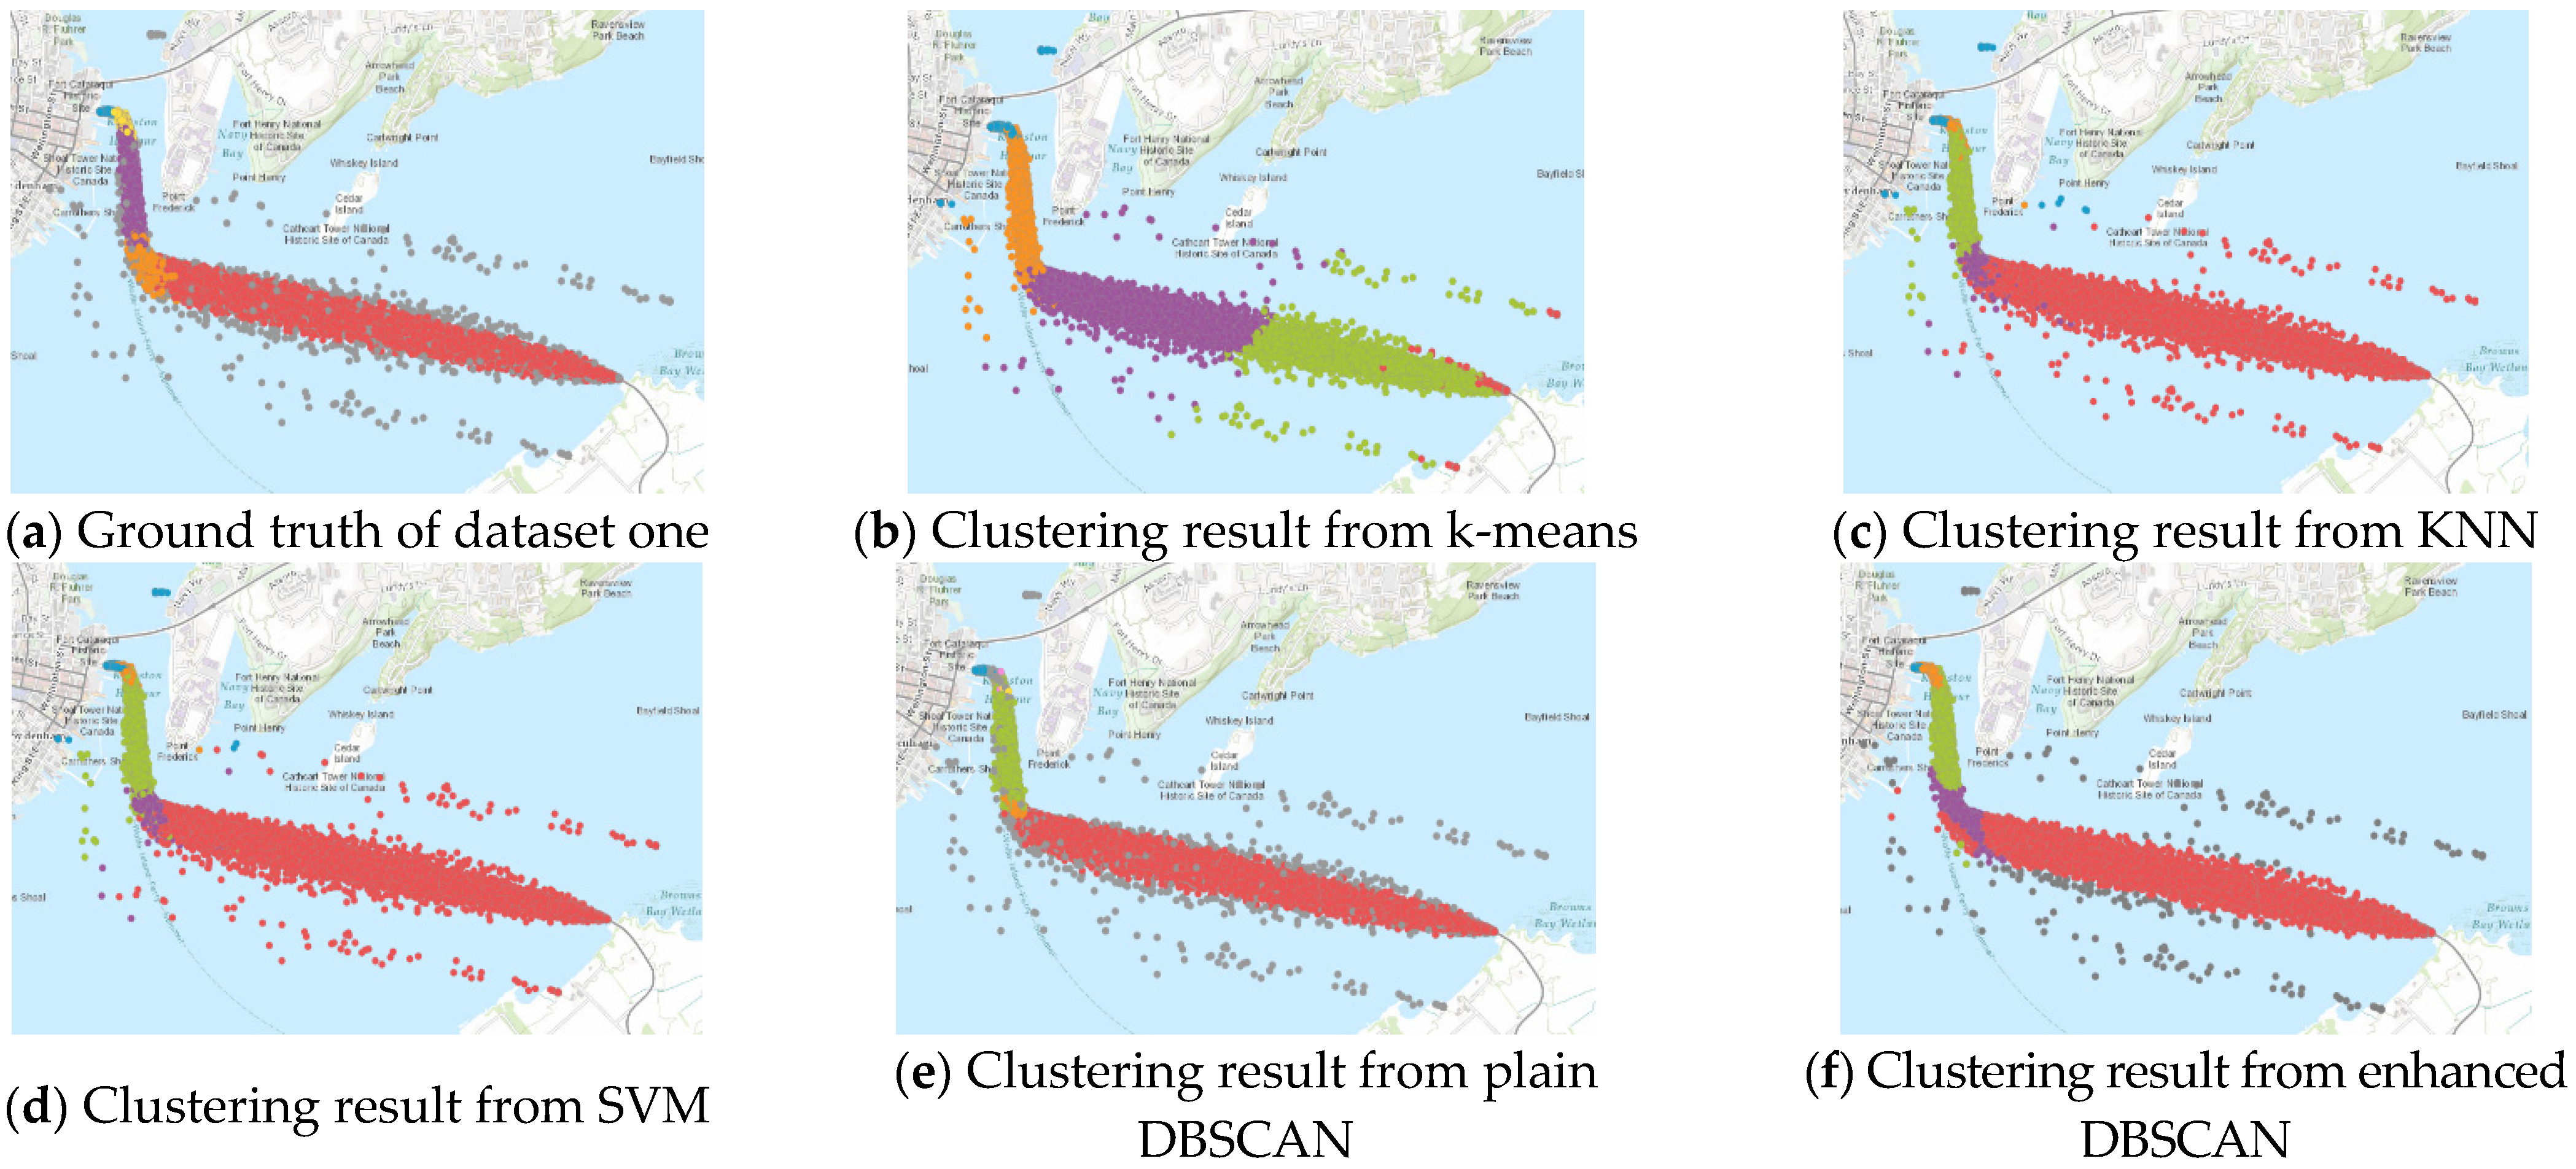
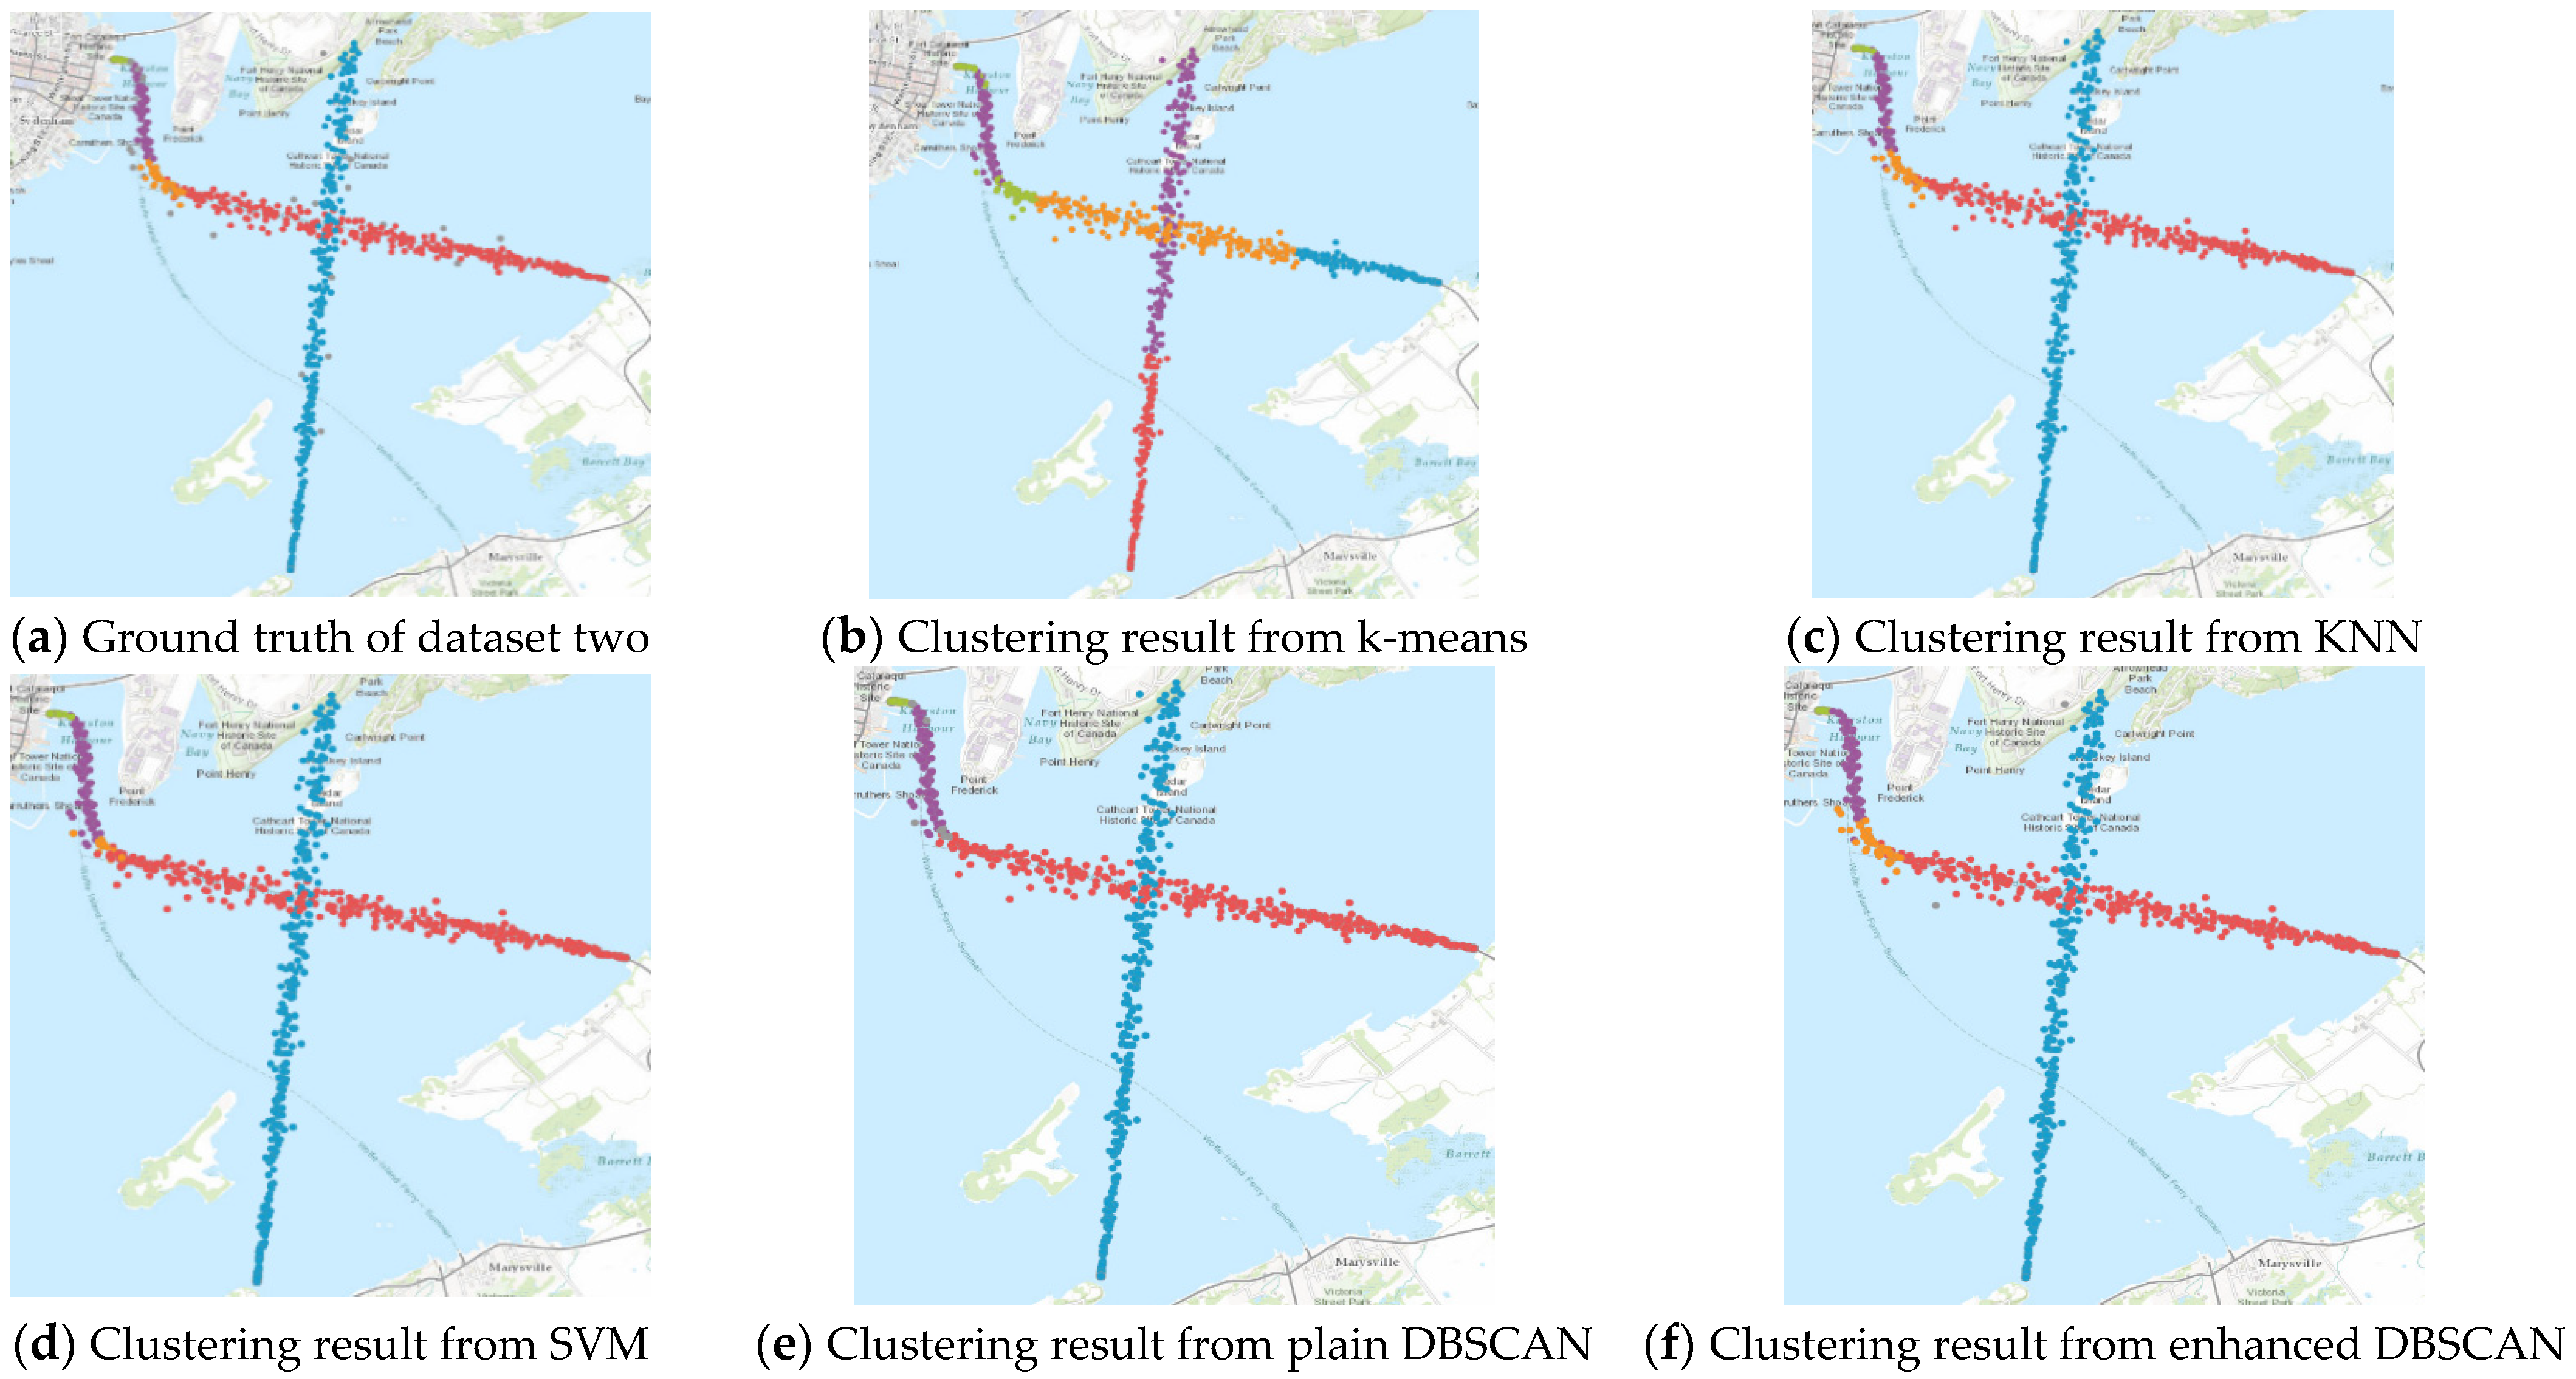
Various commonly used machine learning algorithms are selected as references for the testing datasets. Finally, the clustering results from the proposed enhanced DBSCAN method are compared to k-means, k-nearest neighbors (KNN), support vector machines (SVM), and traditional DBSCAN methods. Figure 6 and Figure 7 show the clustering results of the two synthesized datasets.
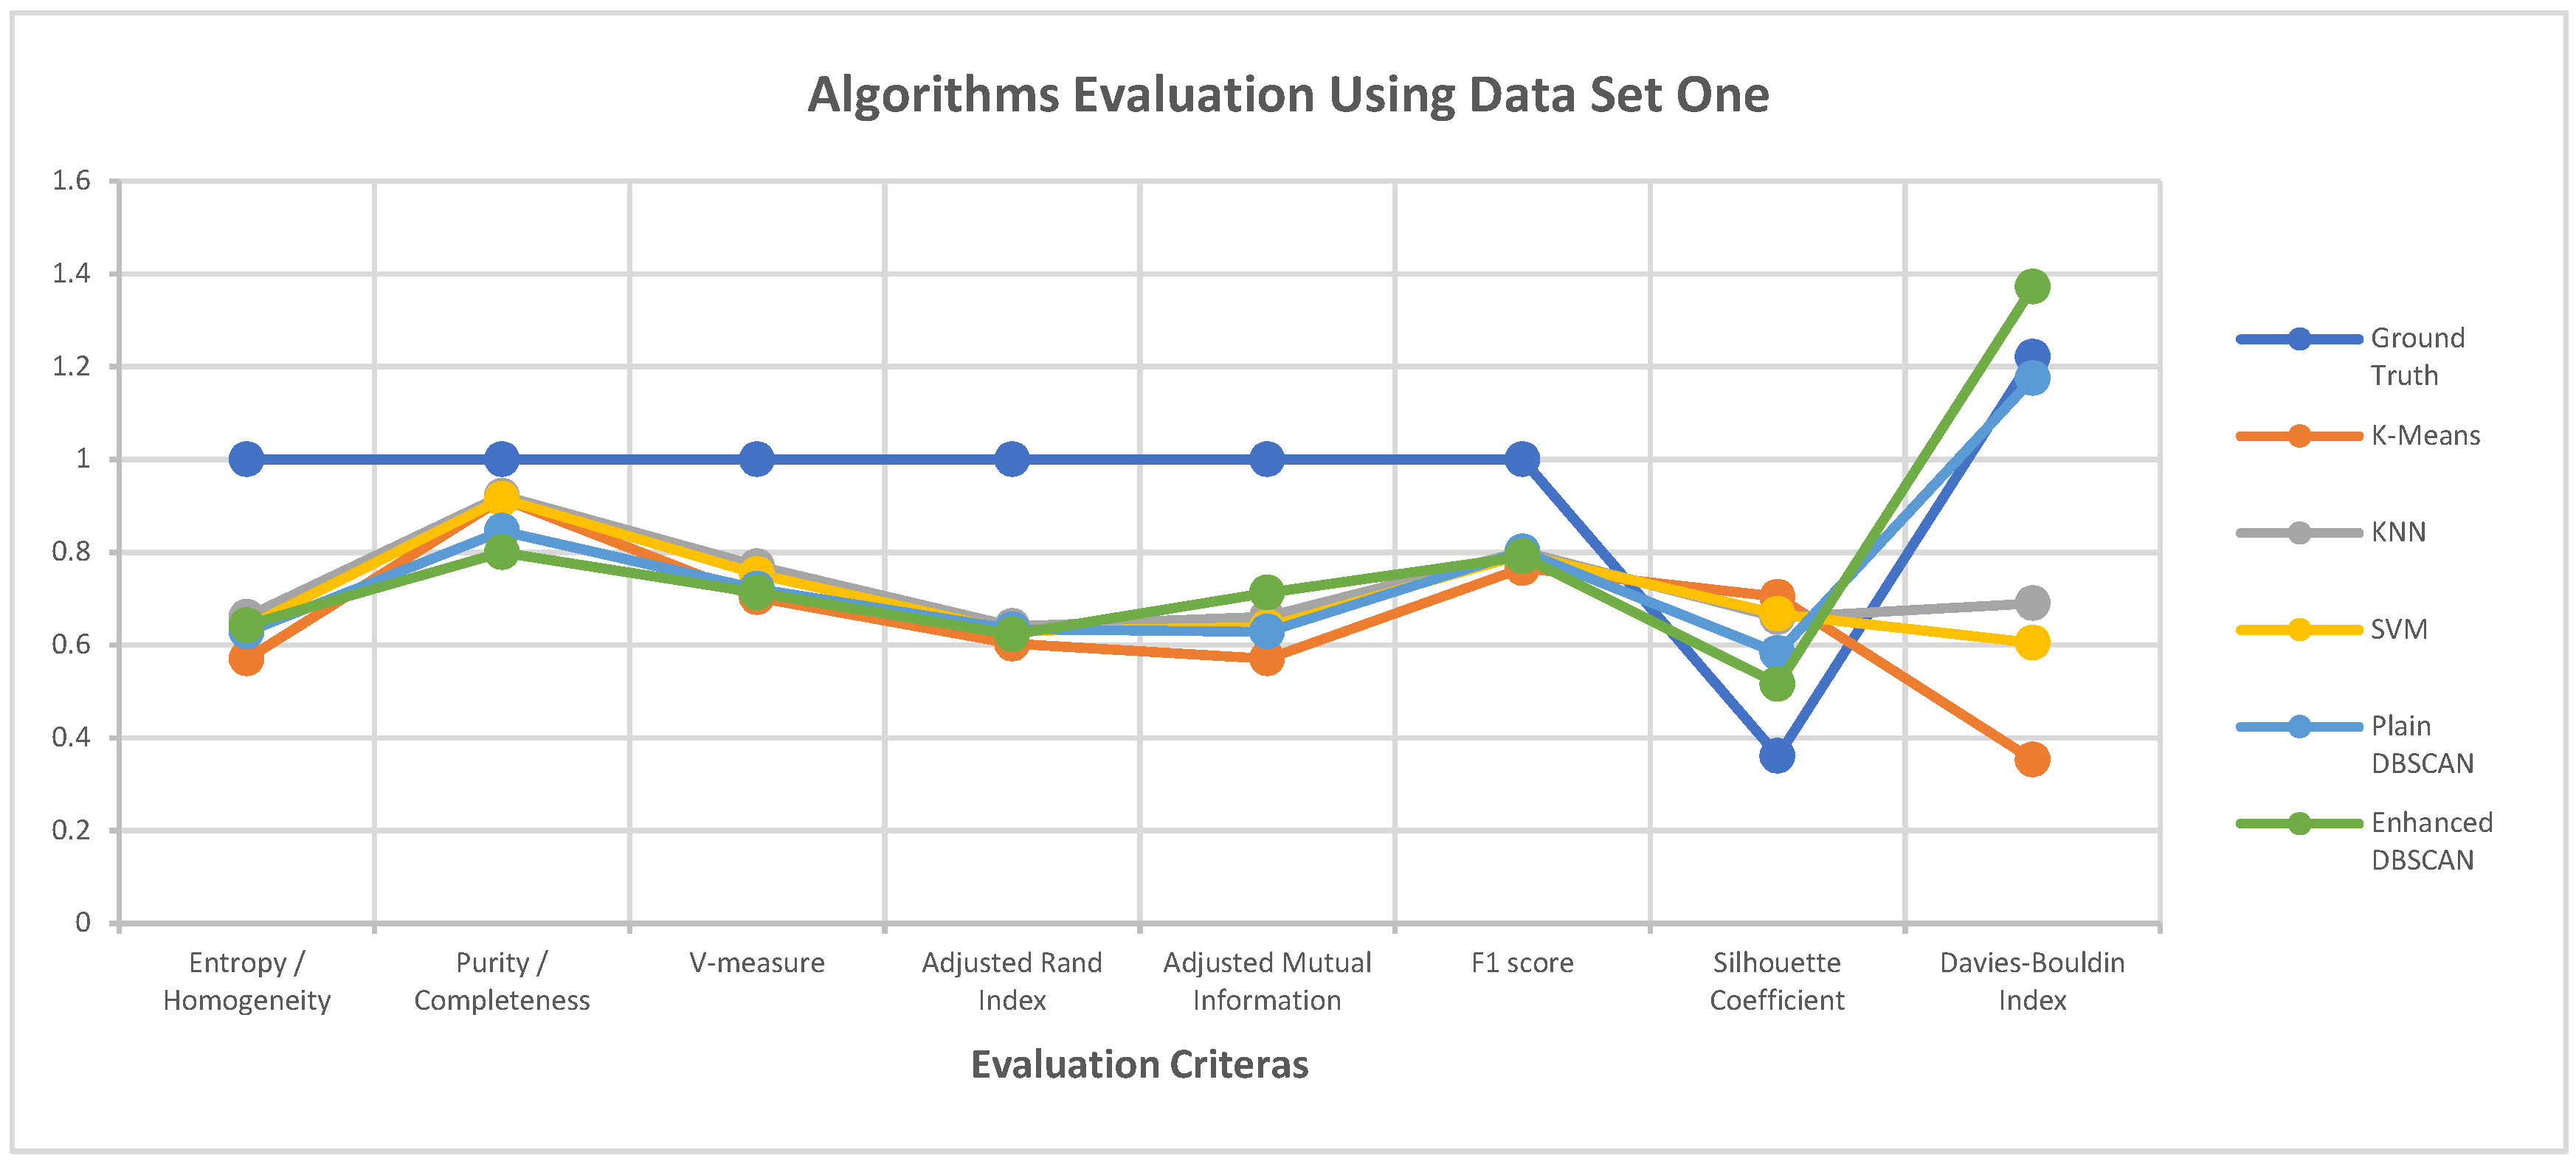
As mentioned in Section 4, the performance of the proposed clustering algorithm is assessed using the selected metrics. Table 1 states the values of the clustering performance metrics for all clustering algorithms. Figure 8 and Figure 9 illustrate the values of each clustering performance metric. Different colours are used to represent different performance metrics. The results indicate that the performance of the proposed approach is highest in Figure 8 and Figure 9, and Table 1. The enhanced DBSCAN method maintains a high level of performance in terms of external evaluation metrics, compared to supervised algorithms like KNN and SVM, as expected. The results from the enhanced algorithm are also very similar to the ground truth concerning internal evaluation metrics. The proposed clustering algorithm then outperforms k-means, KNN, and SVM at outlier detection. Overall, the proposed algorithm’s clustering performance is high quality and can be implemented on big datasets.
As indicated in Section 3.4, we used a point-based clustering approach to cluster AIS point data first to determine stages within each trajectory. Then, we designed a framework to conduct second-layer clustering to extract the vessel behaviour patterns. The proposed clustering algorithms were compared against common unsupervised and supervised clustering algorithms. For future work, the research could be evaluated by comparing it against the applications on marine transportation modeling. Direct comparison on clustering points in trajectories to define stages has been done in [5,53]. Indirect comparison on clustering trajectories has been done in [30,31]. Combining DBSCAN with recurrent neural networks (RNN) can develop a more comprehensive modeling system, which is a further research direction.
5. Case Studies and Results
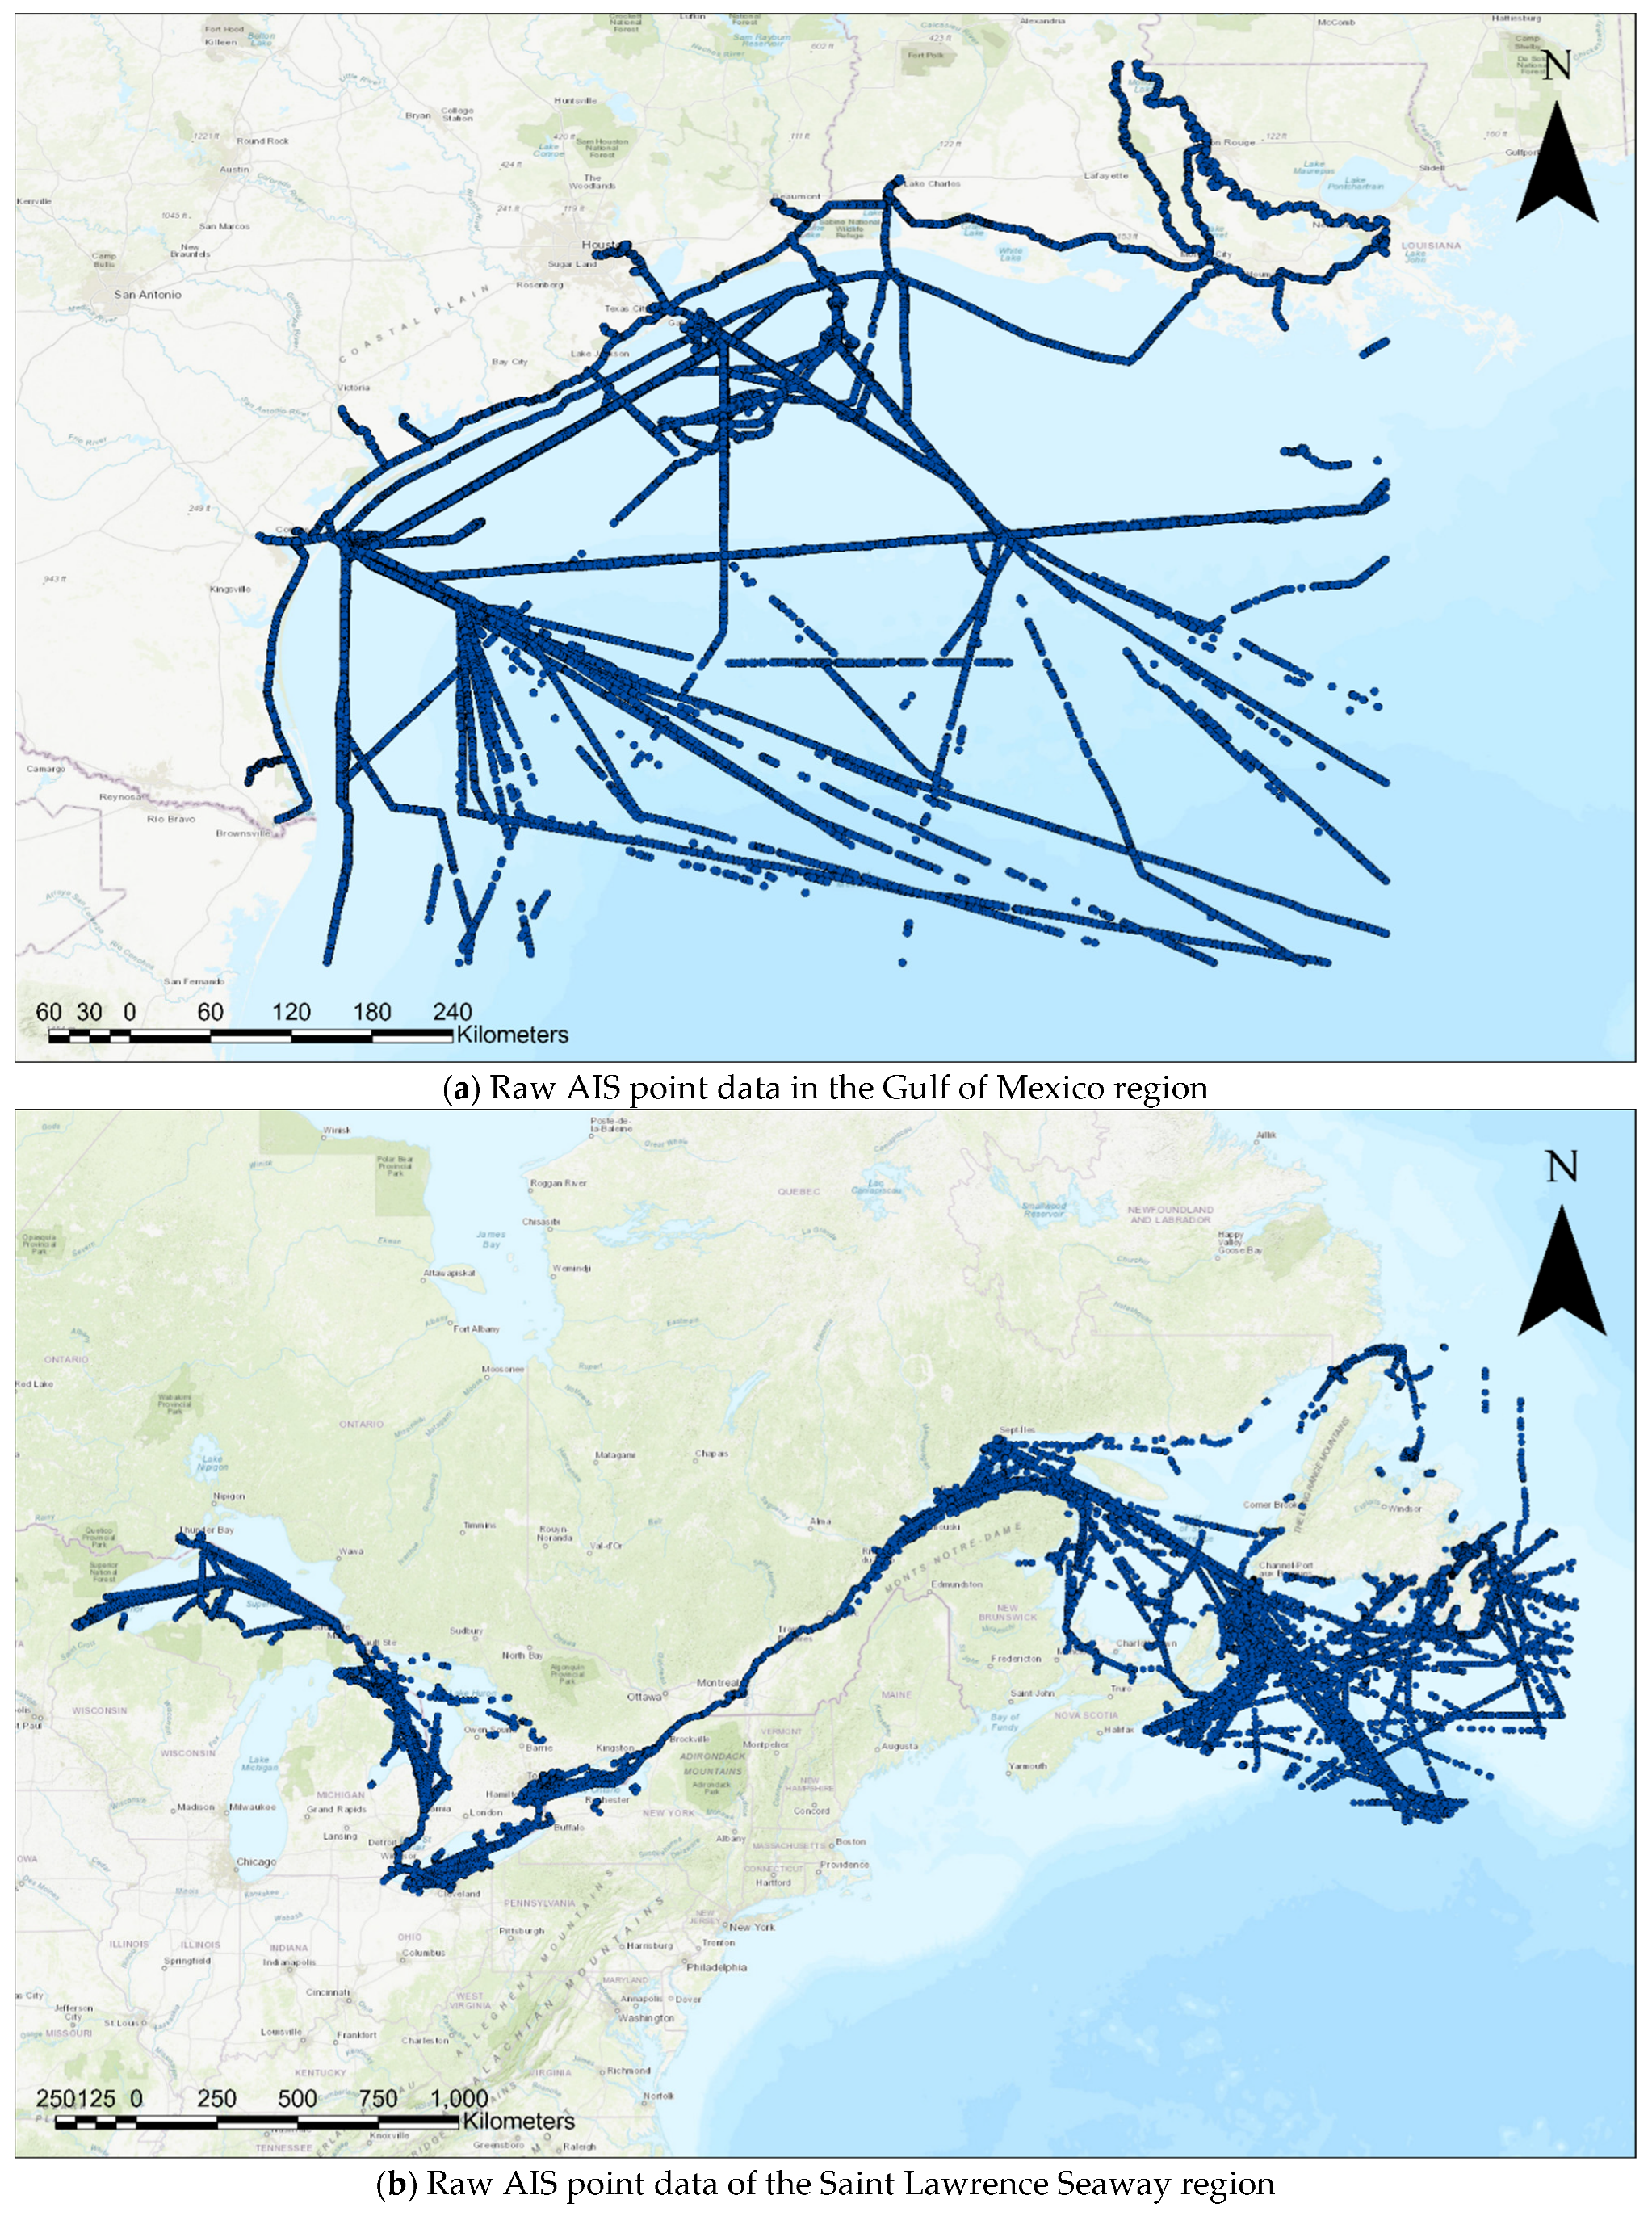
The proposed clustering algorithm has been implemented on big data in the Gulf of Mexico region, as well as in the Saint Lawrence Seaway and Great Lakes region, and models to monitor vessels in those regions have been generated. In the first case, around 200 MB of open-source data for the Gulf of Mexico region was accessed from [52]. In the second case, three-day AIS data was purchased from ORBCOMM (a maritime AIS data provider). The Gulf of Mexico region data is from the whole month of January 2017 and contains data of 70 MMSIs, including around 1.2 million trajectory points to be clustered. The Saint Lawrence Seaway region dataset is around 17 MB, describing the vessel movement history from 1 June 2017 to 3 June 2017. The data contain around 135,000 trajectory points to be clustered. The raw data is illustrated in Figure 10.
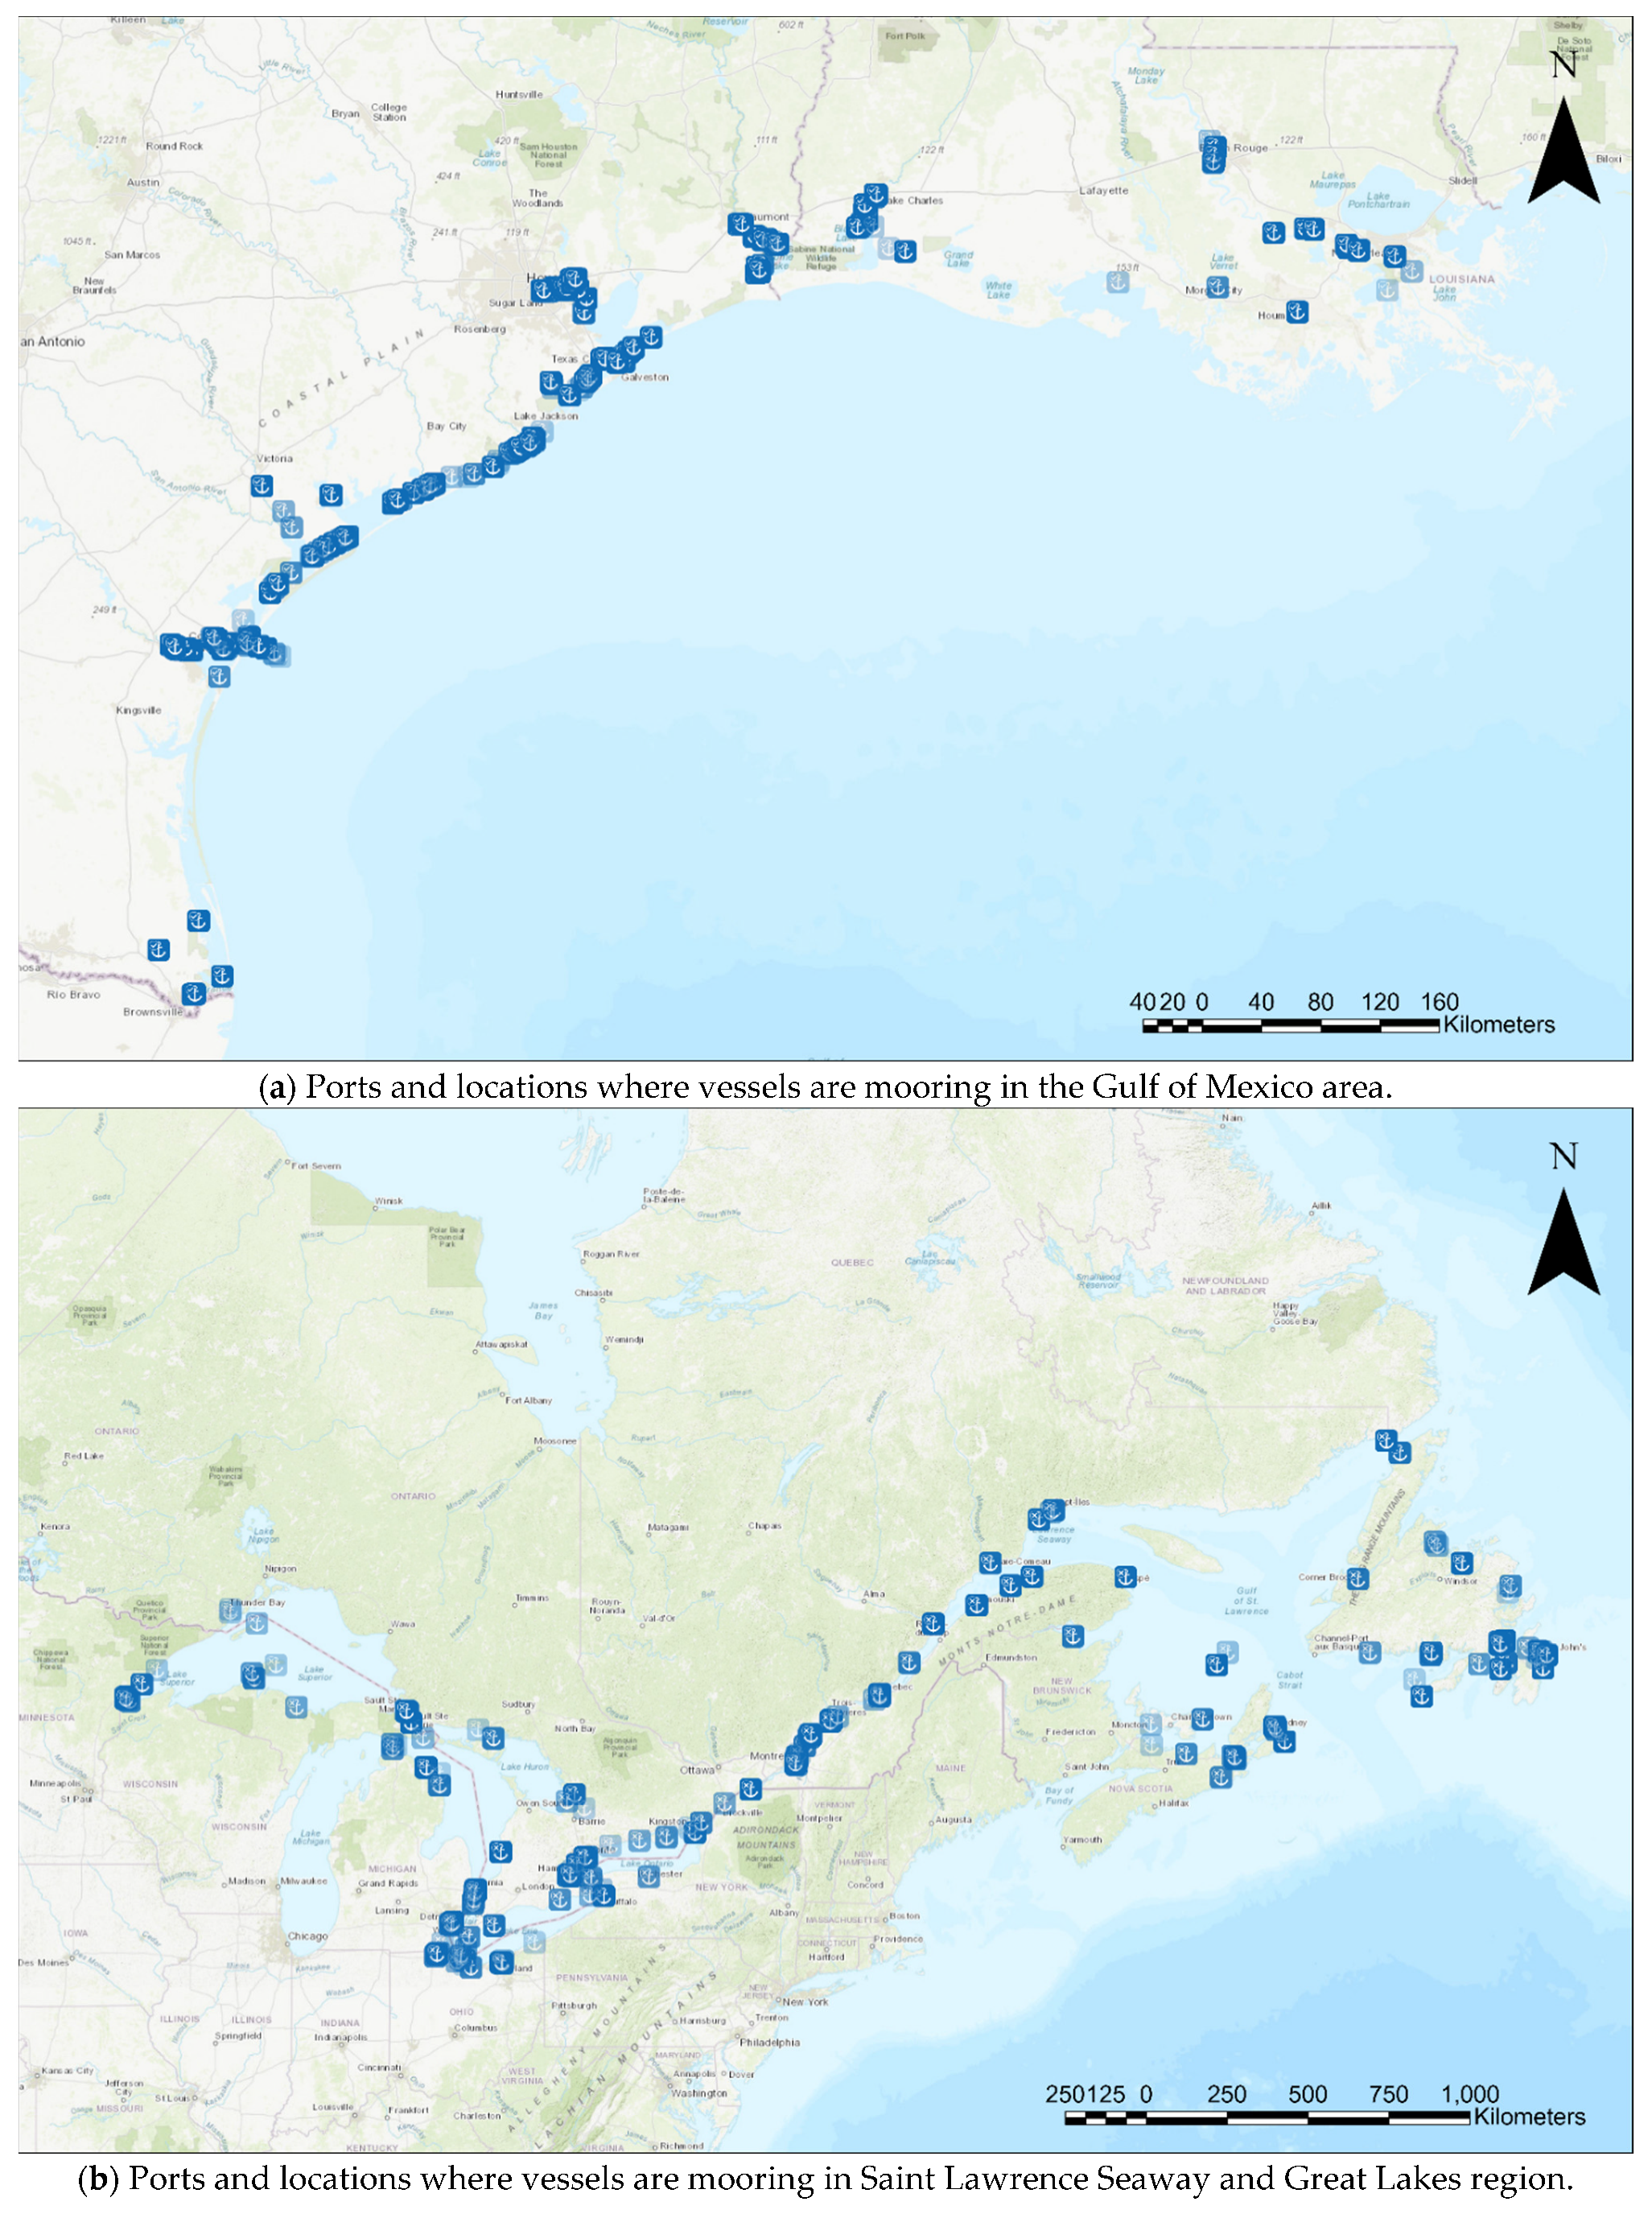
The enhanced DBSCAN clustering method has been implemented on the two datasets to generate clustering results. One of the applications from analyzing the clustering results is to detect port areas. For example, the places where all the vessels are moored in the Gulf of Mexico region, as well as the Saint Lawrence Seaway and Great Lakes region, are shown in Figure 11.
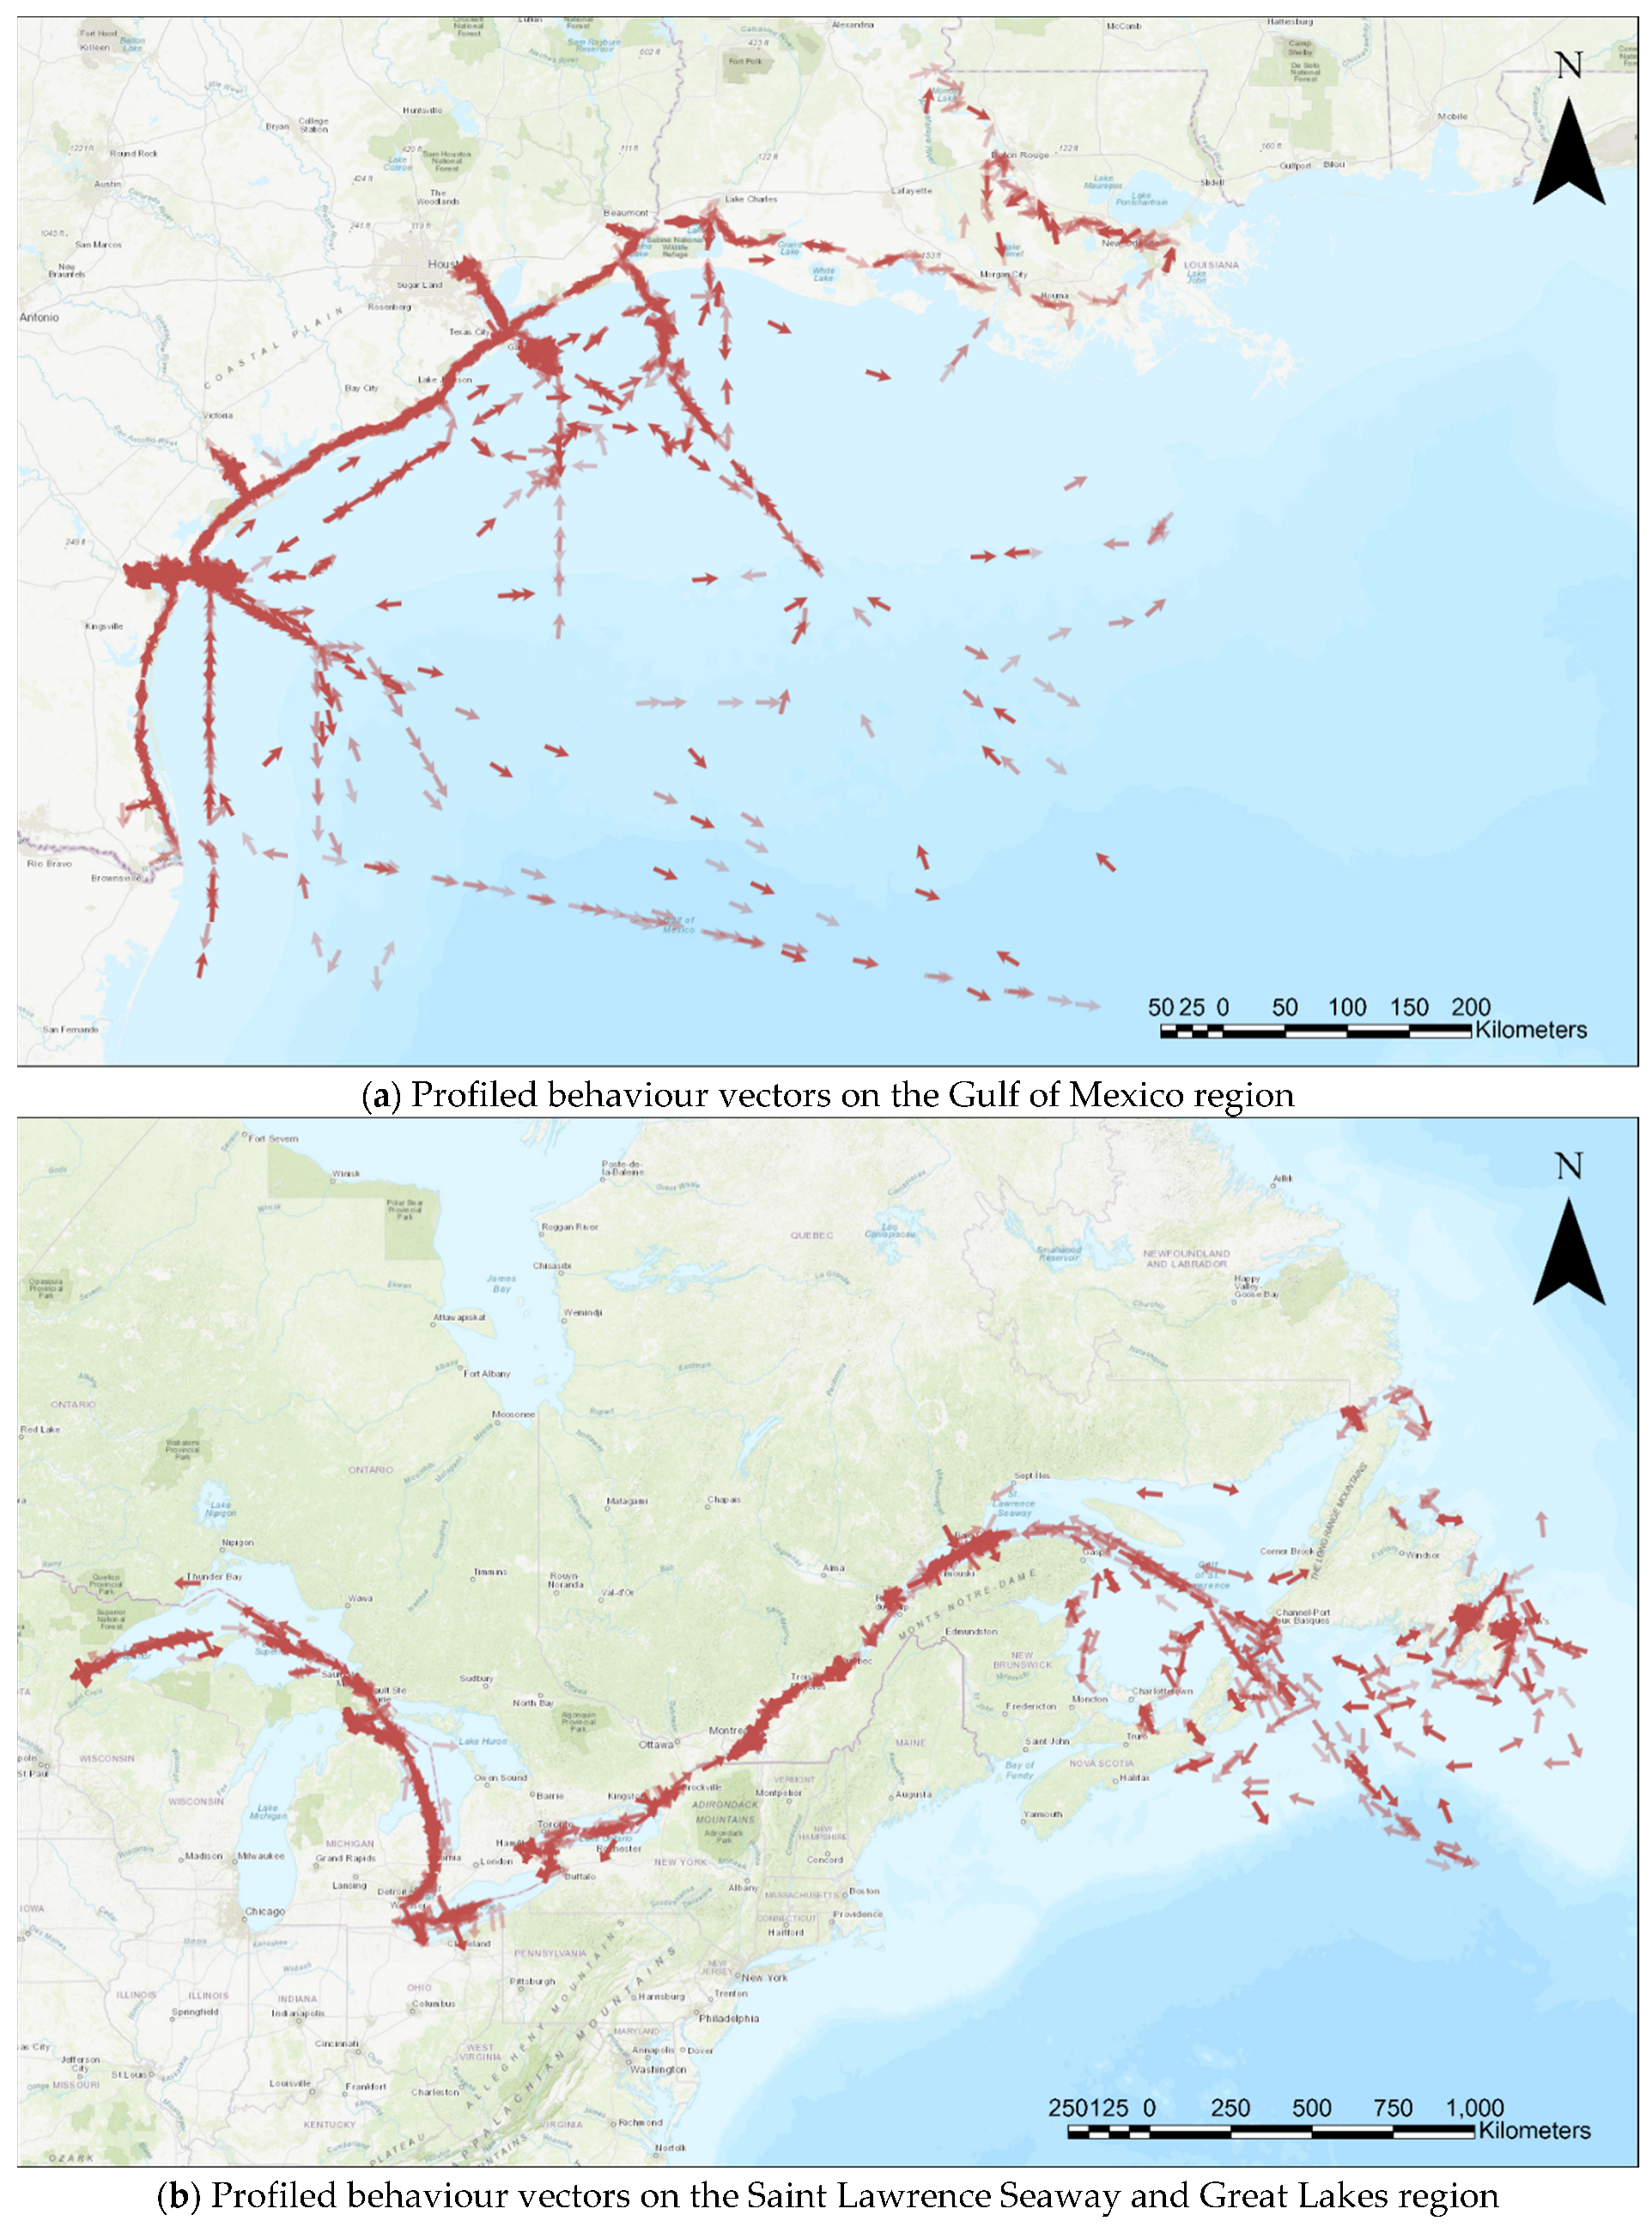
New behaviour vectors are created by averaging the attributes and considering data size as weights. In Figure 12, behaviour vectors are represented as arrows for each dataset. The data size is presented as darkness level, and the directions of the arrows present the heading.
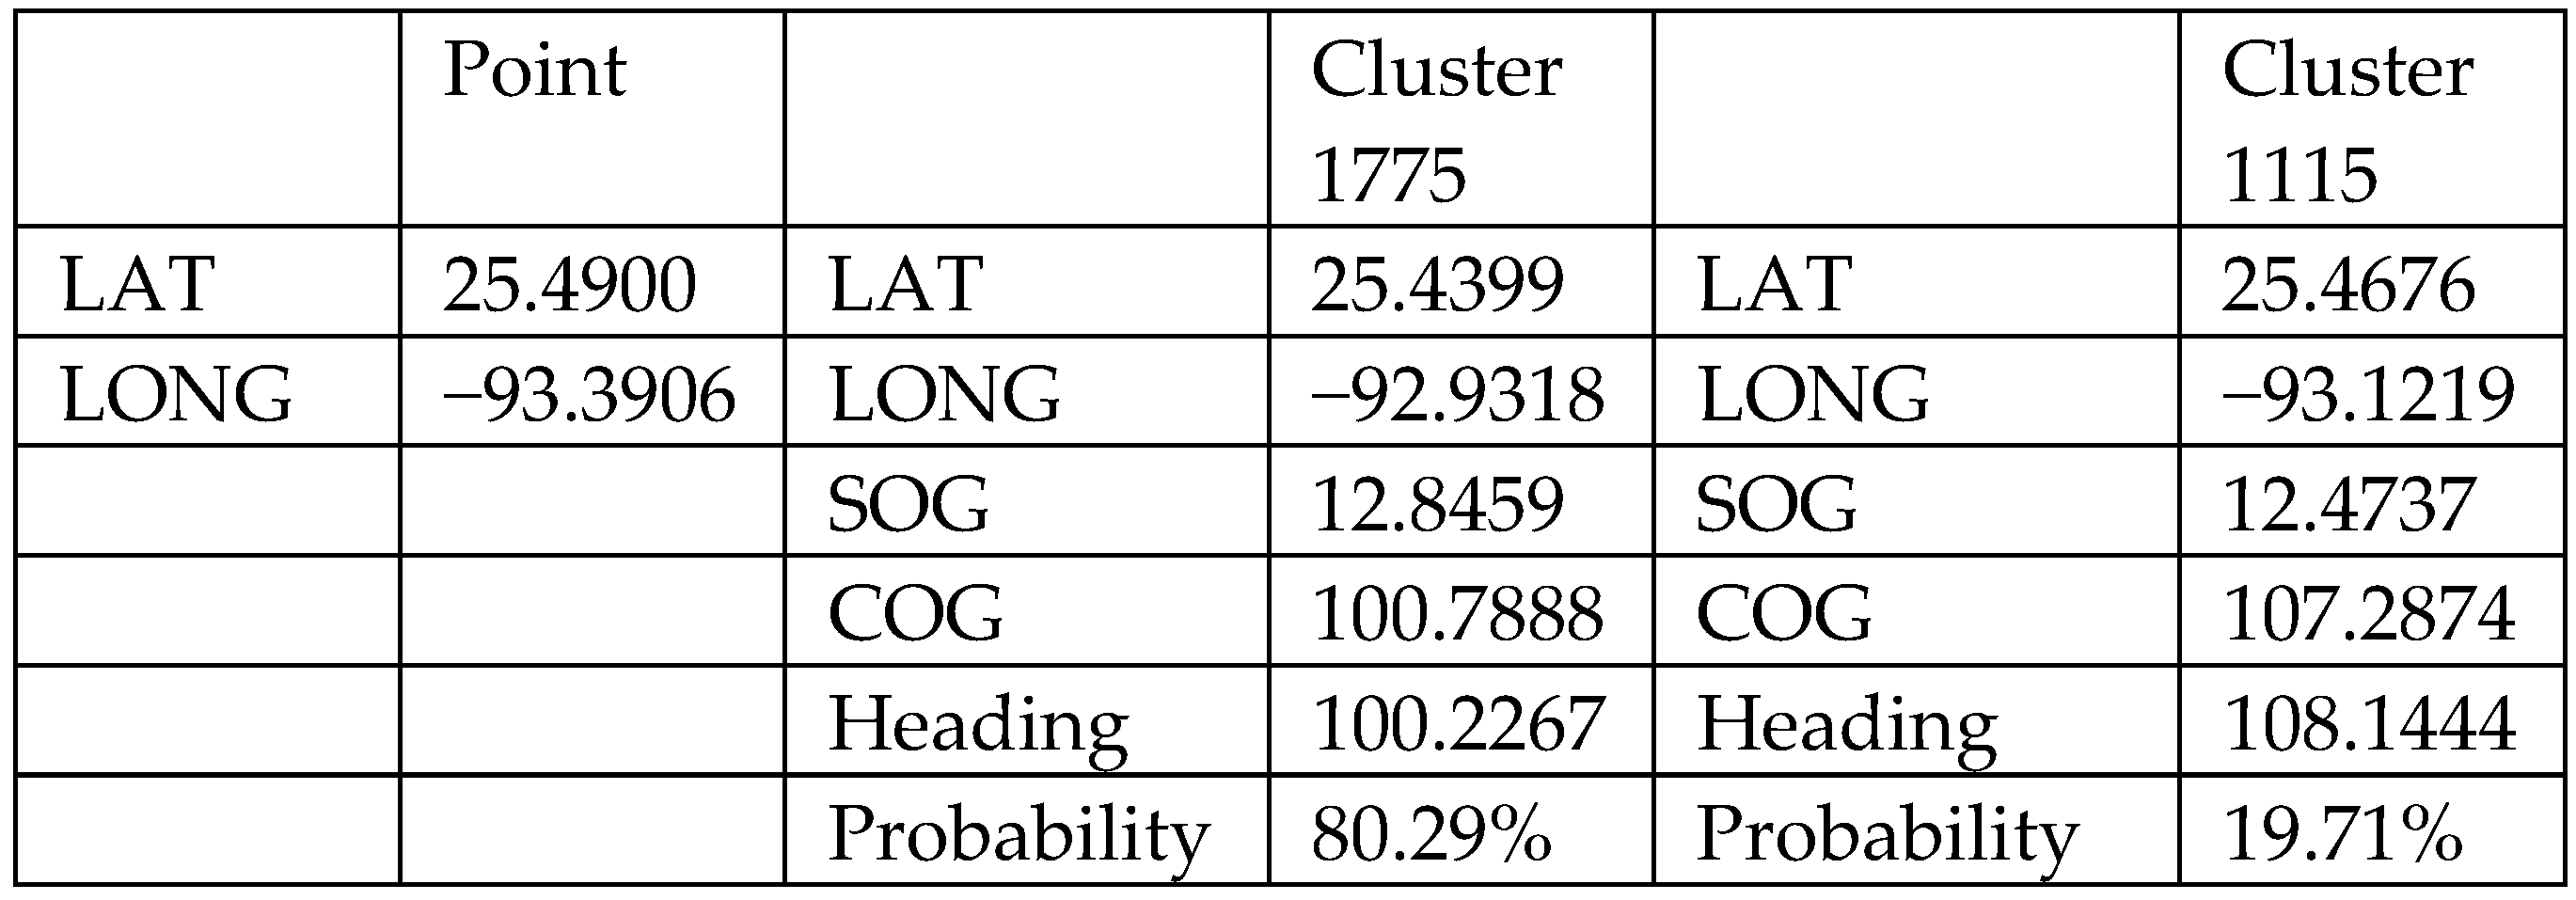
Taking advantage of the final clustering results, vessel behaviour recommendation and anomaly detection models have been developed. Given the vessel location, the model will recommend what the vessel should do based on the well-organized training data. An example is shown in Figure 13. For a vessel located at phi = 25.49 and lambda = −93.3906, the recommendation model calculates the Euclidean distance to all profiled behaviour vectors and finds the two closest clusters (cluster 1775 and cluster 1115). The corresponding probabilities are found using the ratio of the inverse of the distance, giving the closer cluster a higher weight when providing possible vessel actions to the vessel at the location. The recommendation model, at the current stage, only recommends speed and heading. When the model becomes more comprehensive in the future, more advanced information can be provided, such as destinations and routes associated with the specific clusters.
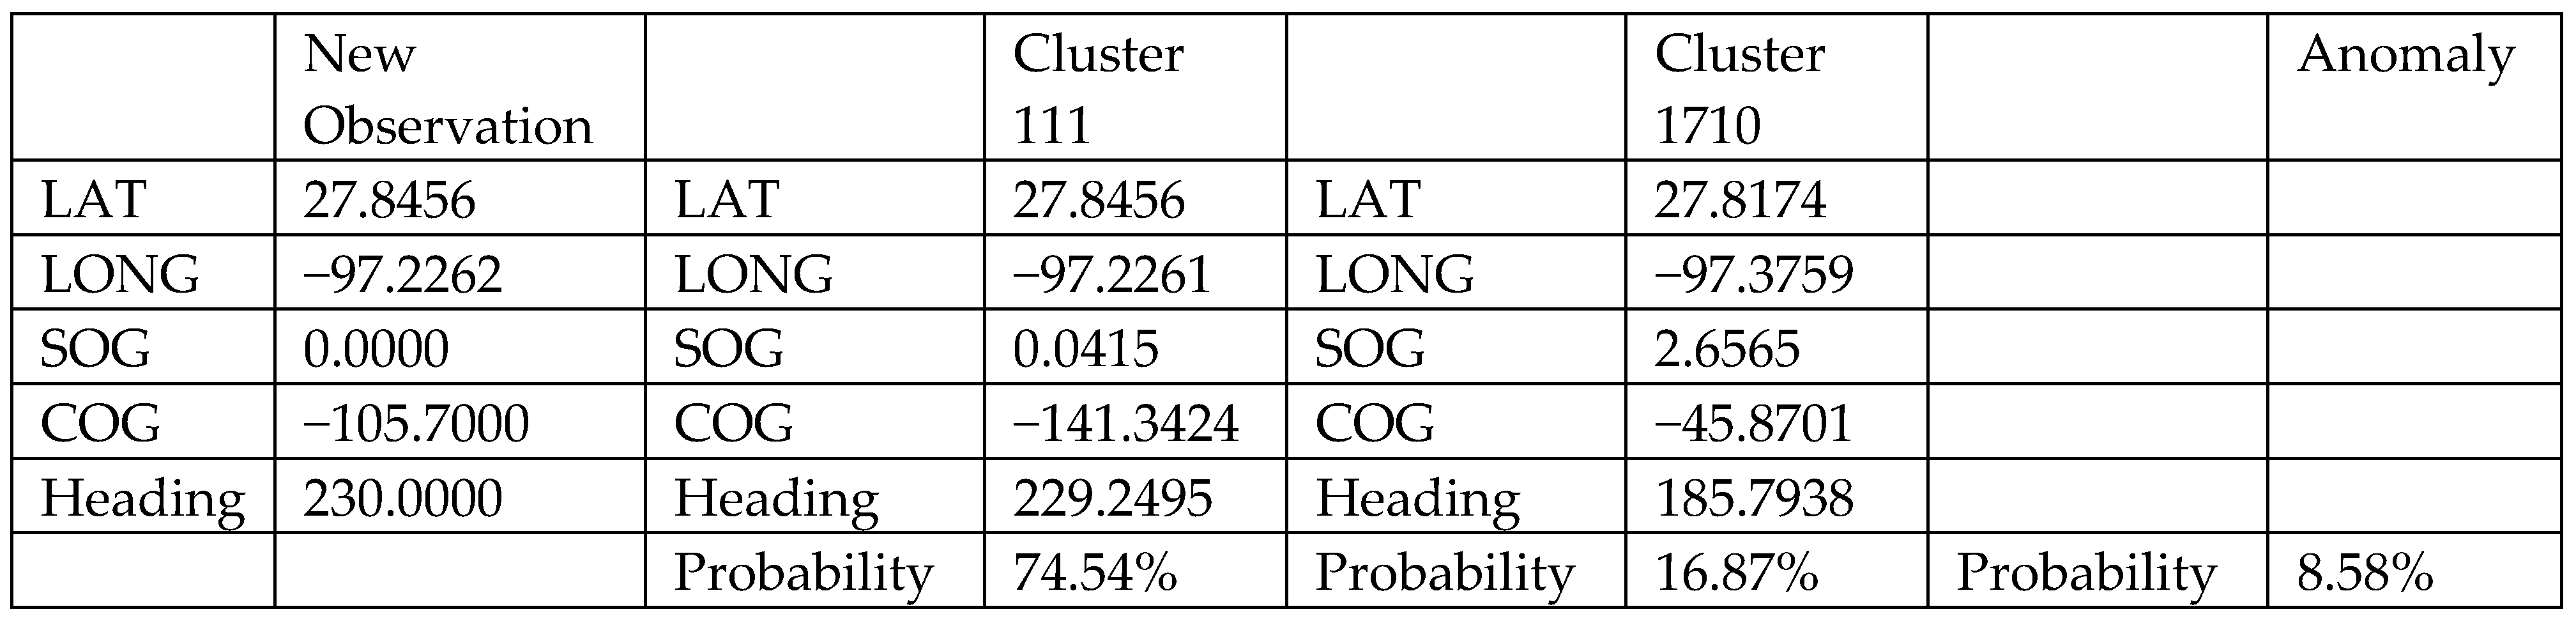
The anomaly detection model has also been developed from the final clustering result. The algorithm is the same as the supervised component of the proposed enhanced DBSCAN method. Based on the new observations, the model calculates the Mahalanobis distance to the two closest clusters and determines which cluster the data belongs to. The model can also provide probabilities that the vessel has anomalous behaviours. The example is shown in Figure 14. The model reads the AIS signal from the monitored vessel and finds matches with the well-organized clusters (cluster 111 and cluster 1710) with corresponding probabilities. For an AIS signal from the monitored vessel, the anomaly detection model calculates the Mahalanobis distance to all profiled AIS cluster vectors and finds the two closest clusters (cluster 111 and cluster 1710). The corresponding probabilities are found using the ratio of the inverse of the distance, giving the closer cluster higher probabilities to be matched with the monitored vessel. The anomaly detection model, at the current stage, detects anomalous behaviours with respect to all clusters. In the future when the model becomes more comprehensive, more advanced information can be used for detecting anomalous behaviours associated with specific routes.
6. Concluding Remarks
6.1. Summary and Contribution
The research proposes an enhanced DBSCAN approach by optimizing clustering performance in terms of homogeneity, completeness, and other evaluation metrics. The research also proposes a clustering framework that can be implemented on big data, generating clustering results for two case studies. Finally, the proposed method results in the models for vessel action recommendations and vessel behaviour detection for outliers in the case study regions.
A clustering method has been proposed to enhance the DBSCAN clustering method by integrating the Mahalanobis distance metric. The optimized clustering method outperforms the traditional DBSCAN method by considering correlations among the points and reducing computational cost. The enhanced DBSCAN method using Mahalanobis distance can handle scale and correlation issues better than the traditional DBSCAN method by using Euclidean distance. In this work, a straightforward way to find the key parameters required by the enhanced DBSCAN has been developed, making the method consistent when applied to big data. The proposed algorithm has also been thoroughly compared with other commonly used clustering algorithms in designed validation experiments. It has been evaluated using both internal and external clustering evaluation metrics, and the results indicate high performance levels for the proposed algorithm.
Based on the developed algorithm, a clustering framework that can be efficiently applied to big data is proposed. In addition to geospatial information, the framework takes speed and heading into account when clustering the vessels. Furthermore, by defining the point data as a novel five-dimensional vector, the clustering algorithm can find insights and discoveries under the more complex concept of “density reachability”. The hierarchical clustering framework comprises layers of clustering, utilizing both the unsupervised and supervised components of the proposed clustering algorithm. The proposed clustering framework has been implemented using novel high-dimensional data to represent historical AIS data for modeling vessel behaviours.
The clustering results generate models for maritime traffic patterns and vessel behaviour anomaly detection. Two big datasets were used for the case studies. The first study area is the Gulf of Mexico, and the second is the Saint Lawrence Seaway and Great Lakes region. The paper presents how the first model gives recommendations for actions based on the information coming from the vessel and how the second model detects behaviour anomalies of the vessel. The results indicate that the proposed framework can effectively model vessel behaviours in these two water areas and show its potential to work in other regions.
The enhanced DBSCAN method brings new possibilities and understanding of clustering. The proposed parameter auto-selecting method facilitates clustering tasks and reduces the effort expending on trial-and-error methods to identify suitable parameters. The enhanced DBSCAN clustering method and proposed framework implemented on historical AIS data also contributes to modeling marine transportation and autonomous vessels research. In addition, this research proposed a way to monitor crewed vessels, provided foundations for vessel route planning and vessel behaviour anomaly detection, and can be applied to more general data analytics tasks. Beyond contributions to marine transportation modeling, a similar clustering framework can also be applied to similar tasks on modeling data from other moving objects, such as Automatic Dependent Surveillance-Broadcast (ADS-B) data, data from pedestrians, data from vehicles, and data from UAVs. The proposed clustering algorithm and framework can also be applied to social media and video platform user analysis by profiling user behaviours and organizing content, to design advertisements or content-promotion algorithms. While providing a possible process for analyzing, clustering, and modeling AIS data, the enhanced DBSCAN and hierarchy-clustering framework can be applied to organize other raw unlabeled data and facilitating preparing labeled training data using descriptor data clustering. The framework also provides a foundation for active learning. The framework can be further modified into an interactive process taking advantage of the designed semi-supervised process. The machine learning community will be tremendously benefited as it can help reduce the efforts needed to prepare large training data when generating AI models.
6.2. Future Work and Perspectives
The proposed method is based on assumptions that marine AIS data contain valuable insights into vessel behaviour patterns that can be discovered by systematically studying them. To verify the assumption, raw, unlabelled AIS trajectory data must be controlled for quality. Even though the proposed framework provides the ability to filter out outliers from the trajectory, a more robust methodology may be needed to make determinations about the whole trajectory. A pre-processing procedure to filter out the anomalous AIS trajectory data should be implemented in the future to ensure the quality of the training data.
Working with data whose distribution is heavily uneven has been challenging. This work proposed an intuitive approach to finding parameters for enhanced DBSCAN. However, since the parameters are defined by prioritizing the filtering out of outliers, the results are not optimal for datasets where the outliers are valuable observations. For example, in some datasets, the majority of the point data is concentrated in port areas. The proposed algorithm will mistakenly detect the main trajectories as outliers based on how the parameters are defined. Furthermore, some datasets are not distinct enough in certain stages to be separated from each other. Thus, the proposed parameter selection method can be unreliable when obtaining clusters composed of homogenous points. The parameter setting still requires adjustments from the user, and a more automated modification should be planned in the future.
While the limitations listed above need to be addressed, there are also two additional aspects of the research that can be expanded in the future. First, the proposed clustering method works on five-dimensional point data taken from a specific point in time, and the profile behaviours are determined based on the clustering results without considering the trajectory. A long short-term-memory (LSTM) concept could be applied to the clustering process by integrating another time dimension. For example, the vector data could be influenced by its behaviour history and giving more weight to the immediately preceding vectors. By doing this, data could be more accurately profiled, and the generated model could make better behaviour predictions. Second, the framework could be further modified into an active learning model with an interactive labeling process. The clustering framework can generate accurate clustering results with minimal human effort and computational cost by iteratively returning the least reliable clustering results from the unsupervised component and manually modifying the labels. Beyond the machine learning and data mining methods mentioned in this paper, such as k-means, KNN, and SVM, we also plan to expand our investigation to include unsupervised neural networks, such as deep k-means and autoencoder types.
Author Contributions
Conceptualization, X.H., C.A. and M.J.; methodology, X.H., C.A. and M.J.; software, X.H.; validation, X.H., C.A. and M.J.; formal analysis, X.H.; investigation, X.H.; resources, X.H.; data curation, X.H.; original draft preparation, X.H.; review and editing, C.A. and M.J.; visualization, X.H.; supervision, C.A. and M.J.; project administration, X.H.; funding acquisition, C.A. and M.J. All authors have read and agreed to the published version of the manuscript.
Funding
This research was funded by the Natural Sciences and Engineering Research Council of Canada (NSERC), Mitacs, and York University.
Institutional Review Board Statement
Not applicable.
Informed Consent Statement
Not applicable.
Data Availability Statement
The AIS data for the Gulf of Mexico are available in a publicly accessible repository: marinecadastre.gov/ais/ (accessed on 14 December 2020). The AIS data for the Saint Lawrence Seaway and Great Lakes region are licensed data from ORBCOMM and are not publicly available.
Acknowledgments
We would like to acknowledge the Bureau of Ocean Energy Management (BOEM) and the National Oceanic and Atmospheric Administration (NOAA) for providing open-source authoritative AIS data for the Gulf of Mexico, and ORBCOMM for providing licensed AIS data for the Saint Lawrence Seaway and Great Lakes region. This work has been financially supported by the Natural Sciences and Engineering Research Council of Canada (NSERC Discovery grants), Fisheries and Oceans Canada, MITACS, and York University. Special thanks go to Eleni Armenakis and Aman Ullah Usmani for helping language proof reading of the paper. Acknowledgement of organizations or individuals are for the reasons provided and does not imply endorsement of the work and finding presented in this paper.
Conflicts of Interest
The authors declare no conflict of interest. The funders had no role in the study; in the collection, analyses, or interpretation of data; in the writing of the manuscript; or in the decision to publish the results.
References
- Marr, B. The Incredible Autonomous Ships of the Future: Run by Artificial Intelligence Rather Than a Crew. Forbes Magazine. 11 June 2019. Available online: www.forbes.com/sites/bernardmarr/2019/06/05/the-incredible-autonomous-ships-of-the-future-run-by-artificial-intelligence-rather-than-a-crew/#5c8508176fbf (accessed on 14 December 2020).
- Merkel, D. Autonomous Ships, Opportunities & Challenges. 2019. Available online: www.marinelink.com/news/autonomous-ships-opportunities-challenges-471609 (accessed on 10 October 2019).
- Vespe, M.; Visentini, I.; Bryan, K.; Braca, P. Unsupervised Learning of Maritime Traffic Patterns for Anomaly Detection; IET Conference Publications: London, UK, 2012; pp. 1–5. [Google Scholar] [CrossRef]
- Jallal, C. Rolls-Royce and Finferries Demonstrate World’s First Fully Autonomous Ferry. 2018. Available online: www.rolls-royce.com/media/press-releases/2018/03-12-2018-rr-and-finferries-demonstrate-worlds-first-fully-autonomous-ferry.aspx (accessed on 14 December 2020).
- Sheng, P.; Yin, J. Extracting shipping route patterns by trajectory clustering model based on automatic identification system data. Sustainability 2018, 10, 2327. [Google Scholar] [CrossRef] [Green Version]
- Silveira, P.; Teixeira, A.; Soares, C. Use of AIS Data to Characterise Marine Traffic Patterns and Ship Collision Risk off the Coast of Portugal. J. Navig. 2013, 66, 879–898. [Google Scholar] [CrossRef] [Green Version]
- Safety of Life at Sea (SOLAS) Convention Chapter V. Regulation 19. Available online: https://assets.publishing.service.gov.uk/government/uploads/system/uploads/attachment_data/file/343175/solas_v_on_safety_of_navigation.pdf (accessed on 14 December 2020).
- Ester, M.; Kriegel, H.P.; Sander, J.; Xu, X. A density-based algorithm for discovering clusters in large spatial databases with noise. In Proceedings of the 2nd ACM International Conference on Knowledge Discovery and Data Mining (KDD), Oregon, Portland, 2–4 August 1996; pp. 226–231. [Google Scholar]
- Schubert, E.; Koos, A.; Emrich, T.; Züfle, A.; Schmid, K.A.; Zimek, A. A framework for clustering uncertain data. Proc. VLDB Endow. 2015, 8, 1976–1979. Available online: https://elki-project.github.io/ (accessed on 14 December 2020). [CrossRef] [Green Version]
- Pedregosa, F.; Varoquaux, G.; Gramfort, A.; Michel, V.; Thirion, B.; Grisel, O.; Blondel, M.; Prettenhofer, P.; Weiss, R.; Dubourg, V.; et al. Scikit-learn: Machine learning in python. J. Mach. Learn. Res. 2011, 12, 2825–2830. [Google Scholar]
- R Core Team. R: A Language and Environment for Statistical Computing. R Foundation for Statistical Computing. Available online: www.r-project.org/ (accessed on 14 December 2020).
- Hall, M.; Frank, E.; Holmes, G.; Pfahringer, B.; Reutemann, P.; Witten, I.H. The WEKA data mining software: An update. ACM SIGKDD Explor. 2009, 1, 10–18. [Google Scholar] [CrossRef]
- Han, X.; Armenakis, C.; Jadidi, M. DBSCAN Optimization for Improving Marine Trajectory Clustering and Anomaly Detection. Int. Arch. Photogramm. Remote Sens. Spat. Inf. Sci. 2020, 43, 455–461. [Google Scholar] [CrossRef]
- Hou, J.; Gao, H.; Li, X. DSets-DBSCAN: A Parameter-Free Clustering Algorithm. IEEE Trans. Image Process. 2016, 25, 3182–3193. [Google Scholar] [CrossRef]
- Sawant, K. Adaptive Methods for Determining DBSCAN Parameters. IJISET Int. J. Innov. Sci. Eng. Technol. 2014, 1, 329–334. [Google Scholar]
- Karami, A.; Johansson, R. Choosing DBSCAN Parameters Automatically using Differential Evolution. Int. J. Comput. Appl. 2014, 91, 1–11. [Google Scholar] [CrossRef]
- Xia, L.N.; Jing, J.W. SA-DBSCAN: A self-adaptive density-based clustering algorithm. J. Grad. Sch. Chin. Acad. Sci. 2009, 26, 530–538. [Google Scholar]
- Esmaelnejad, J.; Habibi, J.; Yeganeh, S.H. A Novel Method to Find Appropriate ε for DBSCAN. In Intelligent Information and Database Systems; Lecture Notes in Computer Science; Nguyen, N.T., Le, M.T., Świątek, J., Eds.; Springer: Berlin/Heidelberg, Germany, 2010; Volume 5990. [Google Scholar]
- Smiti, A.; Eloudi, Z. Soft DBSCAN: Improving DBSCAN clustering method using fuzzy set theory. In Proceedings of the 2013 6th International Conference on Human System Interactions (HSI), Sopot, Poland, 6–8 June 2013; pp. 380–385. [Google Scholar]
- Liu, B. Maritime Traffic Anomaly Detection from Aissatellite Data in Near Port Regions. Master’s Thesis, Dalhousie University, Halifax, NS, Canada, 2015. [Google Scholar]
- Khan, K.; Rehman, S.U.; Aziz, K.; Fong, S.; Sarasvady, S. DBSCAN: Past, Present and Future. In Proceedings of the Fifth International Conference on the Applications of Digital Information and Web Technologies, Bangalore, India, 17–19 February 2014; pp. 232–238. [Google Scholar]
- Schubert, E.; Sander, J.; Ester, M.; Kriegel, H.P.; Xu, X. DBSCAN Revisited, Revisited: Why and How You Should (Still) Use DBSCAN. ACM Trans. Database Syst. 2017, 42, 1–21. [Google Scholar] [CrossRef]
- Ren, Y.; Liu, X.; Liu, W. DBCAMM: A novel density-based clustering algorithm via using the Mahalanobis metric. Appl. Soft Comput. 2012, 12, 1542–1554. [Google Scholar] [CrossRef]
- Sangeetha, M.; Padikkaramu, V.; Chellan, R.T. A Novel Density Based Clustering Algorithm by Incorporating Mahalanobis Distance. Int. J. Intell. Eng. Syst. 2018, 11, 121–129. [Google Scholar] [CrossRef]
- Bian, J.; Tian, D.; Tang, Y.; Tao, D. A survey on trajectory clustering analysis. arXiv 2018, arXiv:1802.06971. [Google Scholar]
- Kanevski, M.; Loris, F.; Kaiser, C.; Pozdnoukhov, A.; Timonin, V.; Tuia, D. Machine learning models for geospatial data. In Handbook of Theoretical and Quantitative Geography; Faculté des Géosciences et de L’environnement: Lausanne, Switzerland, 2018; pp. 175–227. [Google Scholar]
- Gao, Y.-J.; Li, C.; Chen, G.-C.; Chen, L.; Jiang, X.-T.; Chen, C. Efficient k-nearest-neighbor search algorithms for historical moving object trajectories. J. Comput. Sci. Technol. 2007, 22, 232–244. [Google Scholar] [CrossRef]
- Piciarelli, C.; Micheloni, C.; Foresti, G.L. Trajectory-based anomalous event detection. IEEE Trans. Circuits Syst. Video Technol. 2008, 18, 1544–1554. [Google Scholar] [CrossRef]
- Cho, K.; Chen, X. Classifying and visualizing motion capture sequences using deep neural networks. In Proceedings of the International Conference on Computer Vision Theory and Applications (VISAPP), Lisbon, Portugal, 5–8 January 2014; Volume 2, pp. 122–130. [Google Scholar]
- Yao, D.; Zhang, C.; Zhu, Z.; Huang, J.; Bi, J. Trajectory clustering via deep representation learning. In Proceedings of the International Joint Conference on Neural Networks, Anchorage, AK, USA, 14–19 May 2017; pp. 3880–3887. [Google Scholar] [CrossRef]
- Suo, Y.; Chen, W.; Claramunt, C.; Yang, S. A Ship Trajectory Prediction Framework Based on a Recurrent Neural Network. Sensors 2020, 20, 5133. [Google Scholar] [CrossRef] [PubMed]
- Li, X.; Hu, W.; Hu, W. A coarse-to-fine strategy for vehicle motion trajectory clustering. In Proceedings of the 18th International Conference on Pattern Recognition (ICPR’06), Hong Kong, China, 20–24 August 2006; Volume 1, pp. 591–594. [Google Scholar]
- Xiang, T.; Gong, S. Spectral clustering with eigenvector selection. Pattern Recognit. 2008, 41, 1012–1029. [Google Scholar] [CrossRef] [Green Version]
- Lee, J.G.; Han, J.; Whang, K.Y. Trajectory Clustering: A Partition-and-Group Framework. In Proceedings of the 2007 ACM SIGMOD International Conference on Management of Data, Beijing, China, 11–14 June 2007. [Google Scholar]
- Ferreira, N.; Klosowski, J.T.; Scheidegger, C.E.; Silva, C.T. Vector field k-means: Clustering trajectories by fitting multiple vector fields. Comput. Graph. Forum 2013, 32, 201–210. [Google Scholar] [CrossRef] [Green Version]
- Galluccio, L.; Michel, O.; Comon, P.; Hero, A.O., III. Hero, Graph based k-means clustering. Signal Process. 2012, 92, 1970–1984. [Google Scholar] [CrossRef] [Green Version]
- Laxhammar, R.; Falkman, G. Online learning and sequential anomaly detection in trajectories. IEEE Trans. Pattern Anal. Mach. Intell. 2014, 36, 1158–1173. [Google Scholar] [CrossRef] [PubMed]
- Liu, P.; Zhou, D.; Wu, N.J. VDBSCAN: Varied Density Based Spatial Clustering of Applications with Noise. In Proceedings of the IEEE International Conference on Service Systems and Service Management, Chengdu, China, 9–11 June 2007; pp. 1–4. [Google Scholar]
- Uncu, O.; Gruver, W.A.; Kotak, D.B.; Sabaz, D.; Alibhai, Z.; Ng, C. GRIDBSCAN: GRId Density-Based Spatial Clustering of Applications with Noise. In Proceedings of the 2006 IEEE International Conference on Systems, Man, and Cybernetics, Taipei, Taiwan, 8–11 October 2006. [Google Scholar]
- Ram, A.; Jalal, S.; Jalal, A.S.; Kumar, M. DVBSCAN: A Density based Algorithm for Discovering Density Varied Clusters in Large Spatial Databases. Int. J. Comput. Appl. 2010, 3, 59–66. [Google Scholar]
- Ram, A.; Sharma, A.; Jalal, A.S.; Agrawal, A.; Singh, R. An Enhanced Density Based Spatial Clustering of Applications with Noise. In Proceedings of the 2009 IEEE International Advance Computing Conference (IACC2009), Patiala, India, 6–7 March 2009. [Google Scholar]
- Borah, B.; Bhaftacharyya, D.K. A Clustering Technique using Density Difference. In Proceedings of the 2007 International Conference on Signal Processing, Communications and Networking, Chennai, India, 22–24 February 2007; pp. 585–588. [Google Scholar]
- Yu, X.; Zhou, D.; Zhou, Y. A New Clustering Algorithm Based on Distance and Density. In Proceedings of the International Conference on Services Systems and Services Management (ICSSSM-2005), Chongqing, China, 13–15 June 2005; Volume 2. [Google Scholar]
- Elbatta, M.N.T. An Improvement of DBSCAN Algorithm for Best Results in Varied Densities. Master’s Thesis, The Islamic University-Gaza, Gaza, Palestine, 2012. [Google Scholar]
- Fahim, A.M.; Salem, A.M.; Torkey, F.A.; Ramadan, M.A. Density Clustering Based on Radius of Data (DCBRD); World Academy of Science, Engineering and Technology: Istanbul, Turkey, 2006. [Google Scholar]
- Liu, B. A Fast Density-Based Clustering Algorithm For Large Databases. In Proceedings of the Fifth International Conference on Machine Learning and Cybernetics, Dalian, China, 13–16 August 2006. [Google Scholar]
- Chen, X.Y.; Min, Y.F.; Zhao, Y.; Wang, P. GMDBSCAN: Multi-Density DBSCAN Cluster Based on Grid. In Proceedings of the IEEE International Conference on e-Business Engineering (ICEBE 2008), Xi’an, China, 22–24 October 2008. [Google Scholar]
- Borah, B.; Bhattacharyya, D.K. An Improved Sampling-Based DBSCAN for Large Spatial Databases. In Proceedings of the International Conference on Intelligent Sensing and Information Processing, Chennai, India, 4–7 January 2004. [Google Scholar]
- El-Sonbaty, Y.; Ismail, M.A.; Farouk, M. An Efficient Density Based Clustering Algorithm for Large Databases. In Proceedings of the 16th IEEE International Conference on Tools with Artificial Intelligence (ICTAI 2004), Boca Raton, FL, USA, 15–17 November 2004. [Google Scholar]
- Mahran, S.; Mahar, K. Using Grid for Accelerating Density-Based Clustering. In Proceedings of the 8th IEEE International Conference on Computer and Information Technology, Sydney, Australia, 8–11 July 2008. [Google Scholar]
- Birant, D.; Kut, A. ST-DBSCAN: An algorithm for clustering spatial–temporal data. Data Knowl. Eng. 2007, 60, 208–221. [Google Scholar] [CrossRef]
- Vessel Traffic Data. MarineCadastre.gov | Vessel Traffic Data. Available online: Marinecadastre.gov/ais/ (accessed on 14 December 2020).
- Kontopoulos, I.; Varlamis, I.; Tserpes, K. Uncovering Hidden Concepts from AIS Data: A Network Abstraction of Maritime Traffic for Anomaly Detection, Lecture Notes in Computer Science (Including Subseries Lecture Notes in Artificial Intelligence and Lecture Notes in Bioinformatics); Springer International Publishing: Basel, Switzerland, 2020. [Google Scholar] [CrossRef] [Green Version]
Figure 1.
Example of the DBSCAN process. A refers to the core points; B and C are the border points; and N is an outlier (credit: Wikipedia User Chire).
Figure 1.
Example of the DBSCAN process. A refers to the core points; B and C are the border points; and N is an outlier (credit: Wikipedia User Chire).

Figure 2.
Extraction of behaviour patterns from raw AIS data and using the model to detect AIS anomalies framework.
Figure 2.
Extraction of behaviour patterns from raw AIS data and using the model to detect AIS anomalies framework.

Figure 3.
A schematic overview of clustering hierarchy-segment raw AIS data into smaller pieces and merging the clustering results.
Figure 3.
A schematic overview of clustering hierarchy-segment raw AIS data into smaller pieces and merging the clustering results.

Figure 4.
Details of the semi-supervised clustering process, a combination of a unsupervised clustering method, and a supervised one.
Figure 4.
Details of the semi-supervised clustering process, a combination of a unsupervised clustering method, and a supervised one.

Figure 5.
Synthesized datasets for algorithm testing and performance evaluation.

Figure 6.
Clustering results from ground truth, k-means, KNN, SVM, plain DBSCAN, and enhanced DBSCAN on synthesized dataset one to test outlier detection performance.
Figure 6.
Clustering results from ground truth, k-means, KNN, SVM, plain DBSCAN, and enhanced DBSCAN on synthesized dataset one to test outlier detection performance.

Figure 7.
Clustering results from ground truth, k-means, KNN, SVM, plain DBSCAN, and enhanced DBSCAN on synthesized dataset two to test the performance of distinguishing intersections.
Figure 7.
Clustering results from ground truth, k-means, KNN, SVM, plain DBSCAN, and enhanced DBSCAN on synthesized dataset two to test the performance of distinguishing intersections.

Figure 8.
Clustering performance evaluation of various methods on dataset one to test outlier detection performance.
Figure 8.
Clustering performance evaluation of various methods on dataset one to test outlier detection performance.

Figure 9.
Clustering performance evaluation of various methods on dataset two to test the performance of distinguishing intersections.
Figure 9.
Clustering performance evaluation of various methods on dataset two to test the performance of distinguishing intersections.

Figure 10.
Two raw AIS data.

Figure 11.
Ports and locations where vessels are mooring detected by the proposed clustering framework.
Figure 11.
Ports and locations where vessels are mooring detected by the proposed clustering framework.

Figure 12.
Profiled behaviour vectors on the Saint Lawrence Seaway and Great Lakes. The region from the proposed clustering framework, represented by the arrows.
Figure 12.
Profiled behaviour vectors on the Saint Lawrence Seaway and Great Lakes. The region from the proposed clustering framework, represented by the arrows.

Figure 13.
Example of vessel behaviour recommendations based on given location.

Figure 14.
Example of vessel behaviour monitoring and anomaly detection on new observations.


Table 1.
Clustering performance evaluation of various methods.
| Data Set | Algorithms | Estimated Number of Clusters | Estimated Number of Noise Points | Entropy/Homogeneity | Purity/Completeness | V-Measure | Adjusted Rand Index | Adjusted Mutual Information | F1 Score | Silhouette Coefficient | Davies-Bouldin Index | Calinski-Harabasz Index |
|---|---|---|---|---|---|---|---|---|---|---|---|---|
| Data Set One | Ground Truth | 5 | 7638 | 1 | 1 | 1 | 1 | 1 | 1 | 0.361 | 1.221 | 35044.287 |
| K-Means | 3 | 0 | 0.571 | 0.916 | 0.703 | 0.603 | 0.571 | 0.766 | 0.704 | 0.353 | 86333.971 | |
| KNN | 5 | 0 | 0.661 | 0.922 | 0.77 | 0.641 | 0.661 | 0.801 | 0.66 | 0.69 | 50256.168 | |
| SVM | 5 | 0 | 0.639 | 0.915 | 0.753 | 0.63 | 0.639 | 0.795 | 0.667 | 0.605 | 49372.95 | |
| Plain DBSCAN | 5 | 1725 | 0.629 | 0.846 | 0.721 | 0.634 | 0.629 | 0.802 | 0.583 | 1.175 | 29941.662 | |
| Enhanced DBSCAN | 5 | 750 | 0.643 | 0.8 | 0.713 | 0.623 | 0.713 | 0.791 | 0.516 | 1.372 | 33506.413 | |
| Data Set Two | Ground Truth | 5 | 30 | 1 | 1 | 1 | 1 | 1 | 1 | 0.54 | 1.705 | 1106.589 |
| K-Means | 3 | 0 | 0.726 | 0.931 | 0.816 | 0.848 | 0.726 | 0.722 | 0.57 | 0.63 | 1903.771 | |
| KNN | 5 | 0 | 0.926 | 0.966 | 0.946 | 0.974 | 0.926 | 0.979 | 0.565 | 0.575 | 1446.93 | |
| SVM | 5 | 0 | 0.887 | 0.959 | 0.922 | 0.958 | 0.886 | 0.967 | 0.553 | 0.52 | 1334.412 | |
| Plain DBSCAN | 5 | 8 | 0.879 | 0.96 | 0.918 | 0.953 | 0.878 | 0.962 | 0.558 | 0.645 | 1302.276 | |
| Enhanced DBSCAN | 5 | 2 | 0.922 | 0.951 | 0.936 | 0.973 | 0.936 | 0.976 | 0.549 | 1.509 | 1124.949 |
Publisher’s Note: MDPI stays neutral with regard to jurisdictional claims in published maps and institutional affiliations. |
© 2021 by the authors. Licensee MDPI, Basel, Switzerland. This article is an open access article distributed under the terms and conditions of the Creative Commons Attribution (CC BY) license (https://creativecommons.org/licenses/by/4.0/).
Share and Cite
MDPI and ACS Style
Han, X.; Armenakis, C.; Jadidi, M. Modeling Vessel Behaviours by Clustering AIS Data Using Optimized DBSCAN. Sustainability 2021, 13, 8162. https://0-doi-org.brum.beds.ac.uk/10.3390/su13158162
AMA Style
Han X, Armenakis C, Jadidi M. Modeling Vessel Behaviours by Clustering AIS Data Using Optimized DBSCAN. Sustainability. 2021; 13(15):8162. https://0-doi-org.brum.beds.ac.uk/10.3390/su13158162
Chicago/Turabian StyleHan, Xuyang, Costas Armenakis, and Mojgan Jadidi. 2021. "Modeling Vessel Behaviours by Clustering AIS Data Using Optimized DBSCAN" Sustainability 13, no. 15: 8162. https://0-doi-org.brum.beds.ac.uk/10.3390/su13158162
Note that from the first issue of 2016, this journal uses article numbers instead of page numbers. See further details here.