
Canopy Index Evaluation for Precision Management in an Intensive Olive Orchard

 ,
,  , , ,
, , ,  and
and 
Abstract
:1. Introduction
2. Materials and Methods
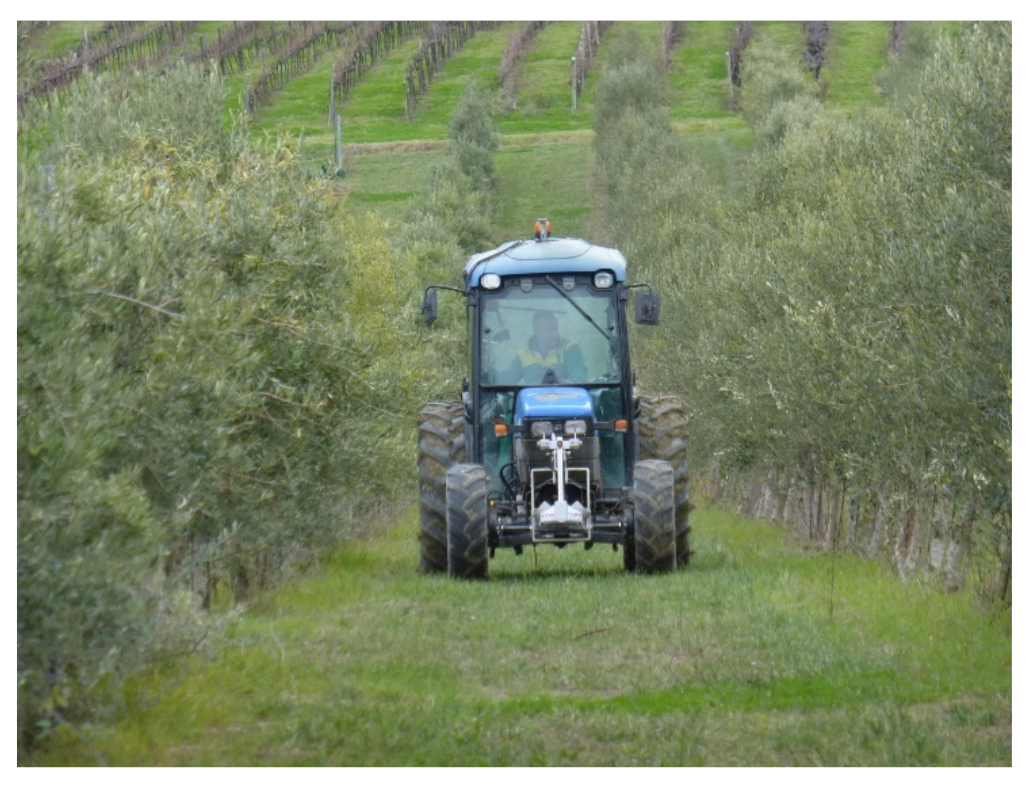
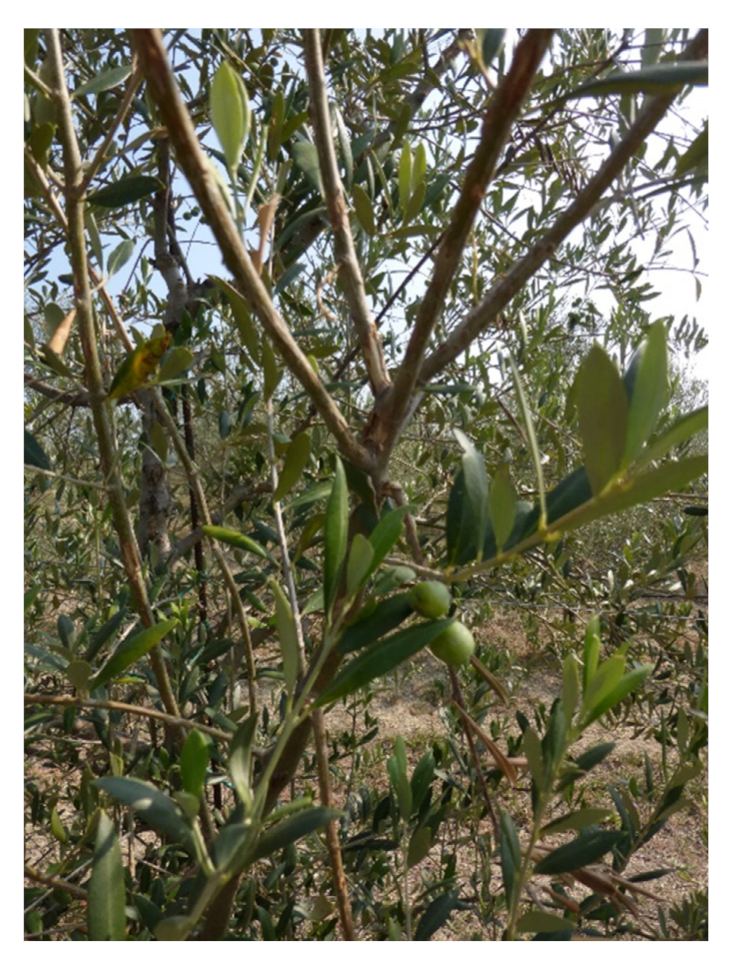
2.1. Crop Survey
2.2. Multiparametric Sensor
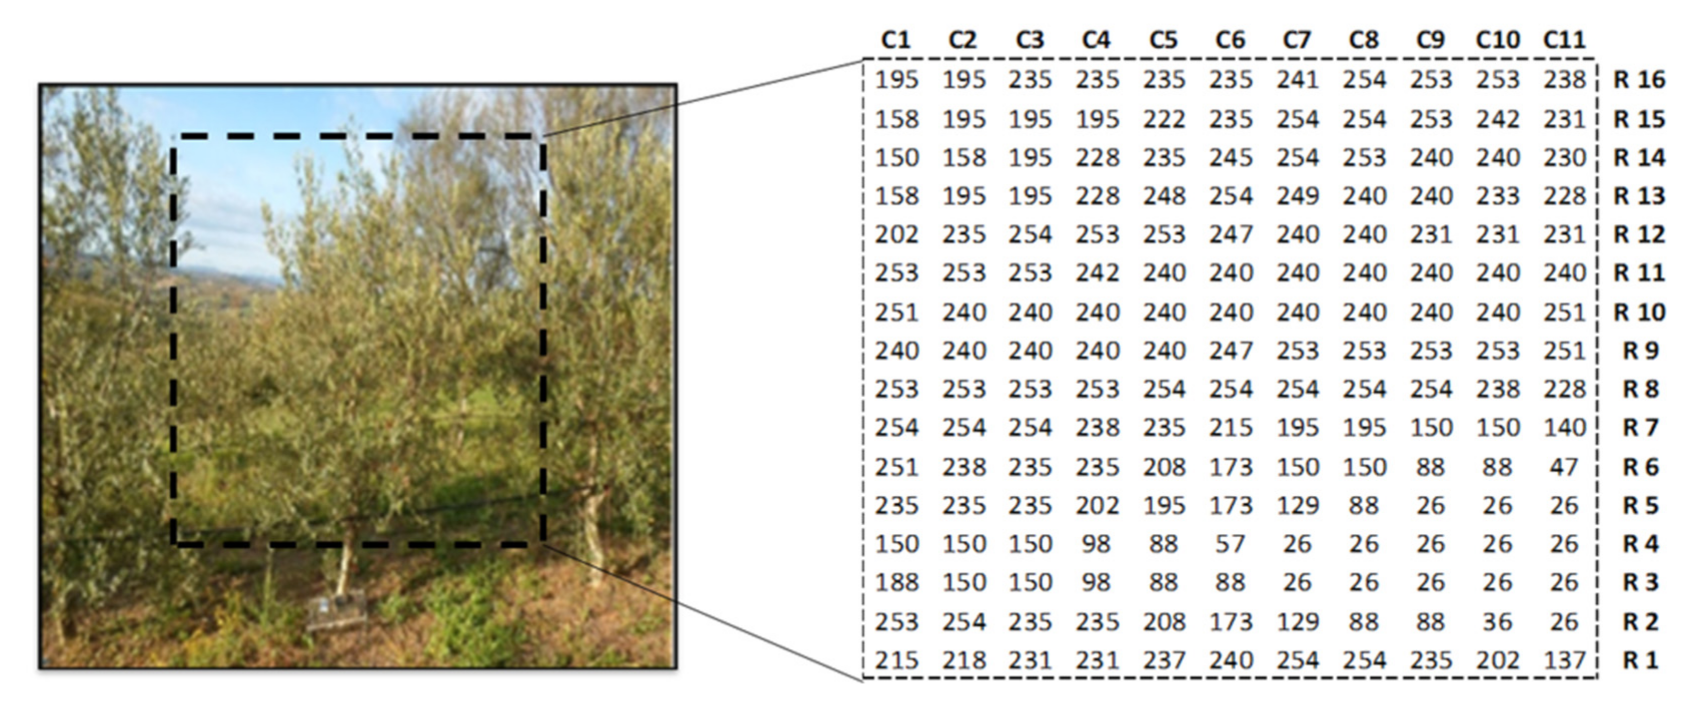
2.3. Methodology
3. Results and Discussion
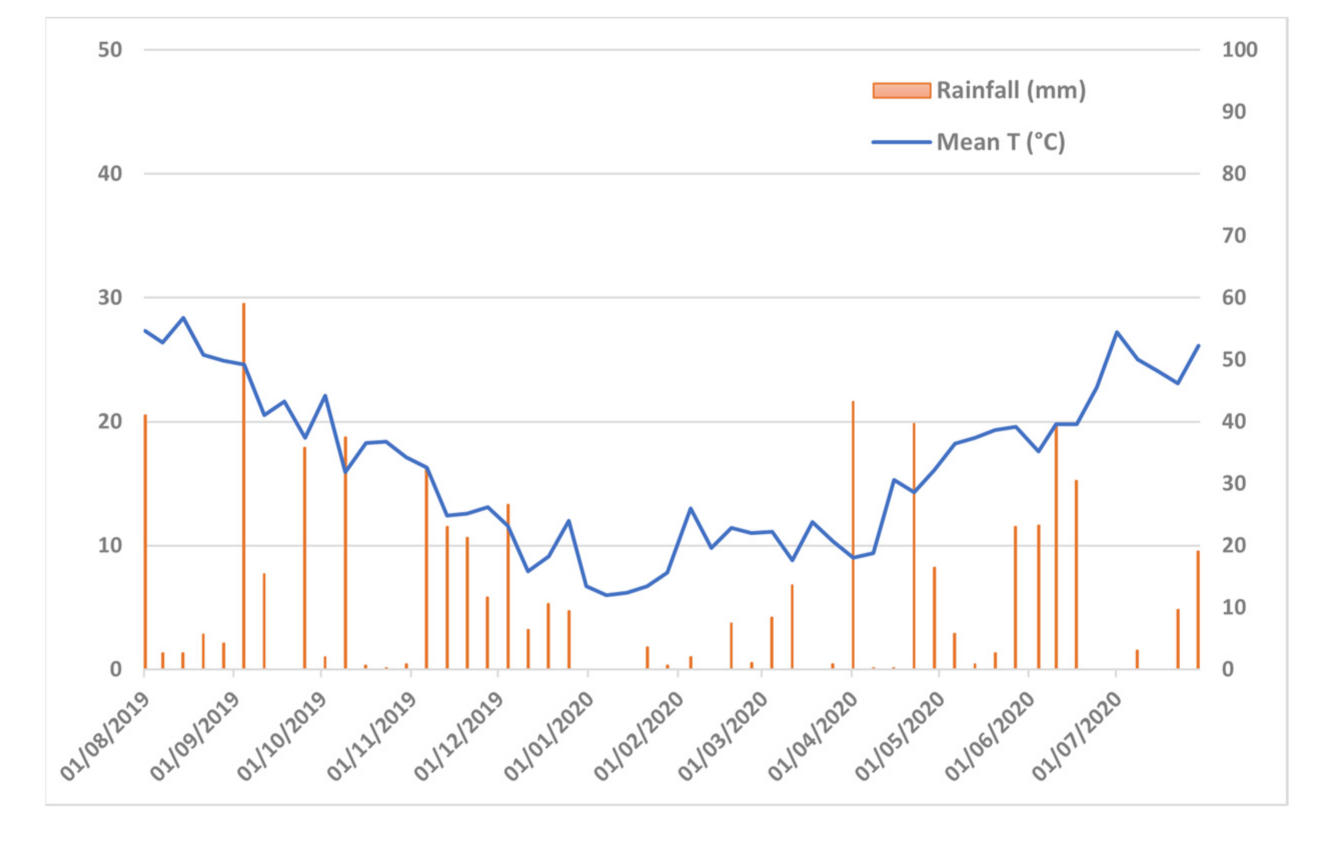
3.1. Environmental Data
3.2. Crop Data
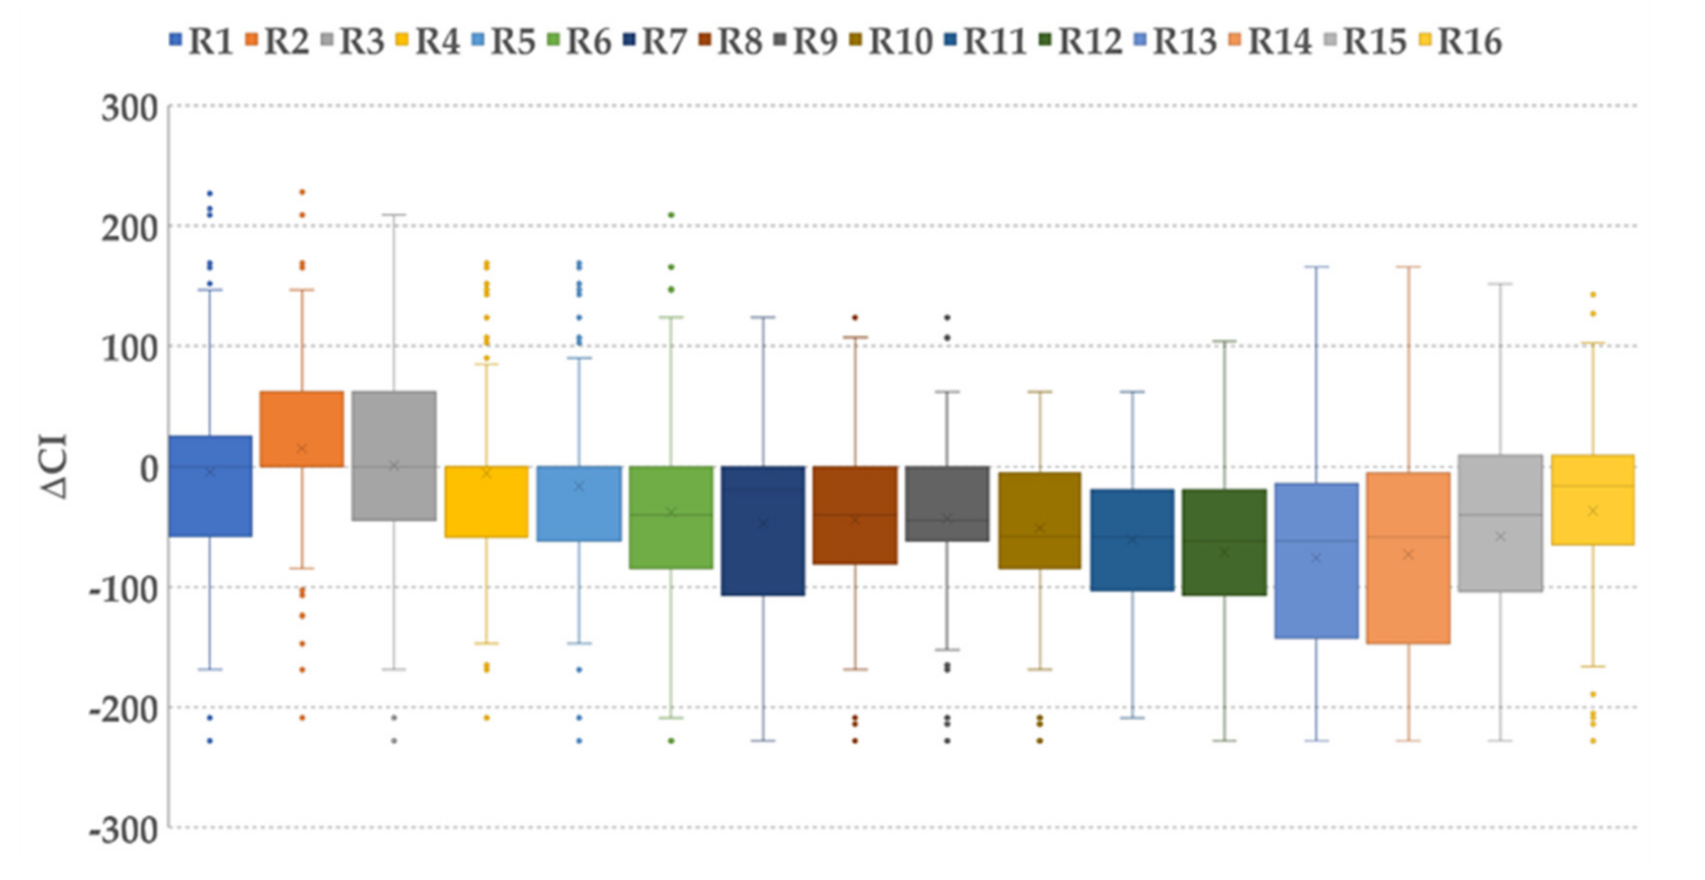
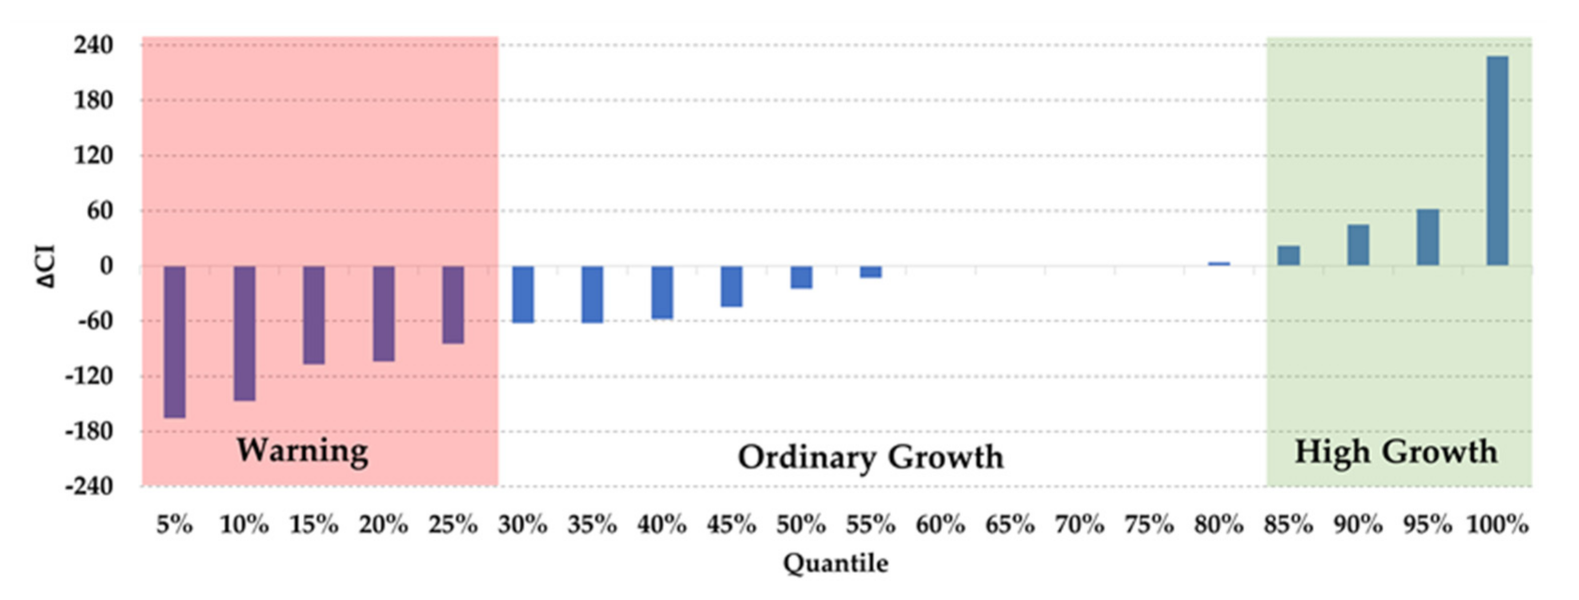
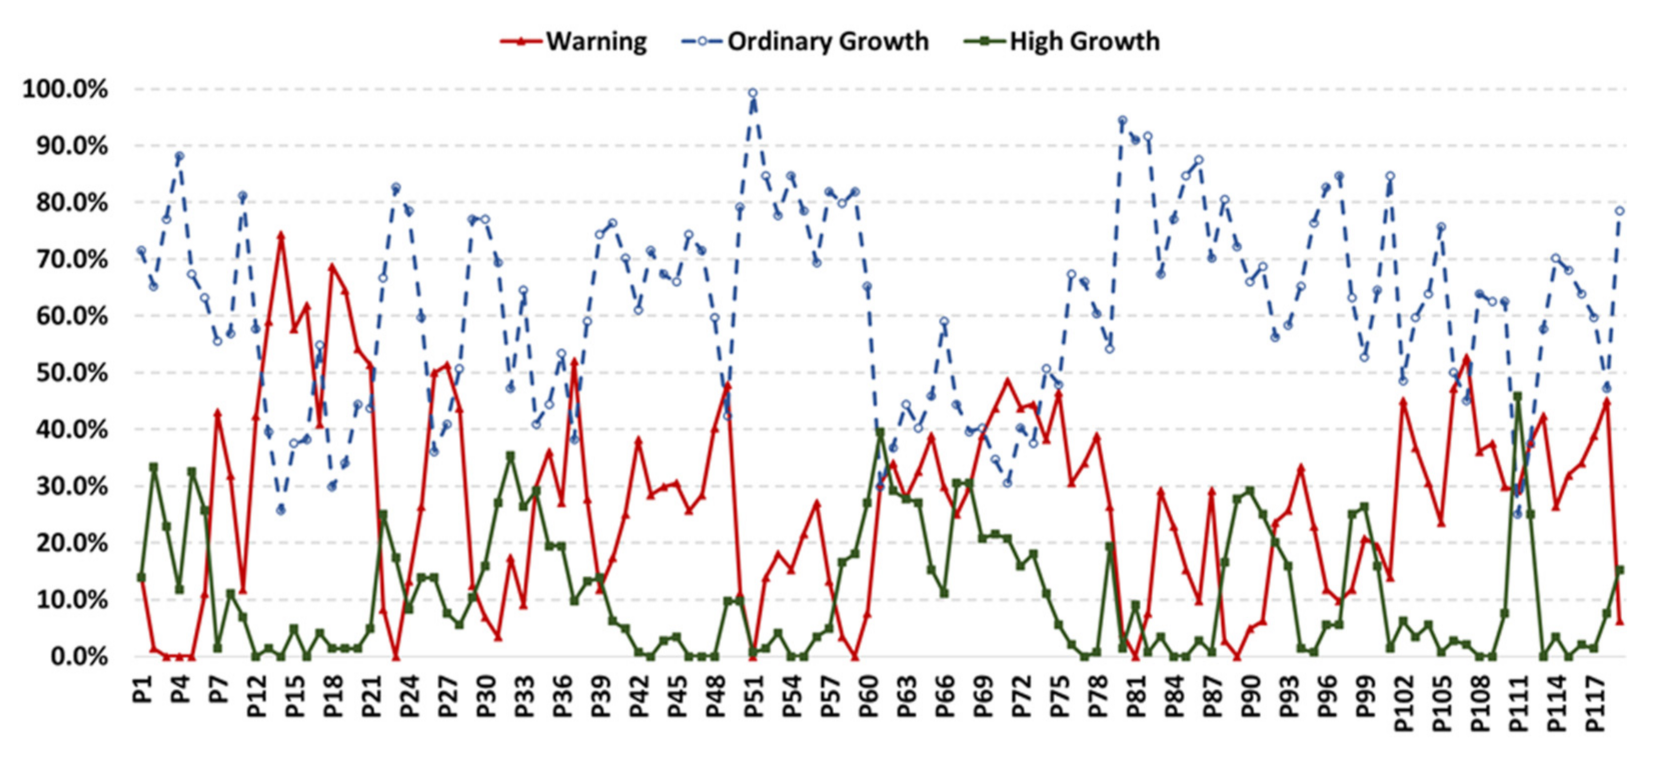
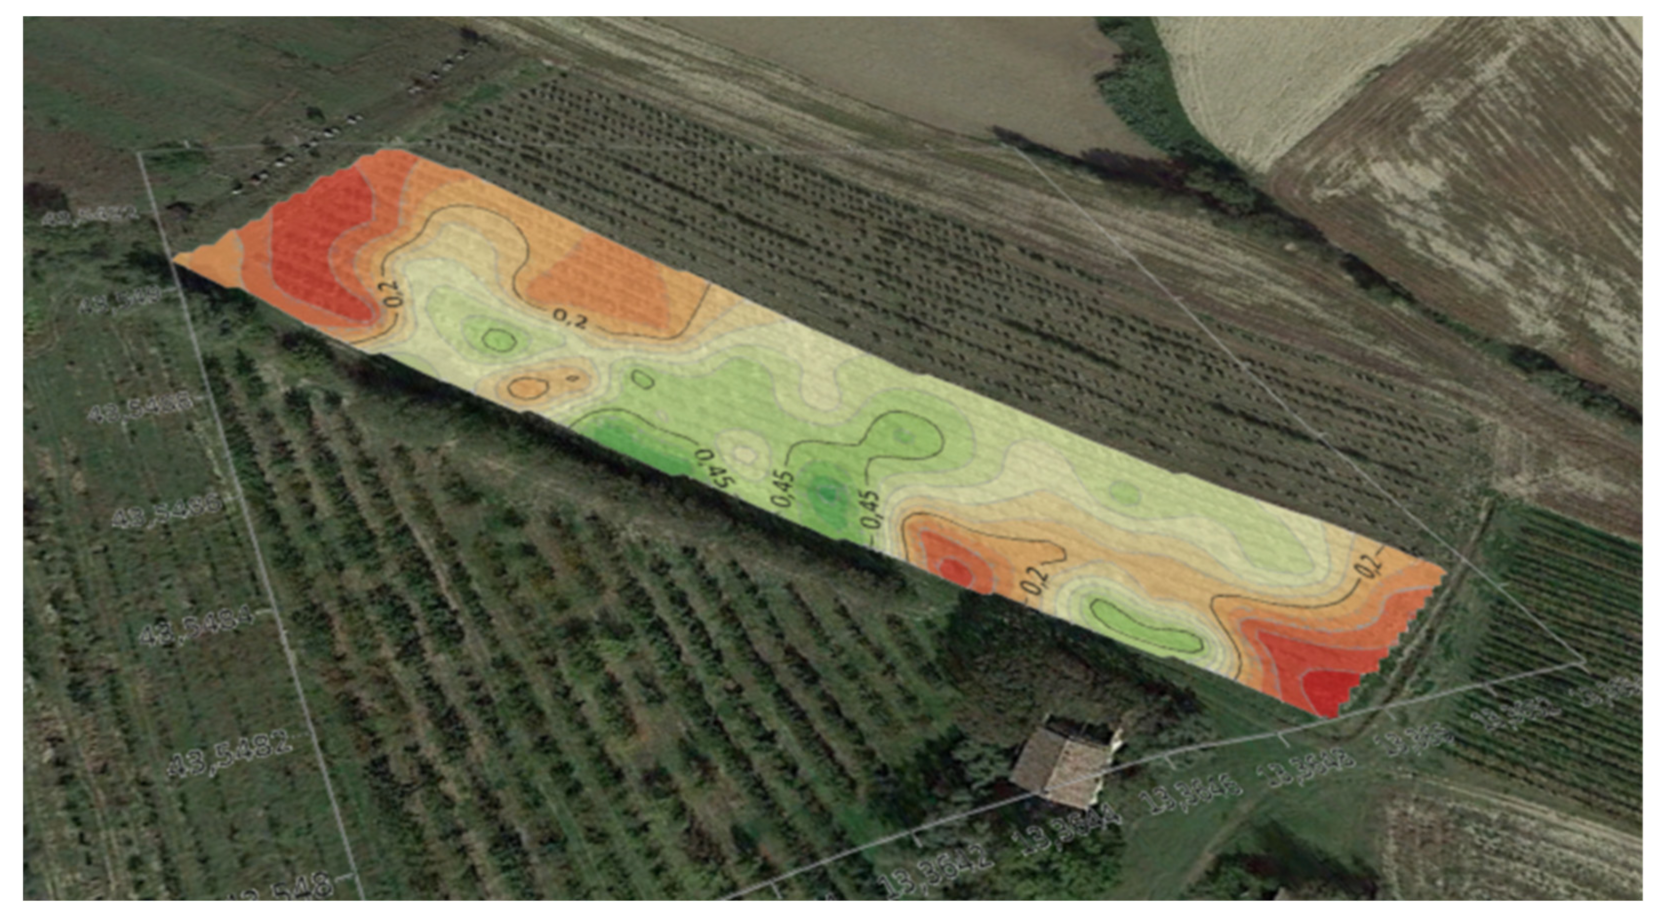
3.3. Data Analisys
- If ∆CI < −62 = warning low growth (W)
- If −62 < ∆CI < 45 = ordinary growth (O)
- If ∆CI > 45 = warning high growth (P)
4. Conclusions
5. Future Work
6. Patents
Author Contributions
Funding
Institutional Review Board Statement
Informed Consent Statement
Data Availability Statement
Acknowledgments
Conflicts of Interest
References
- Matese, A.; Di Gennaro, S.F. Technology in precision viticulture: A state of the art review. Int. J. Wine Res. 2015, 7, 69–81. [Google Scholar] [CrossRef] [Green Version]
- Salamì, E.; Barrado, C.; Pastor, E. UAV flight experiments applied to the remote sensing of vegetate areas. Remote Sens. 2014, 6, 11051–11081. [Google Scholar] [CrossRef] [Green Version]
- Berni, J.; Zarco-Tejada, P.; Suarez, L.; Fereres, E. Thermal and narrowband multispectral remote sensing for vegetation monitoring from an unmanned aerial vehicle. IEEE Trans. Geosci. Remote Sens. 2009, 47, 722–738. [Google Scholar] [CrossRef] [Green Version]
- Zhang, C.; Kovacs, J.M. The application of smaller unmanned aerial system for precision agriculture. A review. Prec. Agric. 2012, 13, 693–712. [Google Scholar] [CrossRef]
- Hunt, E.R., Jr.; Hively, W.D.; Fujikawa, S.; Linden, D.; Daughtry, C.S.; McCarty, G. Acquisition of NIR-Green-Blue digital photographs from unmanned aircraft for crop monitoring. Remote Sens. 2010, 2, 290–305. [Google Scholar] [CrossRef] [Green Version]
- Manfrini, L.; Pierpaoli, E.; Taylor, J.A.; Morandi, B.; Losciale, P.; Zibordi, M.; Grappadelli, L.C.; Bastías, R.M. Precision Fruit Growing: How to Collect and Interpret Data on Seasonal Variation in Apple Orchards. In Proceedings of the ISHS Acta Horticulturae 932: XXVIII International Horticultural Congress on Science and Horticulture for People (IHC2010): International Symposium on Plant Physiology from Cell to Fruit Production System, Lisbon, Portugal, 22–27 December 2010; Volume 932, pp. 461–469. [Google Scholar]
- Fridley, R.B. High Density Orchards Facilitate Harvest. California Agriculture. 12–13 June 1977. Available online: http://calag.ucanr.edu/archive/?type=pdf&article=ca.v031n07p12 (accessed on 21 September 2020).
- Dias, A.B.; Peça, J.O.; Pinheiro, A.P. Long-Term Evaluation of the Influence of Mechanical Pruning on Olive Growing. Agron. J. 2012, 104, 22–25. Available online: https://0-acsess-onlinelibrary-wiley-com.brum.beds.ac.uk/doi/epdf/10.2134/agronj2011.0137 (accessed on 21 September 2020). [CrossRef] [Green Version]
- Bernardi, B.; Benalia, S.; Fazari, A.; Zimbalatti, G.; Stillitano, T.; De Luca, A.I. Mechanical harvesting in traditional olive orchards: Oli-picker case study. Agron. Res. 2016, 14, 683–688. [Google Scholar]
- Tombesi, A.; Farinelli, D.; Pilli, M.; Ruffolo, M. Work productivity of teams with different pruning tools in olive. In Proceedings of the ISHS Acta Horticulturae 949: VI International Symposium on Olive Growing, Evora, Portugal, 31 May 2012. [Google Scholar] [CrossRef]
- Vivaldi, G.A.; Strippoli, G.; Pascuzzi, S.; Stellacci, A.M.; Camposeo, S. Olive genotypes cultivated in an adult high-density orchard respond differently to canopy restraining by mechanical and manual pruning. Sci. Hortic. 2015, 192, 391–399. [Google Scholar] [CrossRef]
- Dias, A.B.; Falcão, J.M.; Pinheiro, A.; Peça, J.O. Evaluation of Olive Pruning Effect on the Performance of the Row-Side Continuous Canopy Shaking Harvester in a High Density Olive Orchard. Front. Plant Sci. 2019, 10, 1631. [Google Scholar] [CrossRef] [Green Version]
- Gatti, M.; Dosso, P.; Maurino, M.; Merli, M.C.; Bernizzoni, F.; Pirez, F.J.; Platè, B.; Bertuzzi, G.C.; Poni, S. MECS-VINE: A New Proximal Sensor for Segmented Mapping of Vigor and Yield Parameters on Vineyard Rows. Sensors 2016, 16, 2009. [Google Scholar] [CrossRef] [PubMed] [Green Version]
- Jenks, G. The Data Model Concept in Statistical Mapping. In International Yearbook of Cartography; Frenzel, K., Ed.; George Philip: London, UK, 1967; pp. 186–190. [Google Scholar]
- R Development Core Team. R: A Language and Environment for Statistical Computing; R Foundation for Statistical Computing: Vienna, Austria, 2008; ISBN 3-900051-07-0. Available online: http://www.R-project.org (accessed on 7 July 2020).
- Hijmans, R.J.; Van Etten, J. Raster: Geographic Analysis and Modeling with Raster Data. R Package Version 2.0-12. 2012. Available online: http://CRAN.R-project.org/package=raster (accessed on 7 July 2020).
- Martínez Cob, A.; Faci, J.M. Evapotranspiration of an hedge-pruned olive orchard in a semiarid area of NE Spain. Agric. Water Manag. 2010, 97, 410–418. [Google Scholar] [CrossRef] [Green Version]
- Colin, C. Hardy and Robert E. Burgan. Monitoring Live Moisture in Three Vegetation Types of the Western U.S. Photogramm. Eng. Remote Sens. 1999, 65, 603–610. [Google Scholar]
- Schupp, J.R.; Baugher, T.A.; Miller, S.S.; Harsh, R.M.; Lesser, K.M. Mechanical Thinning of Peach and Apple Trees Reduces Labor Input and Increases Fruit Size. Hortechnology 2008, 18, 660–670. [Google Scholar] [CrossRef] [Green Version]
- Assirelli, A.; Giovannini, D.; Cacchi, M.; Sirri, S.; Baruzzi, G.; Caracciolo, G. Evaluation of a New Machine for Flower and Fruit Thinning in Stone Fruits. Sustainability 2018, 10, 4088. [Google Scholar] [CrossRef] [Green Version]
- Boini, A.; Manfrini, L.; Bortolotti, G.; Corelli-Grappadelli, L.; Morandi, B. Monitoring fruit daily growth indicates the onset of mild drought stress in apple. Scientia Hortic. 2019, 256, 108520. [Google Scholar] [CrossRef]
- Gamon, J.A.; Field, C.B.; Goulden, M.L.; Griffin, K.L.; Hartley, A.E.; Joel, G.; Penuelas, J.; Valentini, R. Relationships Between NDVI, Canopy Structure, and Photosynthesis in Three Californian Vegetation Types. Ecol. Appl. 1995, 5, 28–41. [Google Scholar] [CrossRef] [Green Version]
- Assirelli, A.; Caracciolo, G.; Cacchi, M.; Sirri, S.; Pallottino, F.; Costa, C. Evaluation of the Detachment Force Needed for Mechanical Thinning of Green Peach Fruits. Sustainability 2018, 10, 2291. [Google Scholar] [CrossRef] [Green Version]
- Córdoba, M.A.; Bruno, C.I.; Costa, J.L.; Peralta, N.R.; Balzarinia, M.G. Protocol for multivariate homogeneous zone delineation in precision agriculture. Biosyst. Eng. 2016, 143, 95–107. [Google Scholar] [CrossRef]
- Husson, F.; Le, S.; Pages, J. Exploratory Multivariate Analysis by Example Using R; Chapman and Hall: Boca Raton, FL, USA, 2010. [Google Scholar] [CrossRef]
- Reynolds, A.; Richards, G.; de la Iglesia, B.; Rayward-Smith, V. Clustering rules: A comparison of partitioning and hierarchical clustering algorithms. J. Math. Model Algorithms 1992, 5, 475–504. [Google Scholar] [CrossRef]
- Schubert, E.; Rousseeuw, P.J. Faster k-Medoids Clustering: Improving the PAM, CLARA, and CLARANS Algorithms. 2019. Available online: https://arxiv.org/abs/1810.05691 (accessed on 7 July 2020).
- Solano, F.; Di Fazio, S.; Modica, G. A methodology based on GEOBIA and WorldView-3 imagery to derive vegetation indices at tree crown detail in olive orchards. Int. J. Appl. Earth Obs. Geoinf. 2019, 83, 20. [Google Scholar] [CrossRef]
- Haboudane, D.; Miller, J.R.; Pattey, E.; Zarco-Tejada, P.J.; Strachan, I.B. Hyperspectral vegetation indices and novel algorithms for predicting green LAI of crop canopies: Modeling and validation in the context of precision agriculture. Remote Sens. Environ. 2004, 90, 337–352. [Google Scholar] [CrossRef]
- Haboudane, D.; Tremblay, N.; Miller, J.R.; Vigneault, P. Remote estimation of crop chlorophyll content using spectral indices derived from hyperspectral data. IEEE Trans. Geosci. Remote Sens. 2008, 46, 423–437. [Google Scholar] [CrossRef]
- Main, R.; Cho, M.A.; Mathieu, R.; O’Kennedy, M.M.; Ramoelo, A.; Koch, S. An investigation into robust spectral indices for leaf chlorophyll estimation. ISPRS J. Photogramm. Remote Sens. 2011, 66, 751–761. [Google Scholar] [CrossRef]
- Hu, S.; Mo, X. Interpreting spatial heterogeneity of crop yield with a process model and remote sensing. Ecol. Model. 2011, 222, 2530–2541. [Google Scholar] [CrossRef]
- Xue, G.P.; Guang, Y.; Xi, P.F. Decision Model of Variable Nitrogen Fertilizer in Winter Wheat Returning Green Stage Based on UAV Multi-Spectral Images. Spectrosc. Spectr. Anal. 2019, 39, 3599–3605. [Google Scholar]
- Reyesa, J.F.; Correa, C.; Esquivela, W.; Ortega, R. Development and field testing of a data acquisition system to assess the quality of spraying in fruit orchards. Comput. Electron. Agric. 2012, 84, 62–67. [Google Scholar] [CrossRef]
- St-Onge Benoit, A.; Nora, A. Measuring forest canopy height using a combination of lidar and aerial photography data. In Proceedings of the International Archives of Photogrammetry and Remote Sensing, Annapolis, MD, USA, 22–24 October 2001; Volume XXXIV-3/W4, pp. 131–137. [Google Scholar]
- Khosravipour, A.; Skidmore, A.K.; Isenburg, M.; Wang, T.; Hussin, Y.A. Generating Pit-free Canopy Height Models from Airborne Lidar. Photogramm. Eng. Remote Sens. 2014, 80, 863–872. [Google Scholar] [CrossRef]


Publisher’s Note: MDPI stays neutral with regard to jurisdictional claims in published maps and institutional affiliations. |
© 2021 by the authors. Licensee MDPI, Basel, Switzerland. This article is an open access article distributed under the terms and conditions of the Creative Commons Attribution (CC BY) license (https://creativecommons.org/licenses/by/4.0/).
Share and Cite
Assirelli, A.; Romano, E.; Bisaglia, C.; Lodolini, E.M.; Neri, D.; Brambilla, M. Canopy Index Evaluation for Precision Management in an Intensive Olive Orchard. Sustainability 2021, 13, 8266. https://0-doi-org.brum.beds.ac.uk/10.3390/su13158266
Assirelli A, Romano E, Bisaglia C, Lodolini EM, Neri D, Brambilla M. Canopy Index Evaluation for Precision Management in an Intensive Olive Orchard. Sustainability. 2021; 13(15):8266. https://0-doi-org.brum.beds.ac.uk/10.3390/su13158266
Chicago/Turabian StyleAssirelli, Alberto, Elio Romano, Carlo Bisaglia, Enrico Maria Lodolini, Davide Neri, and Massimo Brambilla. 2021. "Canopy Index Evaluation for Precision Management in an Intensive Olive Orchard" Sustainability 13, no. 15: 8266. https://0-doi-org.brum.beds.ac.uk/10.3390/su13158266