1. Introduction
1.1. Transport Importance in Increasing Sustainability
The transport of passengers and goods takes on an increasingly important role at different territorial scales: local, national, international.
The constantly growing volumes of passenger and freight transport are, in various ways, directly correlated to economic and social growth, but on the other hand, the same growth in volumes can determine negative environmental externalities. It therefore becomes increasingly important to analyze sustainability in its three main components: social, economic, environmental.
The study of passenger flows in planning the development of transport in urban, national, and international systems is therefore of great importance. It is not possible to design a transport network or improve the existing one without accurate data [
1]. Estimations need to be developed with great care because the world is changing rapidly and the future is uncertain and because the known behaviors of decision makers are changing as decision makers today are paying attention to the implications of changes at the technological level, as well as (in the components of sustainability) at the economic, social, and environmental levels [
2].
In this context of profound changes, the determining characteristics for the growth of passenger air demand in emerging countries have been studied; these are as follows: GDP/capita, population, distance from alternative airports, tourism, leading cities [
3].
Regarding the transport of goods, it is necessary to know the individual elements of the supply chain in order to ensure an efficient distribution of products [
4]. Different modalities have been reorganized to support the increase in traffic, for example, in containers with the increase in transshipment [
5,
6].
National mobility is essential for the cohesion of a country because it can open up important development prospects, especially for the most marginal areas.
Transport is a fundamental element for external accessibility that affects travel time and cost by defining the degree of social inclusion of the populations concerned and local development.
Transport infrastructures represent the tool through which accessibility to the main nodes of the country system is guaranteed: on the one hand, the main urban and metropolitan areas, in which the majority of the population is concentrated; and on the (other hand, the manufacturing poles and the tourist and cultural centers, which represent the backbone of the regional economic system.
The immediate problem when there is an airport in a marginal and underdeveloped area is the possibility of operating services with a medium–low ticket cost for the users and sufficient profit for the airline companies. This is the case where it is considered that the study area, in which the airport is located, is marginal from a geographical point of view compared to the center of gravity of Europe, and is underdeveloped from an economic point of view having one of the lowest GDP/capita Europe.
To pursue the sustainability, it is essential that the European and national infrastructural and services policies, although focused on the connectivity of the country’s main nodes, guarantee minimum levels of accessibility even to the most peripheral areas, where the minimum level can be defined with the minimum time to join the core network TEN-T.
1.2. Airport Role in Literature
Air transportation plays a key role in transportation systems; as demonstrated by the relevant literature, it guarantees the connectivity of the areas by promoting the development of the most underdeveloped areas and increasing the attractiveness of a region where there is not a high-speed rail [
7,
8,
9,
10,
11].
The regional airports are the major destinations of the minimal cost seeking low-cost carriers thanks to their lower airport fees, higher availability of airport slots, and absence of traffic congestion, as well as the potential of effective state aid [
12,
13,
14,
15,
16].
According to the European Commission, air passenger transport plays an important role in the economic development and mobility of the EU and strengthens its position on the global level [
17].
Moreover, the reduction of travel time in national movement provided by airports can lead to an improvement in accessibility to the market, both for final goods (forward linkage) and for those used at the start of production (backward linkage) [
18].
Accessibility has effects on productivity thanks to direct contact between customers and suppliers [
10,
19,
20].
An airport can have four types of impact [
21]:
direct when it is related to the operation of the airport itself;
indirect when it relates to supplier operations in the area;
induced when it relates to the activity generated by direct and indirect operations;
catalytic when it is related to the role that the airport may have in regional development.
Whereas the first three impacts are measurable through survey, the catalytic impacts depend on many factors that are difficult to quantify [
22].
According to Halpern and Bråthen, the catalytic impacts of airports are mainly of two types and are related to the regional economic competitiveness (e.g., commercial activities, tourism, investment decisions) and to the regional accessibility and social development (e.g., work, leisure) [
23].
Several studies on the major European airports have underlined the catalytic impacts of airports on the regional economy [
24,
25]. Specific studies have been proposed for the regional airport programming [
26,
27].
Donzelli demonstrated, through an analysis of the Southern Italy, that the growth in passenger volumes facilitated economic and employment growth and stimulated tourism in the surrounding regions; these are “catalytic effects” of air transport [
13].
High attention has been given to air transport in less developed countries in the South of the World, analyzing the link between air transport and economic development [
28].
One of the main themes in sustainability is the conflict that can often occur between social and economic interests, which are other than environmental considerations. A clear case is that of the so-called
regional or
secondary airports in the EU, which are located in underdeveloped regions. An airport is considered to be regional or secondary if it is not included in the core or in the comprehensive European TEN-T networks. On the one hand, actors motivated by the social interests perspective ask to keep the airport in operation, while on the other hand, others operating from perspective of economic concerns want to shut down the airport because of the limited traffic and insufficient revenue. In these cases, air service may be difficult to justify from a purely economic perspective [
29].
Yoshida and Fujimoto, through an analysis of Japanese airports, showed the inefficiency of smaller airports subject to higher costs than larger airports. Financial aid seems an efficient solution to keep a regional airport alive [
30].
Regional and national policies aim to activate strategies to enable air services to survive through incentives like PSO (Public Service Obligations) as well as by encouraging the population to remain in these areas using air transport for higher education, health, tourism and work [
31].
Adler et al. showed how small airports can be structured and managed by reducing the financial dependence on subsidies [
32].
Laurino and Beria analyzed the relationship between low cost carriers and secondary airports in Italy by addressing the issue of incentive systems. Airport policies should include a strategy to promote destinations and local development and not just air traffic [
33]. Grimme et al. identified feasible ways for airport management and (regional) governments to cope with the legal framework for airport managers and owners and for policymakers [
34].
Laurino et al. investigated the effect of the alternative policy scenarios to improve domestic accessibility from areas that had an airport without scheduled services. They compared a reference scenario (no scheduled services) with a scenario with added PSO routes to improve the land accessibility to the nearest main airport [
35].
The paper takes into consideration a secondary airport located in Southern Italy, which is in an underdeveloped Region as classified in EU [
36].
Crotone airport is a node that serves an area with a strong tourist and cultural vocation but without connection with TEN-T core. Airport management has had several problems in the past that led to the closure of the airport activities. As such, this airport is representative of the inefficiency of small airports subject to higher costs.
The paper considers how to simulate an actual and planned situation and then which model can be used for demand and which model to calculate parameters (
Section 2). The second theme is relative to the possibility of using an aggregate model, based on traffic counts, to a national demand problem, extending the reverse assignment database from an urban case to a national case. Then, in
Section 3, the case of a regional airport where the model has been applied is analyzed and the main quantitative values that give a good fit of the revealed ones are reported.
The results show that, in a secondary airport of an underdeveloped region, the introduction of PSO is important. Air transport is more polluting (considering passenger per kilometer) than other modes of transportation over national distances, but in the absence of land (road and rail) and sea corridors, it has a lower impact than that of the construction of infrastructures; air transport allows sustainable future development considering the economic aspects related to accessibility from/to the external regions.
The proposed model can be easily and cheaply implemented in secondary airports that do not have significant financial resources, providing scientifically valid and technically very useful results for planning the development of the region served.
2. Methodological Approach
2.1. Multimodal Model for Air Transport
Demand models are mathematical tools to estimate travel demand that is usually expressed by Origin–Destination (O/D) matrices, whose elements represent the number of users travelling from each origin, O, to each destination, D, in a defined time period, using each mode of transport and choosing each path.
Demand models simulating the user choice behavior (as origin, destination, mode and path choice) are affected by transport network performances. The number of users is the estimate value that represents the demand for each choice level, and it results from the model application starting from a set of attributes and parameters.
The demand models developed for air transport belongs to two classes.
The standard class for air transport is the one of the single-mode models that uses different mathematical methods based mainly on the analysis of time series. The single-mode is highly used considering that air flight is the prevailing mode on long distances, and in fact, it has reduced alternatives on this scale of distances [
37].
The second class is that of multimodal models which have various formulations and which, for path choice in collective transport services such as air transport, can differ greatly when synchronic or diachronic space-time networks are used [
37,
38,
39,
40].
A multimodal demand model is necessary for Crotone airport in order to estimate the demand component for air transport. This need derives from the economic and financial problems of the airport management company, which led to the closure of the airport from 1 November 2016 to 30 November 2017. From 2017, the airport passed to a new company that manages the airport system of Calabria. This system includes all the Calabria airports: Crotone, Lamezia Terme, and Reggio Calabria. The closure of the Crotone airport brought traffic flows to zero during the years of closure.
The multimodal model makes it possible to estimate the dOD demand by considering all the alternatives available at current state for moving from O to D.
For an airport, indicated {
M}, the set of available modal alternatives, whose
m elements are the modes air, train, bus and car, the
dOD demand is:
The rail component is defined by the railway service network with conventional and/or speed services that allow reaching the D destination.
The bus component is defined by the service network with services that allow reaching the D destination with very low monetary costs.
The car component is defined by the highway and the road network.
In general, the rail (dOD,rail), bus (dOD,bus) and car (dOD,car) demand components can be obtained on the basis of data from national statistical sources.
There are no calibrated models in the literature and in national open database to estimate the multimodal demand for Southern Italy.
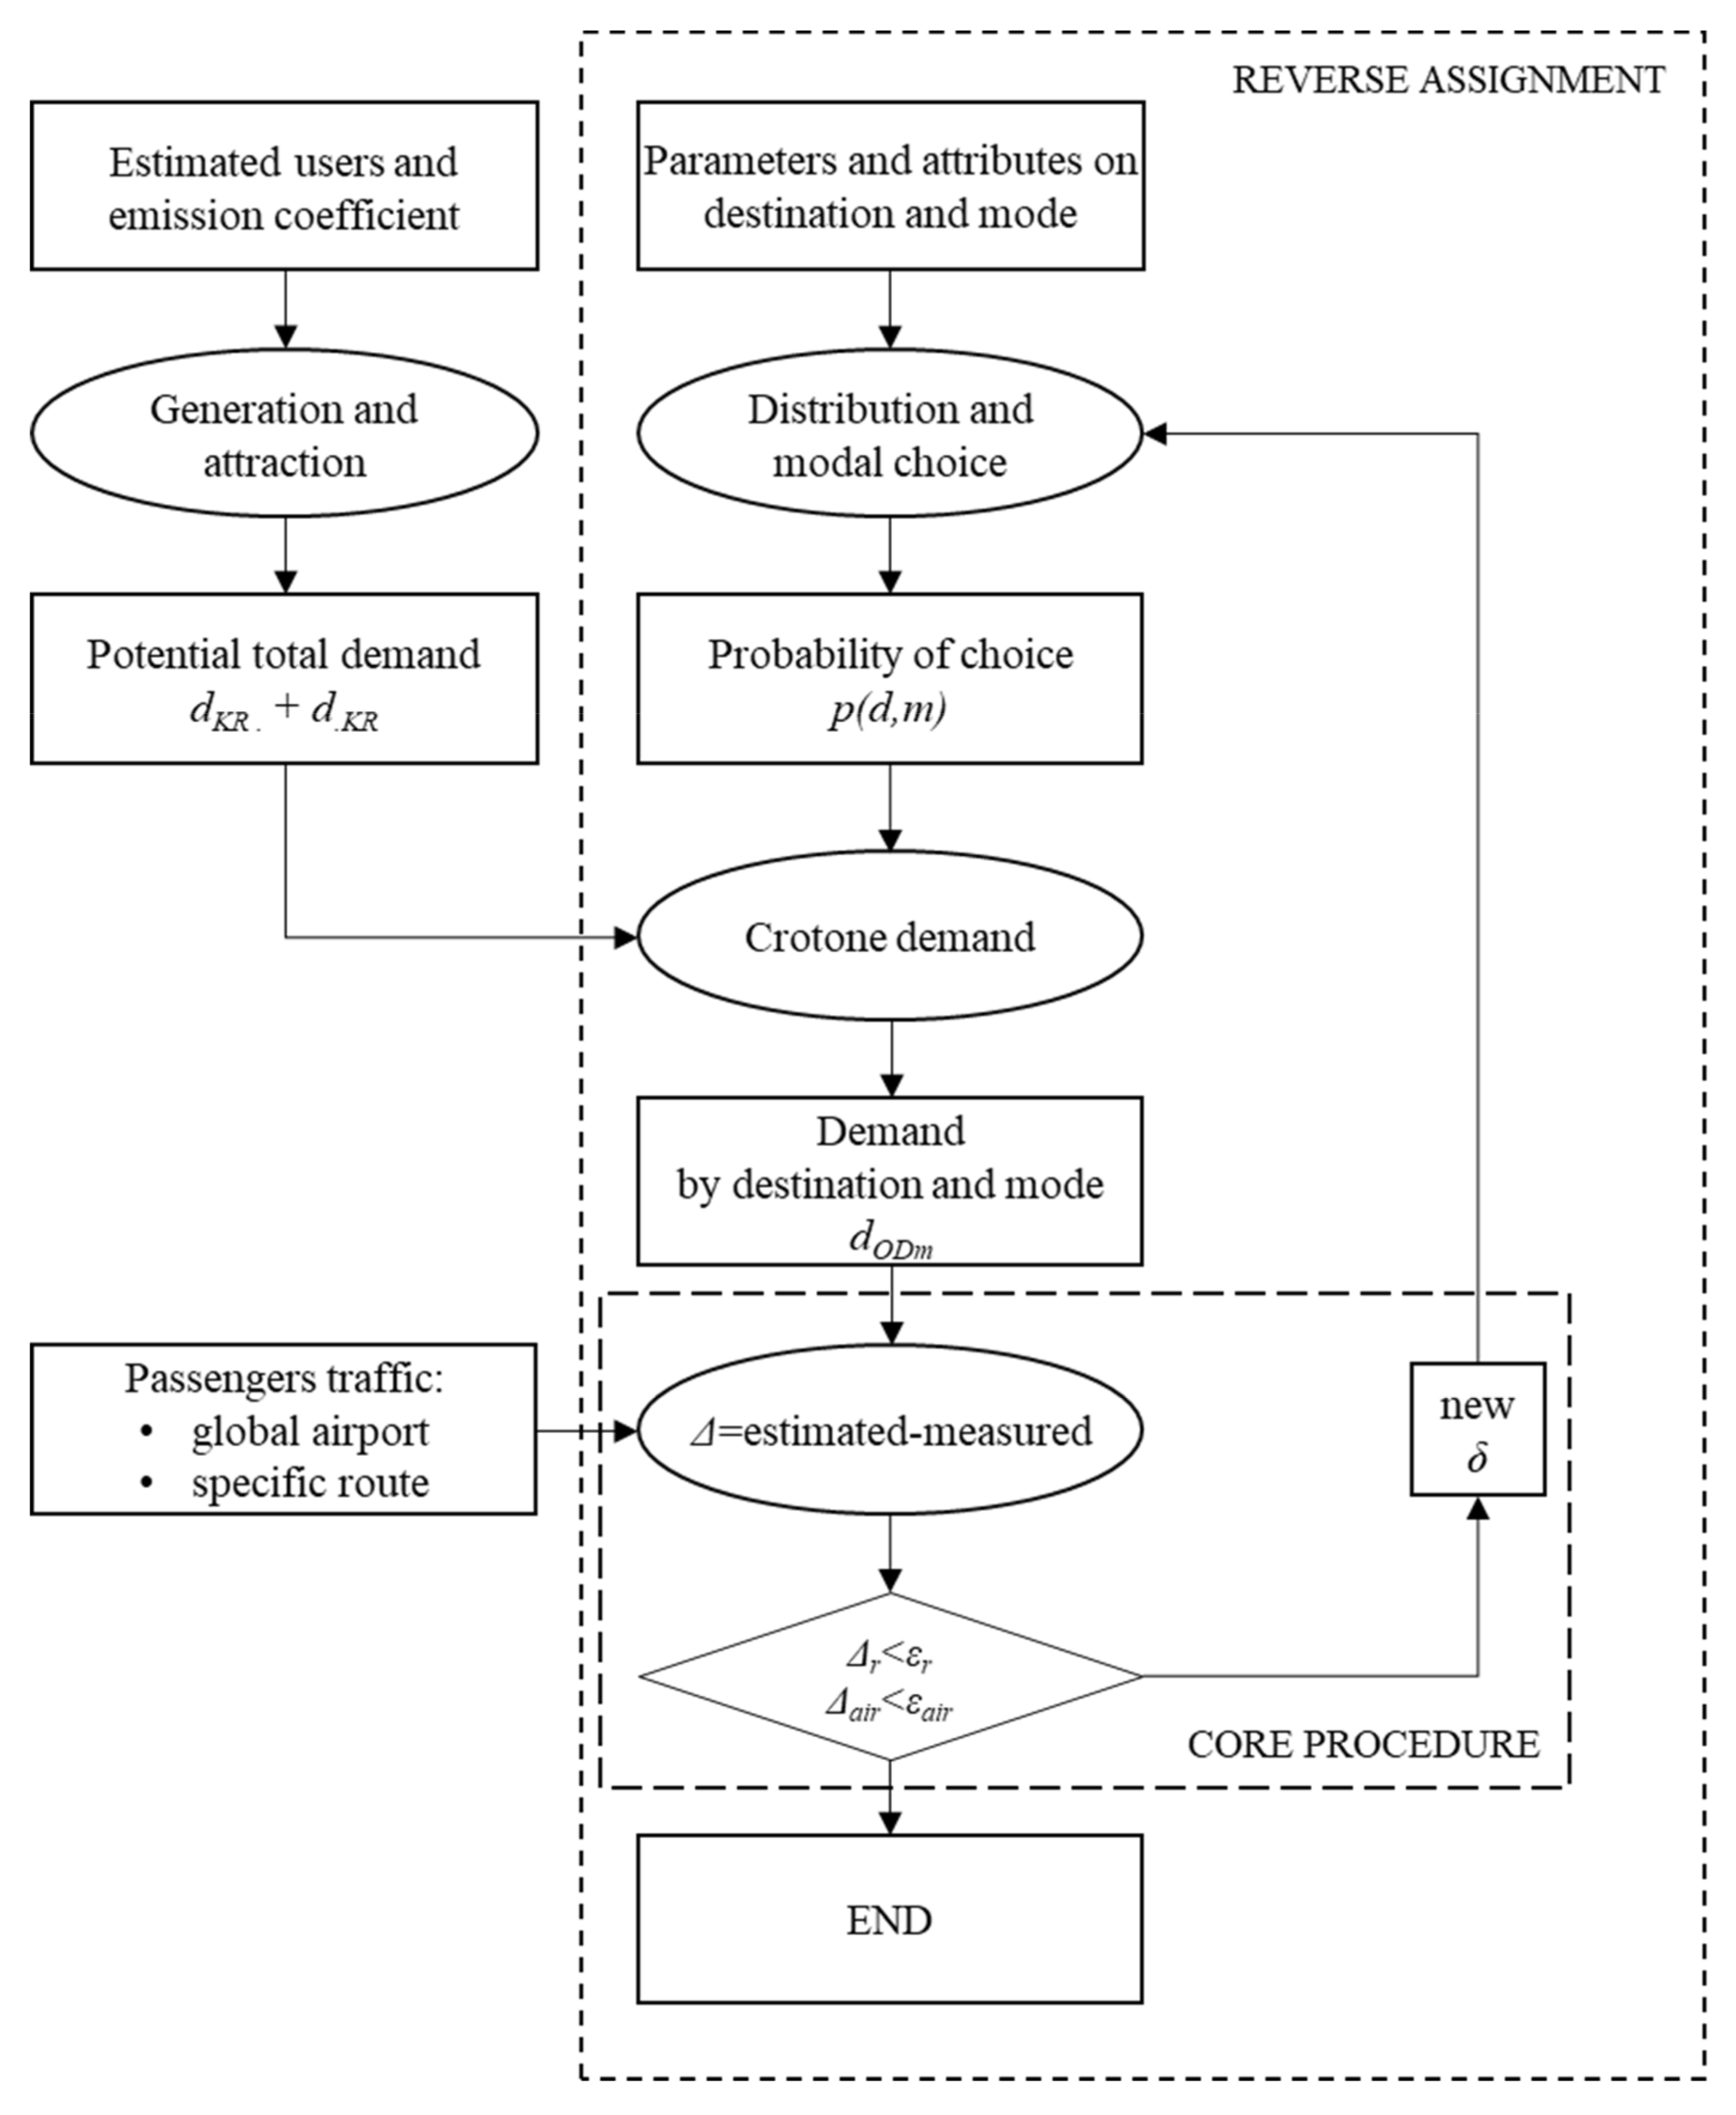
In this paper, starting from the literary demand model, a model for the test case district of the considered airport has been formulated. The estimate of the demand was carried out using a reverse assignment model using traffic counts [
41]. In the following paragraphs, the individual application models and the sequence of use within the procedure are presented. In
Figure 1, the overall methodological procedure of the reverse assignment is presented in the form of a flow chart, with an indication of the individual models and the interactions between them.
2.2. Formulation of the Demand Model
The general formulation of a national demand model system that simulates the number of extra-provincial trips make by the generic user
i travelling from
O origin to
D destination for the
s reason in a
h period by a
m mode of transport and by a
k path can be given [
42]:
where:
pi[x/Osh] is the probability that a user makes x extra-provincial trips for the s reason in the h time, obtained by the trip frequency model;
pi[D/Osh] is the probability to choose the D destination, obtained by the distribution model;
pi[m/OshD] is the probability to choose the m mode, obtained by modal choice model;
pi[k/OshDm] is the probability to choose the k path, obtained by the path choice model.
A hybrid model has been developed starting from the general structure of the Equation (2), in which the generated and attracted demand is estimated by a descriptive model, whereas the destination and modal demand is estimated by a generalized behavioral hierarchical model [
43]. Note that in the following, in the formulation of the models, we use the convention of writing the variables relating to the attributes with the English alphabet and the variables relating to the parameters with the ancient Greek alphabet. The difference between an attribute and a parameter is that an attribute is a measurable variable in a real case, while the parameter is the relative weight that is attributed to each aliquot of the functional model, both attribute-dependent and independent. The formulation is as follows:
where:
x is the population in the Crotone potential catchment area;
αf[mair] is an emission coefficient indicating the average number of trips made by users for national movements;
pi[D/osh] is the probability of choosing the D destination obtained by a distribution model and calculated using a single level hierarchical logit;
pi[m/OshD] is the probability of choosing the m mode obtained by the modal choice model and calculated using a multinomial logit.
The generation and attraction model used is descriptive of the class index by category. The model allows to estimate the total demand (generated and attracted)
dOD as a function of the population in the airport catchment area and of an emission coefficient [
42]:
The Crotone potential catchment area has been defined using a geographic deterministic approach, as described in the
Section 3, in which the general cost of transport depends on the access time to the available airports considered as alternatives to the Crotone airport.
The distribution and modal choice model are behavioral and of random utility type. The model estimates the probability of choosing destination
D and mode
m using the specification and the parameters reported in
Table 1 and
Table 2. The formulation is (elaboration from [
42]:
where:
: logsum on mode choice;
: shadow variable, which is 1 if O and D are in the same region, 0 otherwise;
: employees in D zone;
The distribution model initial parameters are [
42]:
: 0.334 [num/10];
: 1.787 [0/1];
: 0.913 [num in ln].
The modal choice model parameters are [
42]:
: −1.23 [h];
: −0.16 [euro] (average value);
: 3.81 [num] (num. car/num. family members with driving license);
: −3.72 [0/1];
: −0.97 [num];
: −0.60 [h];
ASA intercity train: −0.54 [num];
ASA night train: 9.96 [num];
ASA bus: −2.31 [num];
A single level hierarchical logit model is used to consider the interconnections among the choices at the national scale. In fact, the use of separate models for choosing the mode and destination is valid when the choices are made for different time scenarios of the user, such as for systematic trips. Using a hierarchical logit, the δ parameter calibration allows to highlight the relationship between the two choices.
2.3. Reverse Assignment Formulation
Cascetta and Nguyen presented an in-depth study of the methodology for estimating or updating origin–destination trip matrices from traffic counts [
44]. An analysis of the statistical foundation followed to estimate and update the problems. Various basic approaches were reviewed using a generic traffic assignment map.
Cascetta and Russo [
45] proposed a general statistical framework that defines Maximum Likelihood, Non-Linear Generalized Least Squares (NGLS) and Bayes estimators of aggregated demand model parameters combining counts-based information with other sources (sample or a priori estimates), thus extending and generalizing previous work by the authors [
46]. Subsequently, a solution algorithm of the projected-gradient type was proposed for the NGLS estimator given its convenient theoretical and computational properties.
Russo and Vitetta proposed a unified approach to obtain both the parameters of link performance functions and the demand values (and/or the values of demand model parameters) leaving from traffic assignment model [
41].
The model used is called reverse assignment because the input is the output of a classical traffic assignment model and the output is the input.
From a formal point of view, reverse assignment consists in obtaining the best values of the demand in terms of values dOPT and/or model parameters βOPT, the link cost parameters αOPT, and traffic flow fOPT, with the minimization of an objective function, starting jointly from traffic counts and generalized cost measures on a subset of network links and considering user behavior.
The objective functions can have different formulations. The general one is:
where:
The choice of the functional form for z1, z2, z3 and z4 depends on the type of available information.
The choice of the specification of the objective function and the weight of each term are not arbitrary and depend on available data and their reliability.
Starting from Equation (10), it is possible to formulate the problem of reverse assignment for the application case.
The Equation (11), considering that in the studied case the link cost
c and the parameters α are fixed, becomes:
as
z4(cm(α),) is zero because cm(α) ≃ ; the cost functions are fixed since all the considered networks are not congested.
2.4. Reverse Assignment Procedure
The demand is related to the year period and is assumed to be valid in the condition of intra-period stationarity. Then the supply and demand have the same constant average value for a period of time sufficiently large to allow the achievement of stationary conditions, or conditions in which the significant quantities assume constant and independent values to the instant to which reference is made.
The application provided for the following phases (
Figure 1):
application of the generation and attraction model at national level and estimate of the potential total demand;
application of the distribution and modal choice model and estimate of the choice probability of destination D and mode m;
estimate of the demand vector D where generic element dODm indicates the number of total movements between O and D by the mode m in a year;
reverse assignment core procedure:
- ◦
calculation of the Δ value between the estimated and measured demand for the considered route Δr and global for Crotone airport Δair;
- ◦
check if the two Δ are minor of a reference percentage of measured values ɛairr r and ɛairr;
- ◦
generation of the new value for the parameter δ.
In the applied case, if there is no information about the variance–covariance matrices of demand and flow and demand model parameters, then it is assumed that the matrices are identity matrices.
The identity matrix is invertible, and the inverse coincides with the original one.
It needs to be considered that the δ parameter, to have congruence with nested logit, can move between 0 and 1. This is the last information that can be used in the formulation.
The final problem, considering Equation (12), can be written as:
From the comparison between the basic model and the applied model, it can be noted that the model system applied has 3 levels of choice against the 4 in the basic model.
The first level relates to the choices on generation and attraction, and the second and third are related to the choice of destination and mode. For the first, a descriptive model was used, while for the others, a behavioral model was.
The reverse model works to minimize the objective function solving the reverse problem. After defining the specification with the different variables, the calibration–verification cycle (core procedure) was repeated several times until a satisfactory model was reached with respect to the reverse problem.
The calibration concerns parameter δ of the hierarchical logit demand models. This model was applied to calculate the probability of choosing the destination and the mode.
It can be noted that parameter δ allows to highlight and underline the relation between the choices made by the user with respect to these two dimensions, which, on the national scale, do not occur at different times.
With the proposed approach, the necessary calculations are reduced to a few iterations with the use of commonly used calculation software (spread sheet, such as Excel), without the need to use specific software.
The parameter δ was changed, and the procedure was repeated until the average values of the Δrand Δair calculated became less than 10%.
3. Reverse Assignment Application
To estimate the air transport demand for Crotone airport considering new air services with or without PSO, a specific procedure in the general framework of the reverse model needs to be organized. The main steps of the procedure are related to the following:
3.1. Catchment and Study Areas
Crotone airport is located in the central eastern part of the Calabria region in Southern Italy.
To define the catchment area, it is possible to use a probabilistic approach in which each user location is considered according to the probability of a user choosing an airport from the set of the accessible ones. Then, for each Calabrian town, there is a non-null probability to choose the Crotone airport [
47].
Considering the strategic level of the applied model, a direct deterministic approach has been used to value the airport’s potential catchment area; it is assumed that people choose the closest airport. The access times from all the Calabrian towns to the three Calabrian airports have been calculated to define the limit of the different catchment areas. If the access time from a town to the Crotone airport has been less than the time required to access other airports, the town has been associated with the catchment area of Crotone airport.
The Bari (BA) and Salerno (SA) airports have been also considered for the Cosenza district in order to further test the estimate of the catchment area of the Crotone airport. The results are summarized in
Table 2.
The current accessibility state of Crotone airport has made the access method’s choice of car the only available method.
The results of the above deterministic analysis are represented in
Figure 2, where the areas of the regional territory associated with the catchment areas of the Crotone (KR), Lamezia Terme (LT), and Reggio Calabria (RC) airports are highlighted.
The figure allows to appreciate both the decisive role of the Tyrrhenian Highway for access to Lamezia Terme airport and the serious marginalization to which the Crotone area would be relegated in the absence of an effective supply of air transport service from the Crotone airport.
The study area is the geographical area within which the analyzed transport system is located, in which it is believed that most of the effects of the planned interventions are exhausted. The study area includes the Crotone district and the other towns of the identified basin and Central-Northern Italy.
The study area is divided into 6 traffic zones: zone 1 coincides with the catchment area of the Crotone airport, while the other 5 zones are located in Central-Northern Italy.
The zoning has been defined with regard to homogeneity parameters of the traffic zones according to the socio-economic, orographic and infrastructural characteristics and administrative limits.
Furthermore, zoning has been defined so that each area identifies a system that gravitates to at least one airport of national interest from the National Airport Plan.
The centroid of each zone coincides with the most important city in the reference territorial system. The level of attraction/generation of each traffic zone is expressed in terms of the number of employees (
Table 3).
The traffic zones are:
Crotone (KR), the centroid of the zone is Crotone city, and the airport is Crotone (CRV);
North West (NW), the centroid of the zone is Torino city, and the airport is Torino (TRN);
The North Center (NC) is segmented in two zones:
- ◦
the centroid of the zone is Milano/West city, and the airport is Milano Malpensa (MPX). It is defined as North Center-A (NC-A);
- ◦
the centroid of the zone is Milano/East city, and the airport is Bergamo (BGY). It is defined as North Center-B (NC-B);
North East (NE), the centroid of the zone is Venezia city, and the airport is Venezia (VCE);
Center North (CN), the centroid of the zone is Bologna city, and the airport is Bologna (BLQ);
Center (C), the centroid of the zone is Roma city, and the airport is Roma Fiumicino (FCO).
The basic network has been built by selecting the supply that performs a relevant function of connection among Crotone and the 5 traffic zones related to the considered modes of transport: air, train, bus and car, following the public modes synchronic model [
49].
For air transport, the flights are only from Crotone to NC-B (BGY) and CN (BLQ) zones; to the other zones, the flights considered are from Lamezia Terme airport, which is the alternative and closest airport to the Crotone zone.
For rail transport, rapid and night runs were considered, with and without changes during the same service.
For bus transport, all runs have been considered, with/without changes during the same run.
For road transport, infrastructure with a high level of service has been considered.
It is possible to consider that the intrazonal network to the centroids is the road.
3.2. Passenger Traffic Data to Calibration
In Italy, the National Airport Plan [
50] defines 10 homogeneous traffic basins, identified according to transport and territorial functional criteria for air transport. In these 10 basins, the National Airport Plan identifies 38 airports of national interest, chosen based on criteria linked to the following: strategic role, territorial location, size and type of traffic, and inclusion in trans-European transport network projects (TEN- T).
Among the 38 airports, 12 are of particular strategic importance and, among these 12, 3 airports play the role of intercontinental gates.
The 26 airports that are not of particular strategic importance can be considered secondary or regional. Inside the set of secondary airports, it is possible to consider the subset of airports that have an annual passenger traffic of less than 1 million. Among these airports, there are Crotone and Reggio Calabria.
The Reggio Calabria airport is considered as a benchmarking area. For this area, we evaluated the global national demand as the sum of rail and air demand. Car and bus demand are marginal in respect to train and air.
The passenger traffic for Reggio Calabria airport is obtained from ENAC data resources for the years 2016, 2017 and 2018. The rail demand has been calculated by service train supply in the years 2016 and 2017 and multiplied for an estimated occupancy coefficient.
Therefore, it is possible to calculate the rate between the estimated multimodal demand of the benchmarking airport and the estimated potential population in the catchment area reported in
Table 2.
ENAC provides data on historical traffic counts at Italian airports.
The data from ENAC allows constructing a vector of the traffic counts FKR for Crotone airport, where the generic element FKR,Y indicates the total traffic in the year Y. The value FKR,Y results from the sum of the flows measured FKR,Yr on all the routes r in year Y.
In 2015, the value of total traffic counts for Crotone airport was 280,037 passengers. In 2016, it was 217,136 passengers. The airport was closed in 2017, but in 2018, total traffic was 83,797 passengers. Note that, in 2018, the airport was operative only for 6 months: although it was opened from 1 November 2017, the first flight was on 1 June 2018.
For the following years, the hypothesis is that the negative trend stopped and that, for some years, the traffic was similar to 2018. In this way, the value considered is that of 2018 doubled.
ENAC also provides traffic data on routes with more than 50,000 passengers.
From these data, only the traffic counts on the Crotone–Bergamo route is available.
For this route, in 2015, the value was 121,865 passengers, and in 2016, it was 112,472 passengers. In 2018, the value is not available because it is less than 50,000 passengers. In line with the total traffic, also for the considered route Crotone–Bergamo, the hypothesis is that the negative trend stopped and that the passengers were the last counted.
3.3. Reference Public Results
The generation-attraction model estimates potential total demand of 350 thousand travel/year, in reference to the benchmark basin.
The distribution model estimates a probability for each zone as reported in
Table 4.
The hierarchical model estimates generic element dOD of demand vector D that indicates user numbers from origin O Crotone to generic destination D in one of the other 5 traffic zones. The comparison between estimated and measured demand gives Δr and Δair less than εr and εair. The reverse calibration gives a value of the δ parameter equal to 0.07.
Table 4 shows the summary values in actual scenario “without” Public Service Obligation (PSO). The model, specified and calibrated to estimate the actual demand, has been applied in a project scenario with public PSO. This financial support concerns new flights departing from Crotone to traffic zones not actually connected: Torino (NW zone), Milano Malpensa (NC-A zone), Venezia (NE zone), and Roma Fiumicino (C zone).
Note that, in the model applied at the date, it has been assumed that the respective traffic zones are connected to Crotone with flights departing from the airport of Lamezia Terme.
In the project scenario, the model is applied assuming that generated-attracted demand is constant. The probability of choosing the destination and mode has been calculated with respect to the systematic utilities of the destination/mode alternatives with calibrated δ parameter.
With respect to the general structure of the proposed model, it can be indicated that the generation and attraction model is descriptive and cannot therefore reproduce contractions or expansions of the demand in relation to the choice to move or not move; the destination and modal model reproduces the choice of destination due to the variables that influence the mode.
The Crotone model applied to the actual and project scenario allows us to appreciate the demand induced by the establishment of air services on currently unavailable connections “with” PSO: Torino, Milano Malpensa, Venezia and Roma Fiumicino airports.
From the presented public results, it can be underlined that, in the actual scenario, the air transport demand is about 150,000 travelers. In the project scenario, the demand increases to 220,000 with an increment of about 50% in respect to the actual scenario. It should be noted that the probability of choice of destination and mode increases in the project scenario for destinations in Northern Italy (Torino, Milano Malpensa and Venezia) compared to the actual scenario. For destinations in Northern Italy, travel times, number of shifts, and monetary costs are an effective advantage of the air mode, more than for the Center (Rome).
4. Conclusions
In the paper, the problem of demand forecasting at a national scale has been discussed. The multimode model used is a hybrid with a descriptive model for the choice of attraction/generation and behavioral models for destination and modal choices. A single level hierarchical logit has been used to consider the relationship between the two behavioral choice models. The path choice under modal choice is not considered because, for each airport, only one route is considered linking Crotone airport to the other airports.
The model system has been applied to the Calabria area in Southern Italy.
The calibration of the model has specifically concerned the correlation parameter between the two behavioral choice levels. The calibration has been developed starting from the air traffic counts available for some years now. The model, with the calibrated values of the parameters, was applied to analyze a future scenario in which the PSO is introduced.
The main scientific conclusions are as follows:
The general aim of the paper, to calibrate the δ parameter, has been pursued, and the results show a good representativeness of the traffic estimated. It is interesting to note that the parameters of the model are a mix between those of systematic utility, identical to the initial parameters, and the δ recalibrated. This result is related to the low number of traffic flows available but gives the possibility to update data in a correct way.
A second result is that air transport demand has been calculated starting from counts with a reverse assignment approach that is studied in the literature and applied for urban contexts.
It is useful to highlight how with the proposed approach the necessary calculations can be traced back to a few iterations with the use of a commonly used spreadsheet and without the need to use specific software.
The results obtained are also very valid with respect to the case study. Firstly, it can be noted that the results were used as the basis for the European and Italian state authorization to use PSO support.
Analyzing the results from the technical-planning point of view, some significant elements emerge with respect to the case studied; these can be considered valid ideas for research in other territorial contexts with the same socio-economic characteristics. These elements constitute the points of greatest value for the research developed and are at the same time a limit because they refer only to the case study. In this sense, it may be useful to develop research for other European secondary airports using the values obtained here as a benchmark for the others.
The conclusive (actual) elements are as follows:
at a secondary airport in an underdeveloped region, the PSO is decisive for guaranteeing external accessibility;
to allow sustainable future development, air transport is decisive; in fact, the presence of the airport (with PSO) makes it possible to reach the most advanced areas of the country (North West and North East), which are not otherwise accessible, from the area in question;
similarly, air transport allows for tourist accessibility to the area in question. These means that tourism sector development does not have to wait on the construction of land infrastructures (motorway and high-speed rail) which the area in question does not have.
The paper considers a general model and study case on the topic of sustainable air transport and takes into account the following evidence:
in general, air transport is more polluting (per passenger per kilometer) than other modes, over national distances; in the absence of land corridors (road and rail), it has a lower impact than that of the construction of infrastructures, but it needs the introduction of PSO;
in underdeveloped regions, air transport allows sustainable future development considering the economic aspects related to accessibility from/to the outside.
The proposed model can be easily and cheaply implemented in secondary airports that do not have significant financial resources, providing scientifically valid and technically very useful results for planning the development of the region served.


 ,
, 

