
Public Transport Use and Satisfaction by International Students and Researchers

 , , and
Abstract
:1. Introduction
2. Literature Review
3. Hypotheses, Data, and Methods
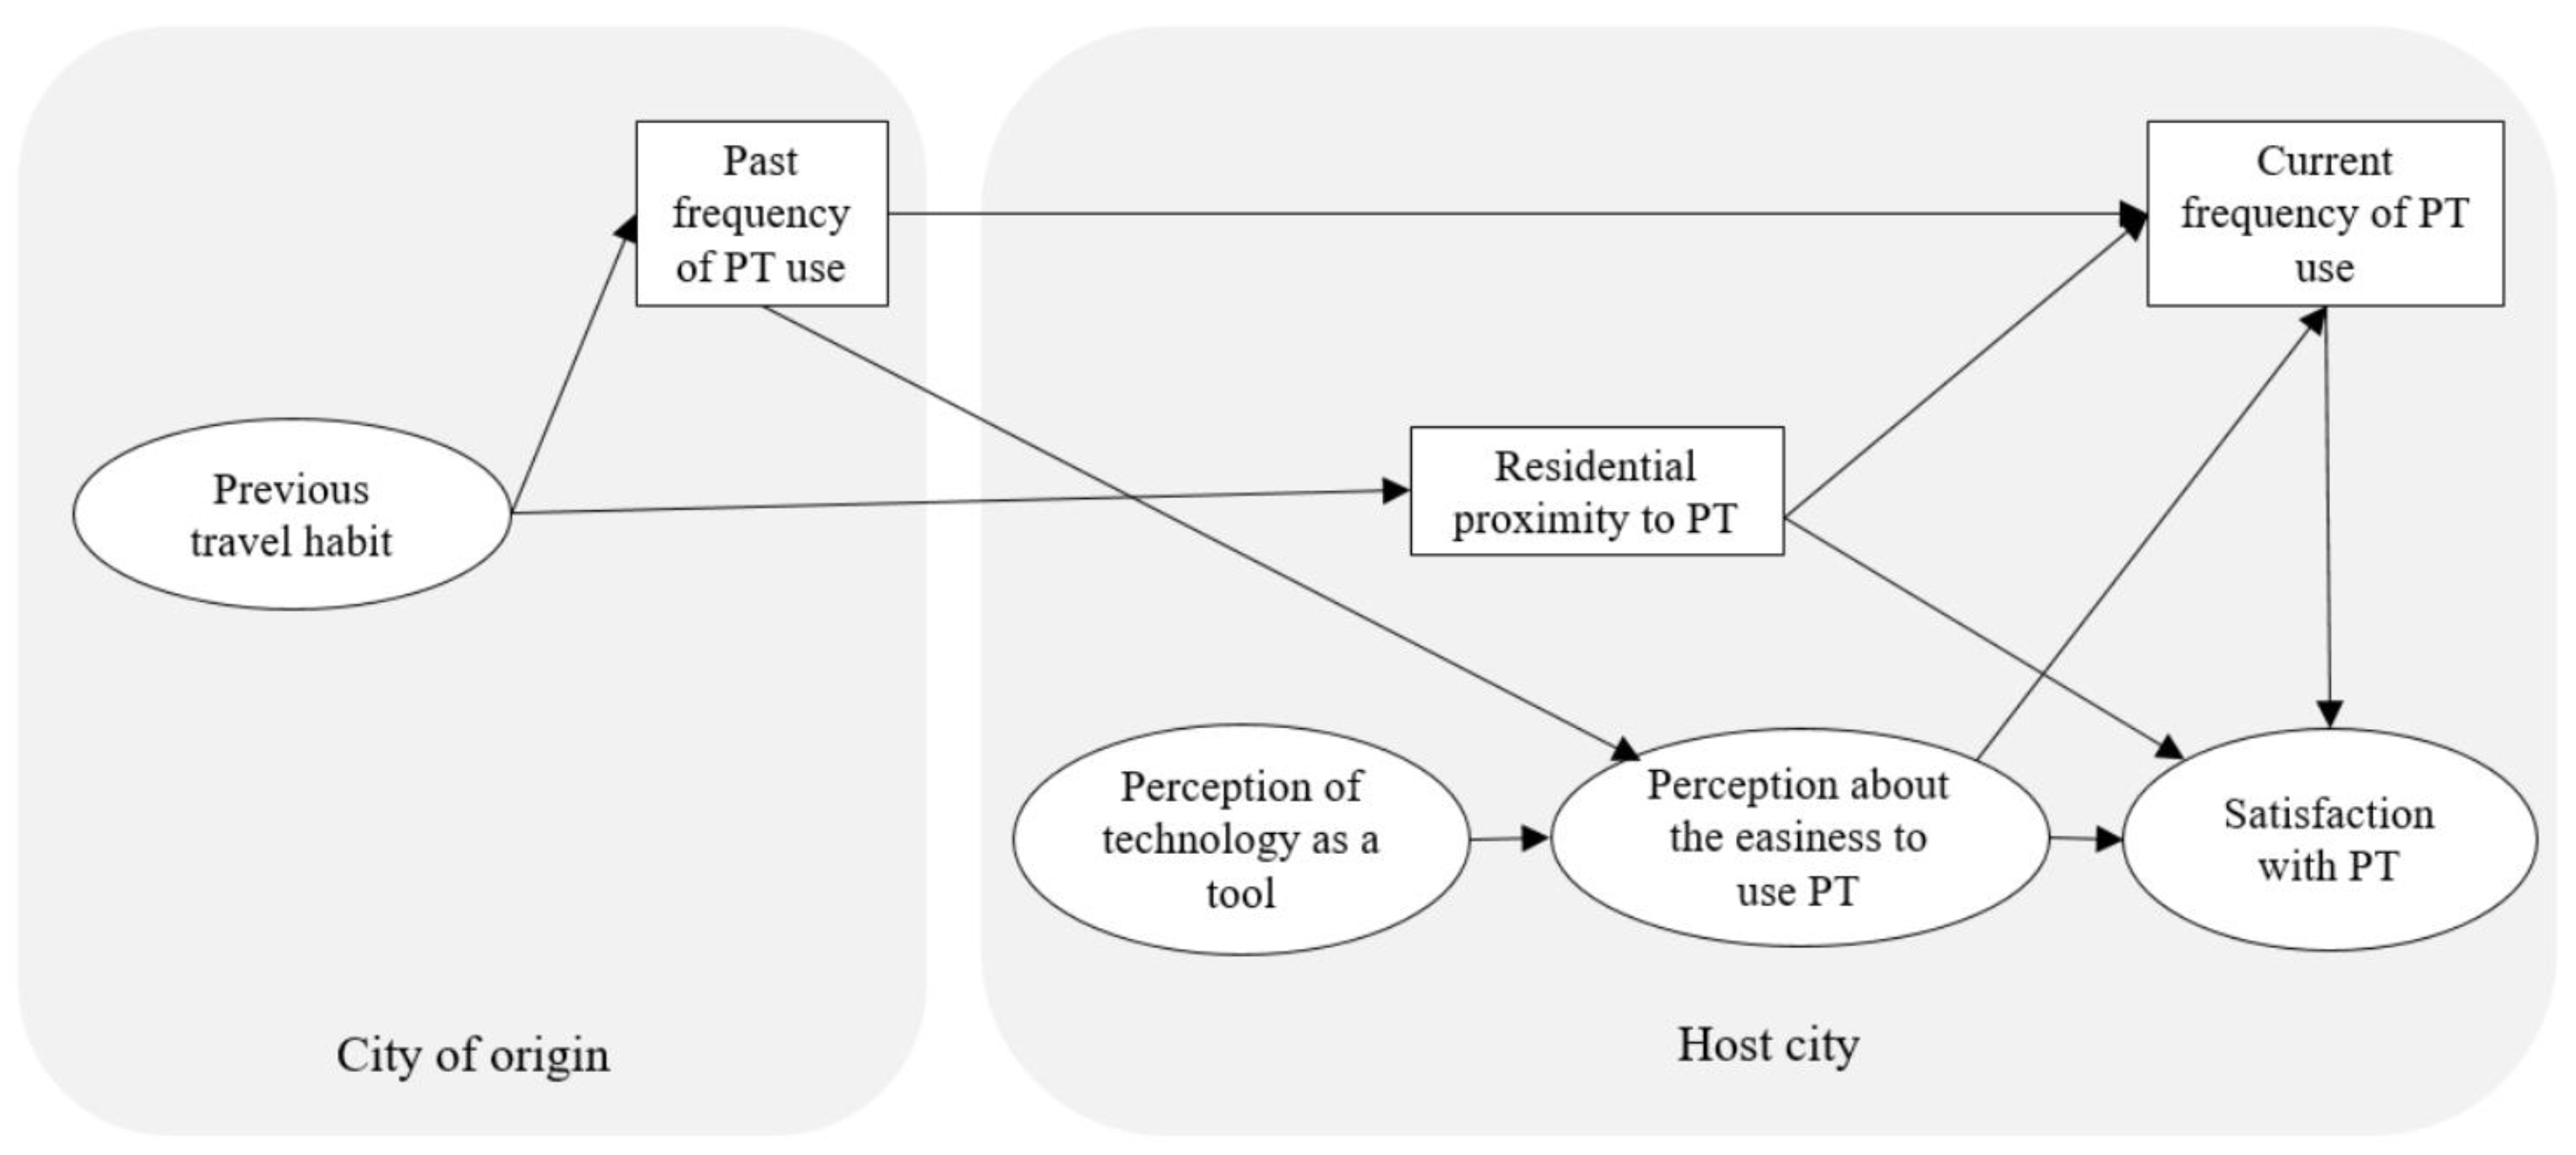
3.1. Hypotheses
3.2. Survey Design and Data Collection
3.3. Bayesian Structural Equation Model
3.4. Sample Characteristics
4. Results and Discussion
4.1. Exploratory Factor Analysis
4.2. Measurement Model
4.3. Structural Equations Model
5. Conclusions
Author Contributions
Funding
Institutional Review Board Statement
Informed Consent Statement
Data Availability Statement
Acknowledgments
Conflicts of Interest
References
- OECD. International Migration Outlook 2019—Chapter 1. Recent Developments in International Migration Movements and Policies; International Migration Outlook; OECD: Paris, France, 2019. [Google Scholar]
- UNESCO. Education: Outbound Internationally Mobile Students by Host Region; UNESCO: Paris, France, 2020. [Google Scholar]
- European Commission. Erasmus: Facts, Figures & Trends; European Commission: Brussels, Belgium, 2015; ISBN 978-92-79-52814-9. [Google Scholar]
- European Commission. Erasmus + Annual Report 2019; European Commission: Brussels, Belgium, 2019; ISBN 9789279967221. [Google Scholar]
- European Union Erasmus+ 2021–2027. Available online: https://op.europa.eu/s/oTcf (accessed on 18 July 2021).
- Crisci, M.; Di Tanna, B. Flexible Mobility for Unstable Workers: South-North Temporary Migration in Italy. Polis 2016, 30, 181–210. [Google Scholar] [CrossRef]
- Rau, H.; Popp, M.; Namberger, P.; Mögele, M. Short Distance, Big Impact: The Effects of Intra-City Workplace Relocation on Staff Mobility Practices. J. Transp. Geogr. 2019, 79, 102483. [Google Scholar] [CrossRef]
- De Vos, J.; Ettema, D.; Witlox, F. Changing Travel Behaviour and Attitudes Following a Residential Relocation. J. Transp. Geogr. 2018, 73, 131–147. [Google Scholar] [CrossRef] [Green Version]
- Fatmi, M.R.; Habib, M.A. Modelling Mode Switch Associated with the Change of Residential Location. Travel Behav. Soc. 2017, 9, 21–28. [Google Scholar] [CrossRef]
- Scheiner, J.; Holz-Rau, C. Changes in Travel Mode Use after Residential Relocation: A Contribution to Mobility Biographies. Transportation 2013, 40, 431–458. [Google Scholar] [CrossRef]
- Mokhtarian, P.L.; Cao, X. Examining the Impacts of Residential Self-Selection on Travel Behavior: A Focus on Methodologies. Transp. Res. Part B Methodol. 2008, 42, 204–228. [Google Scholar] [CrossRef] [Green Version]
- Stanbridge, K.; Lyons, G. Travel Behaviour Considerations during the Process of Residential Relocation. In Proceedings of the 11th International Conference on Travel Behaviour Research, Kyoto, Japan, 16–20 August 2006; pp. 16–20. [Google Scholar]
- Welsch, J.; Conrad, K.; Wittowsky, D. Exploring Immigrants Travel Behaviour: Empirical Findings from Offenbach Am Main, Germany. Transportation 2018, 45, 733–750. [Google Scholar] [CrossRef] [Green Version]
- Klinger, T. Moving from Monomodality to Multimodality? Changes in Mode Choice of New Residents. Transp. Res. Part A Policy Pract. 2017, 104, 221–237. [Google Scholar] [CrossRef]
- Klinger, T.; Lanzendorf, M. Moving between Mobility Cultures: What Affects the Travel Behavior of New Residents? Transportation 2016, 43, 243–271. [Google Scholar] [CrossRef]
- Burbidge, S.K. Foreign Living Experience as a Predictor of Domestic Travel Behavior. J. Transp. Geogr. 2012, 22, 199–205. [Google Scholar] [CrossRef]
- Frändberg, L. Temporary Transnational Youth Migration and Its Mobility Links. Mobilities 2014, 9, 146–164. [Google Scholar] [CrossRef]
- Collins, F.L. Researching Mobility and Emplacement: Examining Transience and Transnationality in International Student Lives. Area 2012, 44, 296–304. [Google Scholar] [CrossRef]
- Glover, P. A Comparison between Domestic and International Students’ Trip Characteristics: Evidence from an Australian University. J. Vacat. Mark. 2011, 17, 263–274. [Google Scholar] [CrossRef]
- Thomas, G.O.; Poortinga, W.; Sautkina, E. Habit Discontinuity, Self-Activation, and the Diminishing Influence of Context Change: Evidence from the UK Understanding Society Survey. PLoS ONE 2016, 11, 1–16. [Google Scholar] [CrossRef]
- Bamberg, S.; Rölle, D.; Weber, C. Does Habitual Car Use Not Lead to More Resistance to Change of Travel Mode? Transportation 2003, 30, 97–108. [Google Scholar] [CrossRef]
- Müggenburg, H.; Busch-Geertsema, A.; Lanzendorf, M. Mobility Biographies: A Review of Achievements and Challenges of the Mobility Biographies Approach and a Framework for Further Research. J. Transp. Geogr. 2015, 46, 151–163. [Google Scholar] [CrossRef]
- Clark, B.; Chatterjee, K.; Melia, S.; Knies, G.; Laurie, H. Life Events and Travel Behavior. Transp. Res. Rec. J. Transp. Res. Board 2014, 2413, 54–64. [Google Scholar] [CrossRef] [Green Version]
- Ajzen, I. The Theory of Planned Behavior. Organ. Behav. Hum. Decis. Process. 1991, 50, 179–211. [Google Scholar] [CrossRef]
- Smart, M.J.; Klein, N.J. Remembrance of Cars and Buses Past: How Prior Life Experiences Influence Travel. J. Plan. Educ. Res. 2018, 38, 139–151. [Google Scholar] [CrossRef]
- Cao, X.; Mokhtarian, P.L. How Do Individuals Adapt Their Personal Travel? A Conceptual Exploration of the Consideration of Travel-Related Strategies. Transp. Policy 2005, 12, 199–206. [Google Scholar] [CrossRef] [Green Version]
- Kim, J.H.; Pagliara, F.; Preston, J. The Intention to Move and Residential Location Choice Behaviour. Urban Stud. 2005, 42, 1621–1636. [Google Scholar] [CrossRef]
- Ettema, D.; Nieuwenhuis, R. Residential Self-Selection and Travel Behaviour: What Are the Effects of Attitudes, Reasons for Location Choice and the Built Environment? J. Transp. Geogr. 2017, 59, 146–155. [Google Scholar] [CrossRef]
- Cao, X.; Mokhtarian, P.L.; Handy, S.L. The Relationship between the Built Environment and Nonwork Travel: A Case Study of Northern California. Transp. Res. Part A Policy Pract. 2009, 43, 548–559. [Google Scholar] [CrossRef]
- Van Wee, B. Self-Selection: A Key to a Better Understanding of Location Choices, Travel Behaviour and Transport Externalities? Transp. Rev. 2009, 29. [Google Scholar] [CrossRef]
- De Abreu e Silva, J. Spatial Self-Selection in Land-Use–Travel Behavior Interactions: Accounting Simultaneously for Attitudes and Socioeconomic Characteristics. J. Transp. Land Use 2014, 7, 63. [Google Scholar] [CrossRef] [Green Version]
- De Abreu e Silva, J.; Morency, C.; Goulias, K.G. Using Structural Equations Modeling to Unravel the Influence of Land Use Patterns on Travel Behavior of Workers in Montreal. Transp. Res. Part A Policy Pract. 2012, 46, 1252–1264. [Google Scholar] [CrossRef]
- Van Acker, V.; van Wee, B.; Witlox, F. When Transport Geography Meets Social Psychology: Toward a Conceptual Model of Travel Behaviour. Transp. Rev. 2010, 30, 219–240. [Google Scholar] [CrossRef] [Green Version]
- Kinsella, J.; Caulfield, B. An Examination of the Quality and Ease-of-Use of Public Transport in Dublin from a New Comer’s Perspective. J. Public Transp. 2011, 14, 69–81. [Google Scholar] [CrossRef] [Green Version]
- Dziekan, K. Ease-of-Use in Public Transportation—A User Perspective on Information and Orientation Aspect. Ph.D. Thesis, KTH Royal Institute of Technology, Stockholm, Switzerland, 2008. [Google Scholar]
- Bell, M.; Ward, G. Comparing Temporary Mobility with Permanent Migration. Tour. Geogr. 2000, 2, 87–107. [Google Scholar] [CrossRef]
- Dal Fiore, F.; Mokhtarian, P.L.; Salomon, I.; Singer, M.E. “Nomads at Last”? A Set of Perspectives on How Mobile Technology May Affect Travel. J. Transp. Geogr. 2014, 41, 97–106. [Google Scholar] [CrossRef]
- Susilo, Y.O.; Cats, O. Exploring Key Determinants of Travel Satisfaction for Multi-Modal Trips by Different Traveler Groups. Transp. Res. Part A Policy Pract. 2014, 67, 366–380. [Google Scholar] [CrossRef]
- Ingvardson, J.B.; Nielsen, O.A. The Relationship between Norms, Satisfaction and Public Transport Use: A Comparison across Six European Cities Using Structural Equation Modelling. Transp. Res. Part A Policy Pract. 2019, 126, 37–57. [Google Scholar] [CrossRef]
- Cats, O.; Abenoza, R.F.; Liu, C.; Susilo, Y.O. Evolution of Satisfaction with Public Transport and Its Determinants in Sweden Identifying Priority Areas. Transp. Res. Rec. 2015, 2538, 86–96. [Google Scholar] [CrossRef]
- Wolday, F.; Næss, P.; Cao, X. Travel-Based Residential Self-Selection: A Qualitatively Improved Understanding from Norway. Cities 2019, 87, 87–102. [Google Scholar] [CrossRef]
- Monteiro, M.M.; de Abreu e Silva, J.; Haustein, S.; Pinho de Sousa, J. Urban Travel Behavior Adaptation of Temporary Transnational Residents. J. Transp. Geogr. 2021, 90. [Google Scholar] [CrossRef]
- Verplanken, B.; Orbell, S. Reflections on Past Behavior: A Self-Report Index of Habit Strength. J. Appl. Soc. Psychol. 2003, 33, 1313–1330. [Google Scholar] [CrossRef]
- Aultman-Hall, L.; Roorda, M.; Baetz, B.W. Using GIS for Evaluation of Neighborhood Pedestrian Accessibility. J. Urban Plan. Dev. 1997, 123, 10–17. [Google Scholar] [CrossRef]
- Byrne, B.M. Structural Equation Modeling with Mplus; Routledge: London, UK, 2013; ISBN 9780203807644. [Google Scholar]
- Kaiser, H.F. An Index of Factorial Simplicity. Psychometrika 1974, 39, 31–36. [Google Scholar] [CrossRef]
- Cronbach, L.J. Coefficient Alpha and the Internal Structure of Tests. Psychometrika 1951, 16, 297–334. [Google Scholar] [CrossRef] [Green Version]
- Hinton, P. SPSS Explained; Routledge: London, UK, 2014; ISBN 9781315797298. [Google Scholar]
- Muthén, L.K.; Muthén, B.O. MPlus User’ Guide; Muthén & Muthén: Los Angeles, USA, 2017; Available online: https://www.statmodel.com/download/usersguide/MplusUserGuideVer_8.pdf (accessed on 18 July 2021).
- Muthén, B.; Asparouhov, T. Bayesian Structural Equation Modeling: A More Flexible Representation of Substantive Theory. Psychol. Methods 2012, 17, 313–335. [Google Scholar] [CrossRef] [PubMed]
- Ouellette, J.A.; Wood, W. Habit and Intention in Everyday Life: The Multiple Processes by Which Past Behavior Predicts Future Behavior. Psychol. Bull. 1998, 124, 54–74. [Google Scholar] [CrossRef]
- Cao, J.; Cao, X.; Zhang, C.; Huang, X. The Gaps in Satisfaction with Transit Services among BRT, Metro, and Bus Riders: Evidence from Guangzhou. J. Transp. Land Use 2016, 9, 97–109. [Google Scholar] [CrossRef] [Green Version]
- De Vos, J. Satisfaction-Induced Travel Behaviour. Transp. Res. Part F Traffic Psychol. Behav. 2019, 63, 12–21. [Google Scholar] [CrossRef]
- Zhao, J.; Webb, V.; Shah, P. Customer Loyalty Differences between Captive and Choice Transit Riders. Transp. Res. Rec. J. Transp. Res. Board 2014, 2415, 80–88. [Google Scholar] [CrossRef]
- Friman, M.; Gärling, T. Frequency of Negative Critical Incidents and Satisfaction with Public Transport Services. II. J. Retail. Consum. Serv. 2001, 8, 105–114. [Google Scholar] [CrossRef]
- Choocharukul, K.; Van, H.T.; Fujii, S. Psychological Effects of Travel Behavior on Preference of Residential Location Choice. Transp. Res. Part A Policy Pract. 2008, 42, 116–124. [Google Scholar] [CrossRef]
- Abenoza, R.F.; Cats, O.; Susilo, Y.O. Travel Satisfaction with Public Transport: Determinants, User Classes, Regional Disparities and Their Evolution. Transp. Res. Part A Policy Pract. 2017, 95, 64–84. [Google Scholar] [CrossRef] [Green Version]
- Abdullah, M.; Dias, C.; Muley, D.; Shahin, M. Exploring the Impacts of COVID-19 on Travel Behavior and Mode Preferences. Transp. Res. Interdiscip. Perspect. 2020, 8, 100255. [Google Scholar] [CrossRef]
- Zhang, J.; Lee, J. Interactive Effects between Travel Behaviour and COVID-19: A Questionnaire Study. Transp. Saf. Environ. 2021, 3, 166–177. [Google Scholar] [CrossRef]


| Variables | Total | % |
|---|---|---|
| Gender (1 = man) | 130 | 43.62 |
| Age | ||
| Between 18–25 years | 183 | 61.41 |
| Between 26–30 years | 67 | 22.48 |
| Between 31–40 years | 40 | 13.42 |
| More than 40 years | 8 | 2.68 |
| Driver’s license (1 = have DL) | 223 | 74.83 |
| Continent of nationality | ||
| Africa | 10 | 3.36 |
| America | 181 | 60.74 |
| Asia | 22 | 7.38 |
| Europe | 85 | 28.52 |
| Oceania | 0 | 0.00 |
| Role at the University | ||
| Bachelor student | 93 | 31.21 |
| Master student | 69 | 23.15 |
| Integrated master student | 63 | 21.14 |
| PhD student | 52 | 17.45 |
| Post-doc | 5 | 1.68 |
| Researcher | 10 | 3.36 |
| Moment when respondents have searched for their residence in Porto | ||
| Before moving to Porto | 173 | 58.05 |
| After have moved to Porto | 115 | 38.59 |
| Have not chosen (moved to live with family or friends) | 10 | 3.36 |
| Factor (Cronbach Alpha) | Previous Travel Habit (0.663) | Perception about the Easiness to Use PT (0.526) | Satisfaction with PT (0.696) | Perception of Technology as a Tool to Aid Mobility (0.829) |
|---|---|---|---|---|
| Items | ||||
| I always made my transport choices in an automatic way | 0.604 | 0.007 | −0.049 | 0.128 |
| Every day I thought very carefully about my transport choices (R) | 0.692 | −0.001 | 0.029 | −0.033 |
| My daily routine was fixed, so I didn’t need to think about my transport options | 0.593 | −0.016 | 0.051 | 0.094 |
| Bus easiness-of-use | 0.050 | 0.643 | 0.104 | 0.027 |
| Metro easiness-of-use | −0.046 | 0.537 | 0.092 | 0.055 |
| Travel and waiting times are too long (R) | 0.014 | 0.091 | 0.667 | 0.068 |
| There are good information services | −0.038 | 0.358 | 0.528 | 0.147 |
| Public transport services cover well all the city | −0.001 | 0.091 | 0.508 | 0.060 |
| There often are service cancellations/delays (R) | 0.046 | −0.020 | 0.673 | −0.050 |
| Optimizes my overall travel experiences | 0.016 | −0.007 | 0.030 | 0.754 |
| Allows me to easily plan my travels | 0.037 | 0.061 | 0.040 | 0.763 |
| Allows me to find my way in the city and I do not need anything more to move around | 0.121 | 0.035 | 0.044 | 0.702 |
| Allows me to adapt easily to the city’s mobility | 0.091 | 0.098 | 0.087 | 0.721 |
| Factors | Previous Travel Habit | Perception about the Easiness to Use PT | Satisfaction with PT | Perception of Technology as a Tool |
|---|---|---|---|---|
| Items | ||||
| I always made my transport choices in an automatic way | 0.591 | 0.006 | −0.044 | 0.110 |
| Every day I thought very carefully about my transport choices (R) | 0.791 | −0.001 | 0.010 | −0.071 |
| My daily routine was fixed, so I didn’t need to think about my transport options | 0.653 | −0.001 | 0.013 | 0.065 |
| Bus easiness-of-use | 0.063 | 0.538 | 0.073 | −0.015 |
| Metro easiness-of-use | −0.016 | 0.866 | −0.017 | −0.012 |
| Travel and waiting times are too long (R) | 0.008 | 0.001 | 0.645 | 0.021 |
| There are good information services | −0.036 | 0.091 | 0.620 | 0.095 |
| Public transport services cover well all the city | −0.013 | −0.015 | 0.596 | 0.011 |
| There often are service cancellations/delays (R) | 0.040 | −0.063 | 0.702 | −0.108 |
| Optimizes my overall travel experiences | −0.005 | −0.035 | −0.014 | 0.824 |
| Allows me to easily plan my travels | −0.012 | 0.003 | −0.009 | 0.879 |
| Allows me to find my way in the city and I do not need anything more to move around | 0.035 | −0.001 | −0.010 | 0.795 |
| Allows me to adapt easily to the city’s mobility | 0.001 | 0.022 | 0.029 | 0.831 |
| Estimate | Posterior S.D. | 95% C.I. | 90% C.I. | |||
|---|---|---|---|---|---|---|
| Lower 2.5% | Upper 2.5% | Lower 5% | Upper 5% | |||
| Perception about the easiness to use PT | ||||||
| Integrated master student | 0.197 | 0.067 | 0.065 | 0.323 | ||
| Ph.D. student | 0.154 | 0.068 | 0.018 | 0.285 | ||
| Come from a European country | −0.197 | 0.073 | −0.337 | −0.051 | ||
| Satisfaction with PT | ||||||
| Post-doc student | −0.171 | 0.059 | −0.284 | −0.052 | ||
| Come from a European country | −0.134 | 0.068 | −0.266 | 0.000 | −0.246 | −0.021 |
| Had chosen the current residential place | 0.218 | 0.065 | 0.075 | 0.325 | ||
| Live in Porto for more than 6 months | −0.297 | 0.057 | −0.407 | −0.183 | ||
| Perception of technology as a tool | ||||||
| Ph.D. student | −0.199 | 0.059 | −0.308 | −0.079 | ||
| Come from a European country | −0.221 | 0.061 | −0.332 | −0.096 | ||
| Estimate | Posterior S.D. | 95% C.I. | 90% C.I. | |||
|---|---|---|---|---|---|---|
| Lower 2.5% | Upper 2.5% | Lower 5% | Upper 5% | |||
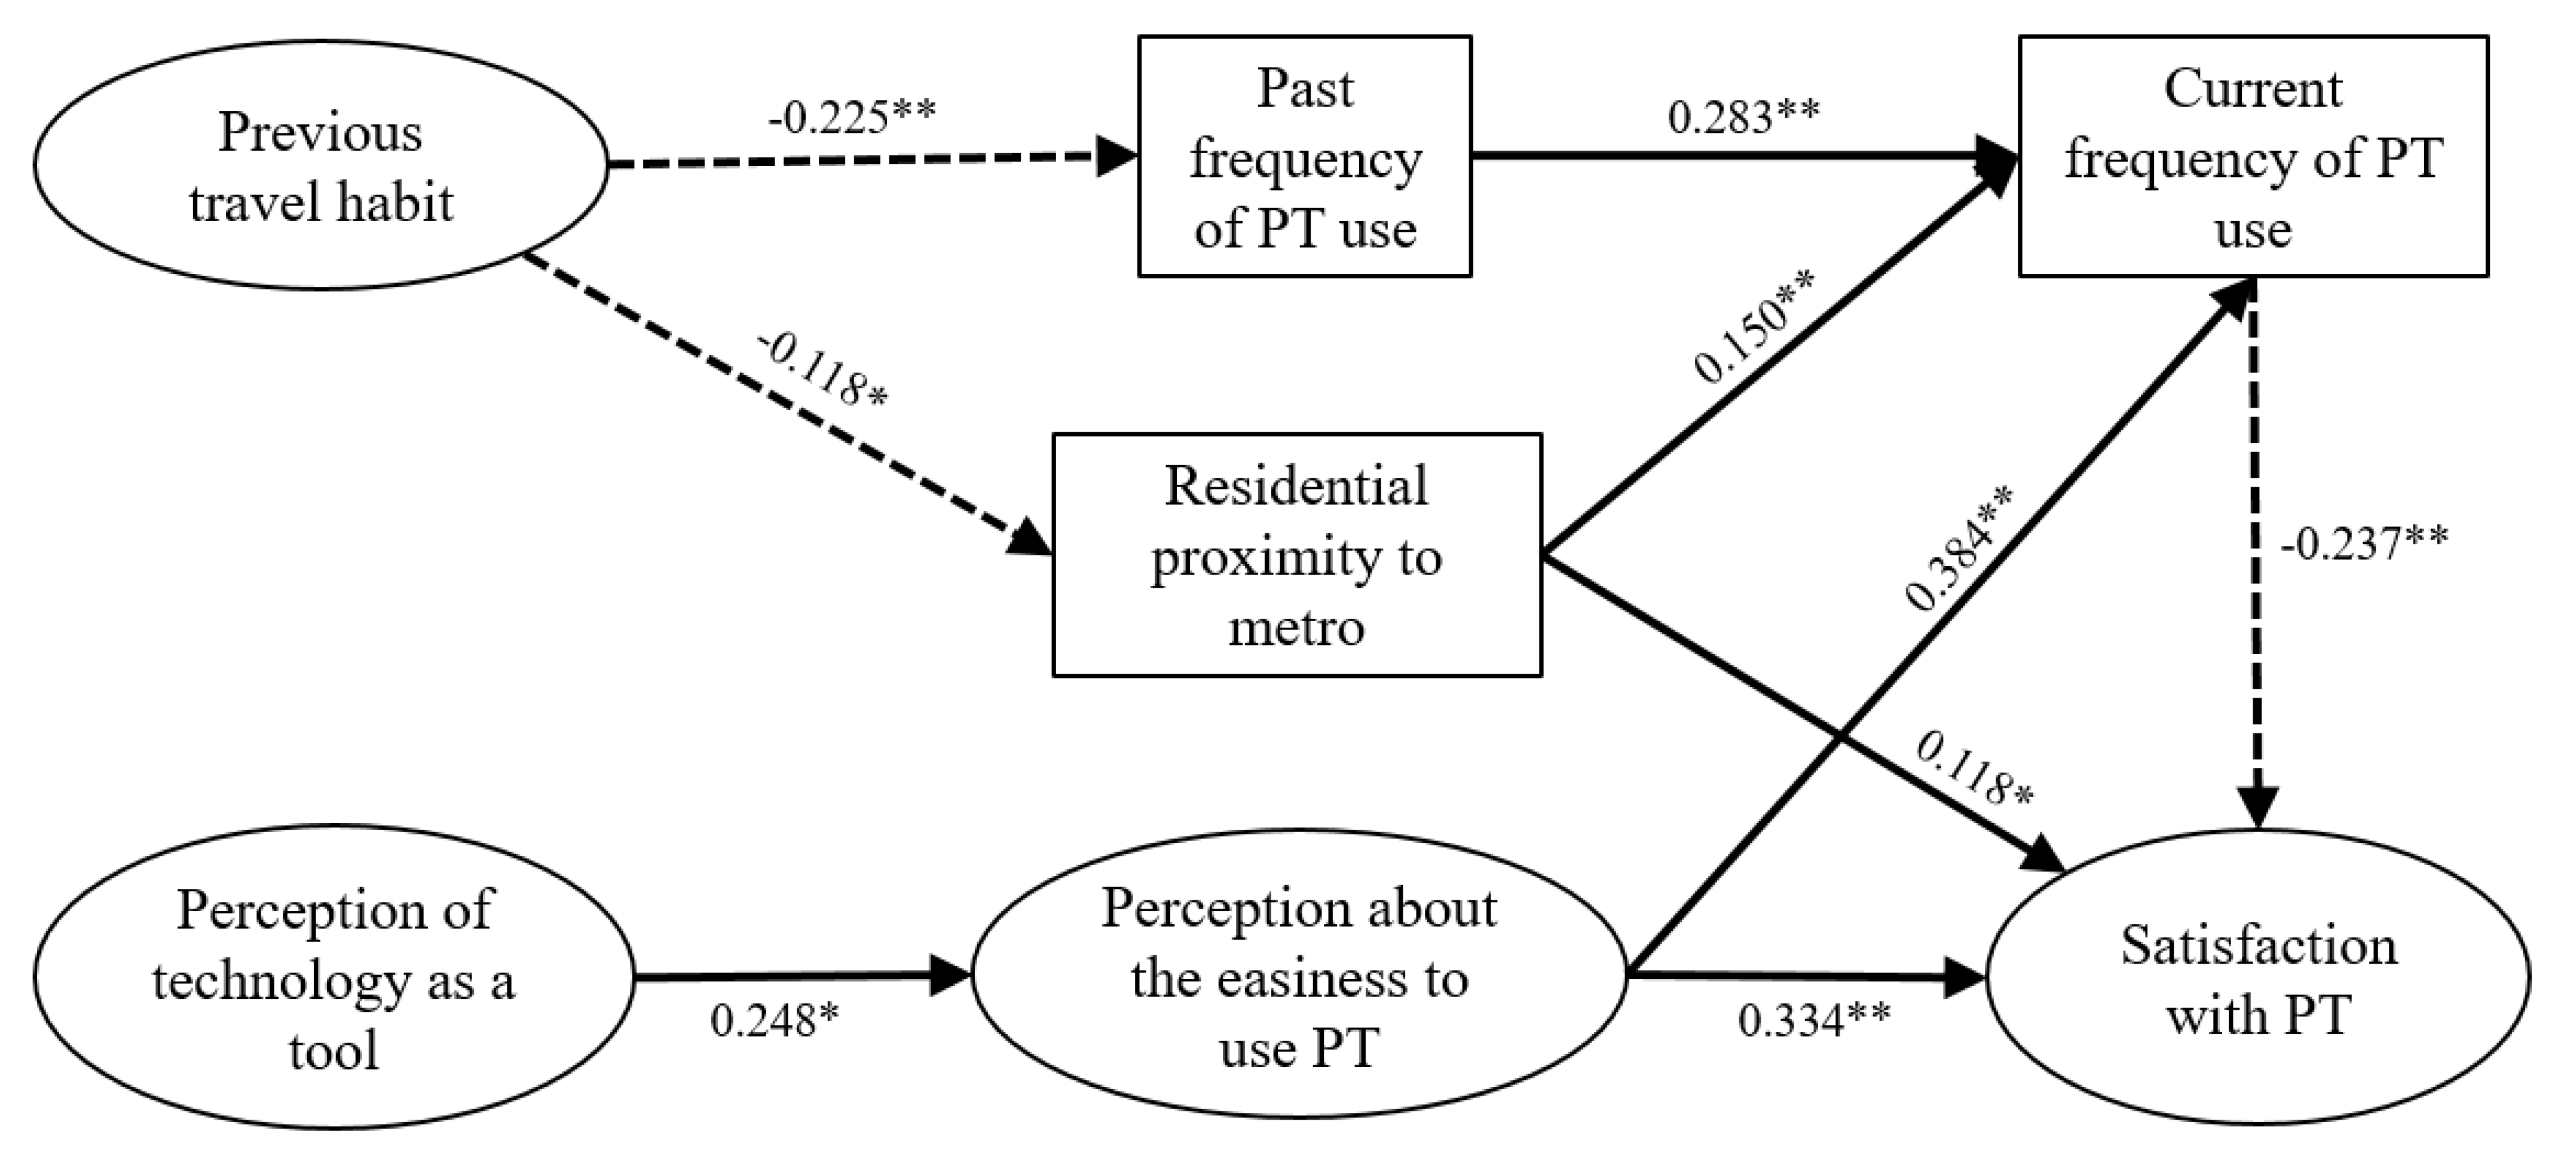
| Past frequency of PT use | ||||||
| Previous travel habit | −0.225 | 0.073 | −0.364 | −0.080 | ||
| Residential proximity to metro | ||||||
| Previous travel habit | −0.118 | 0.070 | −0.256 | 0.016 | −0.233 | −0.004 |
| Perception about the easiness to use PT | ||||||
| Perception of technology as a tool | 0.248 | 0.128 | −0.028 | 0.483 | 0.025 | 0.447 |
| Current frequency of PT use | ||||||
| Past frequency of PT use | 0.283 | 0.063 | 0.155 | 0.400 | ||
| Residential proximity to metro | 0.150 | 0.061 | 0.033 | 0.268 | ||
| Perception about the easiness to use PT | 0.384 | 0.074 | 0.238 | 0.527 | ||
| Satisfaction with PT | ||||||
| Perception about the easiness to use PT | 0.334 | 0.149 | 0.025 | 0.606 | ||
| Residential proximity to metro | 0.118 | 0.063 | −0.003 | 0.242 | 0.016 | 0.222 |
| Current frequency of PT use | −0.237 | 0.080 | −0.395 | −0.078 | ||
| Travel Habit | ||
|---|---|---|
| Frequency of Use | Correlation Coefficient | Sig. (2-Tailed) |
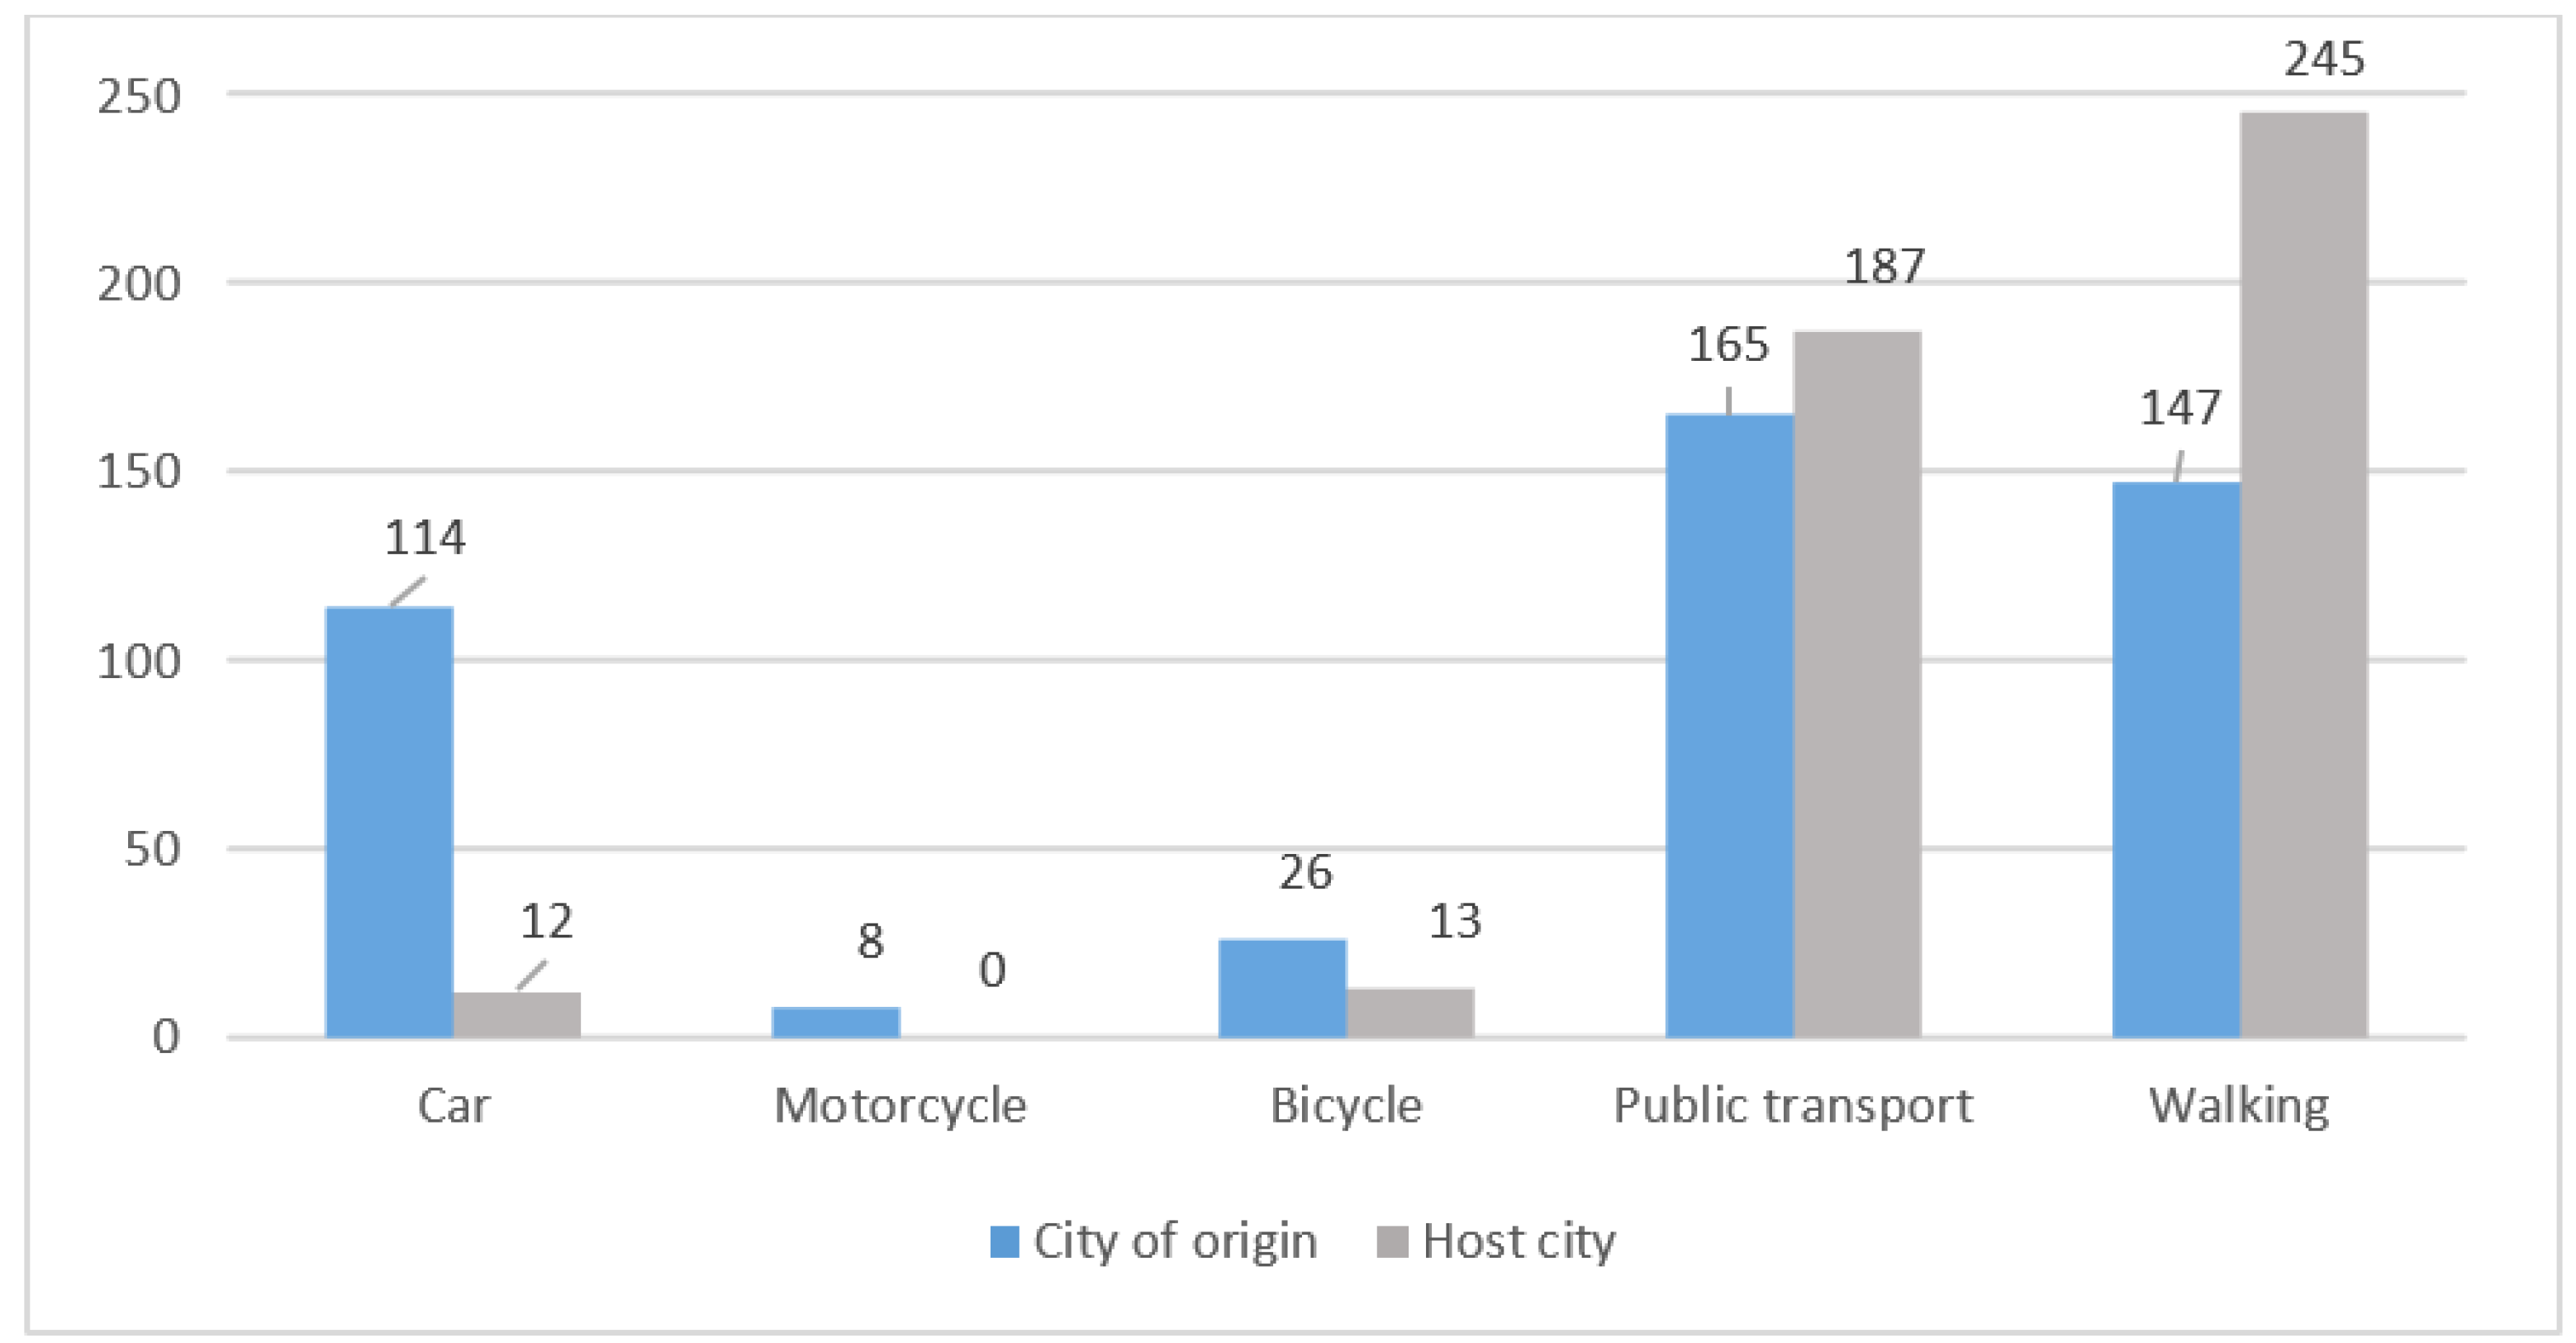
| Car (as driver or as passenger) | 0.151 ** | 0.009 |
| Public transport | −0.198 ** | 0.001 |
| Bicycle | −0.160 ** | 0.006 |
| Car-sharing | −0.155 ** | 0.007 |
| Walking (as the main mode, not as access to other modes) | −0.206 ** | 0.000 |
Publisher’s Note: MDPI stays neutral with regard to jurisdictional claims in published maps and institutional affiliations. |
© 2021 by the authors. Licensee MDPI, Basel, Switzerland. This article is an open access article distributed under the terms and conditions of the Creative Commons Attribution (CC BY) license (https://creativecommons.org/licenses/by/4.0/).
Share and Cite
Monteiro, M.M.; de Abreu e Silva, J.; Ingvardson, J.B.; Nielsen, O.A.; Pinho de Sousa, J. Public Transport Use and Satisfaction by International Students and Researchers. Sustainability 2021, 13, 8417. https://0-doi-org.brum.beds.ac.uk/10.3390/su13158417
Monteiro MM, de Abreu e Silva J, Ingvardson JB, Nielsen OA, Pinho de Sousa J. Public Transport Use and Satisfaction by International Students and Researchers. Sustainability. 2021; 13(15):8417. https://0-doi-org.brum.beds.ac.uk/10.3390/su13158417
Chicago/Turabian StyleMonteiro, Mayara Moraes, João de Abreu e Silva, Jesper Bláfoss Ingvardson, Otto Anker Nielsen, and Jorge Pinho de Sousa. 2021. "Public Transport Use and Satisfaction by International Students and Researchers" Sustainability 13, no. 15: 8417. https://0-doi-org.brum.beds.ac.uk/10.3390/su13158417