
COVID-19 Pandemic: Is the Crypto Market a Safe Haven? The Impact of the First Wave
by
 , , , and
Darko Vukovic
1,2,3 ,
,
Moinak Maiti
4,*,
Zoran Grubisic
5,
Elena M. Grigorieva
1,2 and
Michael Frömmel
6 1
International Laboratory for Finance and Financial Markets Finance, Faculty of Economics, People’s Friendship University of Russia (RUDN University), Miklukho-Maklaya Str.6, 117198 Moscow, Russia
2
Finance and Credit Department, Faculty of Economics, People’s Friendship University of Russia (RUDN University), Miklukho-Maklaya Str.6, 117198 Moscow, Russia
3
Geographical Institute “Jovan Cvijic” SASA, Djure Jaksica 9, 11000 Belgrade, Serbia
4
National Research University Higher School of Economics, St. Petersburg School of Economics and Management, Department for Finance, Kantemirovskaya St. 3A, 194100 Sankt Petersburg, Russia
5
Belgrade Banking Academy, Faculty for Banking, Insurance and Finance, Zmaj Jovina 12, 11000 Belgrade, Serbia
6
Department of Economics, Ghent University, Sint-Pietersplein 5, 9000 Gent, Belgium
*
Author to whom correspondence should be addressed.
Sustainability 2021, 13(15), 8578; https://0-doi-org.brum.beds.ac.uk/10.3390/su13158578
Submission received: 25 June 2021
/
Revised: 16 July 2021
/
Accepted: 26 July 2021
/
Published: 31 July 2021
/
Corrected: 12 November 2021
(This article belongs to the Special Issue The Influence of COVID-19 on Sustainable Economy)
Abstract
:The present study investigated whether the crypto market is a safe haven. The study argues that during the first wave of the COVID-19 crisis, gold and oil, as typical global commodities, could have been diversifiers. The study developed a unique COVID-19 global composite index that measures COVID-19 pandemic time-variant movements on each day. The study used OLS (ordinary least squares), quantile, and robust regressions to check whether the COVID-19 crisis has had any significant direct influence on the crypto market. The OLS, quantile, and robust regressions estimates confirmed that there was no statistically significant direct influence of the COVID-19 crisis on the crypto market in the first wave period. However, the study found spillovers from risky assets (S&P 500) on the crypto market, with Tether as an exception. Due to this special characteristic, Tether might present a safe haven within the crypto market.
1. Introduction
The coronavirus disease of 2019 (COVID-19) was detected in Wuhan, China at the beginning of December 2019. However, it was officially reported for the first time to the world by the World Health Organization (WHO 2020) on 31 December 2019. Within a month, WHO declared the COVID-19 outbreak as a public health emergency of international concern at their second meeting of the Emergency Committee (WHO, 2020). The virus had already spread to all parts of the world, and on 11 March 2020, WHO declared it as a global pandemic. Fear and panic did not bypass the world economy. The Dow Jones Industrial Average Index downscaled more than 40% from 29.348 on 19 February to 18.591 on 23 March 2020 (MarketWatch 2020). A similar trend was observed for S&P 500 (downscaled from 3.386 to 2.237) and other well-known world indices during the same period.
The global scientific and business community believes that the world economy will have one of the biggest crises ever. Financial markets, airline industries, SMEs, tourism and hospitality, services, construction, and mortgage sectors all recorded a large drop in the first quarter of 2020. According to [1], this crisis is a “Black Swan” event, as originally described by [2]. The study by [1] argued that this event was expected to have an extreme impact that lies outside the area of regular expectations. Several studies have focused on the existence of this issue during crises [3,4,5] and epidemic diseases [6,7].
The global demand for many goods and services has plummeted due to a large portion of the population is in quarantine across the globe. The government imposed strict social distancing measures in an attempt to prevent the spread of the disease. The recession has hit many sectors and businesses. In the first quarter of 2020, the world oil and gas sectors faced a deep recession due to its falling demand caused by the ongoing pandemic and policy failures of the OPEC countries. On 20 April 2020, the West Texas Intermediate futures (WTI futures) contract had slumped from $17.85 a barrel to −$37.63 (Bloomberg, 2020). For the first time in history, oil futures became negative and oil prices dropped below 1985’s minimum. However, gold shows a different trend. According to Bloomberg, after a short fall in gold’s price in early March ($1500 and less per ounce). The gold price rose continuously and exceeded $1700 within a month after. The Bank of America raised its 18-month gold price target to $3000 (Bloomberg).
It is important to look at how cryptocurrencies behave in this situation. The greatest challenge that lies in the context of the ongoing COVID-19 crisis is to find a “safe haven”. A safe haven is supposed to be immune to this crisis and protect the value of assets of investors. Several studies have shown that cryptocurrencies (especially Bitcoin) have no hedging or safe haven capabilities [8,9]. According to the study of [10], Bitcoin has fewer characteristics as a hedge and safe haven compared to gold. Moreover, it is not the best instrument to hedge structural crude oil price shocks (compared to gold) [11]. Cryptocurrencies showed a higher correlation with riskier assets between the period of March and April 2020 (Bloomberg). Bitcoin slumped from $8000 to −4000 in a few days in mid-March 2020. However, within a month, Bitcoin hit strong resistance around $7500, as market players reacted positively to the news that COVID-19 outbreaks had started to stabilize in some of the worst affected countries. This is in accordance with the authors of [12], who stated that Bitcoin is a highly volatile asset with extreme price dynamics and price clustering. It shows a positive correlation with downward markets [10]. This unique situation will stimulate numerous studies in the future to test the speculative activity of investors and their real influence on global market prices [13]. According to preliminary data, investors have no strong speculative impact on global market prices during a pandemic crisis.
The present study was inspired by the following two questions: “Is there any safe haven for cryptocurrencies during a pandemic crisis?”, and “Which cryptocurrency can be used for hedging?” The study investigated the connection of cryptocurrencies to gold and oil during the first wave of the pandemic (the first 6 months) along with the response of financial markets to these variables. To examine the impact, the study used mean-based OLS regression, conditional median-based quantile regression, and robust regression for additional robustness checks. Moreover, depending on the regression results, the study applied the model that was most suitable for the tested variables (in the case of high tail value estimations). The study also examined the co-movement and contagion effect between cryptocurrency pairs using wavelet coherence diagrams. Thus, the goal of the study was to examine all such interdependencies that arose (in the first wave of the crisis) due to the ongoing COVID-19 crisis to support future studies. The COVID-19 crisis seems to be ongoing and is about to reach its three highest peaks across the globe. The present study developed a composite COVID-19 index to answer the fundamental question “How should one measure the effect of COVID-19 globally?” The study findings have both scientific and practical significance, bearing in mind the development of financial theory in the field of crises and cryptocurrencies (theoretical), on the one hand, and investor reactions to the shocks (practical) on the other. The study adds value to the existing literature by creating a COVID-19 global composite index and examining the impact of the ongoing COVID-19 crisis on the crypto market. More specifically, the present study contributes by investigating more specific crypto market issues, such as if the crypto market is a hedge or safe haven.
2. Theoretical Background
The influence of the COVID-19 crisis on cryptocurrency has been studied by several authors in the last few months [6,12]. The study by [6] considered five cryptocurrencies to investigate herding biases by quantifying the self-similarity intensity of cryptocurrency returns’ during the COVID-19 pandemic. The study found that the COVID-19 crisis has had a positive impact on the efficiency of the cryptocurrency market. To test the influence of the COVID-19 pandemic on cryptocurrency market efficiency, the study used the following methodologies: a multifractal detrended fluctuation approach, the Magnitude of Long memory index, and the generalized Hurst exponent. The study also highlighted that Bitcoin was more efficient before the COVID-19 crisis. Likewise, Ethereum was more efficient during and after the outbreak of the COVID-19 crisis. The study by [14] analyzed the impact of the COVID-19 crisis on 15 equity indices, 4 bond benchmark indices, 9 precious metals, and 3 cryptocurrencies (Bitcoin, Ethereum, and Litecoin) using a quantile autoregression model. The study found that the COVID-19 crisis could be a “Black Swan” event, especially for cryptocurrencies. Corbet et al. [12] found that there is negative sentiment toward COVID-19 and cryptocurrency returns. The study also highlighted that investors could have benefitted from the investment diversification, as digital assets (social media) acted as a safe haven in comparison to precious metals during previous crises (similar to the case of a “Black Swan”). The study used a standard GARCH model (generalized autoregressive conditional heteroskedasticity) and the Python package to derive the above inference. The study by [15,16] forecasts the impact of COVID-19 will be significant, both economically and socially. However, the study does not entirely support the findings of the previous studies that the COVID-19 pandemic can be seen as a “Black Swan” event. This is due to the fact that this crisis is totally unexpected, with strong impacts not only on the global economy and finance but also a health crisis. In the study of [17], wavelet methods were applied to examine the impact of COVID-19 on Bitcoin prices. The study used daily data of COVID-19 world deaths and daily Bitcoin prices from 31 December 2019 to 29 April 2020. The study found that the COVID-19 pandemic affected the price growth of Bitcoin. Hereafter, this section additionally discusses the theoretical explanations concerning cryptocurrency behavior, methodologies, and studies that analyzed precious metals and cryptocurrencies.
The crypto market is very volatile, especially with its most famous currency, Bitcoin. Bitcoin is mostly used for speculative purposes, which causes high volatility and market bubbles [17,18,19]. Given the growing interest in Bitcoin, it is important to choose a reliable model to forecast the risk of such an investment. By using specifications that can account for structural breaks in GARCH, namely Markov switching GARCH models, the authors of [20,21] analyzed Bitcoin daily log returns exhibiting regime changes in their volatility dynamics. Because of such dynamics, it is important to explore ways to reduce the level of risk of an investment in Bitcoin and to hedge or discover some factors that can influence the price movement of Bitcoin.
Tether is the only important stable coin on the crypto market with significant market capitalization. Tether is purportedly backed by USD (US dollar) reserves, but there is no clear evidence of it. The study by [22] tested two hypotheses regarding the role of a Tether in the crypto world, especially on Bitcoin. The first hypothesis put forward was that demand is driven by the idea that Tether is being used as a medium of exchange for fiat currency’s entry into the crypto world. The second hypothesis was that Tether flows cause positive Bitcoin returns. The obvious argument behind this is that Tether is being printed, without support, in USD, and is pushed out into the market with an inflationary effect on asset prices. This is in accordance with the study of [22], which has shown that none of the exposures to macroeconomic factors, stocks markets, currencies, or commodities can explain cryptocurrency prices. On the other hand, ref. [20] found in their study that Tether has a sizable impact on Bitcoin prices. These findings are generally consistent with the evidence that sophisticated investors may earn profit from the bubbles [23].
This is interesting due to the fact that [24,25,26] claim that in some situations, the speculative activity of investors will not be the main reason for volatilities on global market prices. Similarly, according to [18,27,28], cryptocurrencies are characterized by extreme volatilities and bubbles, price jumps [29], co-explosivity [30], and strong speculative targets (especially Bitcoin, Ethereum, and similar cryptocurrencies). However, cryptocurrencies are not only currencies but also assets [28,31,32] and an investment destination for investors [12]. The study by [33] analyzed returns and volatility spillovers between Bitcoin and four major global asset classes (stocks, commodities, currencies, and bonds). The study used the VAR GARCH-in-mean model (value-at-risk in generalized autoregressive conditional heteroskedasticity) and concluded that the Bitcoin market is not completely isolated. The sign of spillovers exhibited some differences in the two market conditions, with greater evidence that Bitcoin receives more volatility than it transmits.
As Bitcoin and gold are often looked at as safe havens, the relationship between these assets is important for discovering if there is any hedge option between them. There is always a question of the hedging capabilities of Bitcoin regarding some stock exchange indices. Baek and Elbeck [32] explored the financial asset capabilities of Bitcoin using GARCH models. The initial model showed several similarities to gold and the USD, indicating hedging capabilities and advantages as a medium of exchange. By applying the asymmetric GARCH methodology [34], Bitcoin can be used to hedge its position against FTSE 100, and in the short term, against the USD. In another study, ref. [35] based their findings on this original sample and an extended sample period. The study showed that Bitcoin exhibits distinctively different return, volatility, and correlation characteristics compared to other assets, including gold and the USD. The study by [9] proposed new definitions of weak and strong safe havens within a bivariate cross-quantilogram approach to explore whether Bitcoin can improve hedging strategies for stock market investments during extreme market conditions, and to examine whether this function is similar to gold hedging strategies. The study results show that Bitcoin and gold play the role of a weak safe haven asset in a few cases. Besides gold, oil has always played a significant role in the global commodity market in investors’ hedging strategies against stock exchange indices. The study by [36] used the GARCH model based on 5 years of sample data to explore Bitcoin’s volatility effect on crude oil and gold. The study found that Bitcoin volatility had a negative impact on gold and crude oil volatility. The study’s estimates clearly indicate that Bitcoin and gold can be used as hedging instruments.
Gold has always played an important role in the global commodity market. The explanation behind the global economy today is that gold is an inflation hedge. It is commonly believed that in a time of crisis, gold is a typical example of a safe haven. However, it can always be put into question from a dynamic point of view; is there only one safe haven for all time? The study by [37,38] analyzed the dynamic role of gold as a safe haven and found that investors’ behavior can destroy this role in practice.
The analysis by [39] seems to support this finding by applying a VAR-ADCC-BVGARCH (vector autoregressive asymmetric dynamic conditional correlation bivariate generalized autoregressive conditional heteroskedasticity) to the US financial market during the period of 2007–2017, although there is consensus in the literature that gold could be a risk-diminishing instrument against stocks. The findings of the previous studies suggest that the hedging characteristic of gold tends to mitigate against US stocks as market capitalization increases, implying there is a large proportion of funds invested in gold, against stocks. The study by [39] examined the hedge or safe haven role of the gold relative to the Dow Jones stock industry indices by using quantile GARCH analysis. However, the study findings are dubious depending on the time frame, whether it is the whole sample period (1980–2017) or each sub-period separately (1980–1995 and 1996–2017). Furthermore, it differs across different sectors. The study by [40] applied different methodologies in their robust analysis, indicating the weak hedge and safe haven role of gold for stocks. The study by [41] applied a wavelet decomposition with a copula approach to analyze the dependence between returns of gold and other assets (bonds, stocks, and exchange rates). The study found that everything changed after the 2008 crisis. Before the crisis, gold was able to shield investors. However, in the aftermath, gold is unable to serve as a hedge or safe haven in the classical sense.
According to the existing literature, most of the studies measure volatility and connectedness using the GARCH models. Some of the very recent studies found that GARCH models are not appropriate for tail values of skewed distribution. Similarly, many studies [42,43,44,45] argue that tail risk modeling is very important to consider in cryptocurrency value regressions. For example, the authors of [44] suggest a bivariate copula approach for tail risk modeling, the authors of [44] propose a linear bivariate quantile regression (bivariate CoVaR) as the most appropriate model, and [43] (based on the work of [46,47]), used a tail-event driven network to analyze the tail-risk interdependence among 23 cryptocurrencies. One of the biggest advantages of such models in tail value measures is in the description of the complexity of the crypto market, especially for the conditional tail-risk and tail-event driven networks used by [43,44]. Most importantly, it turns the distributional effect of the independent variables on the dependent variable into different quantile ranges. According to [48], the most significant characteristic of quantile regression is to make a classification of the heterogeneous effects of heterogeneous cross-sectional ranges. The median is a more appropriate measure than the mean in the case of conditional quantile estimations [49,50]. This technique is the most effective in tail value estimations (extremes of a dataset).
In estimations of the mean value of the dependent variable for particular levels of the independent variables, generally, the OLS (ordinary least square) [51,52] is used. The OLS is an appropriate model for the conditional mean function to describe how the mean of the response variable changes with the covariates [53]. The main limitations of the OLS are (1) that it is often confronted with the heteroscedasticity, focusing on the means as measured facts for tails values are lost, (2) it fails to recognize the source and nature of heterogeneity, and (3) it is inappropriate for extreme observations. Studies by [49,50] argue that quantile regression provides essential information about the relationship between the response variable and covariates on the entire conditional distribution. According to [53,54,55,56], such a model visualizes heteroscedasticity in the dataset. Similarly, the model determines the influence of covariates on the shape and scale of the entire response distribution [53]. Quantile regression models are mostly used in portfolio studies and different financial analyses. This technique was popularized by [53], who found that it is possible to model the relationship between returns and beta for companies that overperform and underperform relative to the mean. In the study of [57], it was shown that quantile regression is the most appropriate model in the study of the sensitivity of cryptocurrency returns to changes in gold price returns. A similar technique was previously used by [44] to study hedging strategies against global uncertainty based on cryptocurrency. Great attention has been paid to the tail behavior of values in their studies.
3. Data and Methodology
3.1. Data
The study dataset consisted of the following variables for studying the impact of the first wave of COVID-19 between 22 January 2020 and 11 April 2020: daily returns of five cryptocurrencies (Bitcoin, Ethereum, XRP, Tether, and Bitcoin Cash) (data source: https://coinmarketcap.com/) (accessed on 15 April 2020), google trends of searches (data source: Google); gold daily returns (data source: Yahoo); crude oil daily returns (Data Source: Yahoo); VIX index daily returns (Data Source: Yahoo); S&P 500 index daily returns (Data Source: Yahoo), and COVID-19 global index (data source: https://data.humdata.org/dataset/novel-coronavirus-2019-ncov-cases) (accessed on 15 April 2020). All daily returns were calculated using the HPR (Holding Period Returns) formula. To capture the time-varying effect of COVID-19, the study created the COVID-19 global index (explained in detail in Section 3.2). The study variables were as follows: (a) the dependent variable is the cryptocurrency daily average returns; (b) the independent variable was COVID-19 global index (COVID-19), developed to measure the effect of COVID-19 and daily movements of COVID-19; GOLD: important global commodity; GT: Google trend on how much a particular cryptocurrency was searched during the study period; OIL: another important global commodity, the S&P 500 index is a good indicator of how financial markets are doing; VIX is intended to provide an instantaneous volatility measure regarding how much the market believes that the market index will fluctuate in the short term.
3.2. Methodology
3.2.1. COVID-19 Global Index Construction
For the present study, we constructed a composite COVID-19 index following [58,59,60] to answer the fundamental question of how one should measure the effect of COVID-19 globally. The construction of the composite COVID-19 global index requires three stages. The first stage of the composite COVID-19 global index development started with the normalization of the data points, followed by a weighting of the data points and weighted aggregates of three variables: confirmed cases of COVID-19; deaths due to COVID-19, and recovered cases of COVID-19. We used z-scores and rescaling methods for normalization with the following expression:
Then, the rescaling method was deployed on all the normalized data for a linear transformation of the data into a scale of 1–100. The 1–100 scale was determined by the following equation:
We used these steps due to the fact that the effects of COVID-19 cannot be measured by a single indicator and requires the composite index used by the World Bank and the UN. Likewise, we normalized and standardized the data by creating a COVID-19 global index. The COVID-19 global index was constructed from three weighted components—confirmed cases of COVID-19; deaths due to COVID-19 and recovered cases of COVID-19—which were collected from the humanitarian data exchange (https://data.humdata.org/dataset/novel-coronavirus-2019-ncov-cases) (accessed on 15 April 2020). The dataset consisted of 81 daily observations from 22 January 2020 to 11 April 2020.
There is a high probability that a high level of multicollinearity exists among these three variables that are important measures of the impact of COVID-19. It is also true that the weights of these three variables are not uniform across all countries. Such issues could result in a distortion of the overall calculation of these variables. To avoid such errors in this estimation study, we normalized and standardized the data by constructing a COVID-19 global index. All these three variables were converted to a scale of 1–100 points, where 100 denotes the best score and 1 denotes the worst. Equal weights were assigned to all three variables in preparation for the aggregate COVID-19 global index. Figure 1a shows the daily movements of the independent variables. The primary axis represents the COVID and VIX daily movements, and the secondary axis represents the GOLD, OIL, and S&P 500 daily movements. Figure 1b shows the daily movements of the dependent variables. The Tether daily movements are represented on the secondary axis and the rest are on the primary axis.
3.2.2. Wavelet Coherence
To study the co-movement between the cryptocurrencies’ daily returns, a wavelet coherence diagram was plotted using the “biwavelet” R package, similar to the studies of [61,62]. We analyzed the continuous co-movement between the pairs at different times and frequency domains using a wavelet coherence diagram. The wavelet coherence could be perceived as a measure of a local correlation of the two time series, both in time and scale. This procedure is analogous to coherence in Fourier analysis. It is defined as the squared absolute value of the smoothed cross wavelet spectra normalized by the product of the smoothed individual wavelet power spectra of each series:
3.2.3. Regressions
We deployed two versions of regressions: (1) mean-based OLS regression, and (2) conditional median-based quantile regression.
OLS Regression
The OLS regression is expressed as the following:
where i represents five cryptocurrencies (i = 1 to 5); t represents the period from 22 January 2020 to 11 April 2020; Rit represents daily cryptocurrency returns; a is the intercept; εit is the error term; b, s, g, p, d, and f are the sensitivity coefficients for the independent variables of the regression.
Rit = a + b COVID-19 + s GOLDt + g GTit + p OILt + d S&P 500t + f VIXt + εit
Quantile Regression
Following [49], we deployed quantile regressions for conditional median-based estimation. The loss function in statistics or mathematics is presented below.
The ƍth quartile minimizes ξ, as shown in the equation below (univariate):
The special feature of the above function is that it has a bidirectional derivative but is not differentiable, as shown below:
Right derivative
Left derivative
Point ξ minimizes the objective function if R’(ξ+) ≥ 0 and R’(ξ-) ≥ 0. Hence, the optimized problem defined the unconditional quantile above. In a similar way, the conditional quantile can be defined analogously by OLS, as explained below. If [Y1, Y2, …, Yn] is a set of random variables from it, we get
The unconditional population mean is estimated from the above Equation (7). Then, the parametric function µ (x, β) replaces the scalar µ in the above equation to get Equation (8).
Similarly, the conditional median function can be obtained by replacing the scalar variable ξ with the parametric function ξ (xt, β) and by setting the ƍth quantile as½2. Other conditional function values can be obtained by replacing absolute values with ƍT(*), as follows:
4. Results and Discussion
4.1. Preliminary Analysis
Table 1 and Table 2 show descriptive statistics and correlation estimates for the independent variables. Most of the data series have higher levels of Kurtosis and correlation coefficients within the acceptable range. Looking at the independent variables’ descriptive statistics separately and their standard deviations as a measure of the absolute risk level of the assets, it is obvious that gold, as a typical global commodity, has the lowest risk compared to all other assets. The correlation analysis, with negative coefficients between gold and oil and S&P 500 is a sign that these two global commodities could serve well in this COVID-19 crisis as hedge instruments against risky assets represented by the most famous stock exchange index. The ADF test confirms that there is no unit root in the series.
4.2. Wavelet Coherence
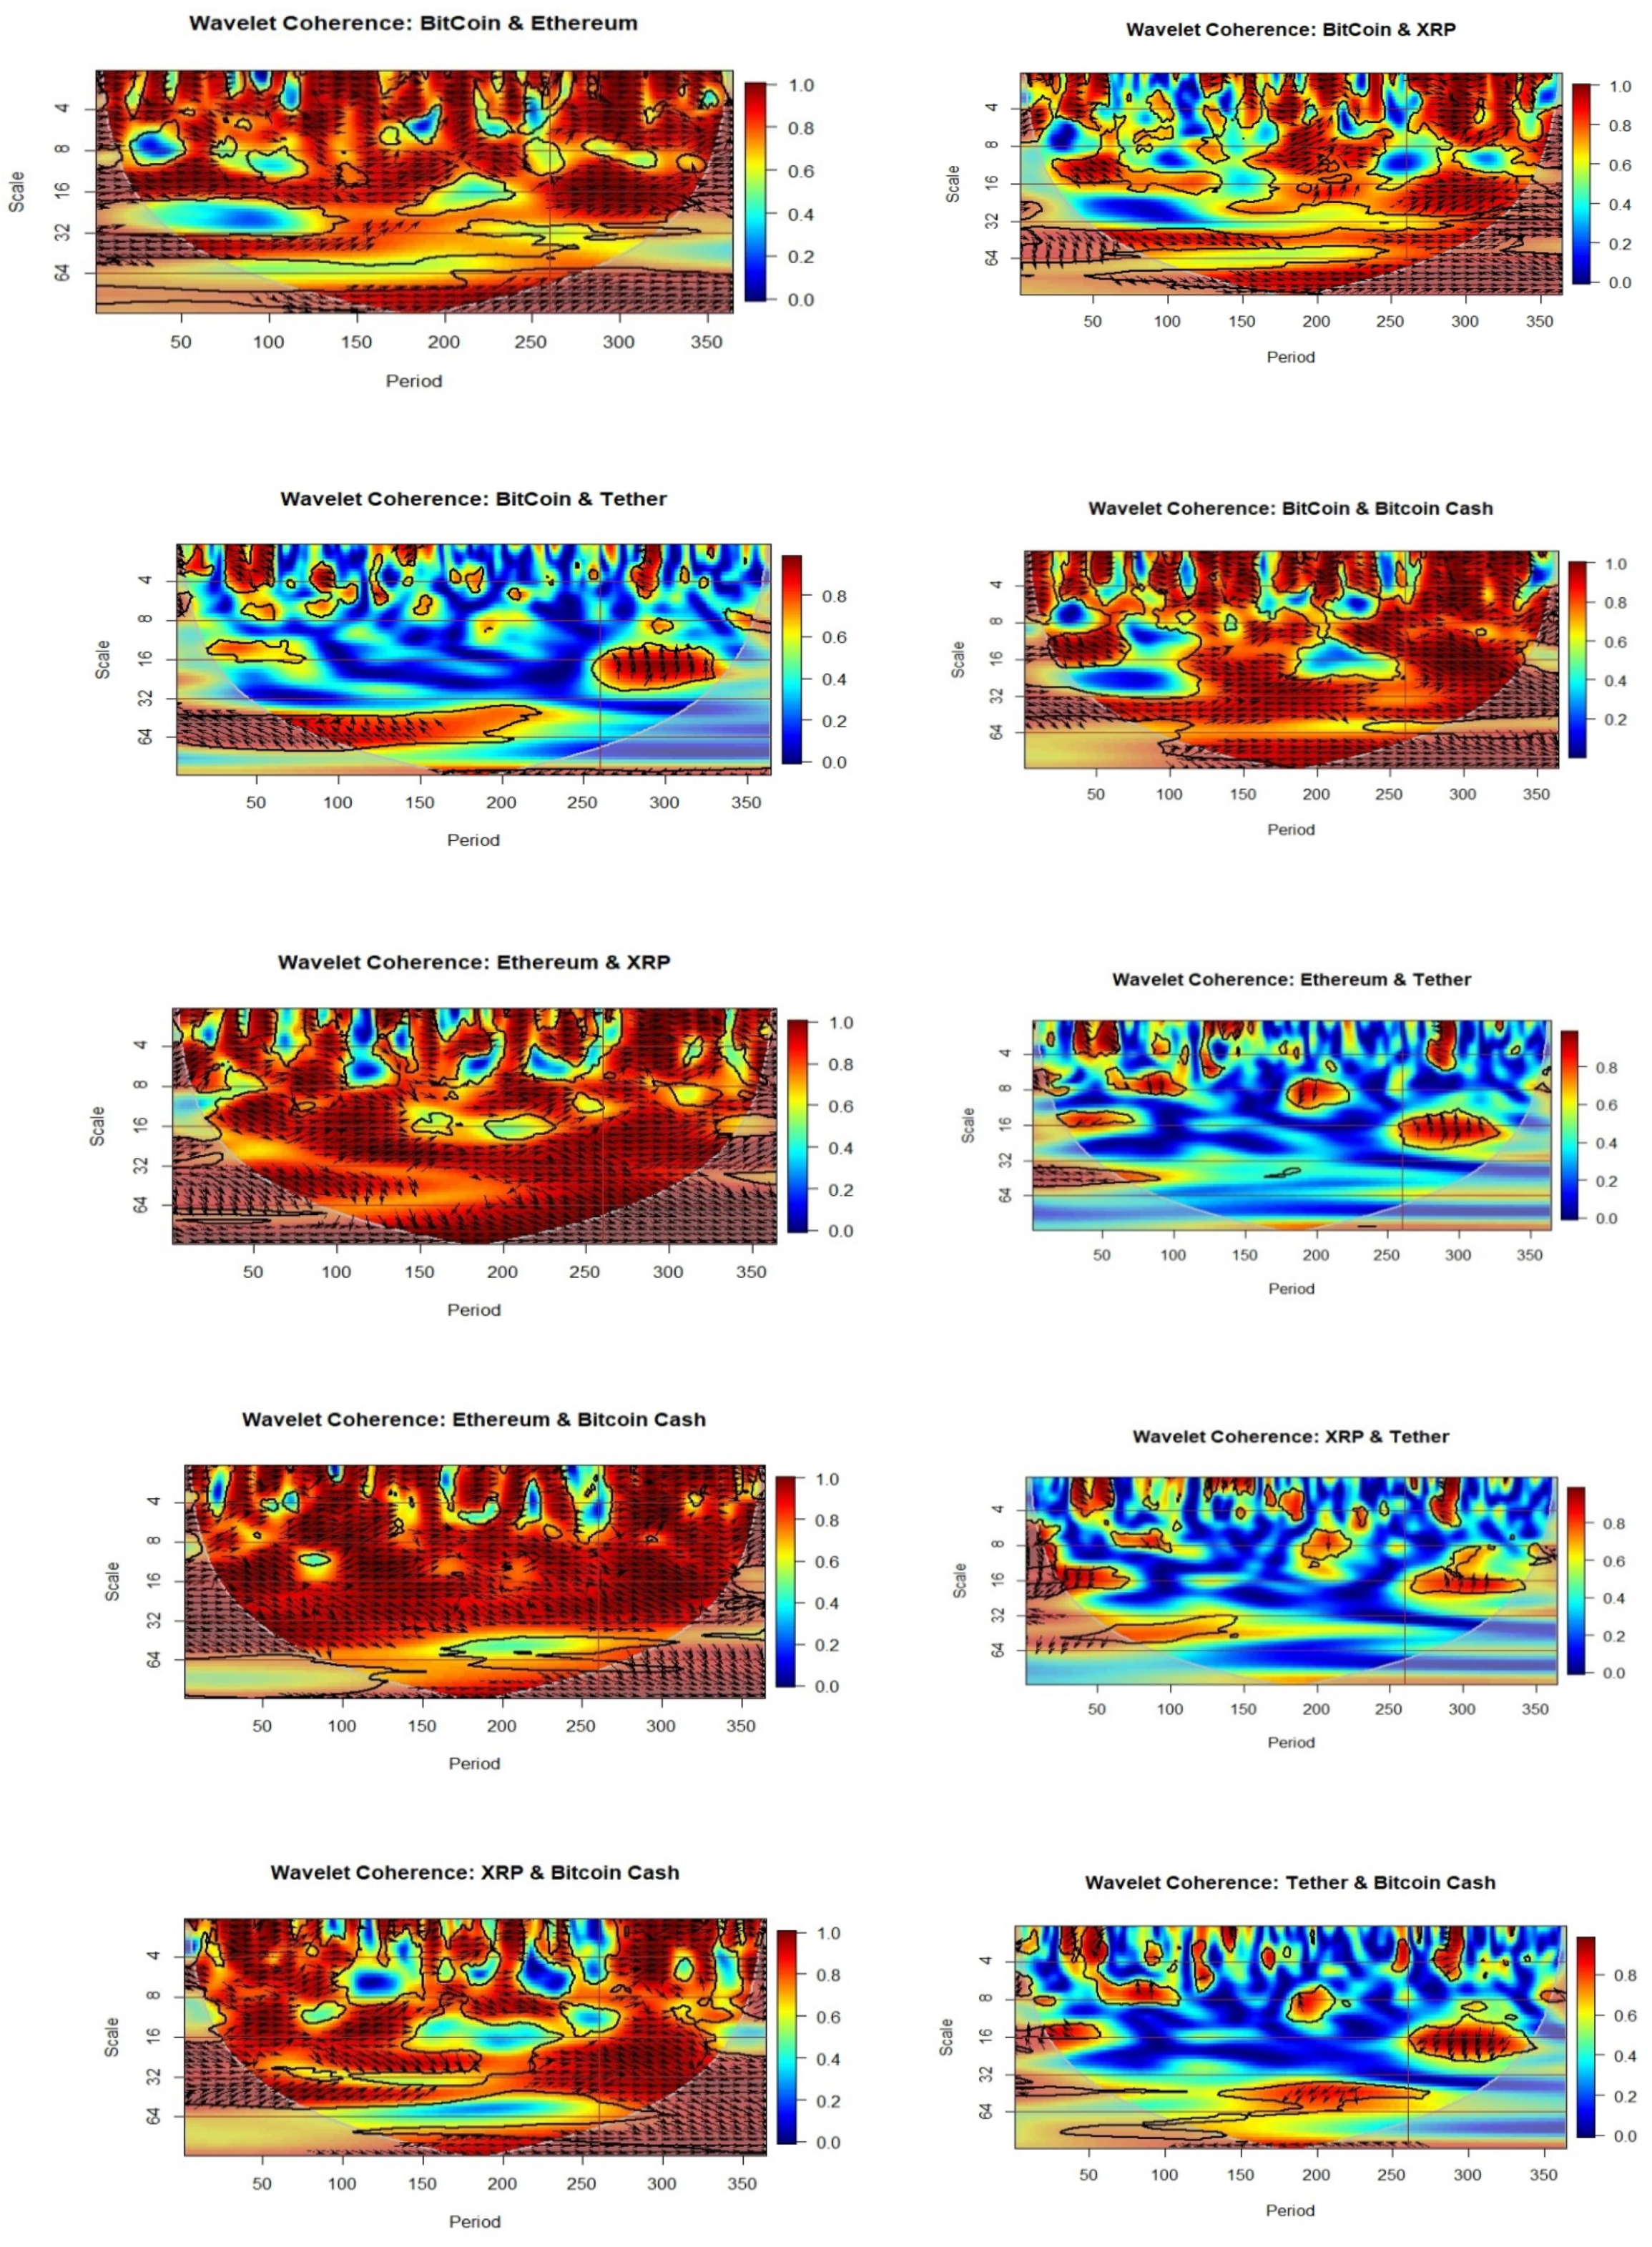
Figure 2 shows the wavelet coherence diagram for different cryptocurrency pairs. The horizontal axis represents a daily timeline for one year, starting in May 2019. Our study considers the COVID-19 period to be from 22 January 2020 and onwards in the horizontal period axis (labeled 250 and onwards). The vertical axis represents scales at 2, 8, 16, 32, 64, and onwards. The right-hand side vertical axis is the color axis: the brighter the color (red), the more the coherence, and the lesser bright the color (blue), the lesser the coherence. The Bitcoin–Ethereum, Bitcoin–XRP, Bitcoin–Bitcoin Cash, Ethereum–XRP, Ethereum–Bitcoin Cash, and XRP–Bitcoin Cash pairs show very high levels of persistent coherence at all scales during the COVID-19 period as compared to the pre-COVID-19 period. The wavelet coherence diagrams of Tether with the other cryptocurrencies show interesting results, especially during the COVID-19 period. During the COVID-19 period, especially on the scale at around 16, Tether shows low levels of coherence with the other cryptocurrencies, with no contagion effect. The direction of the phase arrows is not consistent across the scales and periods.
During the COVID-19 period, all pairs show a strong level of coherence with a short contagion effect that starts around mid-February 2020 and lasts until April 2020 (Figure 2). Such behavior supports the findings of [21], which show that Tether had a sizable impact on Bitcoin prices. However, their findings were from before the COVID-19 period (we found low levels of coherence for all cryptocurrencies before the COVID-19 pandemic), therefore, our results have similar characteristics only during the pandemic. During the COVID-19 period, at a scale of 64 and above, Tether shows lower coherence with the other cryptocurrencies as compared to before the COVID-19 period. In addition, the contagion effects that existed before the COVID-19 period at a higher scale of 64 and above disappeared during the COVID-19 period. The above estimates highlight two important things. First, during the COVID-19 period, the estimates are different, and secondly, they are not uniform. The wavelet coherence diagrams for different cryptocurrency pairs have clearly presented that all pairs, without the presence of Tether, show a very high level of persistent coherence at all scales during the COVID-19 period. The behavior of Tether regarding all the other cryptocurrencies in the crypto pairs is very specific, as these are the only pairs with a low level of coherence with no contagion effect. Going further, during the COVID-19 period, Tether shows lower coherence with the other cryptocurrencies as compared to before the COVID-19 period. Therefore, it is obvious that Tether is a typical stable coin and could present a safe haven for the entire crypto market because all other cryptocurrencies used in the analysis present more than 80% of the total crypto market capitalization. According to this, Tether is the only stable currency, while Bitcoin, Ethereum, Bitcoin Cash, and XRP were affected by COVID-19’s influence. In the case of Bitcoin, this study shows a similar behavior of this cryptocurrency as previously analyzed by [16]. Moreover, our results support more findings of [10,44], in which there is no evidence that Bitcoin serves as a safe haven for global assets.
4.3. OLS Estimates
Table 3 shows the results obtained from the OLS estimates.
The OLS estimates show that for all five cryptocurrencies, oil, and the S&P 500 index, the variables are statistically significant at the 5% and 10% levels in explaining average returns, as shown in Table 3. The COVID-19 variable is statistically significant only for Tether at the 5% level in explaining average returns. Looking at the OLS estimates, it seems that risky assets measured by S&P 500 have statistically significant influence at the 5% level in explaining average returns of all five cryptocurrencies used in the analysis. As one could expect, there is a positive change to S&P 500 on average returns for all other cryptocurrencies except Tether (in the range of 0.57 for Bitcoin to 0.822 for Ethereum), which is a clear sign that all these assets are typical examples of risky assets. The only reaction of Tether to the change of S&P 500 is opposite to the other cryptocurrencies. This coefficient is slightly negative (−0.076), which is one more piece of evidence for a typical stable coin that is not directly influenced by the strong reaction of risky assets. The OLS estimates show that apart from S&P 500, only oil, as a typical global commodity, has statistically significant influence at the 5% and 10% levels on the average returns of all five cryptocurrencies. The explanation for this is very similar to the previous one; the only reaction of the price of Tether was negative but close to zero (−0.002). The only difference is that this influence is much lower than for the case of S&P 500, with the other four cryptocurrencies in the range of 0.112 for XRM to 0.19 for Bitcoin, which shows that oil still can be a diversifier. The COVID-19 crisis seems to be statistically significant only for Tether, once again with a negative reaction very close to zero (−0.002).
4.4. Quantile Regression Estimates
Table 4 shows the quantile regression coefficients of the right-hand side variables for different quantiles, along with their associated p-values.
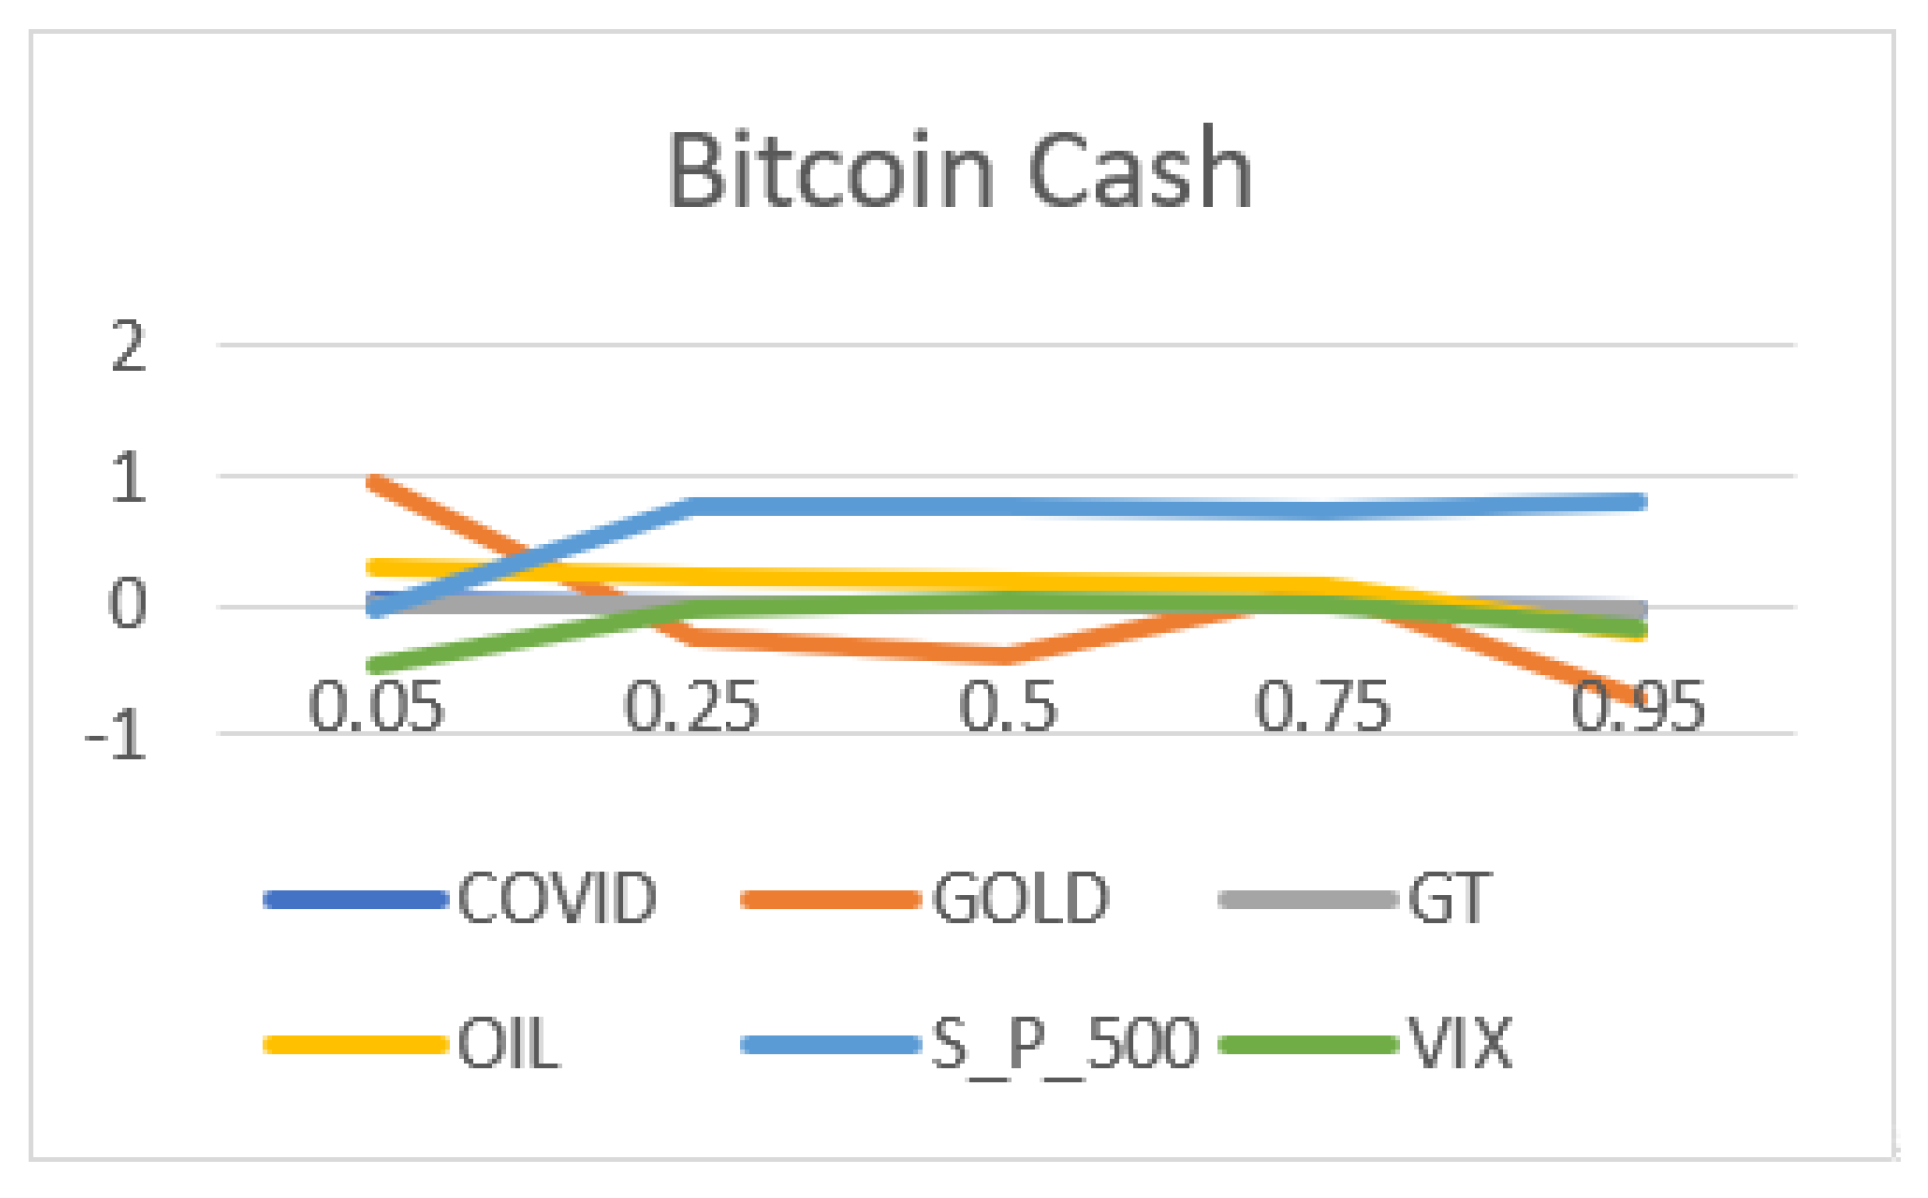
Next, we plotted the quantile coefficient variations for all variables for each cryptocurrency, as shown in Figure 3.
Figure 3 shows that Google trend searches have minimal loading among all factors, followed by the global COVID-19 index changes. For the Bitcoin, Ethereum, and XRP cryptocurrencies, Google trend searches were negatively related to the average returns at the lower quartiles, whereas it became more positive at the higher quartile. Only Bitcoin Cash shows a negative coefficient for Google trend searches at the highest quartile (0.95) and it is statistically significant at the 10% level. Interestingly, in the case of Tether, Google Trends search coefficients are statistically insignificant for all quantiles. The COVID-19 coefficient is statistically significant (10%) at the lower tail for Ethereum and at the higher tail in the case of Bitcoin. In the case of Bitcoin Cash, the COVID-19 coefficient is statistically significant (5%) at both tails. Gold coefficients vary both in magnitude and direction significantly across the quantiles for all five cryptocurrencies. Oil coefficients are negative in all quartiles for Tether, with the negative value only in the highest (95th) quartile for all other cryptocurrencies. S&P 500 coefficients are positive and statistically significant in most of the cases. In the cases of Ethereum and XRP, the S&P 500 coefficients are statistically insignificant at the two extreme ends of the tail. Conversely, in the case of Bitcoin and Tether, the S&P 500 coefficients are statistically insignificant at the higher end of the tail. In the case of Bitcoin Cash, S&P 500 coefficients are statistically significant at the higher quartile, except for the extreme lower end of the tail (5th quartile). VIX coefficients are statistically insignificant in all quartiles for two cryptocurrencies, namely XRP and Tether. The VIX coefficient is statistically significant at the 5% level at the extreme lower end (5th quartile) of Bitcoin and the highest (95th quartile) end of Bitcoin Cash, whereas, in the case of Ethereum, the VIX coefficient is statistically significant at the 5% level at both the extreme ends (5th and 95th quartiles).
The quantile regression appears to be a confirmation of the key findings of the previous OLS estimates, with some improvements. It is evident by looking at the influence of S&P 500 on the crypto market that the situation only slightly differs across the quartiles. For example, at the lower quartile, this influence is highly strong on Bitcoin and it remains strong at the higher quartile. It is evident that Google trends and the COVID-19 crisis (represented by the global COVID-19 index) have minimal loading effects on the crypto market, with slight changes in the magnitude and direction of coefficients across the quantile. Oil coefficients are negative in all quartiles for Tether, whereas oil coefficients are negative only in the highest (95th) quartile for all other cryptocurrencies. It is clearly confirmed, once again, that Tether’s behavior is very specific in the crypto market, as it shows some characteristics of a safe haven within a market. Additionally, our findings differ from those of [7]. We cannot find any safe haven characteristics (only Tether is near) in comparison to their work and findings of diversification benefits and digital assets (social media) acting as safe havens.
Additionally, the present study deployed robust regression with M-estimations. The M-estimation addresses dependent variable outliers, where the value of the dependent variable differs markedly from the regression model norm (large residuals). The obtained estimates of the robust regression are presented in Table 5. The obtained robust regression estimates confirm the robustness of the OLS estimates except for the Tether. The effect on the coefficient estimates of moving from least squares to robust M-estimation (see Table 3 and Table 5) does not produce many distinct coefficient values (that are statistically significant at the 5% level) than the OLS estimates, except for Tether.
5. Conclusions
Risk and returns are inseparable from each other in the financial markets [66,67,68,69]. In terms of the impact of the first wave, gold and oil, as typical global commodities, could have been diversifiers, with some characteristics of gold as a hedging instrument against risky assets represented by S&P 500. The OLS, quantile, and robust regressions estimates show that there was no significant direct influence of the COVID-19 crisis on the crypto market. However, it seems there were spillovers from risky assets on the crypto market. Looking at S&P 500 as the typical representative of risky assets on the global market and its influence on the crypto market, there was a strong direct influence on all the cryptocurrencies except Tether. In this way, it is largely clear that the crypto market cannot be either a safe haven or hedge in this ongoing COVID-19 crisis. On the other hand, all analyses that have been used (OLS, quantile regression, and robust regression estimates) have confirmed the very specific behavior of Tether. The wavelet coherence analysis shows that only in crypto pairs (which include Tether), there is a low level of coherence, with no contagion effect. It appears that Tether is the only important stable coin in the crypto market and because of this characteristic, it can present a safe haven within a crypto market. Its role in the crypto market seems to be very similar to the role of gold as a typical global commodity on the global market.
Even though the results of our study differ from those of [7], in that only Tether has near safe haven characteristics (while the other cryptocurrencies cannot be recognized), such studies have academic importance in analyzing assets in terms of major crises, and providing methodological, theoretical, and applicative experience in investment finance issues. Moreover, policymakers and investors cannot accept cryptocurrencies (especially Bitcoin) as safe havens, but only as highly volatile and speculative assets (which is in line with the work of [10,16,44]). Finally, the study does not come to an ultimate consensus on whether the ongoing COVID-19 crisis is a “Black Swan” event [1,2,3,14] or not. Since it is too early to comment on it, it is left for future studies to further examine the issue.
Author Contributions
Conceptualization, D.V., M.M. and Z.G.; formal analysis, D.V., M.M. and Z.G.; investigation, D.V., M.M. and Z.G.; writing—original draft preparation, D.V., M.M. and Z.G.; writing—review and editing, D.V., M.M., Z.G., E.M.G. and M.F.; funding acquisition, D.V., M.M., Z.G., E.M.G. and M.F. All authors have read and agreed to the published version of the manuscript.
Funding
This research was funded by the RUDN University Strategic Academic Leadership Program.
Data Availability Statement
Publicly available datasets were analyzed in this study. This data can be found as mentioned in Section 3.1 of the study.
Conflicts of Interest
The authors declare no conflict of interest.
References
- Grobys, K. When Bitcoin has the flu: On Bitcoin’s performance to hedge equity risk in the early wake of the COVID-19 outbreak. Appl. Econ. Lett. 2021, 28, 860–865. [Google Scholar] [CrossRef]
- Taleb, N. The Black Swan: The Impact of the Highly Improbable; Random House Inc.: New York, NY, USA, 2007. [Google Scholar]
- Mnif, E.; Salhi, B.; Jarboui, A. Herding behaviour and Islamic market efficiency assessment: Case of Dow Jones and Sukuk market. Int. J. Islam. Middle East. Financ. Manag. 2019, 13, 24–41. [Google Scholar] [CrossRef]
- Vukovic, D.; Lapshina, K.A.; Maiti, M. European Monetary Union bond market dynamics: Pre & post crisis. Res. Int. Bus. Financ. 2019, 50, 369–380. [Google Scholar] [CrossRef]
- Vukovic, D.; Vyklyuk, Y.; Matsiuk, N.; Maiti, M.; Chernova, N. Neural network forecasting in prediction Sharpe ratio: Evidence from EU debt market. Phys. A Stat. Mech. Its Appl. 2020, 542, 123331. [Google Scholar] [CrossRef]
- Mnif, E.; Jarboui, A.; Mouakhar, K. How the cryptocurrency market has performed during COVID 19? A multifractal analysis. Financ. Res. Lett. 2020, 36, 101647. [Google Scholar] [CrossRef]
- Corbet, S.; Hou, G.; Yang, H.; Lucey, B.M.; Les, O. Aye Corona! The Contagion Effects of Being Named Corona during the COVID-19 Pandemic. 2020. Available online: https://ssrn.com/abstract=3561866 (accessed on 26 March 2020).
- Jana, R.K.; Das, D. Did Bitcoin act as an antidote to the Chinese equity market and booster to Altcoins during the Novel Coronavirus outbreak? SSRN 2020. [Google Scholar] [CrossRef]
- Shahzad, S.J.H.; Bouri, E.; Roubaud, D.; Kristoufek, L.; Lucey, B. Is Bitcoin a better safe-haven investment than gold and commodities? Int. Rev. Financ. Anal. 2019, 63, 322–330. [Google Scholar] [CrossRef]
- Klein, T.; Thu, H.P.; Walther, T. Bitcoin is not the New Gold–A comparison of volatility, correlation, and portfolio performance. Int. Rev. Financ. Anal. 2018, 59, 105–116. [Google Scholar] [CrossRef]
- Das, D.; Le Roux, C.; Jana, R.; Dutta, A. Does Bitcoin hedge crude oil implied volatility and structural shocks? A comparison with gold, commodity and the US Dollar. Financ. Res. Lett. 2020, 36, 101335. [Google Scholar] [CrossRef]
- Corbet, S.; Lucey, B.; Urquhart, A.; Yarovaya, L. Cryptocurrencies as a financial asset: A systematic analysis. Int. Rev. Financ. Anal. 2019, 62, 182–199. [Google Scholar] [CrossRef] [Green Version]
- Özer, M.; Kamenković, S.; Grubišić, Z. Frequency domain causality analysis of intra- and inter-regional return and volatility spillovers of South-East European (SEE) stock markets. Econ. Res. Ekon. Istraživanja 2019, 33, 1–25. [Google Scholar] [CrossRef]
- Yarovaya, L.; Matkovskyy, R.; Jalan, A. The COVID-19 Black Swan Crisis: Reaction and recovery of various financial markets. SSRN 2020. [Google Scholar] [CrossRef]
- Aalborg, H.A.; Molnar, P.; de Vries, J.E. What can explain the price, volatility and trading volume of Bitcoin? Financ. Res. Lett. 2020, 29, 255–265. [Google Scholar] [CrossRef]
- Goodell, J.W. COVID-19 and finance: Agendas for future research. Financ. Res. Lett. 2020, 35, 101512. [Google Scholar] [CrossRef] [PubMed]
- Goodell, J.W.; Goutte, S. Co-Movement of COVID-19 and Bitcoin: Evidence from Wavelet Coherence Analysis. 2020. Available online: https://papers.ssrn.com/sol3/papers.cfm?abstract_id=3597144 (accessed on 1 June 2020).
- Cheach, F. Speculative bubbles in Bitcoin markets? An empirical investigation into the fundamental value of Bitcoin. Econ. Lett. 2015, 130, 32–36. [Google Scholar] [CrossRef] [Green Version]
- Hafner, C.M. Testing for bubbles in cryptocurrencies with time-varying volatility. J. Financ. Econ. 2018. [Google Scholar] [CrossRef]
- Maiti, M.; Grubisic, Z.; Vukovic, D.B. Dissecting tether’s nonlinear dynamics during Covid-19. J. Open Innov. Technol. Mark. Complex. 2020, 6, 161. [Google Scholar] [CrossRef]
- Ardia, D.; Bluteau, K.; Rüede, M. Regime changes in Bitcoin GARCH volatility dynamics. Financ. Res. Lett. 2019, 29, 266–271. [Google Scholar] [CrossRef]
- Griffin, J.M.; Shams, A. Is bitcoin really un-tethered. SSRN 2019. [Google Scholar] [CrossRef]
- Liu, Y.; Tsyvinski, A. Risks and returns of cryptocurrency. Rev. Financ. Stud. 2021, 34, 2689–2727. [Google Scholar] [CrossRef]
- Brunnermeier, M.K.; Nagel, S. Hedge funds and the technology bubble. J. Financ. 2004, 59, 2013–2040. [Google Scholar] [CrossRef] [Green Version]
- Shi, S.; Arora, V. An application of models of speculative behaviour to oil prices. Econ. Lett. 2012, 115, 469–472. [Google Scholar] [CrossRef] [Green Version]
- Tsvetanov, D.; Coakley, J.; Kellard, N. Bubbling over! The behaviour of oil futures along the yield curve. J. Empir. Financ. 2016, 38, 516–533. [Google Scholar] [CrossRef] [Green Version]
- Kruse, R.; Wegener, C. Time-varying persistence in real oil prices and its determinant. Energy Econ. 2020, 85, 104328. [Google Scholar] [CrossRef]
- Liu, J.; Serletis, A. Volatility in the cryptocurrency market. Open Econ. Rev. 2019, 30, 779–811. [Google Scholar] [CrossRef] [Green Version]
- Fakhfekh, M.; Jeribi, A. Volatility dynamics of crypto-currencies’ returns: Evidence from asymmetric and long memory GARCH models. Res. Int. Bus. Financ. 2020, 51, 101075. [Google Scholar] [CrossRef]
- Bouri, E.; Vo, X.V.; Saeed, T. Return equicorrelation in the cryptocurrency market: Analysis and determinants. Financ. Res. Lett. 2021, 38, 101497. [Google Scholar] [CrossRef]
- Bouri, E.; Shahzad, S.J.H.; Roubaud, D. Co-explosivity in the cryptocurrency market. Financ. Res. Lett. 2019, 29, 178–183. [Google Scholar] [CrossRef]
- Baek, C.; Elbeck, M.A. Bitcoins as an investment or speculative vehicle? A first look. Appl. Econ. Lett. 2015, 22, 30–34. [Google Scholar] [CrossRef]
- Dyhrberg, A.H. Bitcoin, gold and the dollar—A GARCH volatility analysis. Financ. Res. Lett. 2016, 16, 85–92. [Google Scholar] [CrossRef] [Green Version]
- Bouri, E.; Das, M.; Gupta, R.; Roubaud, D. Spillovers between Bitcoin and other assets during bear and bull markets. Appl. Econ. 2018, 50, 5935–5949. [Google Scholar] [CrossRef] [Green Version]
- Dyhrberg, A.H. Hedging capabilities of bitcoin. Is it a virtual gold. Financ. Res. Lett. 2016, 16, 139–144. [Google Scholar] [CrossRef] [Green Version]
- Baur, D.G.; Dimpfl, T.; Kuck, K. Bitcoin, gold and the US dollar—A replication and extension. Financ. Res. Lett. 2018, 25, 103–110. [Google Scholar] [CrossRef]
- Jeevan, R.; Shubhashree, P.K.A. Arbitrary behavior of bitcoin towards gold and crudeoil. Int. J. Res. Anal. Rev. 2019, 6, 481–486. [Google Scholar]
- Baur, D.G.; Glover, K.J. The destruction of a safe haven asset? Appl. Financ. Lett. 2012, 1, 8. [Google Scholar] [CrossRef] [Green Version]
- Shrydeh, N.; Shahateet, M.; Mohammad, S.; Sumadi, M. The hedging effectiveness of gold against US stocks in a post-financial crisis era. Cogent Econ. Financ. 2019, 7. [Google Scholar] [CrossRef]
- Chen, K.; Wang, M. Is gold a hedge and safe haven for stock market? Appl. Econ. Lett. 2018, 26, 1080–1086. [Google Scholar] [CrossRef]
- Dar, A.B.; Mitra, D. Is gold a weak or strong hedge and safe haven against stocks? Robust evidences from three major gold-consuming countries. Appl. Econ. 2017, 49, 5491–5503. [Google Scholar] [CrossRef]
- Beckmann, J.; Berger, T.; Czudaj, R. Gold price dynamics and the role of uncertainty. Quant. Financ. 2018, 19, 663–681. [Google Scholar] [CrossRef] [Green Version]
- Maiti, M.; Vyklyuk, Y.; Vuković, D. Cryptocurrencies chaotic co-movement forecasting with neural networks. Internet Technol. Lett. 2020, 3, e157. [Google Scholar] [CrossRef]
- Qiuhua, X.; Yixuan, Z.; Ziyang, Z. Tail-risk spillovers in cryptocurrency markets. Financ. Res. Lett. 2021, 38, 101453. [Google Scholar]
- Ji, Q.; Bouri, E.; Lau, C.K.M.; Roubaud, D. Dynamic connectedness and integration in cryptocurrency markets. Int. Rev. Financ. Anal. 2019, 63, 257–272. [Google Scholar] [CrossRef]
- Zięba, D.; Kokoszczynski, R.; Śledziewska, K. Shock transmission in the cryptocurrency market. Is Bitcoin the most influential? Int. Rev. Financ. Anal. 2019, 64, 102–125. [Google Scholar] [CrossRef]
- Härdle, W.K.; Wang, W.; Yu, L. TENET: Tail-Event driven NETwork risk. J. Econ. 2016, 192, 499–513. [Google Scholar] [CrossRef]
- Fan, Y.; Härdle, W.K.; Wang, W.; Zhu, L. Single-index-based CoVaR with very high-dimensional covariates. J. Bus. Econ. Stat. 2017, 36, 212–226. [Google Scholar] [CrossRef] [Green Version]
- Ike, G.N.; Usman, O.; Sarkodie, S.A. Testing the role of oil production in the environmental Kuznets curve of oil producing countries: New insights from Method of Moments Quantile Regression. Sci. Total Environ. 2020, 711, 135208. [Google Scholar] [CrossRef]
- Koenker, R.W.; Bassett, G., Jr. Regression quantiles. Econometrica 1978, 46, 33–50. [Google Scholar] [CrossRef]
- Koenker, R.W.; Hallock, G. Quantile regression. J. Econ. Perspect. 2001, 15, 143–156. [Google Scholar] [CrossRef]
- Allen, D.E.; Powell, S.R. Asset pricing, the Fama—French Factor Model and the implications of quantile-regression analysis. In Financial Econometrics Modeling: Market Microstructure, Factor Models and Financial Risk Measures; Gregoriou, G.N., Pascalau, G.N., Eds.; Palgrave Macmillan: London, UK, 2011. [Google Scholar]
- Barnes, M.L.; Hughes, A.W. A Quantile regression analysis of the cross section of stock market returns. SSRN 2004. [Google Scholar] [CrossRef] [Green Version]
- Onyedikachi, J. Quantile regression analysis as a robust alternative to ordinary least squares. Sci. Afr. 2009, 8, 61–65. [Google Scholar]
- Karlsson, A. Estimation and inference for quantile regression of longitudinal data, with applications in biostatistic. Diss. Acta Univ. Ups. 2006, 18, 36. [Google Scholar]
- Buchinsky, M. Recent advances in quantile regression models: A practical guideline for empirical research. J. Hum. Resour. 1998, 33, 88. [Google Scholar] [CrossRef]
- Jareño, F.; de la O González, M.; Tolentino, M.; Sierra, K. Bitcoin and gold price returns: A quantile regression and NARDL analysis. Resour. Policy 2020, 67, 101666. [Google Scholar] [CrossRef]
- Nardo, M.; Saisana, M.; Saltelli, A.; Tarantola, S. Tools for Composite Indicators Building; Working paper No. EUR 21682 EN.; European Commission: Ispra, Italy, 2005. [Google Scholar]
- Nardo, M.; Saisana, M.; Saltelli, A.; Tarantola, S.; Hoffman, A.; Giovannini, E. Handbook on Constructing Composite Indicators: Methodology and User Guide; OECD: Ispra, Italy, 2008. [Google Scholar]
- Maiti, M.; Jadhav, P. Impact of pollution level, death rate and illness on economic growth: Evidences from global economy. SN Bus. Econ. 2021. [Google Scholar] [CrossRef]
- Vukovic, D.B.; Lapshina, K.A.; Maiti, M. Wavelet coherence analysis of returns, volatility and interdependence of the US and the EU money markets: Pre & post crisis. N. Am. J. Econ. Financ. 2021, 58, 101457. [Google Scholar] [CrossRef]
- Maiti, M.; Vukovic, D.; Krakovich, V.; Pandey, M.K. How integrated are cryptocurrencies. Int. J. Big Data Manag. 2020, 1, 64–80. [Google Scholar] [CrossRef]
- Maiti, M. OLS versus quantile regression in extreme distributions. Contaduría Adm. 2019, 64, 12. [Google Scholar] [CrossRef]
- Maiti, M. Quantile regression, asset pricing and investment decision. IIMB Manag. Rev. 2021, 33, 28–37. [Google Scholar] [CrossRef]
- Maiti, M.; Maiti, J. A study on India’s first offshore LIDAR-based wind profiling at Gulf of Khambhat. J. Public Aff. 2020, 20, e2044. [Google Scholar] [CrossRef]
- Maiti, M. A critical review on evolution of risk factors and factor models. J. Econ. Surv. 2020, 34, 175–184. [Google Scholar] [CrossRef]
- Maiti, M. A Six Factor Asset Pricing Model. Ph.D. Thesis, Pondicherry University, Puducherry, India, 2018. Available online: http://dspace.pondiuni.edu.in/jspui/bitstream/123456789/3180/1/T6617.pdf (accessed on 1 May 2021).
- Maiti, M. Is ESG the succeeding risk factor? J. Sustain. Financ. Invest. 2021, 11, 199–213. [Google Scholar] [CrossRef]
- Maiti, M.; Balakrishnan, A. Can leverage effect coexist with value effect? IIMB Manag. Rev. 2020, 32, 7–23. [Google Scholar] [CrossRef]
Figure 1.
(a) and (b): Variables’ daily movements.

Figure 2.
Wavelet coherence diagram among the cryptocurrency pairs.

Figure 3.
Quantile coefficient variations.


Table 1.
Descriptive statistics.
| COVID-19 | GOLD | GT * | OIL | S&P 500 | VIX | |
|---|---|---|---|---|---|---|
| Mean | 0.279 | 0.002 | 38.531 | −0.002 | −0.003 | 0.025 |
| Std. Dev. | 1.105 | 0.019 | 11.943 | 0.093 | 0.038 | 0.141 |
| Skewness | 2.911 | 0.451 | 2.526 | 0.242 | 0.328 | 1.098 |
| Kurtosis | 11.559 | 6.118 | 11.271 | 5.510 | 4.708 | 4.640 |
* Note: Google trend for Bitcoin.
Table 2.
Correlation analysis.
| COVID-19 | GOLD | GT * | OIL | S&P 500 | VIX | |
|---|---|---|---|---|---|---|
| COVID-19 | 1.000 | |||||
| GOLD | −0.011 | 1.000 | ||||
| GT | 0.029 | −0.233 | 1.000 | |||
| OIL | −0.057 | 0.107 | 0.083 | 1.000 | ||
| S&P 500 | 0.096 | −0.095 | 0.110 | −0.191 | 1.000 | |
| VIX | 0.058 | 0.091 | −0.147 | 0.009 | −0.692 | 1.000 |
* Note: Google trend for Bitcoin.
Table 3.
OLS regression estimates.
| C | COVID-19 | GOLD | GT | OIL | S&P 500 | VIX | R2 | |
|---|---|---|---|---|---|---|---|---|
| Bitcoin | 0.029 | 0.005 | 0.017 | −0.001 | 0.116 ** | 0.570 * | −0.068 | 0.260 |
| Ethereum | 0.005 | 0.006 | 0.174 | 0.000 | 0.190 * | 0.822 * | −0.057 | 0.274 |
| XRP | −0.009 | 0.008 | −0.033 | 0.000 | 0.112 ** | 0.673 * | −0.034 | 0.274 |
| Tether | −0.004 | −0.002 * | 0.036 | 0.000 | −0.027 * | −0.076 * | 0.005 | 0.218 |
| Bitcoin Cash | 0.004 | 0.003 | −0.178 | 0.000 | 0.156 ** | 0.790 * | −0.044 | 0.210 |
Note: * Significant @ 5% & ** Significant @ 10%.
Table 4.
Quantile regression estimates.
| Coefficient Values | ||||||||
|---|---|---|---|---|---|---|---|---|
| C | COVID-19 | GOLD | GT | OIL | S&P 500 | VIX | ||
| 0.05 | 0.145 | −0.001 | −0.581 | −0.006 | 0.295 | 1.696 | 0.166 | Bitcoin |
| 0.25 | 0.015 | 0.001 | −0.151 | −0.001 | 0.180 | 0.652 | 0.008 | |
| 0.5 | 0.016 | −0.002 | 0.008 | 0.000 | 0.123 | 0.620 | 0.022 | |
| 0.75 | −0.019 | 0.001 | 0.067 | 0.001 | 0.085 | 0.517 | 0.019 | |
| 0.95 | −0.076 | −0.008 | 0.358 | 0.004 | −0.145 | 0.487 | −0.003 | |
| 0.05 | −0.092 | 0.024 | 1.630 | −0.001 | 0.224 | −0.221 | −0.533 | Ethereum |
| 0.25 | 0.007 | 0.000 | −0.024 | −0.001 | 0.194 | 0.718 | 0.021 | |
| 0.5 | 0.001 | −0.001 | −0.188 | 0.000 | 0.184 | 0.862 | 0.052 | |
| 0.75 | 0.013 | −0.007 | 0.321 | 0.001 | 0.114 | 1.207 | 0.062 | |
| 0.95 | 0.045 | 0.002 | 0.680 | 0.001 | −0.072 | 0.444 | −0.158 | |
| 0.05 | −0.022 | 0.016 | 1.325 | −0.002 | 0.162 | 0.192 | −0.214 | XRP |
| 0.25 | 0.002 | 0.004 | −0.350 | −0.001 | 0.204 | 0.826 | 0.062 | |
| 0.5 | −0.028 | 0.003 | −0.170 | 0.001 | 0.130 | 0.572 | −0.008 | |
| 0.75 | 0.004 | 0.003 | −0.361 | 0.001 | 0.090 | 0.760 | 0.064 | |
| 0.95 | 0.032 | 0.006 | 0.118 | 0.001 | −0.012 | 0.432 | −0.041 | |
| 0.05 | 0.015 | 0.000 | 0.183 | 0.000 | −0.035 | −0.143 | −0.007 | Tether |
| 0.25 | 0.002 | 0.000 | 0.036 | 0.000 | −0.010 | 0.007 | 0.002 | |
| 0.5 | 0.000 | 0.000 | 0.011 | 0.000 | −0.003 | 0.005 | 0.000 | |
| 0.75 | −0.002 | 0.000 | 0.012 | 0.000 | −0.009 | −0.018 | 0.000 | |
| 0.95 | −0.002 | −0.003 | −0.193 | 0.000 | −0.019 | 0.009 | 0.058 | |
| 0.05 | −0.164 | 0.022 | 0.934 | 0.001 | 0.306 | −0.040 | −0.460 | Bitcoin Cash |
| 0.25 | −0.011 | 0.004 | −0.235 | 0.000 | 0.238 | 0.750 | −0.050 | |
| 0.5 | 0.012 | −0.001 | −0.405 | 0.000 | 0.177 | 0.755 | 0.028 | |
| 0.75 | 0.034 | −0.006 | 0.118 | 0.000 | 0.135 | 0.734 | 0.012 | |
| 0.95 | 0.153 | −0.019 | −0.722 | −0.001 | −0.210 | 0.810 | −0.166 | |
| p values | ||||||||
| C | COVID-19 | GOLD | GT | OIL | S&P 500 | VIX | ||
| 0.05 | 0.000 | 0.802 | 0.247 | 0.000 | 0.026 | 0.000 | 0.044 | Bitcoin |
| 0.25 | 0.745 | 0.763 | 0.641 | 0.568 | 0.034 | 0.000 | 0.851 | |
| 0.5 | 0.495 | 0.392 | 0.963 | 0.536 | 0.002 | 0.000 | 0.507 | |
| 0.75 | 0.354 | 0.854 | 0.840 | 0.091 | 0.354 | 0.075 | 0.730 | |
| 0.95 | 0.316 | 0.065 | 0.595 | 0.076 | 0.293 | 0.375 | 0.966 | |
| 0.05 | 0.013 | 0.007 | 0.016 | 0.300 | 0.057 | 0.679 | 0.061 | Ethereum |
| 0.25 | 0.655 | 0.970 | 0.932 | 0.120 | 0.021 | 0.003 | 0.749 | |
| 0.5 | 0.947 | 0.775 | 0.726 | 0.818 | 0.054 | 0.051 | 0.439 | |
| 0.75 | 0.502 | 0.101 | 0.707 | 0.125 | 0.254 | 0.003 | 0.298 | |
| 0.95 | 0.088 | 0.842 | 0.340 | 0.077 | 0.622 | 0.489 | 0.085 | |
| 0.05 | 0.761 | 0.111 | 0.026 | 0.319 | 0.058 | 0.626 | 0.254 | XRP |
| 0.25 | 0.972 | 0.499 | 0.207 | 0.733 | 0.038 | 0.004 | 0.461 | |
| 0.5 | 0.071 | 0.502 | 0.509 | 0.047 | 0.044 | 0.006 | 0.893 | |
| 0.75 | 0.828 | 0.651 | 0.568 | 0.198 | 0.106 | 0.001 | 0.202 | |
| 0.95 | 0.323 | 0.703 | 0.866 | 0.339 | 0.903 | 0.128 | 0.458 | |
| 0.05 | 0.008 | 0.763 | 0.005 | 0.000 | 0.014 | 0.016 | 0.540 | Tether |
| 0.25 | 0.635 | 0.826 | 0.466 | 0.517 | 0.463 | 0.844 | 0.647 | |
| 0.5 | 0.979 | 0.881 | 0.718 | 0.965 | 0.544 | 0.846 | 0.922 | |
| 0.75 | 0.563 | 0.226 | 0.763 | 0.411 | 0.428 | 0.658 | 0.990 | |
| 0.95 | 0.888 | 0.001 | 0.113 | 0.157 | 0.362 | 0.934 | 0.154 | |
| 0.05 | 0.000 | 0.003 | 0.283 | 0.052 | 0.019 | 0.944 | 0.114 | Bitcoin Cash |
| 0.25 | 0.523 | 0.399 | 0.494 | 0.562 | 0.003 | 0.009 | 0.490 | |
| 0.5 | 0.347 | 0.818 | 0.295 | 0.531 | 0.019 | 0.003 | 0.748 | |
| 0.75 | 0.003 | 0.153 | 0.841 | 0.430 | 0.149 | 0.006 | 0.864 | |
| 0.95 | 0.000 | 0.002 | 0.385 | 0.074 | 0.116 | 0.068 | 0.043 | |
Table 5.
Robust regression estimates.
| C | COVID-19 | GOLD | GT | OIL | S&P 500 | VIX | R2 | |
|---|---|---|---|---|---|---|---|---|
| Bitcoin | 0.059 | −0.002 | −0.055 | −0.016 | 0.142 * | 0.656 * | 0.045 | 0.229 |
| Ethereum | 0.016 | −0.001 | 0.160 | −0.003 | 0.231 * | 0.869 * | 0.049 | 0.138 |
| XRP | −0.117 | 0.002 | −0.175 | 0.033 | 0.148 * | 0.730 * | 0.027 | 0.225 |
| Tether | 0.000 | 0.000 | 0.007 | 0.000 | 0.001 | 0.018 * | 0.002 | 0.031 |
| Bitcoin Cash | −0.091 | −0.001 | −0.521 | 0.024 | 0.216 * | 1.097 * | 0.060 | 0.194 |
* Note: Google trend for Bitcoin.
Publisher’s Note: MDPI stays neutral with regard to jurisdictional claims in published maps and institutional affiliations. |
© 2021 by the authors. Licensee MDPI, Basel, Switzerland. This article is an open access article distributed under the terms and conditions of the Creative Commons Attribution (CC BY) license (https://creativecommons.org/licenses/by/4.0/).
Share and Cite
MDPI and ACS Style
Vukovic, D.; Maiti, M.; Grubisic, Z.; Grigorieva, E.M.; Frömmel, M. COVID-19 Pandemic: Is the Crypto Market a Safe Haven? The Impact of the First Wave. Sustainability 2021, 13, 8578. https://0-doi-org.brum.beds.ac.uk/10.3390/su13158578
AMA Style
Vukovic D, Maiti M, Grubisic Z, Grigorieva EM, Frömmel M. COVID-19 Pandemic: Is the Crypto Market a Safe Haven? The Impact of the First Wave. Sustainability. 2021; 13(15):8578. https://0-doi-org.brum.beds.ac.uk/10.3390/su13158578
Chicago/Turabian StyleVukovic, Darko, Moinak Maiti, Zoran Grubisic, Elena M. Grigorieva, and Michael Frömmel. 2021. "COVID-19 Pandemic: Is the Crypto Market a Safe Haven? The Impact of the First Wave" Sustainability 13, no. 15: 8578. https://0-doi-org.brum.beds.ac.uk/10.3390/su13158578
Note that from the first issue of 2016, this journal uses article numbers instead of page numbers. See further details here.