
The Measurement and Influencing Factors of Total Factor Productivity in the Chinese Rural Distribution Industry

1
School of Management, Henan University of Science and Technology, 263 Kaiyuan Ave, Luoyang 450062, China
2
Development Planning Division, Henan University of Science and Technology, 263 Kaiyuan Ave, Luoyang 450062, China
*
Author to whom correspondence should be addressed.
Sustainability 2021, 13(15), 8581; https://0-doi-org.brum.beds.ac.uk/10.3390/su13158581
Submission received: 10 June 2021
/
Revised: 25 July 2021
/
Accepted: 27 July 2021
/
Published: 31 July 2021
(This article belongs to the Special Issue Entrepreneurship and Sustainable Firms and Economies)
Abstract
:Total factor productivity (TFP) is critical to the sustainable development of the rural distribution industry. Improvements in productivity of the rural distribution industry can promote the high-quality development of the Chinese distribution industry. Studying the characteristics and influencing factors of total factor productivity in regard to the rural distribution industry in China is significant for promoting the transformation and development of the rural distribution industry. This paper uses the DEA–Malmquist Index to measure the total factor productivity (TFP) of the Chinese rural distribution industry and its decomposition index, and uses a panel data model to empirically study its influencing factors. The results show that, from 2008 to 2018, the TFP of the Chinese rural distribution industry showed a trend of rising first and then fluctuating and declining, with an average annual growth rate of 2.93%; the fluctuation direction of the TFP of the rural distribution industry in the eastern and western regions of China is basically the same, which has had a reverse change relationship with the central and northeast regions for many years. The industrial structure, urbanization rate, rural informatization rate, and conditions of the transportation facilities have significant impacts on the TFP of the rural distribution industry, among which the informatization rate has the greatest positive impact.
1. Introduction
Improving the TFP of the rural distribution industry is of great significance to its sustainable development. The rural distribution industry in this paper refers to the wholesale and retail industry, the accommodation and catering industry, and the transportation, warehousing, and postal industry in rural China. It is a “distribution” industry in general, not distribution just for the manufacturing industry. Currently, China’s economy has gradually transitioned from high-speed growth to medium-high-speed growth. In the past few decades of reform and opening up, the development mode of relying on high investments to promote capital growth has been met with difficulties. At the same time, relying on labor input to promote growth is also facing the bottleneck of the “demographic dividend” gradually disappearing; therefore, a change in the mode of economic growth is urgently needed. With this background, an important way to improve the level of innovation-driven growth in China is required. For a long time, the distribution industry has been regarded as the “subsidiary industry” or “terminal industry” of China’s national economy, and has not garnered much attention. With the deepening of reform and opening up, and with the maturity of the market economy, the role of the distribution industry in the national economy and in social development has become increasingly prominent. With the increase in national income and the expansion of consumer demands, consumers have higher requirements for the quality and efficiency of commodity consumption services. The efficiency of the distribution industry also plays a positive role in the overall performance of the manufacturing industry [1]. As the link between production and consumption, the distribution industry should improve the development of quality and efficiency, improve its total factor productivity (TFP), and enhance industrial innovation and competitiveness. China has a huge rural population and rural consumption market, but the development of the rural distribution and consumption market is relatively backward, and a large gap exists compared with the urban distribution consumption market. Due to its weak foundation, backward facilities and equipment, and relatively extensive production and management, the rural distribution industry has become a bottleneck for high-quality development of the distribution industry. Therefore, the transformation and development of the rural distribution industry is directly related to whether the Chinese distribution industry can achieve high-quality development. An exploration of the efficiency of the rural distribution industry and improvements to the TFP of the rural distribution industry is of great significance for promoting the transformation and development of the industry and for developing the rural consumer market.
There are a number of studies in the literature on the growth mode and efficiency of the rural distribution industry, but there has been little research on the TFP of rural distribution, and there is a lack of in-depth discussion on its influence factors. The TFP can measure the actual effect of technological progress. It has a solid theoretical foundation, and has been widely used. It is also considered an important theoretical tool to measure the elements that promote growth, besides the factor input. In addition, due to the large geographical area of China, the levels of economic development for different regions are very different, and the developmental level and efficiency of the rural distribution industry are also very different. Therefore, it is necessary to calculate the distribution productivity of different regions separately in order to understand the regional differences and the reality of distribution industry productivity more accurately. Therefore, the improvement in the TFP is of great significance to the transformation and development of the rural distribution industry. Thus, targeting the problem of the TFP in China’s rural distribution industry, which has been studied weakly in academic circles, this paper first uses the DEA–Malmquist Index method to discuss its measurement and to clarify its change rules in time and space, and then uses a panel data model to analyze its influencing factors empirically.
Against this unique background, the main objective of this paper is to use the DEA–Malmquist Index method to calculate the total factor productivity of China’s rural distribution industry and to clarify its change rule in time and regional space. Furthermore, on this basis, the second objective is to discuss and analyze the important factors that affect the development of and change in the TFP of China’s rural distribution industry and to put forward a path to improving the TFP of China’s rural distribution industry.
The main contribution of this paper is twofold. In theory, our work measures the TFP of China’s rural distribution industry and its decomposition index from 2008 to 2018 for the first time, and confirms the positive influence of the information level and the level of transportation facilities on the TFP of the rural distribution industry. In practice, our conclusions can provide a reference for the government to formulate policies to promote the development of the rural distribution industry.
2. Literature Review
In generally, the TFP is defined as a ratio of outputs to inputs. The total factor productivity growth is equal to the residual that the growth of the total output subtracts from the growth of all inputs [2]. The TFP is the core and the first driver of economic growth [3]. It is the surplus of the total output after deducting the influence of all factor inputs. It is the output growth rate exceeding the growth rate of the factor input. It is an important source of economic growth, except for capital, labor force, and land. The sources of TFP growth include technological progress, organizational innovation, specialization, and production innovation. Solow (1957) put forward the total production function with constant returns to scale based on the production function theory of J. Tinbergen and other scholars, initially forming the concept of the TFP, and believed that it was caused by technological progress [4]. Bratt R. (1962) classified and assigned different weights for the factor input, thus measuring a more accurate TFP and measuring the contribution of the TFP to the national income of the United States [5]. D.W. Jorgenson (1967) used a trans-log production function to measure productivity at the two levels of department and total quantity, and decomposed capital input and labor input into quality and quantity, which was called the Jorgenson method [6]. All of the above are traditional production function methods, which assume that production is technically effective and that TFP growth after deducting the factor productivity is attributed to technological progress.
Two kinds of methods measure the TFP: one is the growth accounting method, and the other is the frontier production function method. The basic idea of the growth accounting approach is to eliminate the contribution of the factor input in economic growth and then estimate TFP growth. The basic idea of the frontier production function method is to classify economic growth into three parts: factor input growth, technological progress, and technological efficiency improvement. The frontier production function method can be divided into two kinds: the parametric stochastic frontier analysis (SFA) [7] and the nonparametric data envelopment analysis (DEA) [8], both of which are suitable for panel data. D.W. Caves (1982) proposed a method to calculate the Malmquist Index and used it as a productivity index for the first time [9]. Molinos-Senante, M. et al. (2017) assessed the TFP change in the English and Welsh water industries [10]. Bin, L. et al. (2020) used the method to measure the firm-level TFP [11], and Wang, Y. et al. (2019) measured the agricultural green TFP of China [12]. Cai, H. et al. (2019) measured the efficiency of the photovoltaic (PV) industry in China [13]. Luo M. studied the TFP in the Chinese construction industry, and drew a lot of exciting conclusions [14,15]. Huijun Li and Bo Li (2019) indicated that environmental regulations can effectively promote industrial green transformation by improving the green total factor productivity (GTFP) [16]. Milivoje D. (2019) studied the efficiency dynamics of the Croatian banking industry [17]. Andrius, G. and Vaida, P. (2019) used SFA to analyze the efficiency of a real estate investment trust (R.E.I.T.) [18]. Li, Q. et al. (2020) used the DEA–SBM super-efficiency model to measure the agricultural ETFP of 30 provincial regions in China [19]. Jacek, P. and Rafał, Ż. (2020) explored trade and FDI as channels of international TFP spillover [20]. Jiangfeng Hu et al. (2020) measured the TFP growth index in Chinese agriculture [21]. Currently, the most widely used method to measure the TFP is the Malmquist Index method based on DEA.
Research on the TFP of the distribution industry is mainly a discussion about the retail trade labor productivity. Ratchford (2003) measured the labor productivity of retail food stores in the United States and explained the decline of its labor productivity index [22]. Baroos and Alves (2004) used the DEA method to estimate the total productivity change of a Portuguese retail chain, and decomposed it into technical efficiency change and technical change to obtain the productivity of different stores along the chain [23]. Moreno and Jorge (2012) used DEA to analyze the data of retail companies in five European countries from 1998 to 2006, used the Malmquist Index to analyze their productivity growth, and found the difference between the results of different measurement methods [24]. Shin and Eksioglu (2015) used the regression analysis of the Cobb–Douglas production function to confirm that RFID retailers have higher labor/revenue elasticity than non-RFID retailers, indicating that RFID retailers have higher labor productivity [25]. Maican and Orth (2015) used a dynamic structural model to quantify the impact of regulation on retail productivity, and concluded that more liberal regulation significantly increased the weighted total productivity of the local market [26]. C Alvarez R. et al. (2020) used a novel five-step LCA + DEA approach for a case study of 30 retail groups in Spain for the period 2015–2017 [27].
Chinese scholars mostly used the frontier production function method to measure the TFP in the distribution industry it. Domestic research is mainly divided into two aspects: national research and sub-regional research. Across the country as a whole, the efficiency of the Chinese logistics industry is not high, but it is steadily rising [28]. Li Xiaohui (2012) measured the TFP decomposition index—technological progress, pure technical efficiency, and scale efficiency—and concluded that the overall production efficiency of the Chinese distribution industry was low [29]. The growth mode of China’s distribution industry has changed from technology driven to capital driven since 2006, and the growth in the TFP has slowed down significantly; specifically, the degree of technology inefficiency has deepened [30,31]. Gong Chao (2018) measured the TFP of the distribution industry and found that it had a significant positive impact on the employment population, and found that the impacts between different regions of the country are different [32]. The improvement in the population urbanization level and the upgrades in the industrial structure have a positive impact on the TFP of the distribution industry [33]. The geometric average annual growth rate of the TFP of the Chinese distribution industry from 1998 to 2016 was 9.4% [34]. Liu Ze and Wang Haining (2020) calculated that the total factor productivity of the national distribution industry maintained an upward trend, with fluctuating changes from 2009 to 2018 [35], and Xu Mijing (2020) drew a similar conclusion [36].
Regarding sub-regional studies, the growth of the TFP in different regions of China is similar in the long run, but the intensity of the convergence effect of the three regions is different [37]. The annual negative growth of the TFP in the Yangtze River Economic Belt in 2004–2013 was mainly driven by the factor input rather than an efficiency improvement [38]. Then, some scholars measured the TFP of the distribution industry and its decomposition and analyzed the regional differences. Regarding research on the efficiency of the rural distribution industry, the existing research either focuses on the technical efficiency or the distribution of agricultural products, but lacks research on the overall TFP of the rural distribution industry. The technical inefficiency in the Chinese rural distribution industry is significant, but this phenomenon is gradually decreasing [39]. The overall efficiency of the Chinese agricultural product distribution had a downward trend after 2008, especially the technical change index [40]. Chen and Li (2019) believed that the TFP of the distribution industry in Chinese provinces had obvious spatial correlation and spatial heterogeneity [41], which was also confirmed by the study of Ma Li [42]. In Jiang Feng’s study (2020), the regional differences in the technical efficiency of commercial distribution in the eastern, central, and western regions were significant [43]. The efficiency of commercial distribution in the central region had the highest improvement, followed by the eastern region and western region.
Based on the literature at home and abroad, great progress has been made in research on the TFP and the TFP of the distribution industry. However, due to different data and methods, there has been no consistent conclusion on the measurement results, and even the results obtained by different methods are quite different. In the literature on the rural distribution industry, although some literature related to distribution efficiency exists, a lack of research on the TFP of the rural distribution industry and a lack of discussion on its changing rules and influencing factors also exist, which are the research focuses of this paper. The possible highlights of this paper lie in the first use of the DEA–Malmquist Index method to measure the total factor productivity of the Chinese rural distribution industry and to clarify its change rule in time and regional space. This paper also identifies important factors affecting the development of and change in the total factor productivity of the rural distribution industry in China.
3. Methodology
3.1. Research Design
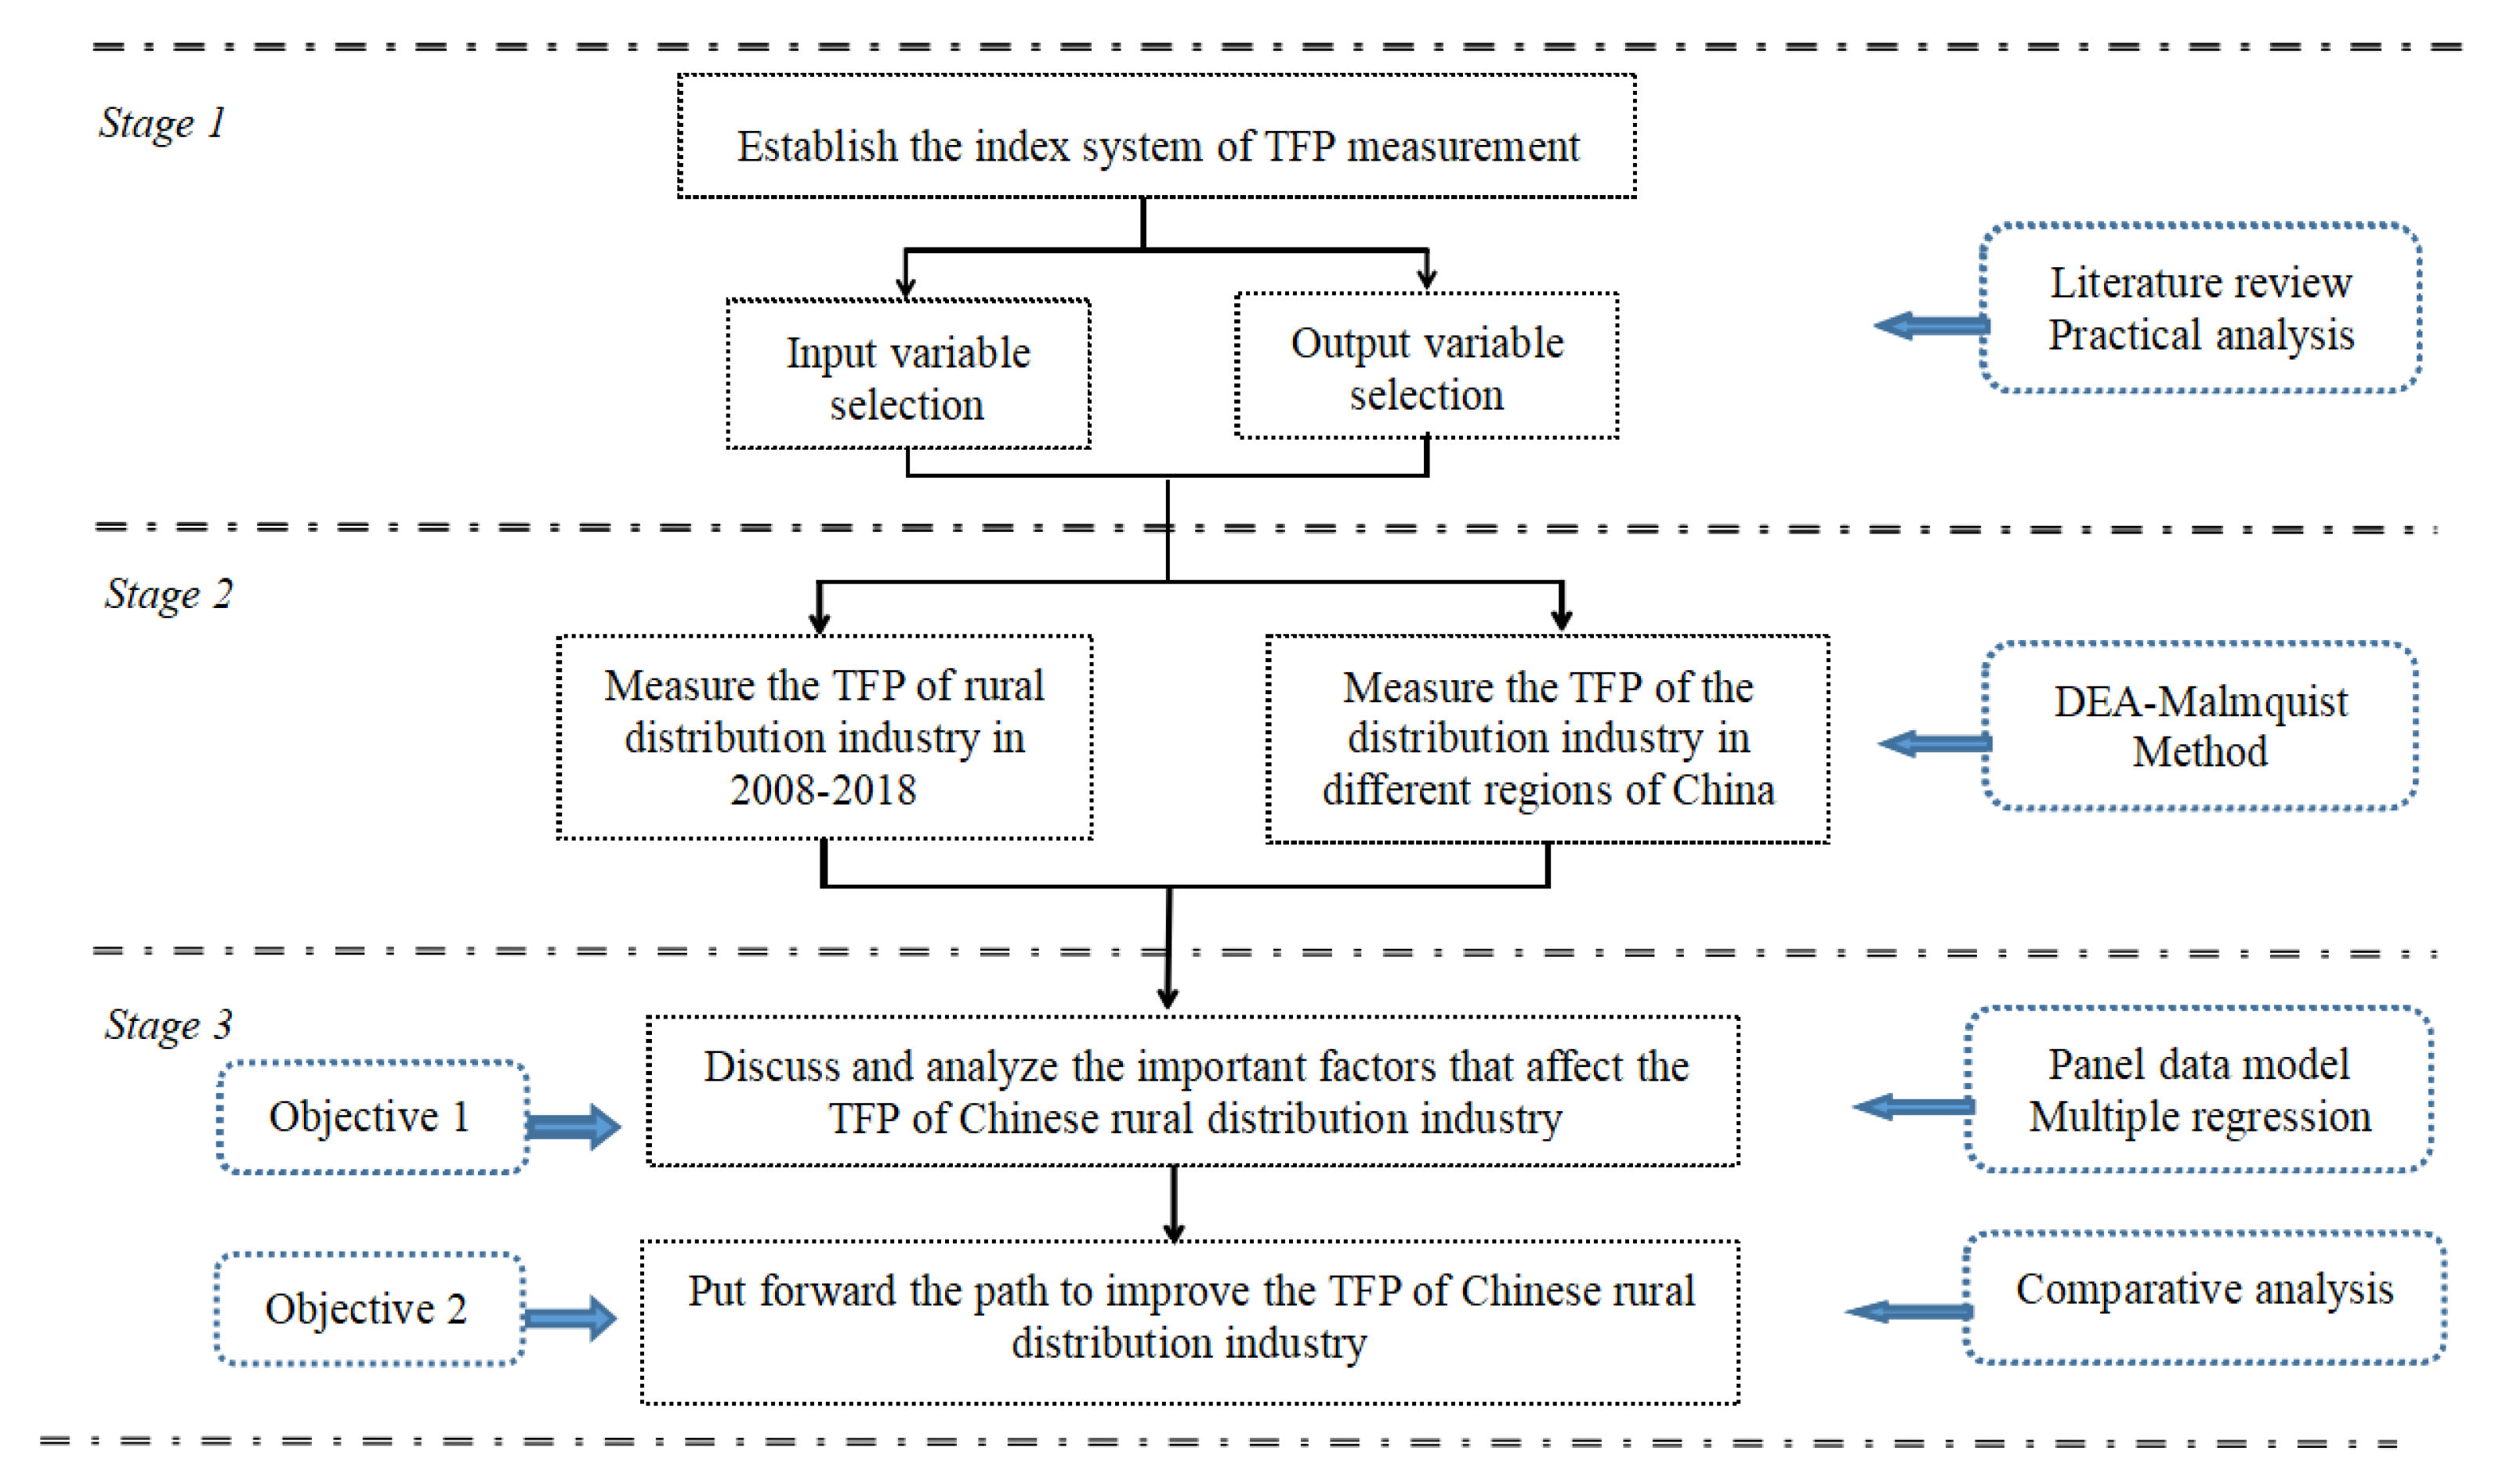
In order to achieve the research objective, a three-stage research design [44] was planned, as shown in Figure 1. First, the index system for measuring the TFP of rural distribution was constructed, and then, the results of the rural TFP were obtained and measured for different regions of China. Third, on this basis, this paper constructs a panel data model of the influencing factors of the TFP in rural distribution, and then puts forward some countermeasures and suggestions to improve the TFP in rural distribution.
3.2. Method
Nonparametric data envelopment analysis (DEA) uses the linear optimization method to estimate the boundary production function and the distance function, which has good applicability. DEA was proposed by A. Charnes et al. (1978) to evaluate the relative efficiency of decision-making units (DMUs) with the same or similar inputs and outputs, and its emergence promoted research on total factor productivity, thus entering a new stage [8]. The Malmquist Index is commonly used to measure the change in total factor productivity of DMUs for different periods. Later, scholars combined DEA with the Malmquist Index method and widely used it to measure production efficiency. This method can measure the changes in productivity for different periods, and does not need to estimate parameters and index weight assumptions in advance or perform dimensional processing on the index data. Its use is also suitable for panel data. This paper uses the DEA–Malmquist Index method to measure the TFP of China’s rural distribution industry. The principle is as follows [45].
To define the output-based Malmquist Index of productivity change, we assume that, for each time period , the production technology models the transformation of inputs, , into outputs, :
The output distance function is defined at t as follows:
This function is defined as the reciprocal of the “maximum” proportional expansion of the output vector , given inputs . In particular, note that if, and only if, . In addition, if, and only if, is on the frontier of technology.
To define the Malmquist Index, we need to define distance functions with respect to two different time periods:
The distance function measures the maximal proportional change in outputs required to make feasible to the technology at . Similarly, one may define a distance function at that measures the maximal proportional change in output.
The Malmquist Productivity Index can be defined as follows:
Alternatively, one could define a period of the Malmquist Index as follows:
Therefore, the Malmquist Productivity Index change in period can be defined as follows:
The Malmquist Index can be decomposed into the technical efficiency index (effch) and the technical progress index (techch), while the technical efficiency index can be further decomposed into the pure technical efficiency index (pech) and the scale efficiency index (sech), which are expressed as follows:
which represents an increase in technical efficiency when and vice versa, and means technological progress when and vice versa.
The four distance functions of the Malmquist Index can be calculated using the DEA method, based on the following principle.
We assume that there are decision-making units using inputs at each time period . These inputs are used to produce outputs . Each observation of inputs and outputs is strictly positive, and the number of observations remains constant across all years. Therefore, the frontier technology in period is constructed as follows:
In order to calculate the productivity of the decision-making unit between and , we need to solve four different linear programming problems: ,, and .
For each decision-making unit , can be calculated by solving the following linear programming problem:
S.t.
The remaining three distance functions can be calculated in a similar way.
With the above DEA–Malmquist Index method, the TFP of the rural distribution industry in China can be obtained.
3.3. Variables and Data
Generally, the measurement method of distribution can be divided into two kinds: the production function method and the DEA–Malmquist method (see Table 1). The Malmquist Index method uses input and output indicators. Referring to the existing literature, this paper selected the following variables as the variable system of the TFP in the rural distribution industry.
The input indicators of rural distribution industry were rural distribution industry employees and rural distribution industry fixed assets investment, which represented labor input and capital input, respectively, and the output indicator was the added value of the rural distribution industry.
Labor input in the rural distribution industry: As no direct statistical data of rural distribution employees are available, this paper used the number of private and individual employees of each province distribution industry minus the number of private and individual employees of the urban distribution industry as the data of rural distribution employees in each province.
Capital input in the rural distribution industry: Based on the fixed asset investment data from the rural distribution industry, the capital stock of the rural distribution industry was estimated using the perpetual inventory method (the depreciation rate was set to 5%), which was used to indicate the capital input of the rural distribution industry. The fixed assets investment data of the rural distribution industry in each province are equal to the fixed assets investment of the whole society of the distribution industry minus the fixed assets investment (excluding farmers) of the distribution industry, and the fixed assets price index based on 2008 was used to reduce the original data.
Output of the rural distribution industry: The added value of each province distribution industry indicated this output, and the consumer price index of 2008 was used as the base period to reduce the original data.
The distribution industry in this paper refers to the wholesale and retail industry; the accommodation and catering industry; and the transportation, warehousing, and postal industry. The 31 provincial administrative units in China were regarded as DMUs. The panel data of 31 DMUs in 2008–2018 were used to calculate the TFP of the distribution industry. The data came from the China National Bureau of Statistics (http://www.stats.gov.cn/tjsj/, accessed on 10 June 2021).
Due to space constraints, the original input and output data of the rural distribution industry are not listed. The data for all years and all DMUs of each variable index were taken as a sequence, and the descriptive statistical results of the variables are shown in Table 2.
4. Results
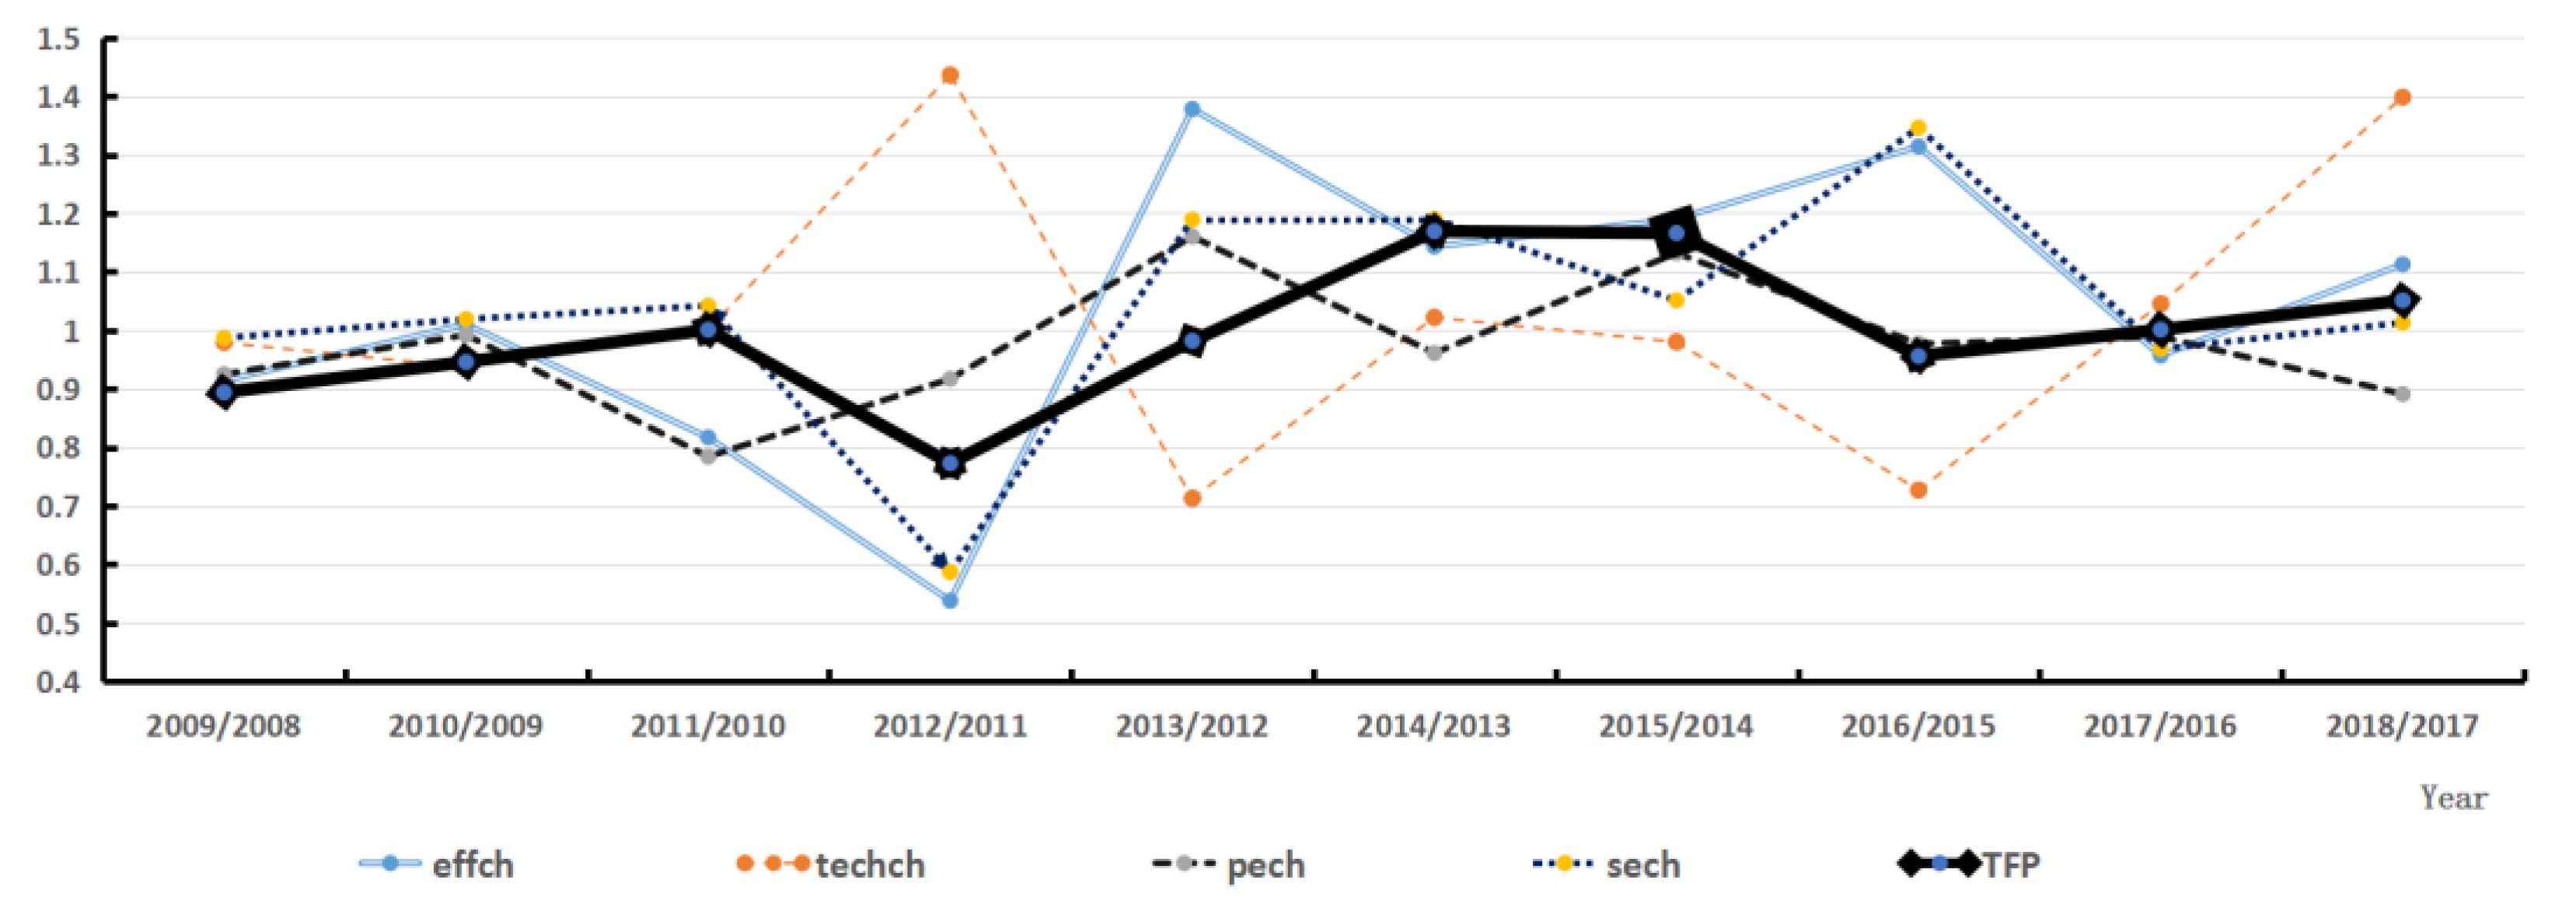
After sorting out the input and output data of 31 provincial units of the rural distribution industry in 2008–2017, we input the data into the DEAP2.1 software to obtain the TFP and its decomposition index of the rural distribution industry: efficiency change index (effch), technical change index (techch), pure technical efficiency change index (pech), and scale efficiency change index (sech). Due to limited space, the TFP and its decomposition index data are not listed, and only the overall data for the whole country are shown in Table 3 and Figure 2.
From the vertical time span characteristics, the TFP of the Chinese rural distribution industry shows a trend of first rising, and then fluctuating and declining, with an average annual growth rate of 2.93% in 2008–2018. Five years had positive growth, and the highest value appeared in 2013, with a growth rate of 27.04%. On the whole, the change in the TFP was relatively gentle and not dramatic. The TFP value measured in this paper was far lower than that measured by Jiang Yunli (2018) using the C-D production function to measure the TFP of the distribution industry in China (including rural areas) from 1998–2016, and the result was that the geometric average annual growth rate was 9.4%.
The decomposition index of TFP technological progress (techch) had a more drastic change, and its relationship with technological efficiency (effch) was essentially a trade-off. In 2012, technological progress (techch) reached a maximum value of 1.436, with a growth rate of 43.46%, indicating relatively large fluctuations since then. The measurement results of 2012 were slightly higher than those of other years and higher than the 13.95% calculated by Jiang Yunli (2018), partly because the measurement objects of these two papers were nationwide, including urban and rural areas, while this paper only targeted the rural distribution industry.
In this paper, the average annual rate of technological progress in the rural distribution industry in China from 2008 to 2018 was 2.93%, slightly higher than the average annual rate of 2.3% from 2000 to 2009, measured by Wang Liangju and Wang Yongpei (2011) using stochastic frontier analysis (SFA), which was due to the different time intervals of the research.
Let us look at the decomposition index of technological efficiency (effch). The average annual growth rate of technological efficiency (effch) was 3.74%, which achieved growth in five years. The highest value appeared in 2013, with a growth rate of 37.8%, and the lowest value appeared in 2009, with a growth rate of −1.9%. The average annual growth rate of the pure technical efficiency change index (pech) was −2.7%, and that of the scale efficiency change index (sech) was 3.92%, which was the highest among all decomposition indexes. The growth rate of the scale efficiency change index (sech) in 2009–2011 and 2012–2016 was positive, while that of the pure technical efficiency change index (pech) was only positive in 2013 and 2015, indicating that the growth of technological efficiency (effch) was mainly driven by the scale efficiency change index (sech) rather than the pure technical efficiency change index (pech), reflecting the dominance of the scale factor on the efficiency change. The reasons for the slow and small fluctuation growth in rural distribution productivity in recent years are the continuous improvement in rural distribution infrastructure, as well as the renewal and transformation of logistics tools. However, due to the slow progress of technology, the growth in the distribution productivity is small.
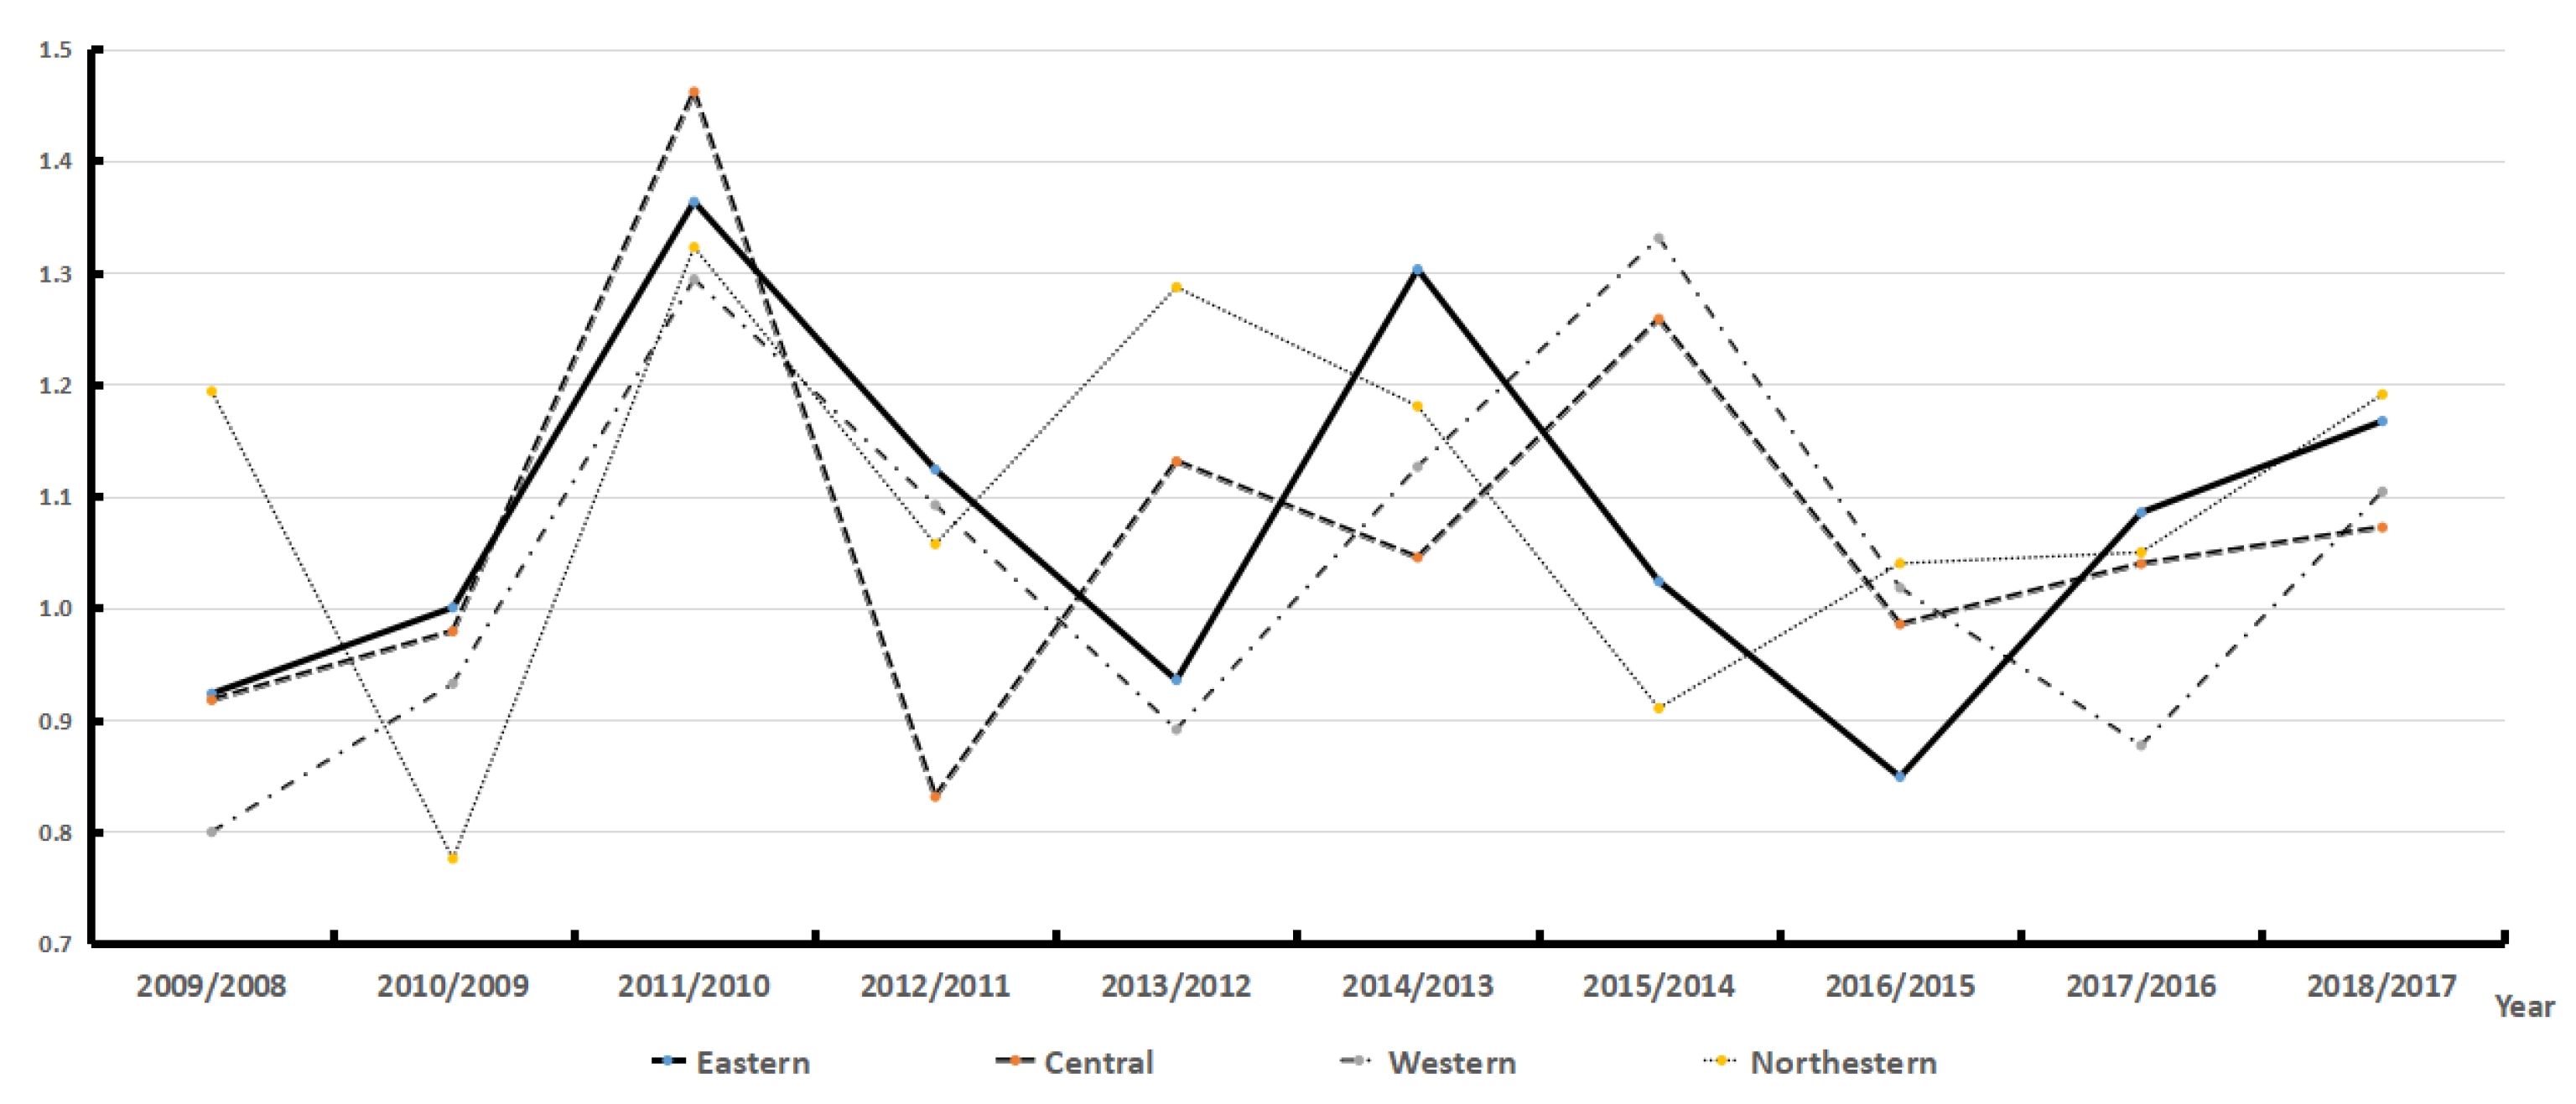
From the perspective of the spatial characteristics of the sub-regions, as shown in Table 4 and Figure 3, the TFP of the distribution industry in the rural areas of the eastern, central, western, and northeastern regions of China basically shows a relatively strong fluctuation. The fluctuation direction of the eastern and western regions was generally the same, which was in a reverse relationship with the central and northeastern regions for many years.
From 2008 to 2018, the TFP of rural distribution in eastern China increased positively in most years, with an average annual growth rate of 7.73%, higher than that in central and western China. This result is also consistent with the more developed economic status of eastern China. The average annual growth rate of central China was 7.19%, which was close to that of eastern China and slightly lower than that of the whole country. The central region achieved positive TFP growth in six years. The average annual growth rate of the rural distribution TFP in western China was 4.65%, far lower than the average level of other regions and the whole country, ranking last among all regions. The western region economy is relatively backward, and the investment in the rural distribution industry is insufficient, which leads to this result. The average growth rate of the rural distribution TFP in northeast China was 10.08%, which was the highest in all regions. Although northeast China is not an economically developed region, its agricultural production technology is more advanced, the rural economy is better developed, and the labor input in the distribution industry is more sufficient.
The TFP of the rural distribution industry in northeastern China showed positive growth in most years, showing a relatively rapid improvement in distribution efficiency, followed by the eastern region, for which the TFP was also greater than one in most years, with a more obvious positive growth trend.
5. Further Study—On the Influencing Factors of the TFP
In order to study how to improve the TFP of the rural distribution industry, an analysis of its influencing factors is necessary.
5.1. Data and Model
Referencing existing research, through the selection of indicators, the author finally determined four factors, namely industrial structure (IS), urbanization rate (UR), rural informatization rate (IR), and conditions of rural transportation facilities (TF) as the variables affecting the TFP of the rural distribution industry, and took the economic development level, rural population pattern, and rural consumption level as the control variables.
The proportion of the output value from the tertiary industry to GDP was used to express the industrial structure (IS). The proportion of the urban population to the total population was used to express the urbanization rate (UR). The number of rural broadband subscribers was used to express the degree of rural informatization rate (IR), and the length of the secondary and lower grade roads in the province was used to express the conditions of rural transportation facilities (TF). All of the above indicators used the provincial panel data from 2009 to 2018, and the data were from the annual data of each province of the National Bureau of Statistics. Due to limitations in space, only the descriptive statistical results of the original data of the main influencing factors are listed in Table 5.
Data stability test: the panel data model tests the stability of the data before modeling. In this paper, Eviews 7.0 software was used to test the unit root of the variable data. The results showed that the original sequences of TFP, UR, and TF were stable; that the original sequence of IS was not stable; and that its logarithm sequence (ln_IS) was stable. The original sequence of IR was not stable, and its logarithmic and differential sequences (d_ln_IR) were stable.
Co-integration analysis: the purpose of a co-integration analysis is to determine whether a long-term stable relationship exists between variables to avoid pseudo regression. The results of the Johansen co-integration test on the panel data showed that a co-integration relationship existed between TFP and UR, TF, IS, and IR, which indicated that the TFP and these variables existed in a long-term, stable relationship, which can be used for regression analysis.
Three forms of the panel data model exist. Different model settings have a greater impact on the estimation results. The covariance analysis test can determine the form of the model. After testing, the model should be a constant coefficient model, and the form is shown as:
Among them, the explained variable was the TFP of the rural distribution industry (TFP), and the explanatory variables were the industrial structure (IS), urbanization rate (UR), rural informatization rate (IR), and the conditions of rural transportation facilities (TF). K represents the combination of control variables. Here, the level of economic development, the scale of population, and the level of consumption were selected as control variables. is the intercept term, is the coefficient of the explanatory variable, is the random error term, represents the number of individuals, and the time period is t.
5.2. Estimation Results
5.2.1. Results of China
The panel data of 31 provincial units in China from 2009 to 2018 were substituted into the model, and the results calculated by Eviews 7.0 software are shown in Table 6 (Columns 1, 2, 3).
From Table 6, the estimation results of independent variables were relatively significant, but the coefficient differences were large, which means that they had different degrees of impact on the TFP of the rural distribution industry, which are analyzed separately below.
Urbanization rate (UR): The coefficient of the UR was 0.0095, which means that every unit of urbanization rate increase can promote growth in the TFP of the rural distribution industry by 0.0095 units. The impact of the urbanization rate on the TFP was positive, but the degree of impact was weak. With the rural residents entering the city to settle down, the expansion of urban residents’ consumption provides a broader market and more employment opportunities for the development of the rural distribution industry, and correspondingly brings about an increase in the distribution output value.
Conditions of the transportation facilities (TF): The coefficient of the TF was 0.2015, which indicated that every 1% increase in rural transportation facilities can promote the growth of the TFP in the rural distribution industry by 0.2015%, which was a relatively significant positive impact. The improvement in the rural transportation infrastructure with highways had an obvious impact on the rural distribution efficiency. A sound transportation infrastructure is the premise, foundation, and only method of improving rural distribution efficiency.
Industrial structure (IS): The coefficient of the IS was −0.6808, which indicated that it had a negative impact on the TFP of the rural distribution industry, which was different from the conclusion of the positive impact obtained in the existing literature (Liu Siwei and Zhou Hongyang, 2018). The reason for this may be that this paper targets the rural distribution industry, excluding urban distribution. Another explanation is that the decline in the proportion of the primary industry causes the rural distribution industry to lose part of the market, thus reducing its output efficiency.
Informatization rate (IR): The coefficient of the IR was 1.3394, which means that every 1% increase in the informatization rate in rural areas can drive the TFP of the rural communication industry to increase by 1.3394%. The IR had a significant positive impact on the TFP of the rural distribution industry, and had the greatest impact among many factors. The improvement in the rural informatization rate can accelerate the information transmission of rural distribution enterprises, promote the management efficiency of the rural distribution industry, and play an important role in improvements in its technical efficiency. In the further popularization of big data (BD), internet of things (IOT), and other information technologies to rural areas, the operation efficiency of rural distribution will be further improved.
5.2.2. Results of Different Regions of China
In order to further analyze the regional differences in the TFP influencing factors of the rural distribution industry, this paper analyzes the panel data model of eastern, central, western, and northeastern China, and the regression results are shown in Table 6 (Columns 4–11).
Urbanization rate (UR): The coefficient of the UR to the TFP of the rural distribution industry in the four regions was generally higher than the national average, in which the largest coefficient was in the western region (0.0206) and the smallest was in the eastern region (0.0090). The UR in the western region was behind that of the whole country. The effect of improving the urbanization rate on the TFP of the rural distribution industry was stronger than that of a lower level of urbanization.
Conditions of the transportation facilities (TF): The coefficient of eastern China was the largest (0.4111), and the coefficient of western China was the smallest (0.0361). The construction of the rural transportation infrastructure in eastern China was at the leading level within the country, and had the most significant impact on the TFP of the rural distribution industry.
Industrial structure (IS): The coefficient of IS was negative, and the negative degree of the eastern region was the largest (−0.939). The influence of industrial structures on the rural distribution efficiency needs further study.
Informatization rate (IR): Among the four regions, the coefficient of the IR in the western region was the highest (1.9262). Improving the rural informatization rate in the western region had a significant effect on the growth of the TFP in the distribution industry.
Among the factors that affected the TFP of the rural distribution industry, which were similar across the nation, the positive impact of the informatization rate (IR) was the largest, followed by the condition of transportation facilities (TF). The influence of the industrial structure (IS) was negative. It can be seen that information, transportation, and the construction of other infrastructures play important roles in improving the efficiency of rural distribution.
6. Discussion
Since there is no research on the TFP of the Chinese rural distribution industry, the measurement results in this paper do not have data that can be directly compared. However, the TFP (including urban and rural areas) of the distribution industry studied in the existing literature is slightly higher than the results in this paper (Jiang Yunli, 2018) for various reasons. The first is the difference in the research area, the second is the difference in the research period, and the third is the difference in the measurement method. The TFP is generally believed to increase with technological progress, but the results from the literature show strong volatility, although the overall trend is upward. In order to confirm the applicability of the measurement results in many aspects, it is necessary to use other methods to measure the TFP. This is a direction for further research.
The TFP of the rural distribution industry in China was on the rise from 2008 to 2018, which shows that the efficiency of the rural distribution industry is improving. However, this paper also finds that the TFP of the rural distribution industry fluctuates greatly, which leads to a slow improvement in industrial efficiency. The output value growth of the Chinese rural distribution industry still mainly depends on the input of labor and capital, and the output value growth caused by technological progress is relatively small. The technical inefficiency in the Chinese rural distribution industry is significant. The growth in technical efficiency is mainly driven by scale efficiency rather than pure technology, which reflects the dominance of the scale factor on technical efficiency. Therefore, we should strengthen the transformation and upgrades in the rural distribution industry, improve the degree of industrial mechanization and informatization, and give full play to the role of technology in the growth of the rural distribution industry output value.
As for the factors affecting the TFP of China’s rural distribution, the result of this paper is that the level of informatization and transportation facilitation have the most significant influence on it, which is basically consistent with the conclusions of existing studies. However, as for the factor of industrial structure, the result of this paper is quite different from that of similar existing literature. This paper concludes that the change in industrial structure (the decrease in the proportion of primary industry) leads to the decrease in the TFP of the rural distribution industry. This is because the primary industry is the main industry in rural areas, and the decline in its proportion leads to a shrinking of the market of the rural distribution industry, thus reducing investments in the labor force and capital in the rural distribution industry. Of course, this question can be further discussed.
There are three findings of this paper. First, there are the specific values of the TFP and its decomposition index of the Chinese rural distribution industry from 2008 to 2018. This result has not been reported in the literature before. Second, there is the TFP value and its variation characteristics of the rural distribution industry in eastern, central, western, and northeast China. This result is also the author’s important discovery. The TFP growth rate of the rural distribution industry in northeast China is higher than that in the other regions, except the eastern region. This result is also different from the research conclusions of similar literature, which is an interesting finding. Third, it is found that the level of informatization is an important factor affecting the TFP of the Chinese rural distribution industry, and the role of informatization in promoting the efficiency of rural distribution industry has been quantitatively confirmed. The improvement of information equipment and the transportation infrastructure will help to improve the efficiency of the rural circulation industry.
7. Conclusions and Implications
The TFP of the Chinese rural distribution industry shows a trend of first rising, and then fluctuating and declining, with an average annual growth rate of 2.93% in 2008–2018. Five years had positive growth, and the highest value appeared in 2013, with a growth rate of 27.04%. As a whole, the change in the TFP was relatively gentle and not dramatic. The growth rate of the scale efficiency change index (sech) in 2009–2011 and 2012–2016 was positive, while that of the pure technical efficiency change index (pech) was only positive in 2013 and 2015, indicating that the growth in the efficiency change index (effch) is mainly driven by the scale efficiency change index (sech) rather than the pure technical efficiency change index (pech), reflecting the dominance of the scale factor over the efficiency change.
From the perspective of the spatial characteristics of the subregions, the TFP of the distribution industry in the rural areas of the eastern, central, western, and northeastern regions of China basically shows a relatively strong fluctuation. The fluctuation of the eastern and western regions is generally the same, which has been in a reverse relationship with the central and northeastern regions for many years. Chinese rural areas are vast, and the TFP of the rural distribution industry varies greatly among different regions. The TFP of eastern China is slightly higher than that of other regions, which is due to its more developed economy. However, in the economically underdeveloped northeast region, the efficiency of the rural distribution industry is higher, which is due to the better foundation of rural industrialization in this region. The agricultural industrialization and scale operation in northeast China are relatively mature, and the mechanization of the rural distribution industry is relatively high.
The practical significance of this paper lies in two aspects. On the one hand, on the basis of clarifying the TFP of China’s rural circulation industry, the characteristics of its temporal and spatial changes are found, which provides empirical data for follow-up research. On the other hand, after exploring various factors affecting China’s rural circulation industry, we can put forward some policy suggestions. In fact, the rise of internet penetration and the full application of information equipment are important measures to improve the efficiency of the rural distribution industry. The conclusion of this paper has some enlightenment for rural distribution practitioners and government regulators.
From the empirical results of this paper, we put forward a path to improving the TFP of China’s rural distribution industry. First, the informatization rate and mechanization degree of the rural distribution industry should improve. The research proves that an improvement in the rural informatization rate has a significant role in promoting the growth of the TFP in the rural distribution industry. Therefore, various measures should be taken to improve the informatization rate of the rural infrastructure and distribution industry. Second, the rural distribution infrastructure should improve. The empirical results of this paper show that the level of transport infrastructure has a significant role in promoting the growth of the TFP in the rural distribution industry, which is also obvious. It is an important way to enhance the efficiency of rural distribution to improve transport infrastructures, such as highways. Third, the urbanization rate should improve, and the equalization of public services in urban and rural areas should be promoted. The research confirms that an improvement in the urbanization rate has a positive impact on the TFP of the rural distribution industry. Fourth, rural distribution enterprise groups should be cultivated, and full play should be given to the advantages of the scale economy. The government should encourage rural distribution enterprises to integrate many “farm stores” and “husband and wife stores” through large-scale development; to integrate distribution subjects, such as agricultural cooperatives, logistics enterprises, and industry associations in the rural distribution system, appropriately improving the industrial concentration; and to build large-scale rural distribution enterprise groups.
The limitations of this paper are that only one method was used to measure the total factor productivity of the Chinese rural distribution industry, and that multiple calculation methods were not used to verify each method, which may lead to a lack of persuasion in the calculation results. However, the method used in this paper is highly applicable, and a variety of results may cause confusion.
Author Contributions
Conceptualization, C.D.; methodology, C.D.; software, C.D.; validation, R.Z.; formal analysis, C.D.; investigation, R.Z.; data curation, R.Z. and C.D.; writing—original draft preparation, C.D.; writing—review and editing, C.D.; visualization, C.D. All authors have read and agreed to the published version of the manuscript.
Funding
This paper was funded by the National Social Science Foundation of China: the study on the consumption structure of urban and rural residents from the perspective of habit formation embedded in the panel ELES model (project No. 19BJL047), and by the Humanities and Social Sciences Research Project of the Education Department of Henan Province: research on the mechanism and path of high-quality development of distribution to promote upgrades in rural consumption (project No. 2020-ZZJH-147).
Institutional Review Board Statement
Not applicable.
Informed Consent Statement
Not applicable.
Data Availability Statement
Not applicable.
Acknowledgments
Thanks to the support given by Xuepin Wu from Hainan University.
Conflicts of Interest
The authors declare no conflict of interest. The funders had no role in the design of the study, in the collection, analyses, or interpretation of data, in the writing of the manuscript, or in the decision to publish the results.
References
- Wang, X.; Chen, L.; Wu, Z. The influence of distribution efficiency on manufacturing performance: A review of supply-side structural reform. Econ. Theory Manag. 2020, 82–99. [Google Scholar]
- Wang, Y.; Ye, G.; Zhang, Y.; Mu, P.; Wang, H. Total factor productivity growth and its contribution: Lessons from the Chinese construction industry pre- and post-2008 financial crisis. Eng. Constr. Arch. Manag. 2020, 27, 2911–2929. [Google Scholar] [CrossRef]
- Wang, Y.; Ye, G.; Zhang, Y.; Mu, P.; Wang, H. Is the Chinese construction industry moving towards a knowledge- and technology-intensive industry? J. Clean. Prod. 2020, 259, 120964. [Google Scholar] [CrossRef]
- Solow, R.M. Technological Change and Aggregate Production Function. Rev. Econ. Stat. 1957, 39, 312–320. [Google Scholar] [CrossRef] [Green Version]
- Bratt, R. The Sources of Economic Growth in the United States and the Alternatives before Us. J. Financ. 1962, 17, 704–705. [Google Scholar] [CrossRef]
- Jorgenson, D.W.; Griliches, Z. The Explanation of Productivity Change. Rev. Econ. Stud. 1967, 249–283. [Google Scholar] [CrossRef]
- Hildreth, C.; Houck, J.P. Some estimators for a linear model with random coefficients. J. Am. Stat. Assoc. 1968, 63, 584–595. [Google Scholar] [CrossRef]
- Charnes, A.; Cooper, W.W.; Rhodes, E. Measuring the Efficiency of Decision Making Units. Eur. J. Oper. Res. 1978, 2, 429–444. [Google Scholar] [CrossRef]
- Caves, D.W.; Christensen, L.R.; Diewert, W.E. Multilateral Comparisons of Output, Input, and Productivity Using Superlative Index Numbers. Econ. J. 1982, 92, 73. [Google Scholar] [CrossRef]
- Molinos-Senante, M.; Maziotis, A.; Sala-Garrido, R. Assessment of the Total Factor Productivity Change in the English and Welsh Water Industry: A Färe-Primont Productivity Index Approach. Water Resour. Manag. 2016, 31, 2389–2405. [Google Scholar] [CrossRef]
- Li, B.; Shi, S.; Zeng, Y. The Impact of Haze Pollution on Firm-Level TFP in China: Test of a Mediation Model of Labor Productivity. Sustainability 2020, 12, 8446. [Google Scholar] [CrossRef]
- Wang, Y.; Xie, L.; Zhang, Y.; Wang, C.; Yu, K. Does FDI Promote or Inhibit the High-Quality Development of Agriculture in China? An Agricultural GTFP Perspective. Sustainability 2019, 11, 4620. [Google Scholar] [CrossRef] [Green Version]
- Cai, H.; Liang, L.; Tang, J.; Wang, Q.; Wei, L.; Xie, J. An Empirical Study on the Efficiency and Influencing Factors of the Photovoltaic Industry in China and an Analysis of Its Influencing Factors. Sustainability 2019, 11, 6693. [Google Scholar] [CrossRef] [Green Version]
- Luo, M.; Fan, H.Q.; Liu, G. Measuring regional differences of construction productive efficiency in China: A distance friction minimization approach. Eng. Constr. Archit. Manag. 2020, 27, 952–974. [Google Scholar] [CrossRef]
- Luo, M.; Fan, H.; Liu, G. A target-oriented DEA model for regional construction productive efficiency improvement in China. Adv. Eng. Inform. 2021, 47, 101208. [Google Scholar] [CrossRef]
- Li, H.; Li, B. The threshold effect of environmental regulation on the green transition of the industrial economy in China. Econ. Res. Ekon. Istraživanja 2019, 32, 3134–3149. [Google Scholar] [CrossRef] [Green Version]
- Davidovic, M.; Uzelac, O.; Zelenovic, V. Efficiency dynamics of the Croatian banking industry: DEA investigation. Econ. Res. Ekon. Istraživanja 2019, 32, 33–49. [Google Scholar] [CrossRef] [Green Version]
- Grybauskas, A.; Pilinkienė, V. A Comparative Analysis of R.E.I.T.s, R.E.O.C.s and P.R.E.O.C.s Using a Stochastic Frontier Approach. Econ. Res. Ekon. Istraživanja 2019, 32, 1542–1560. [Google Scholar] [CrossRef] [Green Version]
- Li, Q.; Wu, X.; Zhang, Y.; Wang, Y. The Effect of Agricultural Environmental Total Factor Productivity on Urban-Rural Income Gap: Integrated View from China. Sustainability 2020, 12, 3327. [Google Scholar] [CrossRef] [Green Version]
- Pietrucha, J.; Żelazny, R. TFP spillover effects via trade and FDI channels. Econ. Res. Ekon. Istraživanja 2020, 33, 2509–2525. [Google Scholar] [CrossRef]
- Hu, J.; Wang, Z.; Huang, Q. Factor allocation structure and green-biased technological progress in Chinese agriculture. Econ. Res. Ekon. 2020. [Google Scholar] [CrossRef]
- Ratchford, B.T. Has the productivity of retail food stores really declined? J. Retail. 2003, 79, 171–182. [Google Scholar] [CrossRef]
- Barros, C.P.; Alves, C. An empirical analysis of productivity growth in a Portuguese retail chain using Malmquist productivity index. J. Retail. Consum. Serv. 2004, 11, 269–278. [Google Scholar] [CrossRef]
- Moreno, J.J.D. Estimating efficiency and productivity change in European retail sector (1998–2006). Int. J. Econ. Bus. Res. 2012, 4, 412–436. [Google Scholar] [CrossRef]
- Shin, S.; Eksioglu, B. An empirical study of RFID productivity in the U.S. retail supply chain. Int. J. Prod. Econ. 2015, 163, 89–96. [Google Scholar] [CrossRef]
- Maican, F.; Orth, M. A Dynamic Analysis of Entry Regulations and Productivity in Retail Trade. Int. J. Ind. Organ. 2015, 40, 67–80. [Google Scholar] [CrossRef] [Green Version]
- Álvarez-Rodríguez, C.; Gamboa, M.M.; Iribarren, D. Sustainability-oriented efficiency of retail supply chains: A combination of Life Cycle Assessment and dynamic network Data Envelopment Analysis. Sci. Total Environ. 2020, 705, 135977. [Google Scholar] [CrossRef] [PubMed]
- Yu, Y.; Wu, P. An Empirical Study on the Efficiency of China’s Logistics Industry and Its Factors. Ind. Econ. Res. 2010, 65–71. [Google Scholar] [CrossRef]
- Li, X. Technological Efficiency, Technological Progress and Productivity Growth of China’s Logistics Industry. J. Bus. Econ. 2011, 18–25. [Google Scholar]
- Dong, Y.; Congcai, X.U. A Study of the Growth Pattern Transformation of China’s Commercial distribution from the Perspective of TFP Growth. J. Beijing Technol. Bus. Univ. Soc. Sci. 2017, 32, 31–41. [Google Scholar] [CrossRef]
- Zhongan, S. Study on the regional differences and influencing factors of total factor productivity of trade circulation industry. J. Commer. Econ. 2017, 27–29. [Google Scholar] [CrossRef]
- Chao, G. Economic added value, total factor productivity and regional employment growth of distribution industry. J. Commer. Econ. 2018, 176–179. [Google Scholar] [CrossRef]
- Siwei, L.I.U.; Zhou, H. Research on Spatial Correlation and Influencing Factors of Total Factor Productivity in China’s Circulation Industry. J. Beijing Technol. Bus. Univ. Soc. Sci. 2018, 33, 38–50. [Google Scholar] [CrossRef]
- Jiang, Y. Empirical Analysis on the transformation of the development mode of Chinese distribution industry based on TFP. J. Commer. Econ. 2018, 22–25. [Google Scholar] [CrossRef]
- Liu, Z.; Wang, H. Empirical analysis of Chinese distribution industry transformation development mode based on total factor productivity. J. Commer. Econ. 2020, 17–20. Available online: https://www.cnki.com.cn/Article/CJFDTotal-SYJJ202015005.htm (accessed on 10 June 2021).
- Xu, M.J. Technology spillover effect of China’s circulation industry growth. Bus. Econ. Res. 2020, 21–24. [Google Scholar]
- Wang, Q. An analysis of the convergence of TFP in China’s inter regional circulation industry. J. Commer. Econ. 2015, 7–8. [Google Scholar] [CrossRef]
- Chang, S.; Wu, L. Empirical Study on TFP growth and industry heterogeneity in the Yangtze River Economic Belt. Mod. Manag. 2017, 37, 29–32. [Google Scholar] [CrossRef]
- Wang, L.J.; Wang, Y.P. Technical Efficiency of China’s Rural Circulation Industry and Its Influencing Factors:An Empirical Study Based on Stochastic Frontier Model. J. Beijing Technol. Bus. Univ. Soc. Sci. 2011, 26, 60–64. [Google Scholar] [CrossRef]
- Wang, J. An empirical study on the measurement of total factor productivity of agricultural products circulation. Commer. Times 2013, 40–41. [Google Scholar] [CrossRef]
- Chen, X.; Li, Z. Empirical research on the total factor productivity of China’s circulation industry and its influencing factors. J. Commer. Econ. 2019, 28–31. [Google Scholar] [CrossRef]
- Ma, L. Research on the factors affecting of the total factor productivity of the central and western trade and circulation industry from the perspective of spatial spillover. J. Commer. Econ. 2019, 140–143. [Google Scholar] [CrossRef]
- Jiang, F. Regional Differences in the Efficiency of China’s Commercial Circulation Industry. J. Commer. Econ. 2020, 5–8. Available online: https://mall.cnki.net/magazine/Article/SYJJ202004002.htm (accessed on 10 June 2021).
- Ye, G.; Wang, Y.; Zhang, Y.; Wang, L.; Xie, H.; Fu, Y.; Zuo, J. Impact of Migrant Workers on Total Factor Productivity in Chinese Construction Industry. Sustainability 2019, 11, 926. [Google Scholar] [CrossRef] [Green Version]
- Färe, R.; Grosskopf, S.; Norris, M.; Zhang, Z. Productivity Growth, Technical Progress and Efficiency Changes in Industrialized Countries. Am. Econ. Rev. 1994, 66–83. [Google Scholar] [CrossRef]
Figure 1.
The research design of this paper.

Figure 2.
The TFP and its decomposition index of the rural distribution industry in China.

Figure 3.
The TFP of rural distribution in different regions of China.


Table 1.
Review of the literature on total factor productivity (TFP) measurement in the distribution industry.
Table 1.
Review of the literature on total factor productivity (TFP) measurement in the distribution industry.
| Author(s) | Method | Input–Output Factor (Indicator) System |
|---|---|---|
| LI Xiaohui (2011) [29] | DEA–Malmquist | Two inputs: labor (number of employees); capital (capital stock of the distribution industry) One output: added value of the distribution industry |
| Wang Qi (2015) [37] | DEA–Malmquist | Two inputs: labor (number of employees); capital (capital stock of the distribution industry) One output: added value of the distribution industry |
| Shu Zhongan (2017) [31] | DEA–Malmquist | Two inputs: labor (number of employees and enterprises); capital stock of the distribution One output: total sales of the distribution industry |
| Sun Chang and Wu Lili (2017) [38] | DEA–Malmquist | Two inputs: labor (number of employees); capital (capital stock of the distribution industry) One output: added value of the distribution industry |
| Liu Siwei and Zhou Hongyang (2018) [33] | DEA–Malmquist | Three inputs: labor force; capital of the distribution industry; length of traffic line One output: added value of the distribution industry |
| Jiang Yunli (2018) [34] | Production function | Two inputs: labor (working hours); capital (value of fixed assets of the enterprise industry) One output: added value of the distribution industry |
Table 2.
Descriptive statistics of the raw data.
| Statistic | Output of Rural Distribution Industry (100 Million Yuan) | Labor Input (Person) | Capital Input (100 Million Yuan) |
|---|---|---|---|
| Mean | 3093.61 | 112.43 | 45.67 |
| Median | 2334.28 | 84.58 | 24.27 |
| Maximum | 14,217.10 | 870.60 | 424.60 |
| Minimum | 53.09 | 1.92 | 0.10 |
| S.D. | 2782.54 | 112.32 | 64.58 |
| Observations | 341 | 341 | 341 |
Table 3.
The TFP and its decomposition index of China’s rural distribution industry.
| Year | Effch | Techch | Pech | Sech | TFP |
|---|---|---|---|---|---|
| 2009/2008 | 0.914 | 0.979 | 0.925 | 0.987 | 0.894 |
| 2010/2009 | 1.010 | 0.937 | 0.992 | 1.019 | 0.946 |
| 2011/2010 | 0.817 | 1.001 | 0.784 | 1.042 | 1.001 |
| 2012/2011 | 0.538 | 1.436 | 0.917 | 0.587 | 0.773 |
| 2013/2012 | 1.378 | 0.713 | 1.160 | 1.189 | 0.982 |
| 2014/2013 | 1.143 | 1.022 | 0.961 | 1.190 | 1.169 |
| 2015/2014 | 1.190 | 0.980 | 1.132 | 1.051 | 1.166 |
| 2016/2015 | 1.314 | 0.727 | 0.977 | 1.346 | 0.956 |
| 2017/2016 | 0.957 | 1.045 | 0.989 | 0.968 | 1.001 |
| 2018/2017 | 1.113 | 1.398 | 0.891 | 1.013 | 1.051 |
Note: effch: efficiency change index; techch: technical change index; pech: pure technical efficiency change index; sech: scale efficiency change index; TFP: total factor production.
Table 4.
The TFP of the rural distribution industry in different regions of China.
| Year | Eastern Region | Central Region | Western Region | Northeastern Region |
|---|---|---|---|---|
| 2009/2008 | 0.923 | 0.918 | 0.800 | 1.194 |
| 2010/2009 | 1.000 | 0.979 | 0.932 | 0.776 |
| 2011/2010 | 1.363 | 1.461 | 1.294 | 1.323 |
| 2012/2011 | 1.124 | 0.831 | 1.092 | 1.057 |
| 2013/2012 | 0.935 | 1.131 | 0.891 | 1.287 |
| 2014/2013 | 1.303 | 1.045 | 1.126 | 1.180 |
| 2015/2014 | 1.024 | 1.258 | 1.331 | 0.910 |
| 2016/2015 | 0.849 | 0.985 | 1.018 | 1.040 |
| 2017/2016 | 1.085 | 1.039 | 0.877 | 1.050 |
| 2018/2017 | 1.167 | 1.072 | 1.104 | 1.191 |
Table 5.
Descriptive statistics of the original data for the influencing factors.
| Statistic | TFP | IS (%) | UR (%) | IR (10,000 Subscribers) | TF (10,000 km) |
|---|---|---|---|---|---|
| Mean | 1.12 | 44.30 | 55.36 | 168.78 | 2.96 |
| Median | 1.03 | 42.48 | 53.04 | 89.64 | 2.64 |
| Maximum | 4.33 | 80.56 | 89.61 | 1152.90 | 8.88 |
| Minimum | 0.22 | 28.62 | 22.30 | 0.40 | 0.16 |
| S.D. | 0.48 | 9.34 | 13.82 | 194.40 | 2.09 |
| Sum | 314.84 | 12,372.46 | 15,227.54 | 45,324.65 | 819.63 |
| Observations | 341.00 | 341.00 | 341.000 | 341.00 | 341.00 |
| Sections | 31.00 | 31.00 | 31.00 | 31.00 | 31.00 |
Note: TFP: total factor production; IS: industrial structure; UR: urbanization rate; IR: informatization rate; TF: transportation facilities.
Table 6.
Regression results of the panel data model.
| Variable | China | Eastern | Central | Western | Northeastern | |||||
|---|---|---|---|---|---|---|---|---|---|---|
| Coefficient | T Statistic | Coefficient | T Statistic | Coefficient | T Statistic | Coefficient | T Statistic | Coefficient | T Statistic | |
| UR | 0.0095 *** | 6.4533 | 0.0090 *** | 3.7311 | 0.0111 *** | 2.9478 | 0.0206 *** | 13.3590 | 0.0197 *** | 11.2790 |
| TF | 0.2015 *** | 11.5958 | 0.4111 *** | 7.5679 | 0.1850 *** | 6.8258 | 0.0361 ** | 2.1336 | 0.3442 *** | 6.0673 |
| IS | −0.6808 *** | −5.3265 | −0.9390 *** | −2.7650 | −0.5918 *** | −3.0283 | −0.8707 *** | −3.3638 | −0.3008 ** | −10.5460 |
| IR | 1.3394 *** | 6.3619 | 0.8289 ** | 2.1897 | 1.2155 * | 1.8848 | 1.9262 *** | 6.8848 | 1.6740 *** | 4.0521 |
| Adjust R2 | 0.5597 | 0.4151 | 0.5530 | 0.4459 | 0.4658 | |||||
Note: */**/*** Statistically significant at the 10%/5%/1% level, respectively.
Publisher’s Note: MDPI stays neutral with regard to jurisdictional claims in published maps and institutional affiliations. |
© 2021 by the authors. Licensee MDPI, Basel, Switzerland. This article is an open access article distributed under the terms and conditions of the Creative Commons Attribution (CC BY) license (https://creativecommons.org/licenses/by/4.0/).
Share and Cite
MDPI and ACS Style
Ding, C.; Zhang, R. The Measurement and Influencing Factors of Total Factor Productivity in the Chinese Rural Distribution Industry. Sustainability 2021, 13, 8581. https://0-doi-org.brum.beds.ac.uk/10.3390/su13158581
AMA Style
Ding C, Zhang R. The Measurement and Influencing Factors of Total Factor Productivity in the Chinese Rural Distribution Industry. Sustainability. 2021; 13(15):8581. https://0-doi-org.brum.beds.ac.uk/10.3390/su13158581
Chicago/Turabian StyleDing, Chaoxun, and Ruidan Zhang. 2021. "The Measurement and Influencing Factors of Total Factor Productivity in the Chinese Rural Distribution Industry" Sustainability 13, no. 15: 8581. https://0-doi-org.brum.beds.ac.uk/10.3390/su13158581
Note that from the first issue of 2016, this journal uses article numbers instead of page numbers. See further details here.