
Environmental Assessment of University Campuses: The Case of the University of Navarra in Pamplona (Spain)


1
Department of Architecture, University of the Basque Country, 20018 Donostia-San Sebastián, Spain
2
Department of Chemical and Environmental Engineering, Faculty of Engineering of Gipuzkoa, University of the Basque Country, 20018 Donostia-San Sebastián, Spain
*
Authors to whom correspondence should be addressed.
Sustainability 2021, 13(15), 8588; https://0-doi-org.brum.beds.ac.uk/10.3390/su13158588
Submission received: 30 June 2021
/
Revised: 20 July 2021
/
Accepted: 30 July 2021
/
Published: 1 August 2021
(This article belongs to the Special Issue Sustainable Urban Planning Strategies for Addressing Climate Change)
Abstract
:Current European environmental sustainability standards call for achieving a reduction in energy consumption and CO2 emissions for a horizon set in the year 2050. It has been verified that buildings and cities have a higher incidence in this regard. It is necessary to have tools for initial assessment that can quickly analyse whether the improvement scenarios put forward by different organisations and governments will be able to meet the goals set at European level. Universities are an important factor for the intended change and therefore offer an excellent environment for testing such tools. A case study focusing on a university in northern Spain is presented, through an evaluation tool using 3D models including life-cycle assessment. Different reform scenarios are evaluated for two key years, 2030 and 2050. The novelty lies in considering, not only the impact of the operational phase but also the impact of the different stages of the life cycle and processes, obtaining an impact value closer to reality. The results indicate that, even with major retrofitting and adaptation efforts, the European targets are difficult to achieve by 2050. Moreover, solutions such as biomass help to achieve greenhouse gas reductions but not to improve energy efficiency.
1. Introduction
Clear environmental degradation and the fight against climate change have created a need to promote successful solutions. The International Energy Agency has indicated that, in 2016, 71% of greenhouse gas (GHG) emissions and 60% of resource consumption were associated with urban areas [1]. The United Nations (UN) projects that the global population will reach 8.5 billion by 2030, with cities expected to house 60% of that total [2], entailing an estimated increase of 1.2 million km2 in urban land coverage in 18 years; urban surface area will have tripled since the year 2000 [3]. Also bearing in mind that the world’s urbanisation rate has been statistically estimated to reach 75% in 2050 [4], the determination of action lines that pursue urban solutions resilient to climate change by detecting vulnerable areas is deemed to be of vital interest. Furthermore, the UN has highlighted that, since 2016, more than half of the world’s population has been exposed to air pollution levels at least 2.5 times higher than the safe standard [5]. The 2020 report of the Economist Network for the UN’s 75th anniversary confirms the need to act on a better understanding of biodiversity and climate, defining it as one of the current megatrends. It also highlights that the accelerated transition from fossil fuels to renewable and clean energy sources must be a crucial part of the climate action agenda in all countries [6]. In addition, the European Commission (EC) is now promoting economical nature-based solutions (NBS) [7] and renewable energy insertion in cities through Horizon Europe, which defines low-carbon and green and energy transition as one of the main keys to Europe’s future prosperity and resilience [8].
The EC has proposed achieving the general objective of reducing GHG emissions by 80% by 2050. In the “Roadmap for Moving to a Competitive Low-Carbon Economy in 2050”, it is suggested that the most profitable way would be a reduction in the order of 20% every ten years. Starting in the year 2020, emissions would have to be reduced by 20% to 40% in 2030 and so on, until achieving the goal proposed by 2050. Innovation and technological development in the areas of renewable energies, land-use management, and urban planning and transportation have been identified as drivers of the change toward that low-carbon economy [9]. To accomplish these goals, the inclusion of the sustainability concept in organisations’ practices and missions is of fundamental interest worldwide. The responsibility of universities in this regard must particularly be mentioned, as their ability to influence has two facets. On the one hand, the students will be the leaders of the future [10,11] and, on the other hand, university campuses can be considered as ‘small cities’, so their environmental impact must be ascertained and reduced [10,12,13,14,15,16,17,18]. The activity of such campuses is complex; depending on their size and population, they can eventually consume large amounts of energy, generating considerable waste and emissions [19,20]. These aspects must be assessed to propose scenarios which enable the goals set by the EC to be achieved.
Current focuses for environmental assessment are mainly dealt with from two standpoints, one qualitative or semi-quantitative which emphasises the environmental impact caused by direct consumption of resources without considering ‘preliminary’ activities, and the focus based on life-cycle assessment (LCA), which generates complete inventories that take into account all associated processes [21]. LCA quantifies and evaluates the material and energy flows of a system [22]. According to the EC and the literature [23], it is the best method for assessing the environmental impact of any activity. The International Organization for Standardization (ISO) states that, in order to have a global summary of the environmental impact of the product, LCA must be carried out in four phases: (I) definition of the purpose and scope of the assessment (functional unit, quality criteria, system limitations, etc.), (II) life cycle inventory, (III) life cycle assessment, and (IV) interpretation [19]. To evaluate the impacts of buildings and cities with an LCA focus, various digital tools have been developed, among which we highlight the Neighbourhood Evaluation for Sustainable Territories (NEST) software [24]. It considers the impact of different stages of the life cycle associated to different processes of the urban environment, including transportation or public lighting. Thus, in comparison to other tools, NEST takes into account building energy but also energy transportation, energy water, energy public lighting, solid waste, and socioeconomic impacts of the building environment on the district or city studied [24,25]. It is worthy to underline that it is an agile and fast tool for carrying out analysis of the baseline scenario and the improvement hypotheses. In contrast to other tools, in NEST, the characteristics of the buildings have an important weight in the study. The components included in the district analysis are: (i) buildings, (ii) open spaces, (iii) buildings and open spaces operation (sanitary hot water, heating, ventilation, cooling, etc), (iv) end of life of the materials that compose the buildings and open spaces and (v) operational requirements for daily mobility [25]. Thus, it provides a full overview of the studied district or city impact.
Multiple studies analyse the uncertainty of LCA and the methods to be taken into account to assess it [26,27,28]. For instance, the Gouloutis study [26] mentions various methods have been proposed to quantify these uncertainties and their impact on the LCA output: scenario analysis, quantitative uncertainty analysis, and sensitivity analysis. It is also commented that different studies have shown that the service life calculation is governed by high uncertainty. In the case of NEST, it is shown that contrasting its results to a monitory real case [24] the monitoring results obtained higher values than the simulation with NEST, between 1–17% less. Nevertheless, this percentage vary depending on the data accuracy.
There is a clear need to continue research to build sustainable and resilient cities to thereby achieve the sustainable development goals set by the UN and the European objective of carbon neutrality in 2050. The first reduction milestone set for the year 2020 was not achieved in many cases; society, represented by young people, is demanding that steps be taken to ensure that the goals for 2050 can be accomplished. That is why important research and innovation projects have studied the implementation of renewable resources in the city [29,30,31]. For that purpose, this project studied the environmental impact of the Pamplona campus of the University of Navarra (UNAV) in northern Spain. Both its current state in 2020 and proposed scenarios for improvement, 2030 and 2050, are assessed. The aim is to evaluate if it is possible to accomplish the climate and energy objectives set by the European Union (EU) for 2030 and 2050 [9]. To this end, the study mainly centred the 2030 and 2050 improvement scenarios on the introduction of renewable energies (solar and biomass) and energy efficiency improvement in buildings through the renovation of façades and windows and the use of more efficient heating, ventilation, and air-conditioning (HVAC) systems, evaluating the environmental impact of each scenario proposed. Thanks to tools such as NEST, it is enabled to study multiple scenarios with little information in a very short time, taking into account LCA. The best option can be chosen quickly to evaluate whether the proposed scenario and which implementation variables will enable achievement of the standards and reductions established by the EU. In addition, the fact to include other life cycle phases than only the operational one provide more realistic environmental impact data. As a result of the study, the parameters that would have to be adjusted to accomplish those goals were established in NEST; but those values may be beyond the possibilities for effective action by the university according to current policies. Such tools enable prediction of whether European policies have an appropriate focus and whether organisations such as universities, will have to reorient their policies or are on the right track to the year 2050.
2. Materials and Methods
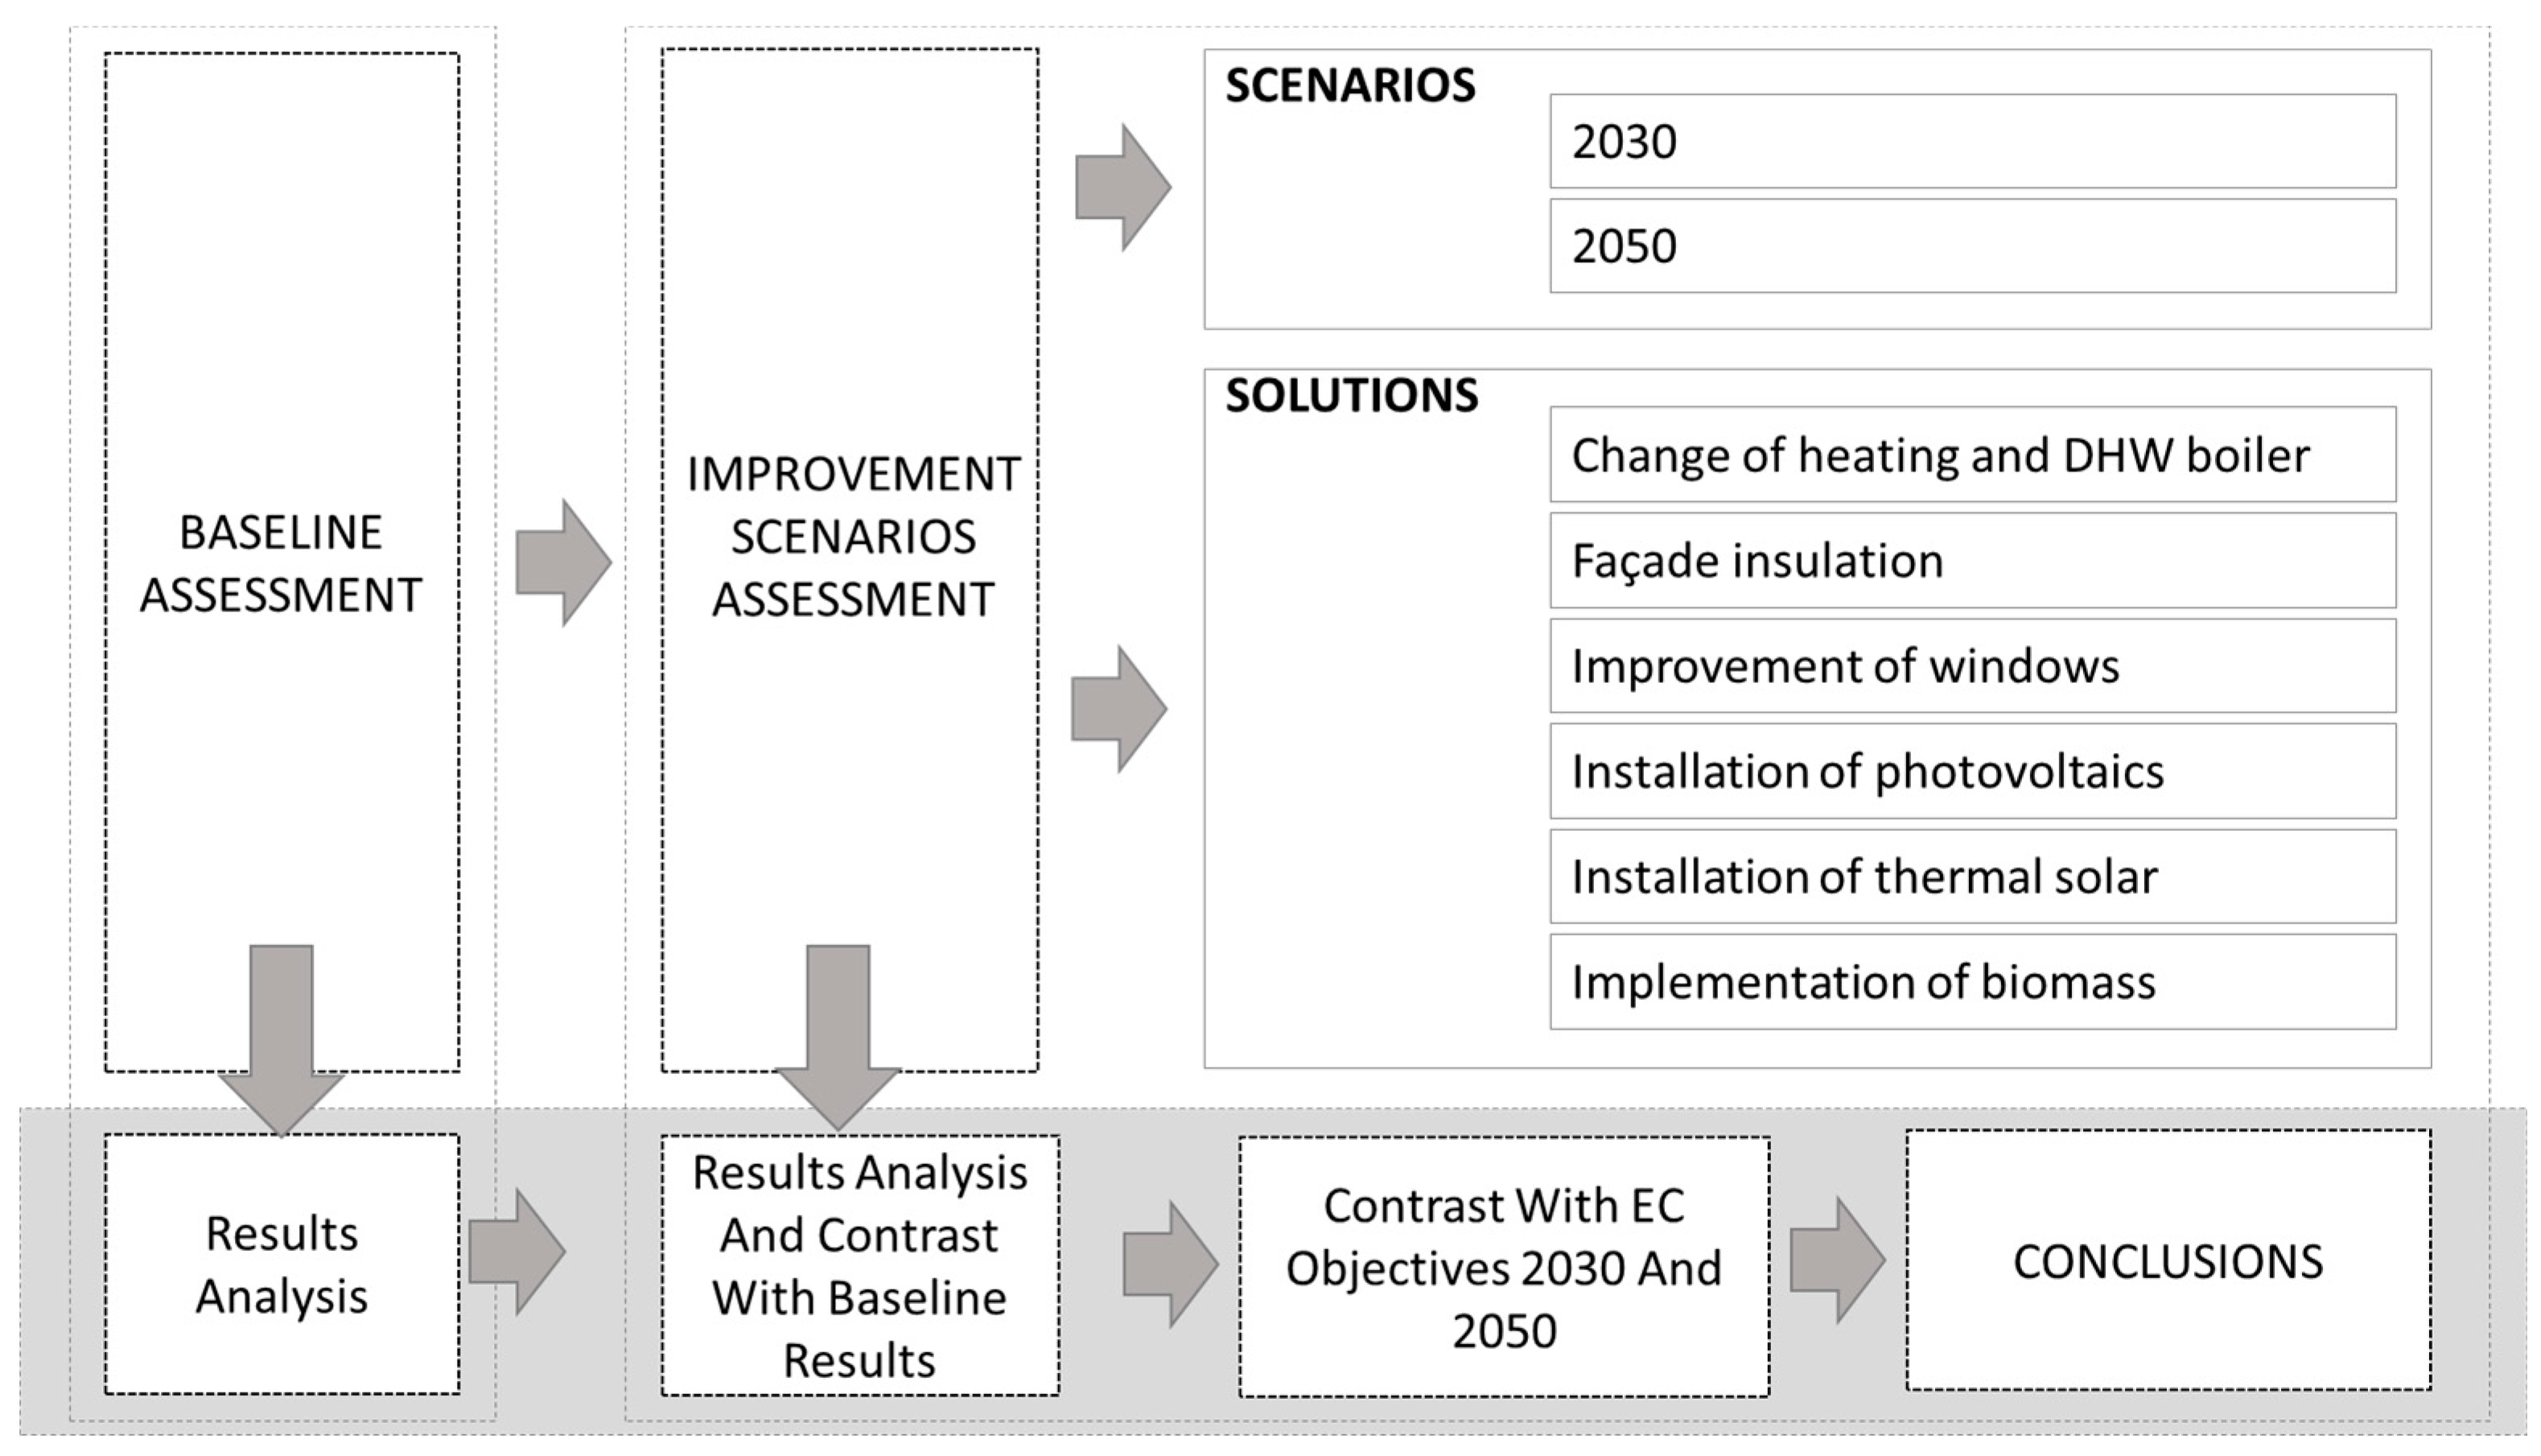
The study is structured in two phases. Firstly, the current environmental impact of the university will be analysed. Secondly, improvement scenarios will be studied for the two key dates in the European directives, 2030 and 2050. The improvement scenarios will be based on the implementation of active systems, such as the changed heat production system and domestic hot water (DHW) by a more ecological and/or efficient boiler. It also will count on passive systems such as façade insulation and change of windows to improve the energy efficiency of the buildings. To achieve the renewable energy production EU objective, the introduction of renewable energy sources (photovoltaic, thermal solar, and biomass) will be proposed and evaluated.
This point will be divided into four sections. First, the case study will be presented, followed by a description of the evaluation tool used. Then, the baseline scenario will be presented and, finally, the improvement scenarios to assess will be described. The workflow of the study is presented in Figure 1.
2.1. The University Campus: UNAV in Pamplona.
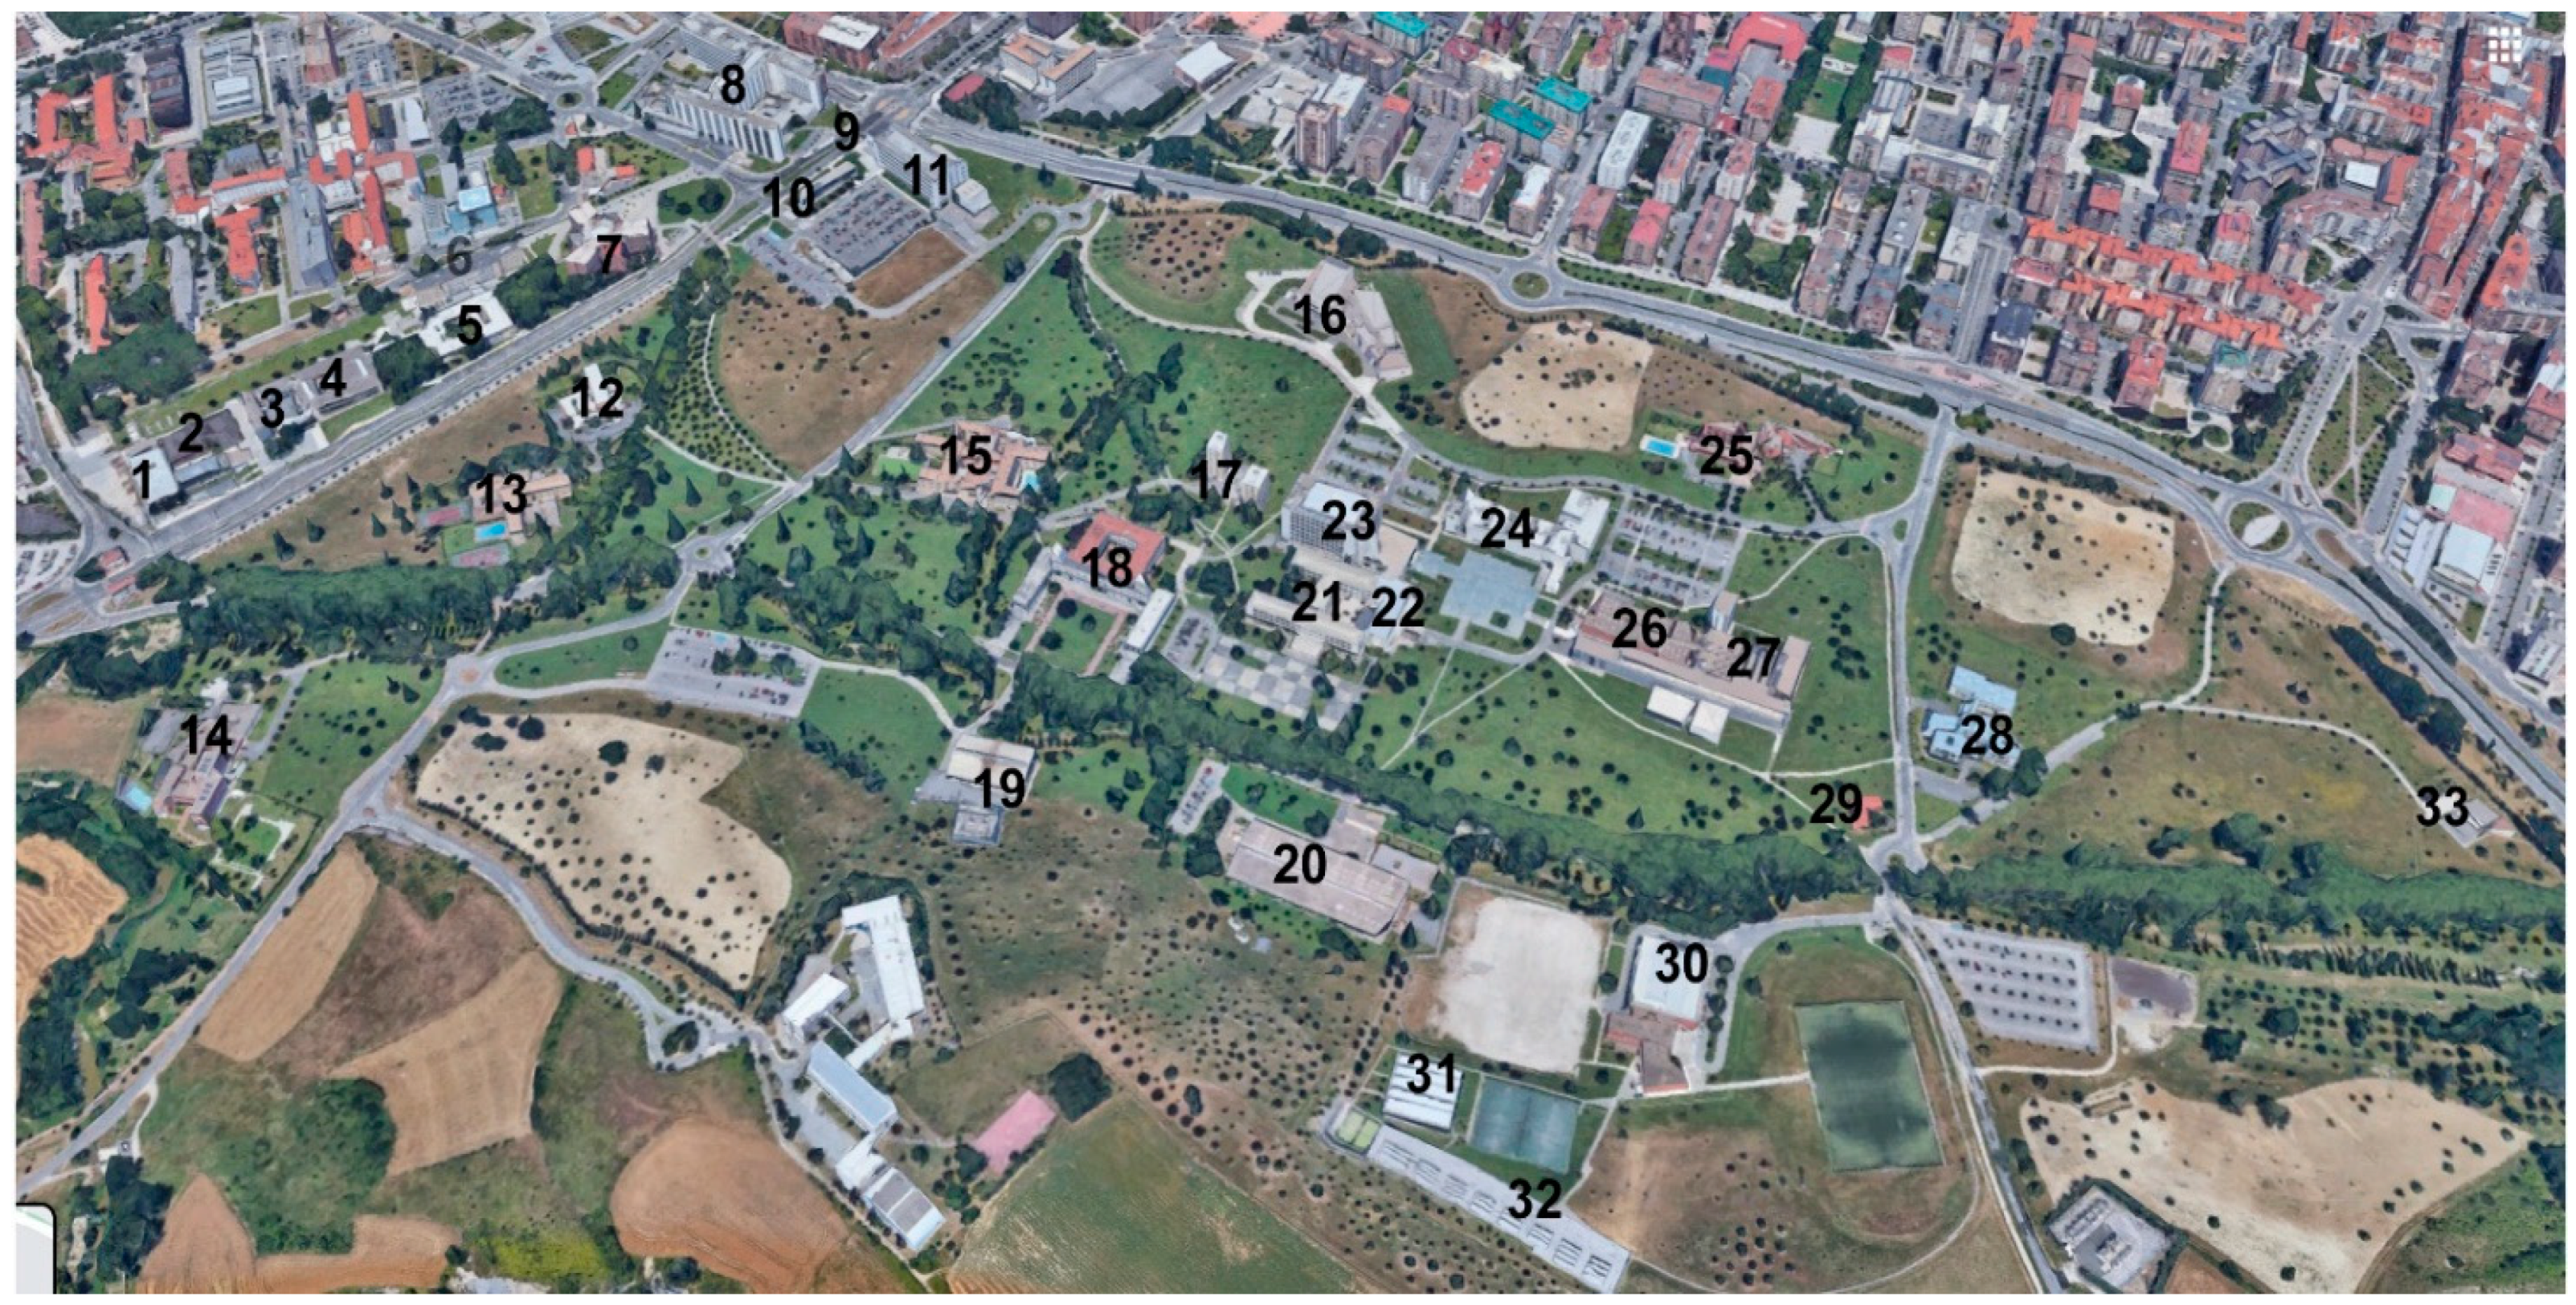
UNAV is a private university located on the outskirts of the city of Pamplona. It encompasses an area of around 400,000 m2, on which the various buildings comprising this university complex are situated [32,33]. Due to its location far from the urban core of the city of Pamplona, connections on foot are not very convenient. To reduce mobility via automobiles, it therefore counts on a very considerable network of bicycle routes. Also, the city’s link to the campus via the public bus system is very well developed. At present, the campus counts a total of 31 buildings housing different activities: educational, administrative, sports, residential, cultural, health and offices (Figure 2).
The group of buildings is heterogeneous concerning building systems and style as well as use and year of construction. This is because the university campus has grown since it was founded in 1952, adapting its new constructions to fit new needs that have arisen.
2.2. NEST Tool Evaluation
The campus was evaluated using the NEST tool, which functions as a plug-in via 3D Sketchup modeling software [19]. The campus was modeled in 3D and all the information needed to simulate the baseline scenario (2020) and the proposed improvement scenarios (2030 and 2050) was entered. NEST is one of the first tools that evaluates the environmental performance of different elements (buildings, transportation, lighting, etc) of a new or renovated urban environment from a life-cycle perspective. Few tools evaluate all the life-cycle stages described and defined by ISO Standard 14.040. Other tools focus only on some stages, such as, for example, the production phase and the operational energy use stage. But NEST enables evaluation of a wide range of stages defined by EN 15.978, e.g., production phase (A1-3), transport (A4), on-site processes (A5), maintenance (B2), replacement (B4), operational energy use (B6), operational water use (B7) and end-of-life phase (C1-4) [19,25]. The information required by NEST to make the evaluation is grouped into four main blocks. First is a general block, after which data on the buildings is entered; third, the data on infrastructures, and finally the mobility data. The main information to be entered into the tool is listed below:
- (a)
- In the General section:
- Population (campus users);
- City;
- Climate zone;
- Surface areas by use.
- (b)
- In the Buildings section:
- Building category (offices, education, dwelling (residence or collective), etc);
- State of the building (existing or new);
- Year of construction;
- Construction system (only in new buildings - in all cases was considered indifferent);
- Vegetation coverage (yes/no and surface area);
- No. of floors;
- Average floor height;
- Glazing %;
- Energy rating;
- Heating system;
- Cooling system (gas boiler, and gas condensing boiler, biomass, heat pump, etc);
- Air-conditioning system;
- Photovoltaic and thermal solar energy (yes/no, surface area, losses, panel type, orientation, inclination).
- (c)
- In the Infrastructures section:
- Lighting type (high-pressure vapour, LED, fluorescent, etc);
- Size of treatment plant x no. of inhabitants.
- (d)
- In the Mobility section:
- Mode of transport used by campus users (car, tram, train, bus, bicycle, pedestrian (%)).
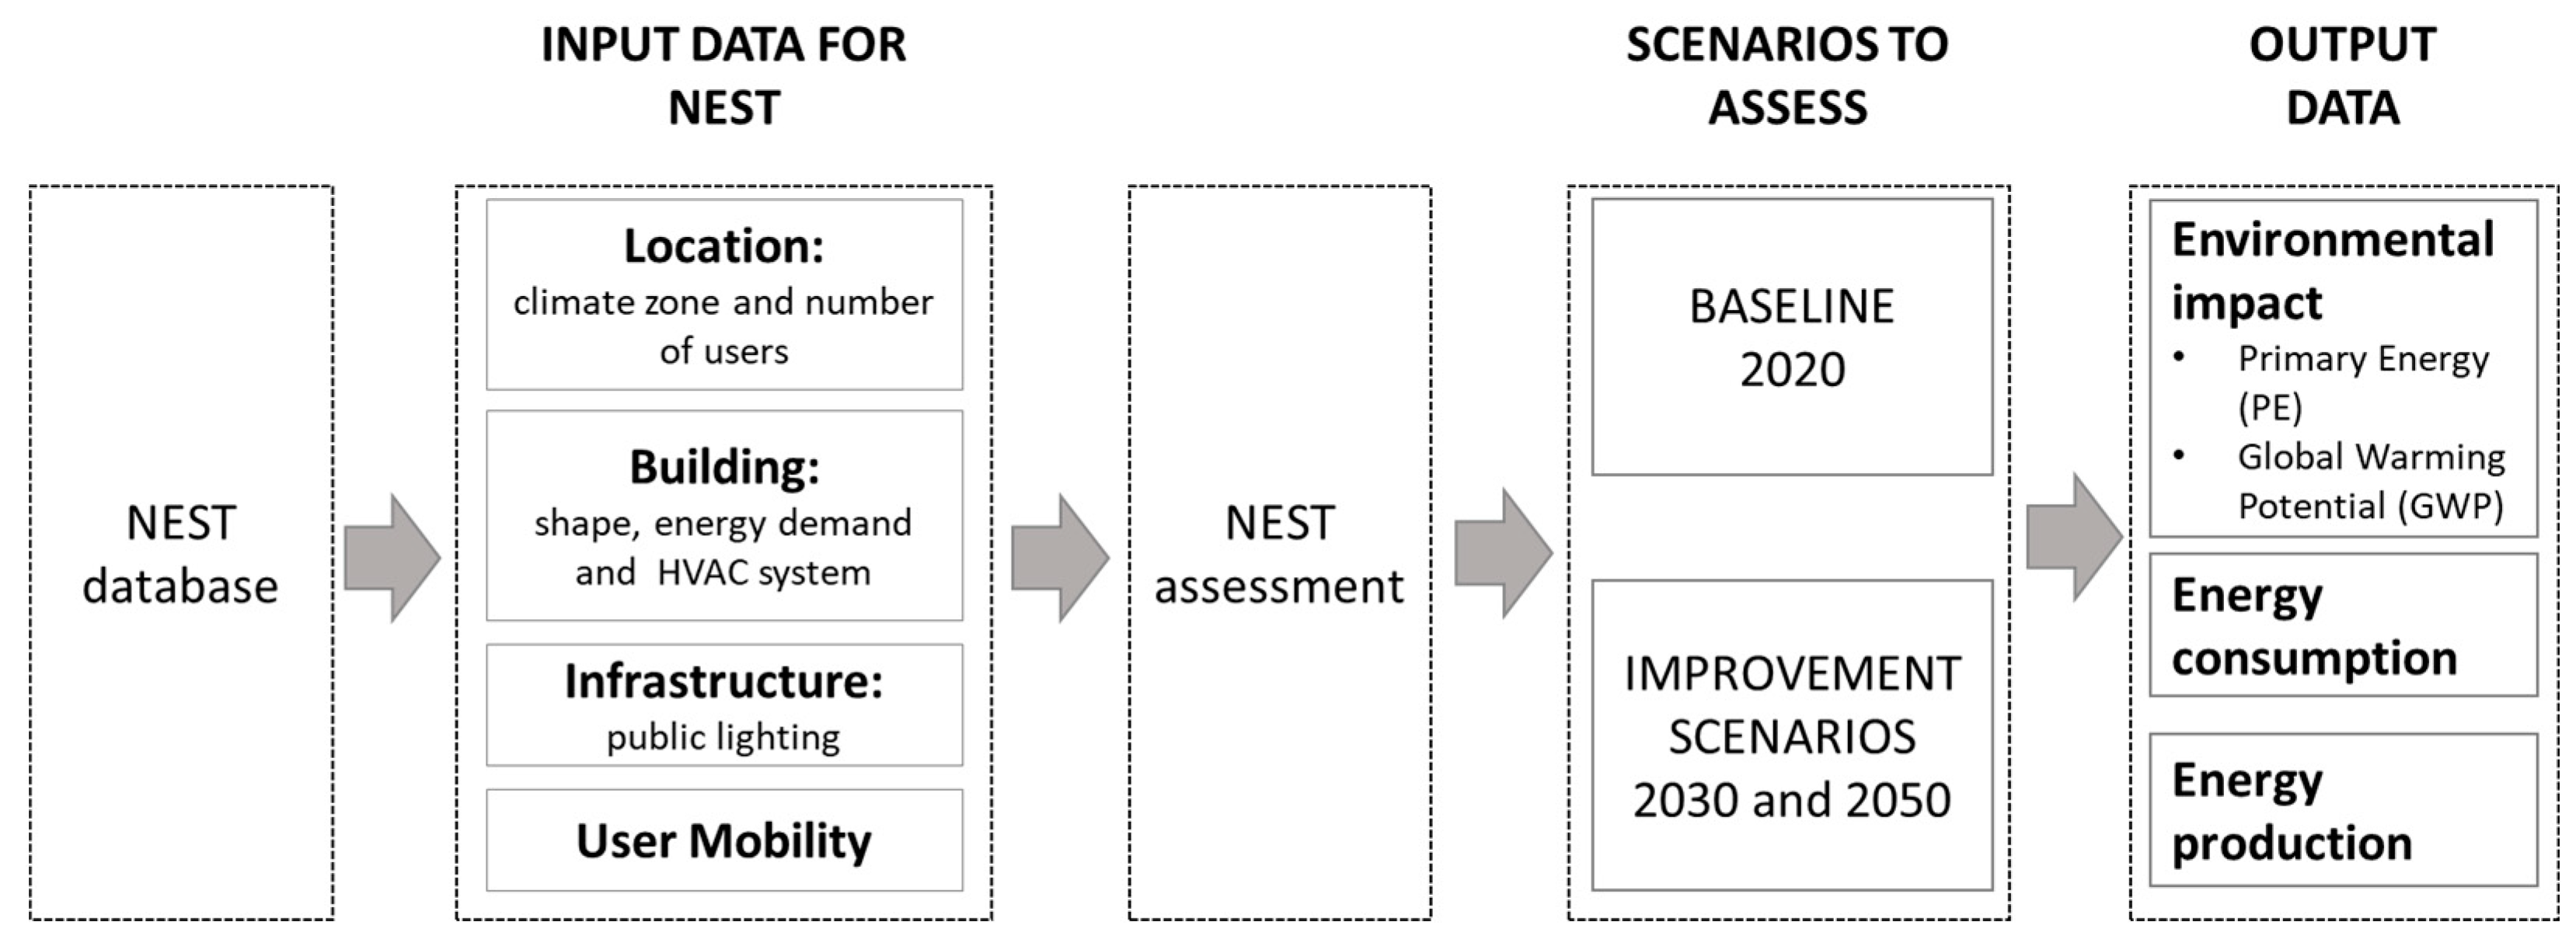
The Leon´s study [19], explained in detail the analysis system applied by NEST, the values it takes into account to make calculations, and the main results obtained. Due to the difficulty in finding monitored data on energy consumption or demand, to calculate the buildings’ impact, NEST offers the possibility of automatically calculating heating and cooling demand, appliances, and lighting energy, based on energy rating, building use, and climate zone. In addition, it is highlighted that NEST makes the evaluation considering a useful life of 50 years for buildings and 30 years for infrastructures (renovations can be included if necessary). The elements included in the analysis are centred on (i) buildings, (ii) open spaces, (iii) operation of buildings and open spaces (domestic hot water, heating, ventilation, cooling, etc), (iv) the end of life of materials that compose the buildings and open spaces, and (v) operational requirements for daily mobility. To better understand the NEST working methodology, a diagram is presented in Figure 3.
2.3. Baseline
The 3D model of the baseline scenario corresponds to the current situation of the campus for the year 2020. Besides producing the 3D digital geometric model of the campus, it must be fed with the information required by NEST to make the evaluations. That information was obtained through various resources. The annual reports published by the university were consulted [34,35]; information was also gathered directly during field visits and the research team’s own databases were used. For graphic definition of the 3D model, Google Maps was also consulted [36]. Although not strictly necessary, to make accurate measurements of the buildings, a 3D laser scan of the campus was used. It enabled 360° images of the campus to be obtained in those areas where Google Maps was not capable to capture information. The point cloud joined to the 360° image allows in-office corroboration at any time of the information on the buildings’ volumes and geometry.
The considerations and hypotheses taken into account in the 3D simulation model are the following:
- To calculate the number of campus users, the figures from the reports on the 2018–2019 and 2019–2020 academic years were taken into account [34,35]; they indicate the total number of professionals per campus and the total number of students at the University of Navarra, considering all the campuses;
- The surface areas indicated in NEST were calculated manually based on the CAD plan introduced into the 3D model. That plan was produced based on the maps published by the region of Navarre [37] and was validated after the laser scan of the campus was done;
- The 3D modelling of the buildings corresponds to a simplified version of their volumes, highlighting the most representative heights of each building;
- To model the buildings the aim was to use existing plane measurements (dimensioned sections, elevations, and floor plans). To model cases in which it was not possible to obtain graphic documentation, a laser scan of the campus was done and the cadastral database was used [38]. That information was compared and corroborated with the in-situ campus visits and the information obtained using Google Earth and Google Maps [36]. Bearing in mind that NEST allows effective simulations to be done using simplified 3D models, to determine the floor heights the average height of the entire building was considered (total height divided by number of floors);
- For the building system of the new buildings, what appears by default in NEST is considered, i.e., ‘indifferent’;
- For the building’s glazed surfaces, NEST proposes, by default, a percentage for each building typology. If no specific data is available, that percentage can be used. In this case, more accurate data was obtained by the in-situ visits and laser scan and with the help of Google Earth and Google Maps was considered [32]. In most cases the percentage was extracted from that analysis;
- For the calculation process, taking into account NEST’s internal databases and hypotheses, the building built from 2013 on are considered new;
- In cases where it was not possible to obtain real energy consumption or where there is no energy rating for the building, it was considered that the buildings built, between 1960 and 1990, had a G energy certification, between 1990 and 2000, an E, between 2000 and 2010, a D, between 2010 and 2015, a C, and, between 2015 and 2020, an A;
- The year of construction was obtained from the cadastral database [38] or through documentation published by the university;
- There are no figures regarding the solar panels on campus buildings, neither the number nor the type or size, let alone the respective characteristics. In the absence of that information, at least for modelling the panels in NEST, Google Earth was used as a reference in order to see which buildings have panels and to determine the kind of panel, its approximate size and inclination, and its orientation. That information was corroborated during the visits and after the 3D laser scan done at the campus. As the characteristics of the panel losses are unknown, it was considered that they do have losses and that the ducts are insulated in the case of thermal solar;
- When there is no general cooling system and some places only have autonomous equipment, it is considered that the building as a whole does not have cooling;
- To calculate the impact of external lighting, it was considered that there are 1000 external light points on the campus. Based on the study of Manzano et al. and the IDAE report [39,40,41], the baseline scenario is stand on the hypothesis that 100% of the light points have 156W high-pressure sodium-vapour (HPS) bulbs that are turned on for an average of 10.5 hours per day. In the case of the LED bulbs proposed in the improvement scenarios, it was considered that they are 58W;
- For the mobility information, the data from the 2019–2021 UNAV Mobility Plan was taken into account [42], thereby considering that 57% of students travel on foot, 7% by bicycle, 19% by car, or motorcycle and 17% by public transportation. In the case of professionals, 20% travel on foot, 2% by bicycle, 62% by car, and 16% by public transportation.
A summary of the most relevant information required to create the model is presented below, taking into account the characteristics of the campus and the other aspects mentioned above (Table 1).
2.4. Design of the Scenarios for Improvement and Reduction of the Campus’s Environmental Impact
Two improvement scenarios were considered, the first one in the year 2030 and the second in the year 2050. The choice was made taking into account the environmental goals proposed in local, regional, national, and European regulations [43,44,45,46,47,48] concerning the reduction of greenhouse gas (GHG) emissions, renewable energy (RE) production and energy efficiency improvement (EEI). In the case of the objectives set by the EU, the improvements to achieve for the years 2020, 2030, and 2050 are set regarding the situation in 1990. In this case study, the data corresponding to the campus in 1990 cannot be considered a consolidated basis from which to begin applying the improvements proposed by the EU. As mentioned above, UNAV was founded in 1952 and in 1990 was undergoing a major growth process. Several of the buildings now on the site were built after 1990; the latest constructions date to 2014 and, the most recent renovations, to 2019. So, it is not reasonable to use the 1990 data as the basis for reduction, as the natural growth of the campus in those early years would counter any reductions and hence distort any improvement data that might arise. European regulations do indeed establish 1990 as the base year; but that date is reasonable if minimally consolidated cities or environments are analysed. In any case, the European regulations establish linear reductions, especially after 2020. Thus, for example, in the reduction of GHGs, a 20% reduction is demanded from 1990 to 2020; but from 2020 until 2050, a 20% reduction is demanded every ten years until achieving 80%. This accordingly means that a 20% reduction must be ensured from 2020 to 2030, and a 60% reduction from 2020 to 2050. The campus’s current situation in 2020, therefore serves as the basis to be able to confirm whether the proposed improvements in the renovation scenarios designed in this study fulfil the climate and energy goals set from 2020 on for 2030 and 2050. The following table shows a summary of the objectives set by the EU and a calculation of the reductions that need to be obtained for the years 2030 and 2050, if the objectives from 1990 to 2020 would have been achieved, i.e., the minimums to achieve in any case for those time intervals (Table 2).
Taking into account these general research objectives centred on compliance with European directives, the improvements proposed in the renovation strategy to meet the EU requirements focusing on the 2050 horizon will be summarised next. The percentages recapitulate the intervention in the whole campus for the scenarios to analyse (2030 and 2050), starting from the 2020 baseline (Table 3).
The percentages in the summary result from the detailed study of each campus buildings, taking into account their year of construction, use, construction characteristics, and respective current installations (Appendix A). Depending on the number of buildings and the characteristics of each building with renovations envisaged for the years 2030 and 2050, it was possible to extract the summary of the percentage improvements that will be proposed. The passive improvements considered departing from the baseline scenario are: insulation of the exterior façade (F) and change of windows (W). Among the active strategies, it is proposed that the heating system type and DHW used in the buildings be replaced with a more efficient system. NEST allows calculation of improvements simulating the following systems which may be present on the campus: electric boiler (EB), natural gas (NG), gas condensing boiler (GC) biomass (B), and heat pump (HP). The strategy designed in this research aims to reduce natural gas and increase systems more likely to comply with the directives. Besides these active strategies, for the whole campus, the change of public lighting (PL) type from high-pressure sodium to LED is proposed. As for energy sources, the possibility of adding in-situ renewable energy production by installing photovoltaic and thermal solar panels and biomass will be studied.
3. Results and Discussion
Based on the three modelled scenarios (2020 baseline, 2030 and 2050), each simulation was carried out using the NEST tool. The results, which will be analysed in this project, are:
- Environmental impact, primary energy (PE) in MJ/year, differentiating between the impact due to production (A1-3), construction (A4-5), maintenance (B2), replacement (B4) and end-of-life (C1-4) stages, and the impact associated to the operational energy-use stage (B6);
- Global warming potential (GWP) in kgeqCO2/year, differentiating between the impact due to production (A1-3), construction (A4-5), maintenance (B2), replacement (B4) and end-of-life (C1-4) stages, and the impact associated to the operational energy-use stage (B6);
- Energy consumption (EC) in kWh/year, differentiating the type of energy source - electric, gas and/or biomass. Only consumption associated to the operational energy-use stage (B6) is considered;
- Energy production (EP) expressed in kWh/year, produced employing thermal solar and photovoltaic panels and biomass;
- Greenhouse gas (GHG) emissions in kgeqCO2/year, obtained by subtracting from total GWP the impact saved thanks to renewable energy production, which is considered without greenhouse gas emissions. This figure will be taken into account when the objectives set by the EU are revised.
First, the results of the different scenarios were analysed separately. Next, the results of the improvement scenarios were compared to the 2020 baseline scenario. Finally, they were compared to the objectives set by the EU presented in Table 2, to see whether or not the expectations were met. The results are expressed per year; the values for the phases A1-3, A4-5, B2, B4, and C1-4 are grouped in one single result called Production (P) by NEST. Likewise, in the tool, the B6 phase is equivalent to the Use (U) section.
3.1. Baseline Scenario
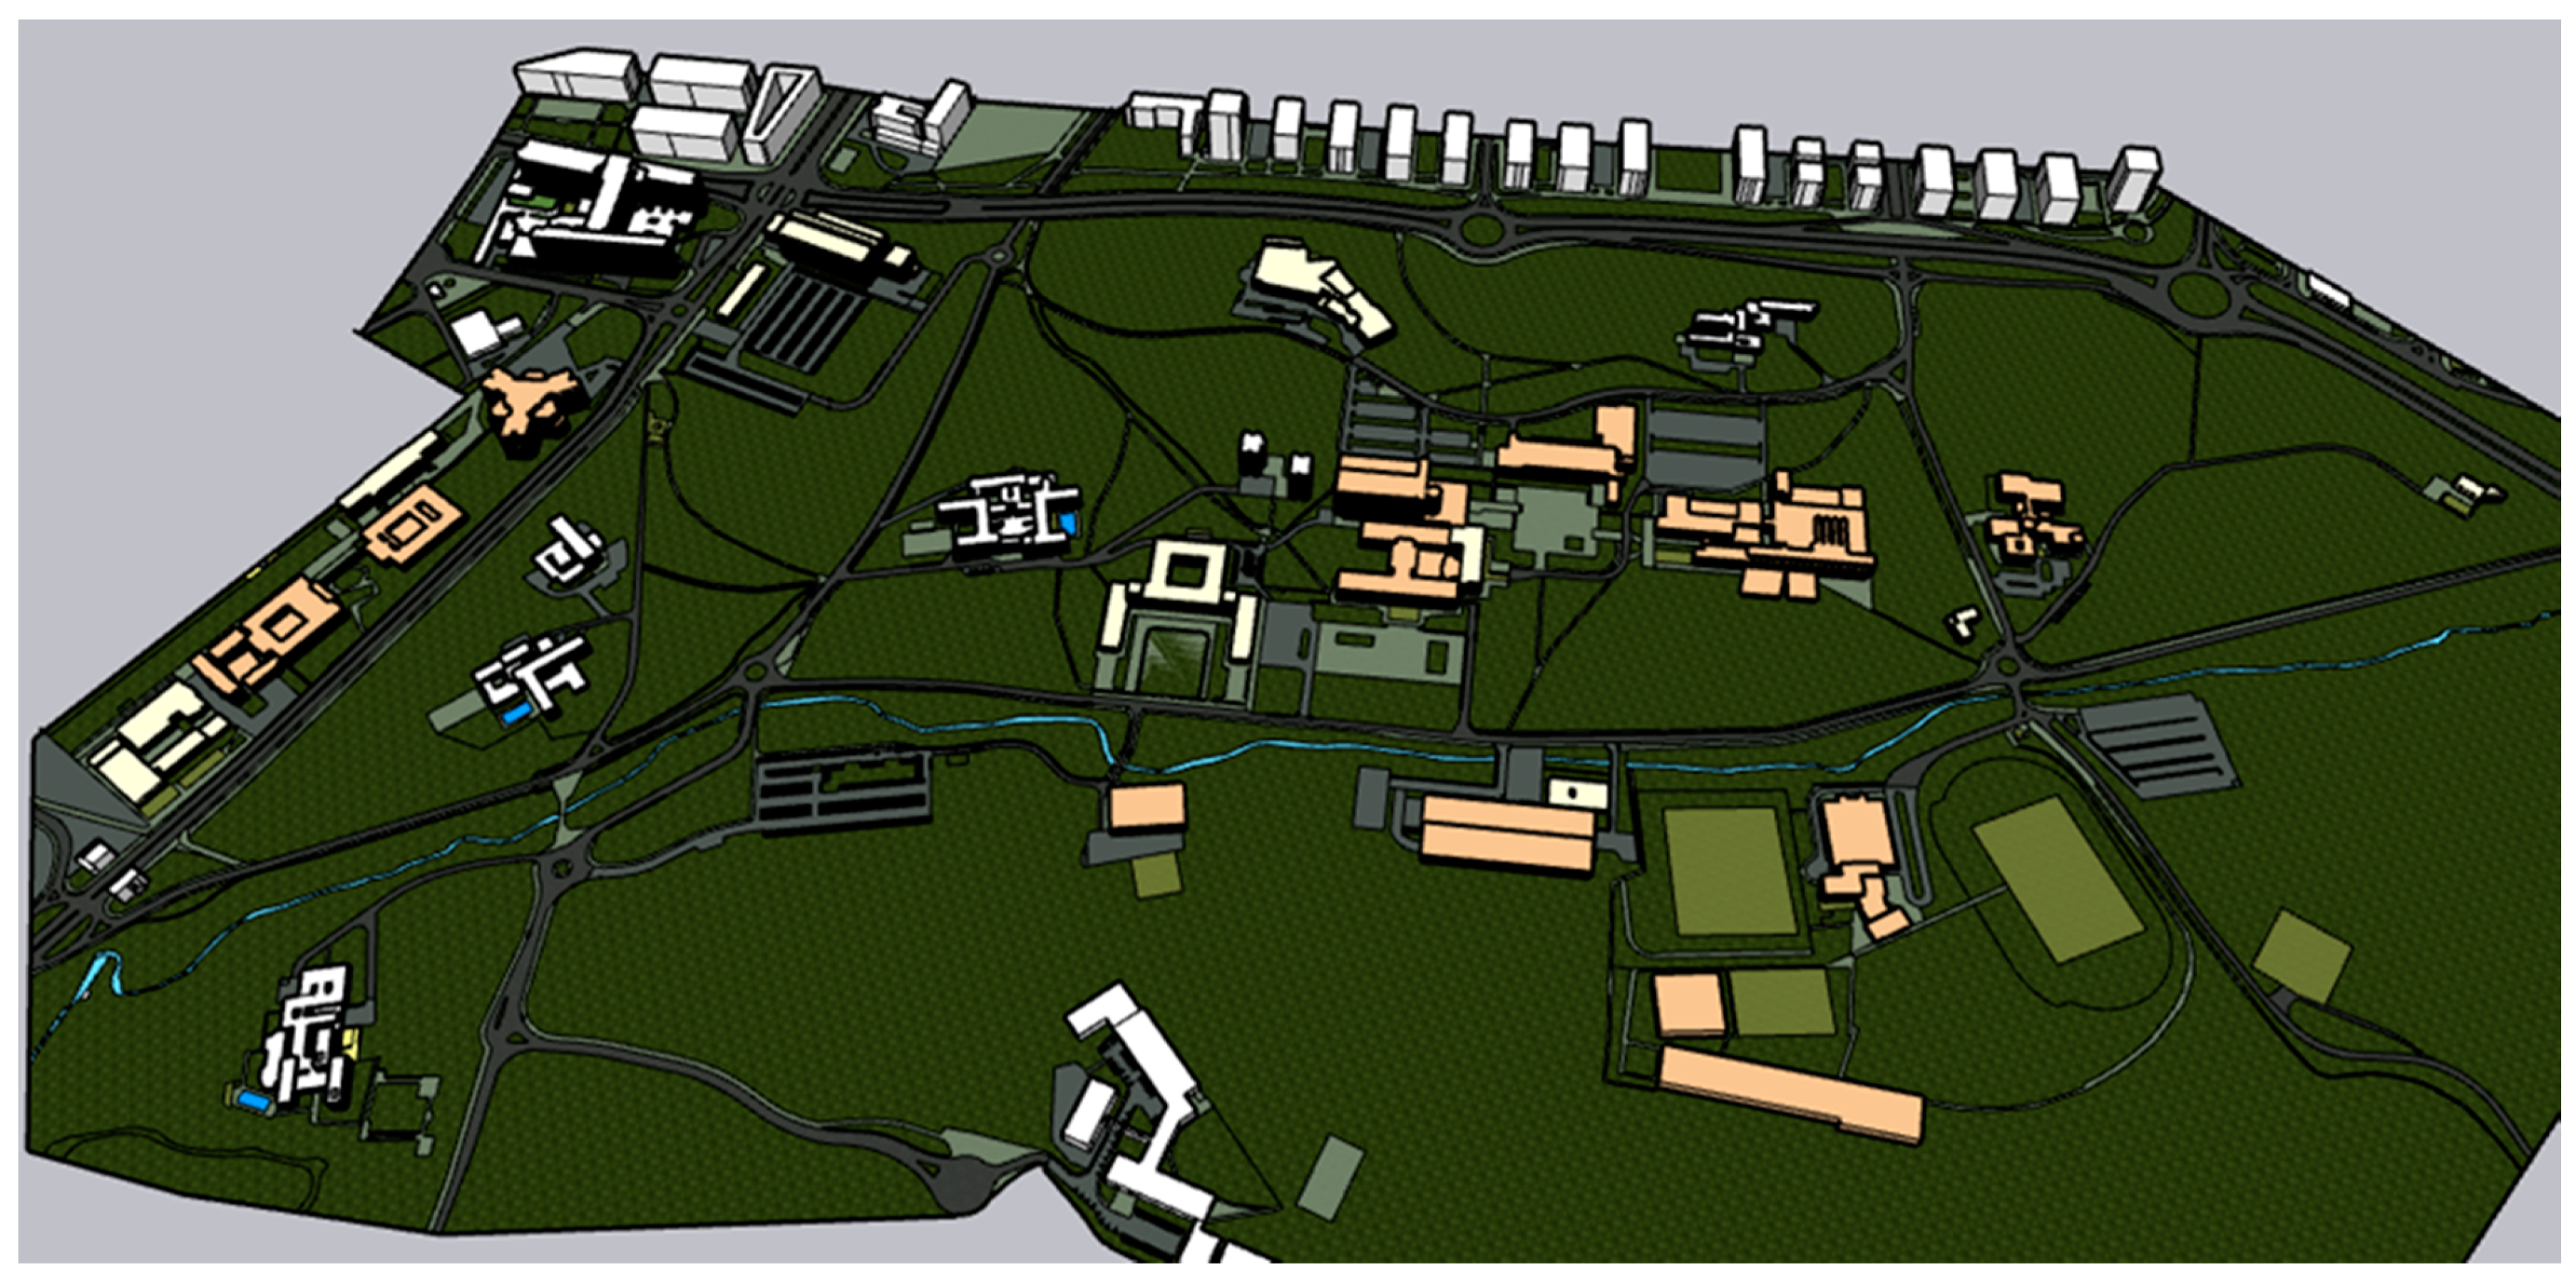
The 3D model with information generated in NEST is the basis for obtaining both the baseline results and the refurbished scenarios in 2030 and 2050 (Figure 4).
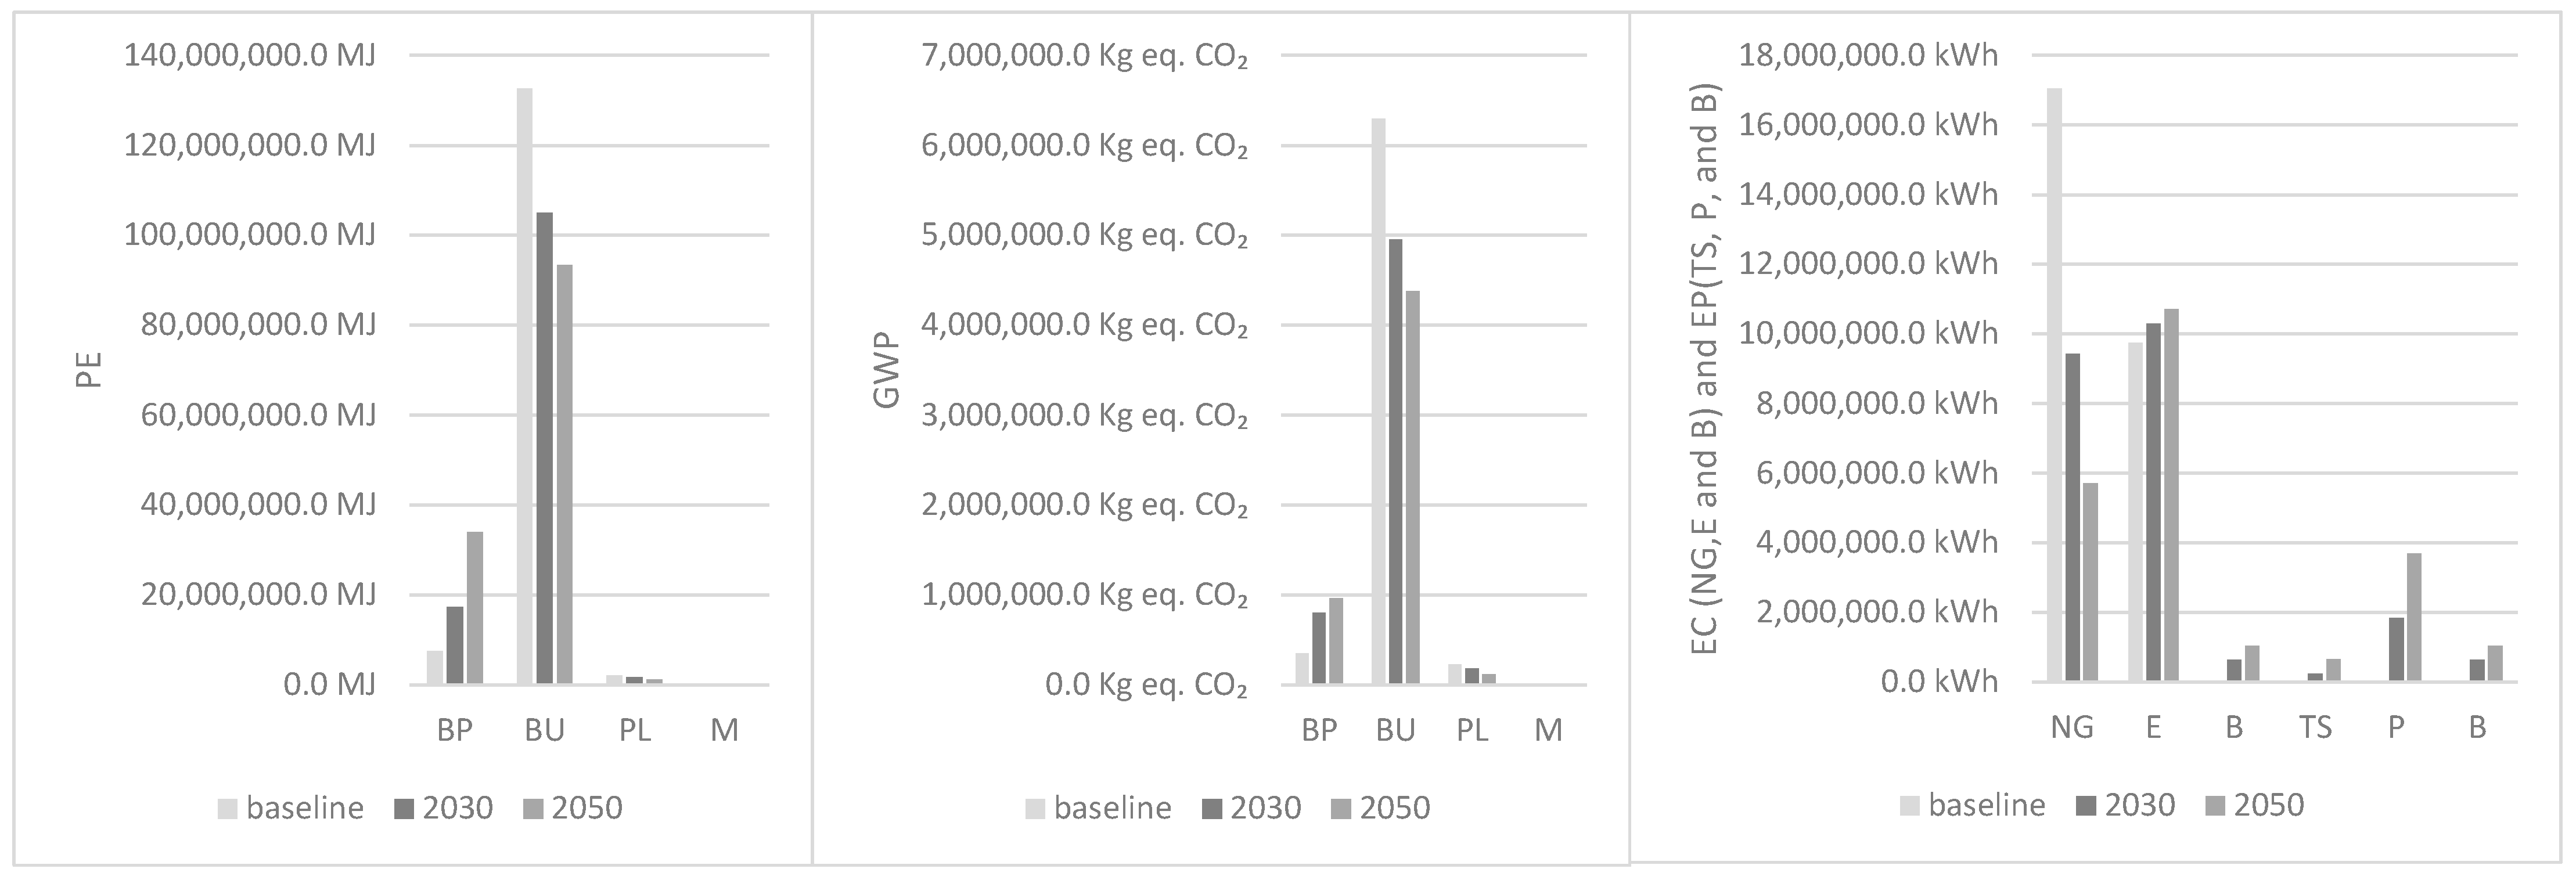
Table 4 presents the result obtained from the baseline scenario evaluation. It can be seen there that most of the impact is due to the buildings’ use phase (B6), for both PE and GWP. In the case of the buildings, it can also be observed that most consumption occurs in electricity, mainly due to equipment and lighting. Regarding mobility, in this study the impact can be considered negligible, not amounting to even 1% of the total. As for the production of renewable solar energy, it is equivalent to 8.2% of the campus’s total consumption. The main source of energy is gas (61.6% of total energy consumption), followed by electricity (36.4%). Furthermore, at present, the production and consumption of biomass are limited to the gardening building, which has a biomass stove to heat the space. Its consumption amounts to less than 0.1% of the campus total, whereby it can be considered non-existent.
3.2. Renovation Scenarios
The results obtained in the improvement scenarios proposed for the years 2030 and 2050 are presented in comparison to the baseline also in Table 4 and Figure 5.
As in the baseline scenario, most of the impact is due to building use (BU), with lighting and equipment producing the most impact. However, in so far as the improvements set out for each scenario are applied, the building production (BP) value increases. Compared to the 2020 baseline scenario, in the two improvement scenarios, the main energy source consumed is electric, with 50.6% of the total in 2030 and 61.4% in 2050. Gas consumption consequently falls by 17.3% in 2030 and 30.9% in 2050 compared to the 2020 baseline scenario. Also noteworthy is that in-situ renewable energy production increases in the two improvement scenarios, attaining production equivalent to 13.4% of the energy consumed in 2030 and 30.9% in 2050. To compare the scenarios, the total percentages of reduction of primary energy (PE), global-warming potential (GWP), and energy consumption (EC) are presented from the 2030 and 2050 improvement scenarios concerning the results obtained in the 2020 baseline (Figure 6). It shows that the total values of PE, GWP and EC fall as the improvements are implemented.
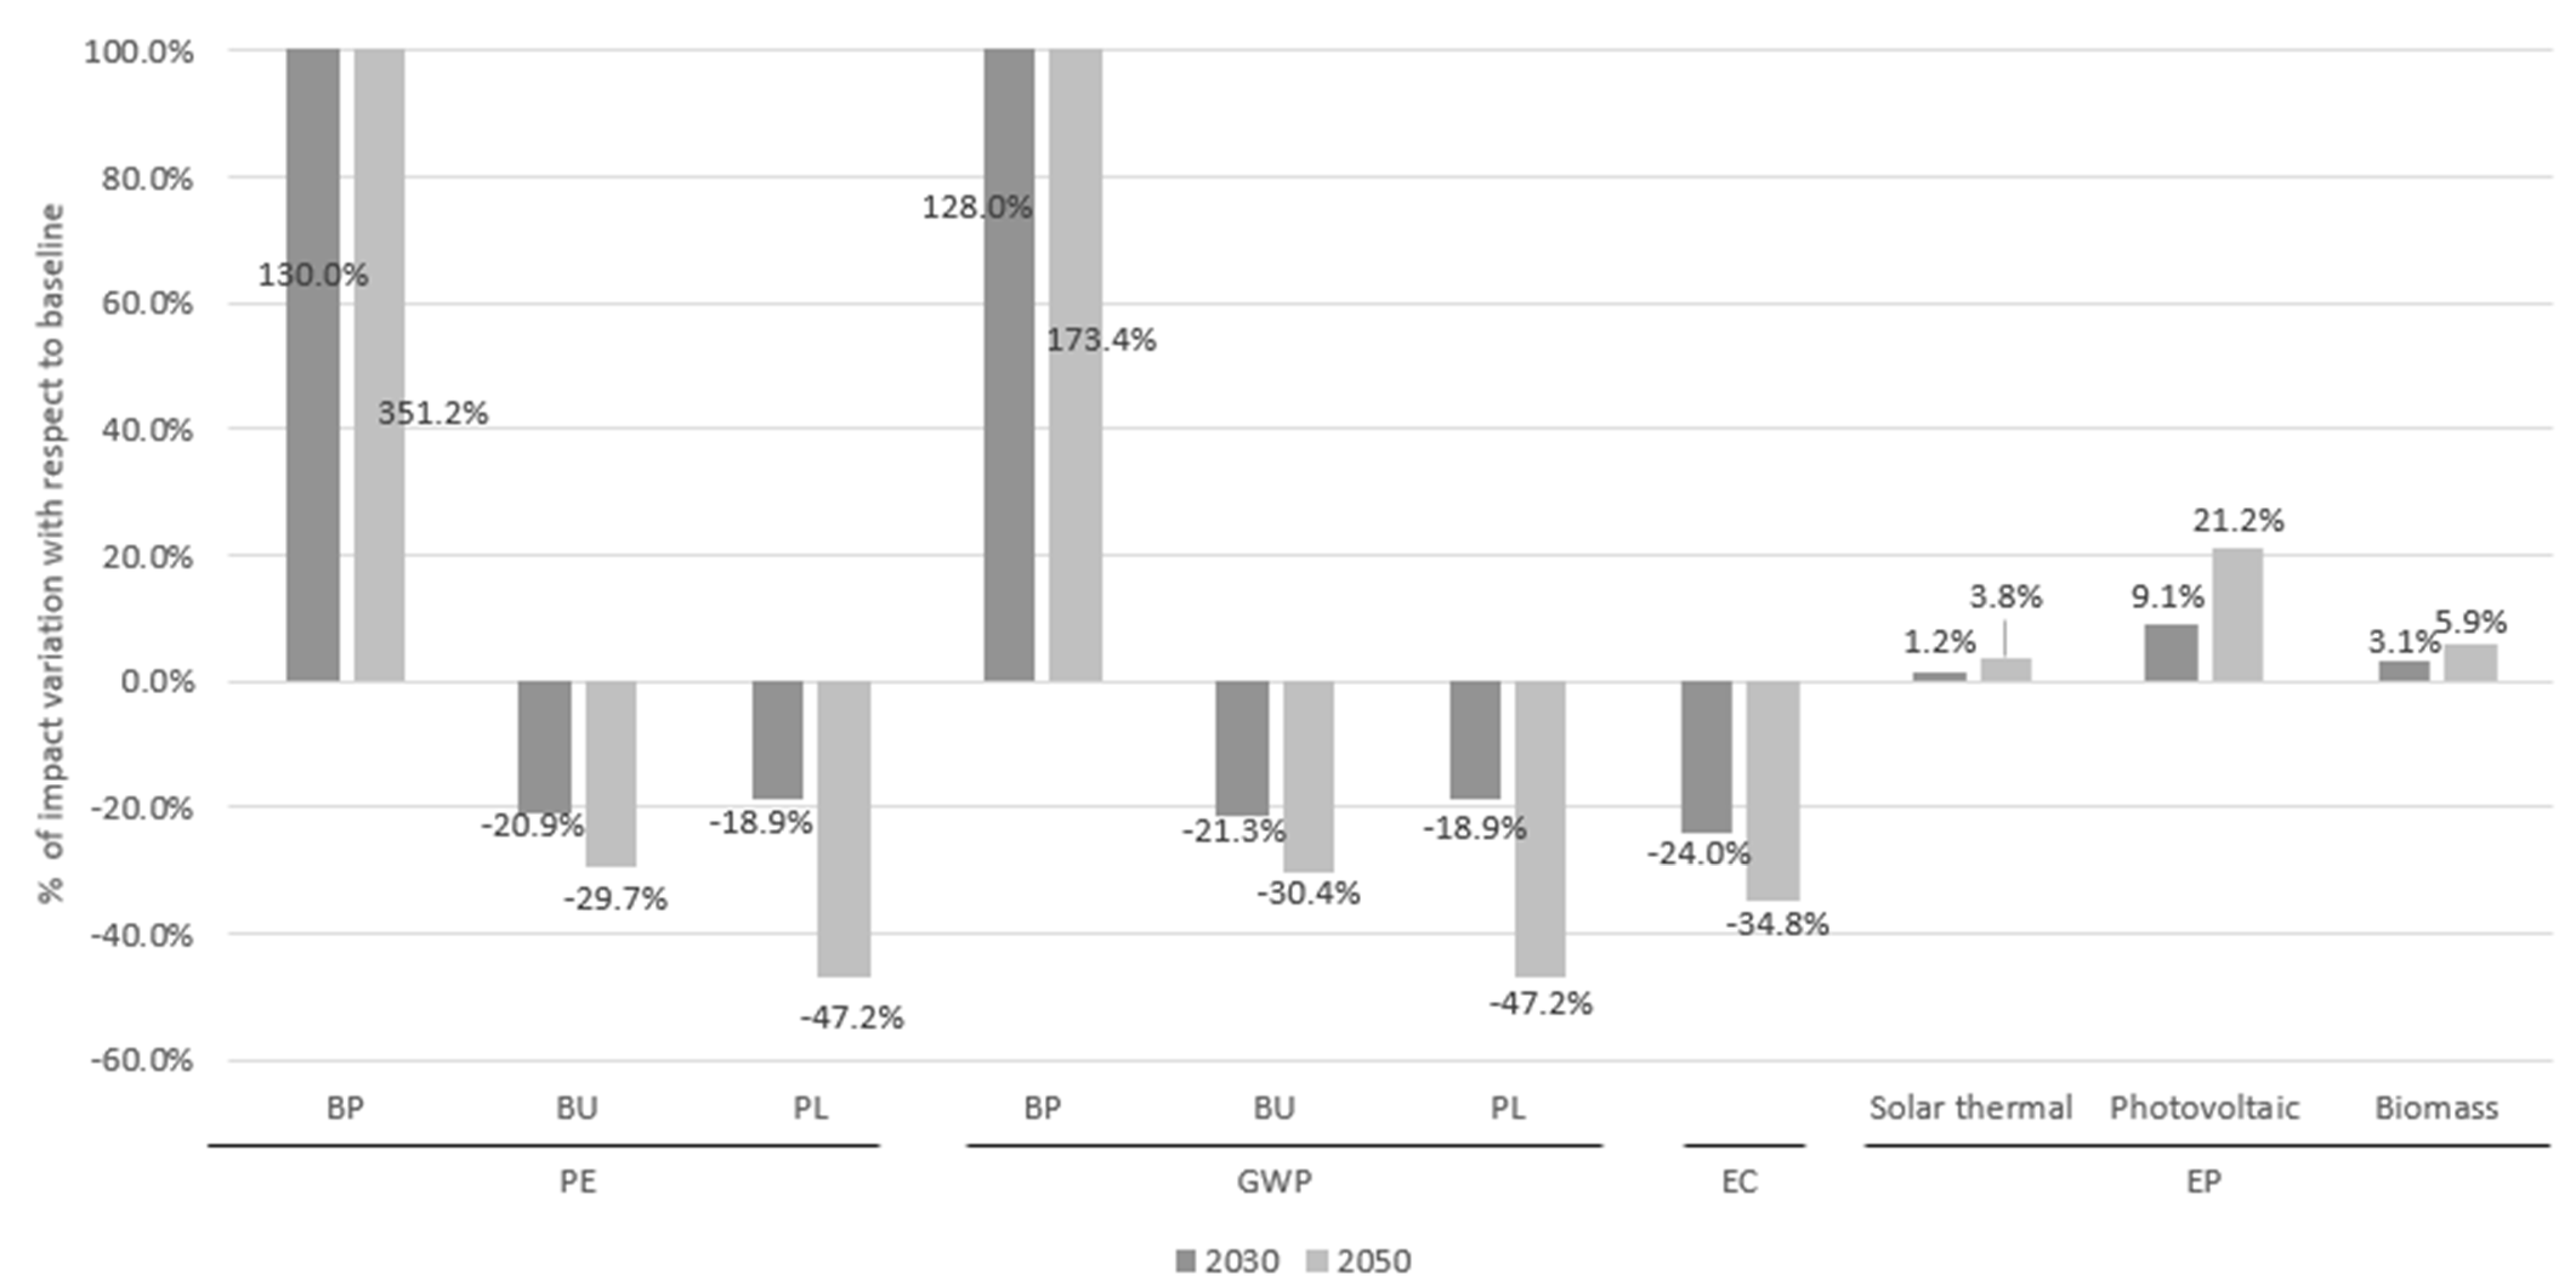
However, upon analysis of the results presented in Figure 7, which indicate the partial percentages of reduction or increase of PE, GWP, EC, and EP, the value of BP (A1-3, A4-5, B2, B4, C1-4) is notably much higher than the 2020 baseline.
From the 2020 baseline on, it, therefore, increases by 9.8 × 10⁶ in the 2030 improvement scenario and 26.5 × 10⁶ in the scenario for 2050. This is because the life cycle of the entire process is being taken into account. However, when focusing on the BU phase (B6) the values diminish, going so far as to achieve a reduction with respect to the baseline of 21.0% in 2030 and of 30.0% in the 2050 scenario. In the case of energy consumption, a reduction of 24.0% occurs in 2030 and 35.0% in 2050. The electric power source rises compared to the baseline scenario due to the increased implementation of heat pumps in campus buildings. As a result, the amount of natural gas diminishes as existing boilers are replaced by others with better performance (with condensation) or heat pumps, or the boiler and energy source switch to biomass. Furthermore, renewable energy production changes from 0.2% of total energy consumption at the baseline to 13.4% in 2030 and 30.9% in 2050. Regarding public lighting, the change from HPS lighting to LED reduces the values of PL and PE and in GWP compared to the 2020 baseline, by 19.0% in 2030 and 47.0% in 2050. In this study, the impact of mobility does not vary, as no improvement proposal has been made. The analysis focused on the environmental impact mainly due to campus buildings and not to users’ mobility.
Regarding the objectives set by the EU to achieve by 2030 and 2050, considering the 2020 scenario as baseline, it can be seen that the reduction of greenhouse gas emissions, energy efficiency improvement and the percentage of energy production from renewables are satisfactorily achieved (see Table 5). However, in the case of the scenario for 2050, the proposed goals are not met. Energy production employing renewable sources, despite progressing from 0.1% of the coverage area dedicated to renewable solar energy production to around 13.0% (11,000 m2) in 2030 and 30.9% (22,000 m2) in 2050 and having implemented biomass produced in situ in six buildings, the effort is not enough to achieve the objectives set by the EU for 2050. Likewise, although the GHG emission value can be reduced, this is not sufficient to meet the European proposal, with a 9% reduction still needed to fulfil it. To satisfy the RE production objectives, it would be necessary to increase the implementation of renewable energy production by 94.0% (50.1 × 10⁵ kWh) or lower energy demand by 8.5 × 10⁶ kWh, i.e., by 48.0% with respect to the baseline. In both cases, GHG emissions would meet the proposed expectations, achieving reductions of 70% and 98%, respectively. Because the NEST tool is fast and agile, the scenarios could be adapted until the expected result is obtained.
4. Conclusions
At present, the necessity to promote the fight against climate change to counter the environmental deterioration of the planet is evident. In this regard, it was noted that 71.0% of greenhouse gas emissions and 60.0% of resource consumption are associated to urban areas, which do not stop growing. It has hence been deemed necessary to seek successful solutions to promote the sustainable development of cities in the coming years. In this regard, the current project has focused on the environmental impact assessment of a university campus, which due to its size, activity, and use can be considered as a small city. The aim of the study is to analyse different improvement solutions that could be implemented on the campus in order to achieve the objectives set by the EU regarding energy and greenhouse gas emissions and which should be met by 2030 and 2050. Therefore, in order be able to study different improvement scenarios without having a big amount of data, NEST has been used. It is an easy and fast tool capable of analysing the environmental impact of a city, district or campus, considering the impact of different stages of the life cycle associated to different urban environment processes, including transportation or public lighting. In addition, the study provides a full overview of the impact of the studied district or city not only taking into account the operational phase, but also the production phase (A1-3), transport (A4), on-site processes (A5), maintenance (B2), replacement (B4), operational energy use (B6), operational water use (B7) and end-of-life phase (C1-4).
The results obtained show that by implementing passive rehabilitation and active improvement strategies (change to public lighting, façade insulation, window changes, switching to boilers that are more efficient or that consume renewable energy sources, installation of thermal solar and photovoltaic panels and biomass production), it is possible to improve the campus’s energy efficiency and to reduce greenhouse gas emissions as planned to meet the 2030 EU objectives. In addition, the expected amount of renewable energy production is reached by 2030. However, it can be seen that the improvement scenario proposed in this study for 2050, does not meet the expectations set by the EU regarding renewable energy production and GHG. More effort must be made to reduce energy consumption or increase the implementation of renewable energy production with respect to the baseline by 48.0% and 94.0%, respectively.
Future research will seek to address thoroughly investigation about which solutions need to be implemented in order to successfully achieve the EUs 2050 targets. The two possible solutions explained above or a combination thereof can form a part of future studies. Furthermore, it is likewise considered that it would be necessary for the university to conduct a study on the viability of making those improvements at both technical and financial levels and on the feasibility of complying with the implementation periods, also taking into account its own management of educational activity.
As previously mentioned, this study considered the impact of all the life-cycle phases. The results were compared to the EU objectives for energy and environmental impact. However, both the EU and local regulations do not make clear which phases should be taken into account, implying that it is only the operational one. Thus, if the entire life cycle is counted, the results are less favourable, albeit more realistic than if only the use phase is considered, because of the impacts of construction, maintenance, replacement, and end of life at both energetic and environmental levels. Using the data obtained in the analysis, it is hence considered important for the environmental and energy objectives set by the EU and local regulations to be revised. For the values of those objectives to be as realistic as possible, they should probably be adjusted to establish some which encompass the impact produced by all phases of the life cycle and not just the operational phase.
Finally, as commented before, it should be underscored that tools such as NEST enable the assessment of multiple scenarios with little information in a very short time. Different scenarios can be assessed in a versatile manner, analysing whether they will achieve the standards and reductions set by the EU. Their employment is useful for studying whether or not the planning universities envisage implementing to comply with European directives will have a satisfactory outcome. With NEST the starting hypotheses can easily be adjusted until the proposed objectives are attained. For the case of both universities and cities, this enables adaptation of the respective course of reforms to meet the directives in the years 2030 and 2050. Nevertheless, NEST should not be used for detailed numerical analysis. The values obtained in the simulations are rough because NEST is a useful tool as an assistant to make quick decisions on the design, definition, development, construction and renovation of campuses, districts, or cities without the need for long-term analyses.
Author Contributions
Conceptualization, I.L. and A.A.; methodology, A.A. and I.L.; software, A.A.; validation, I.L., A.A., X.O. and C.M.; formal analysis, X.O.; investigation, A.A.; data curation, X.O.; writing—original draft preparation, I.L., C.M. and A.A.; writing—review and editing, A.A. and I.L.; visualization, A.A.; supervision, I.L.; project administration, I.L.; funding acquisition, I.L. All authors have read and agreed to the published version of the manuscript.
Funding
This research was funded by the Nouvelle-Aquitaine/Euskadi/Navarre Euro-region (AECT). Project co-financed through the second session of the 2019 AECT call for projects.
Institutional Review Board Statement
Not applicable.
Data Availability Statement
The data can be found on the collaboration platform of the University of the Basque Country (https://ehubox.ehu.eus/login accessed on 22 June 2021) and are available for restricted access.
Acknowledgments
We would like to thank the University of Navarra and the Arquitectura AH Asociados studio for their work acquiring data from UNAV for the baseline inventory.
Conflicts of Interest
The authors declare no conflict of interest.
Appendix A

Table A1.
Summary of strategies in the baseline scenario and proposed in the improvement scenarios for each building. Insulation of exterior façade (F), change of windows (W), electric boiler (EB), natural gas boiler (NG), gas condensing boiler (GC), biomass boiler (B) and heat pump (HP).
Table A1.
Summary of strategies in the baseline scenario and proposed in the improvement scenarios for each building. Insulation of exterior façade (F), change of windows (W), electric boiler (EB), natural gas boiler (NG), gas condensing boiler (GC), biomass boiler (B) and heat pump (HP).
| Passive Renovation | Active Strategies (Heating and DHW) According to Usable Area | |||||||||||||||||||
|---|---|---|---|---|---|---|---|---|---|---|---|---|---|---|---|---|---|---|---|---|
| F | W | F | W | EB | NG | GC | B | HP | EB | NG | GC | B | HP | EB | NG | GC | B | HP | ||
| Building | 2030 | 2050 | Baseline | 2030 | 2050 | |||||||||||||||
| 1 | Experimentation | x | x | x | ||||||||||||||||
| 2a | CIFA Research Centre | x | x | X | x | x | x | |||||||||||||
| 2b | CIFA Research Centre | x | x | x | ||||||||||||||||
| 3 | Science Hall | x | x | x | x | x | ||||||||||||||
| 4 | Science Library | x | x | x | x | x | x | |||||||||||||
| 5 | Los Castaños | x | x | x | x | x | x | x | ||||||||||||
| 6 | Research | x | x | x | x | x | x | x | ||||||||||||
| 7 | Science buildings | x | x | x | x | x | x | x | ||||||||||||
| 8a | University Hospital (Phase 1 and 3) | x | x | x | x | x | x | x | ||||||||||||
| 8b | University Hospital (Phase 2) | x | x | x | ||||||||||||||||
| 8c | University Hospital (Phase 4) | x | x | x | x | x | ||||||||||||||
| 8d | University Hospital (phase 5) | x | x | x | x | x | ||||||||||||||
| 9 | Muga Building | x | x | x | x | x | ||||||||||||||
| 10 | ACUNSA | x | x | x | x | x | ||||||||||||||
| 11 | CIMA | x | x | x | ||||||||||||||||
| 12 | Olibadea University Residence | x | x | x | x | x | x | |||||||||||||
| 13 | Goimendi University Residence | x | x | x | x | x | x | x | ||||||||||||
| 14 | Goroabe University Residence | x | x | x | ||||||||||||||||
| 15 | Belagua University Residence | x | x | x | x | |||||||||||||||
| 16 | Navarre Museum | x | x | x | ||||||||||||||||
| 17 | Tower I and II Belagua University Residence | x | x | x | x | x | x | |||||||||||||
| 18 | Central Building | x | x | x | x | x | x | x | ||||||||||||
| 19 | Dining Hall | x | x | x | x | x | x | |||||||||||||
| 20 | Architecture School | x | x | x | x | x | x | |||||||||||||
| 21 | Ismael Sanchez Bella | x | x | x | x | x | x | x | ||||||||||||
| 22 | Culture and Society Institute | x | x | x | ||||||||||||||||
| 23 | Library | x | x | x | x | |||||||||||||||
| 24 | Social Sciences Building (FCOM) | x | x | x | x | x | x | |||||||||||||
| 25 | Mendaur University Residence | x | x | x | x | x | x | |||||||||||||
| 26 | Law School | x | x | x | x | x | x | |||||||||||||
| 27 | Amigos Building (Economics) | x | x | x | ||||||||||||||||
| 28 | Ecclesiastical Faculties | x | x | x | x | x | x | |||||||||||||
| 29 | The Nogales | x | x | x | x | x | x | |||||||||||||
| 30a | Sports Centre | x | x | x | x | x | x | |||||||||||||
| 30b | Sport Centre Courts | |||||||||||||||||||
| 30c | Sports Centre Fronton | |||||||||||||||||||
| 31 | Gardening | x | x | x | x | x | x | |||||||||||||
References
- International Energy Agency. World Energy Outlook 2016. Int. Energy Agency 2016. [Google Scholar] [CrossRef]
- United Nations, Department of Economic and Social Affairs, Population Division. The World’s Cities in 2018—Data Booklet (ST/ESA/SER.A/417). Available online: https://www.un.org/sustainabledevelopment (accessed on 10 February 2021).
- Seto, K.C.; Güneralp, B.; Hutyra, L.R. Global forecasts of urban expansion to 2030 and direct impacts on biodiversity and carbon pools. Proc. Natl. Acad. Sci. USA 2012, 109, 16083–16088. [Google Scholar] [CrossRef] [Green Version]
- Song, Y.; Chen, B.; Kwan, M.P. How Does Urban Expansion Impact People’s Exposure to Green Environments? A Comparative Study of 290 Chinese Cities. J. Clean. Prod. 2020, 246, 119018. [Google Scholar] [CrossRef]
- United Nations. Sustainable Development Goals. 2015. Available online: https://www.un.org/sustainabledevelopment/es/cities/ (accessed on 1 February 2021).
- United Nations Report of the UN Economist Network for the UN 75th Anniversary: Shaping the Trends of Our Time. 2020. Available online: https://www.un.org/development/desa/publications/report-of-the-un-economist-network-for-the-un-75th-anniversary-shaping-the-trends-of-our-time.html (accessed on 29 June 2021).
- European Commission. Nature-Based Solutions. 2020. Available online: https://ec.europa.eu/info/research-and-innovation/research-area/environment/nature-based-solutions_en (accessed on 22 June 2021).
- European Commission. Horizon Europe. 2020. Available online: https://ec.europa.eu/info/horizon-europe_en (accessed on 22 June 2021).
- COM(2011) 112—Roadmap for Moving to a Low-Carbon Economy in 2050. Available online: https://www.eea.europa.eu/policy-documents/com-2011-112-a-roadmap (accessed on 29 June 2021).
- Auger, C.; Hilloulin, B.; Boisserie, B.; Thomas, M.; Guignard, Q.; Rozière, E. Open-Source carbon footprint estimator: Development and university declination. Sustainability 2021, 13, 4315. [Google Scholar] [CrossRef]
- Alahmari, M.; Issa, T.; Issa, T.; Nau, S.Z. Faculty awareness of the economic and environmental benefits of augmented reality for sustainability in Saudi Arabian universities. J. Clean. Prod. 2019, 226, 259–269. [Google Scholar] [CrossRef]
- Leal Filho, W.; Salvia, A.L.; Do Paco, A.; Anholon, R.; Quelhas, O.L.G.; Rampasso, I.S.; Ng, A.; Balogun, A.-L.; Kondev, B.; Brandli, L.L. A comparative study of approaches towards energy efficiency and renewable energy use at higher education institutions. J. Clean. Prod. 2019, 237, 117728. [Google Scholar] [CrossRef]
- Wang, J.C.; Huang, K.T.; Ko, M.Y. Using the fuzzy delphi method to study the construction needs of an elementary campus and achieve sustainability. Sustainability 2019, 11, 6852. [Google Scholar] [CrossRef] [Green Version]
- Stephan, A.; Muñoz, S.; Healey, G.; Alcorn, J. Analysing material and embodied environmental flows of an Australian university—Towards a more circular economy. Resour. Conserv. Recycl. 2020, 155, 104632. [Google Scholar] [CrossRef]
- Muñoz-Suárez, M.; Guadalajara, N.; Osca, J.M. A Comparative Analysis between Global University Rankings and Environmental Sustainability of Universities. Sustainability 2020, 12, 5759. [Google Scholar] [CrossRef]
- Montoya, F.G.; Perea-Moreno, A.-J. Environmental energy sustainability at universities. Sustainability 2020, 12, 9219. [Google Scholar] [CrossRef]
- Pérez-Neira, D.; Rodríguez-Fernández, M.P.; Hidalgo-González, C. The greenhouse gas mitigation potential of university commuting: A case study of the University of León (Spain). J. Transp. Geogr. 2020, 82, 102550. [Google Scholar] [CrossRef]
- Sobrino, N.; Arce, R. Understanding per-trip commuting CO2 emissions: A case study of the Technical University of Madrid. Transport. Res. Transport. Environ. 2021, 96, 102895. [Google Scholar] [CrossRef]
- Leon, I.; Oregi, X.; Marieta, C. Environmental assessment of four Basque University campuses using the NEST tool. Sustain. Cities Soc. 2018, 42, 396–406. [Google Scholar] [CrossRef]
- Leon, I.; Oregi, X.; Marieta, C. Contribution of university to environmental energy sustainability in the city. Sustainability 2020, 12, 774. [Google Scholar] [CrossRef] [Green Version]
- Zhang, B.; Su, S.; Zhu, Y.; Li, X. An LCA-based environmental impact assessment model for regulatory planning. Environ. Impact Assess. Rev. 2020, 83, 106406. [Google Scholar] [CrossRef]
- Scheuer, C.; Keoleian, G.A.; Reppe, P. Life cycle energy and environmental performance of a new university building: Modeling challenges and design implications. Energy Build. 2003, 35, 1049–1064. [Google Scholar] [CrossRef]
- Muñoz-Liesa, J.; Toboso-Chavero, S.; Beltran, A.M.; Cuerva, E.; Gallo, E.; Gassó-Domingo, S.; Josa, A. Building-integrated agriculture: Are we shifting environmental impacts? An environmental assessment and structural improvement of urban greenhouses. Resour. Conserv. Recycl. 2021, 169, 105526. [Google Scholar] [CrossRef]
- Oregi, X.; Pousse, M.; Mabe, L.; Escudero, A.; Mardaras, I. Sustainability assessment of three districts in the city of Donostia through the NEST simulation tool. Nat. Resour. Forum 2016. 40, 156–168. [CrossRef]
- Lotteau, M.; Yepez-Salmon, G.; Salmon, N. Environmental assessment of sustainable neighborhood projects through NEST, a decision support tool for early stage urban planning. Procedia Eng. 2015, 115, 69–76. [Google Scholar] [CrossRef] [Green Version]
- Goulouti, K.; Padey, P.; Galimshina, A.; Habert, G.; Lasvaux, S. Uncertainty of building elements’ service lives in building LCA & LCC: What matters? Build. Environ. 2020, 183, 106904. [Google Scholar]
- Lasvaux, S.; Gantner, J.; Wittstock, B.; Bazzana, M.; Schiopu, N.; Saunders, T.; Gazulla, C.; Mundy, J.A.; Sjostrom, C.; Palmer, P.F.; et al. Achieving consistency in life cycle assessment practice within the European construction sector: The role of the EeBGuide InfoHub. Int J. Life Cycle Assess 2014, 19, 1783–1793. [Google Scholar] [CrossRef]
- Lasvaux, S.; Ventura, A.; Habert, G.; De La Roche, C.; Hermel, K.; Feraillle, A.; Tardivel, Y.; Tessier, C. Linking research activities and their implementation in practice in the construction sector: The LCA Construction 2012 experience. Int J. Life Cycle Assess. 2014, 19, 463–470. [Google Scholar] [CrossRef]
- Aste, N.; Caputo, P.; Del Pero, C.; Ferla, G.; Huerto-Cardenas, H.E.; Leonforte, F.; Miglioli, A. A renewable energy scenario for a new low carbon settlement in northern Italy: Biomass district heating coupled with heat pump and solar photovoltaic system. Energy 2020, 206, 118091. [Google Scholar] [CrossRef]
- Ericsson, K.; Werner, S. The introduction and expansion of biomass use in Swedish district heating systems. Biomass Bioenergy 2016, 94, 57–65. [Google Scholar] [CrossRef] [Green Version]
- Sartor, K.; Dewallef, P. Optimized integration of heat storage into district heating networks fed by a biomass chp plant. Energy Procedia 2017, 135, 317–326. [Google Scholar] [CrossRef]
- Insider Pamplona. Available online: http://www.insiderpamplona.com/webnueva/campus-de-la-universidad-de-navarra/ (accessed on 22 June 2021).
- Universidad de Navarra. Available online: https://www.unav.edu/conoce-la-universidad (accessed on 22 June 2021).
- UNAV. Memorias De La Universidad. Available online: https://www.unav.edu/conoce-la-universidad/impacto-sociedad/memorias (accessed on 22 June 2021).
- UNAV. LA Universidad En Cifras, Memorias (Curso 2018/2019). 2019. Available online: https://issuu.com/universidaddenavarra/docs/un_memoria_curso_2018_19_web (accessed on 22 June 2021).
- Google Maps. Campus Campus Pamplona UNAV. Available online: https://www.google.com/maps/place/Universidad+de+Navarra/@42.8026509,-1.6687785,14z/data=!4m9!1m2!2m1!1scampus+navarra+pamplona!3m5!1s0xd509268efbaaaab:0x8a7b0bf549020f90!8m2!3d42.8014918!4d-1.6597366!15sChdjYW1wdXMgbmF2YXJyYSBwYW1wbG9uYVoZIhdjYW1wdXMgbmF2YXJyYSBwYW1wbG9uYZIBEnByaXZhdGVfdW5pdmVyc2l0eZoBI0NoWkRTVWhOTUc5blMwVkpRMEZuU1VSak4wbFRWRVozRUFF (accessed on 22 June 2021).
- Idena: Infraestructura de Datos Espaciales de Navarra. Available online: https://idena.navarra.es/navegar/#ZXh0fGJhc2V8bWFwYWJhc2V8bGF5ZXJzXl42MDg1MTIuNzgyfDQ3Mzg4MT-uMzg3fDYxMTI0NC43ODJ8NDc0MDEyMy4zODdeJDB8QDR8NXw2fDddfDF8MnwzfEBdXQ== (accessed on 22 June 2021).
- Gobierno de Navarra. Catastro de Navarra. Registro De La Riqueza Territorial. Available online: https://catastro.navarra.es/navegar/ (accessed on 22 June 2021).
- Manzano, E.R.; Carlorosi, M.; Tapia Garzón, M. Performance and measurement of power quality due to harmonics from street lighting networks. In Proceedings of the International Conference on Renewable Energies and Power Quality (ICREPQ’09), Valencia, Spain, 15–17 April 2009. [Google Scholar]
- Gutierrez-Escolar, A.; Castillo-Martinez, A.; Gomez-Pulido, J.M.; Gutierrez-Martinez, J.M.; Stapic, Z.; Medina-Merodio, J.A. A study to improve the quality of street lighting in Spain. Energies 2015, 8, 976–994. [Google Scholar] [CrossRef] [Green Version]
- IDAE. Instituto para la Diversificación y Ahorro de la Energía de España. 2017. Available online: https://www.idae.es/tecnologias/eficiencia-energetica/servicios/alumbrado-exterior (accessed on 22 June 2021).
- Universidad de Navarra. Plan de Movilidad Sostenible. Available online: https://www.unav.edu/universidad-y-medio-ambiente/movilidad-sostenible (accessed on 22 June 2021).
- European Parliament. European Parliament resolution UN Climate Change Conference Madrid (COP25) (2019/2712(RSP). Available online: https://www.europarl.europa.eu/doceo/document/TA-9-2019-0079_EN.html (accessed on 27 January 2021).
- European Commission. Marco Sobre Clima y Energía Para 2030. Available online: https://ec.europa.eu/clima/policies/strategies/2030_es (accessed on 25 June 2021).
- European Commission. 2050 Long-Term Strategy. Available online: https://ec.europa.eu/clima/policies/strategies/2050_en (accessed on 25 June 2021).
- Gobierno de Navarra. Plan Energético de Navarra Horizonte. 2030. Available online: https://gobiernoabierto.navarra.es/es/participacion/procesos-de-participacion/propuestas-gobierno/plan-energetico-navarra-horizonte-2030 (accessed on 25 June 2021).
- Gobierno de España, Ministerio para la Transición Ecológica y el Reto Demográfico. Borrador actualizado del Plan Nacional Integrado de Energía y Clima 2021–2030. Available online: https://energia.gob.es/es-es/Participacion/Paginas/DetalleParticipacionPublica.aspx?k=236 (accessed on 22 June 2021).
- Gobierno de España, Ministerio para la Transición Ecológica y el Reto Demográfico. Objetivos de Reducción de Emisiones de Gases de Efecto Invernadero. Available online: https://www.miteco.gob.es/es/cambio-climatico/temas/mitigacion-politicas-y-medidas/objetivos.aspx (accessed on 22 June 2021).
Figure 1.
Workflow of the study.

Figure 2.
Site plan of buildings at the Pamplona campus. Buildings numbered according to the inventory done to assess the scenarios (the numbers of buildings are listed in Appendix A. Table A1. (Source: Google Maps).
Figure 2.
Site plan of buildings at the Pamplona campus. Buildings numbered according to the inventory done to assess the scenarios (the numbers of buildings are listed in Appendix A. Table A1. (Source: Google Maps).

Figure 3.
Diagram of environmental assessment calculation processes carried out by NEST.

Figure 4.
Baseline 3D model with information on the UNAV campus designed in NEST.

Figure 5.
Results obtained to baseline, 2030 and 2050 scenarios: Primary Energy (PE), Global Warming Potential, Energy Consumption and Renewable Energy Production.
Figure 5.
Results obtained to baseline, 2030 and 2050 scenarios: Primary Energy (PE), Global Warming Potential, Energy Consumption and Renewable Energy Production.

Figure 6.
Total impact variation (%) for improvement scenarios studied compared to the baseline. Primary energy (PE), global-warming potential (GWP), and energy consumption (EC).
Figure 6.
Total impact variation (%) for improvement scenarios studied compared to the baseline. Primary energy (PE), global-warming potential (GWP), and energy consumption (EC).

Figure 7.
Partial impact variation (%) by type and LCA phase, for improvements scenarios studied with respect to the baseline. Building production (BP), building use (BU), public lighting (PL), energy production (EP).
Figure 7.
Partial impact variation (%) by type and LCA phase, for improvements scenarios studied with respect to the baseline. Building production (BP), building use (BU), public lighting (PL), energy production (EP).

Table 1.
Main information included in NEST in the baseline via the 3D model.
| General Data | University of Navarra | |
|---|---|---|
| Location | Pamplona/Iruña | |
| Climate zone | D1 | |
| Service life of the district (years) | 100 | |
| District users | 14,971 | |
| Total surface area (m2) | 1,547,278 m2 | |
| Building surface area(m2) | 234,325 m2 | |
| Open green-spaces (m2) | 1,082,210 m2 | |
| Parking surface area (m2) | 80,491 m2 | |
| Population (%) | 14,971 people | |
| Employees | 71% | |
| Students | 29% | |
| Mobility (%) | Students | Employees |
| Private car | 19% | 62% |
| Bus | 17% | 16% |
| Train | 0% | 0% |
| Bicycle | 7% | 2% |
| Walking | 57% | 20% |
| Public lighting | ||
| Type | High-pressure sodium-vapour | |
| Control system | Electronic ballast | |
| Building characteristics | ||
| Energy label-rating | C-D-E-G | |
| Heating and DHW system | Natural gas, gas condensing boiler, heat pump, electric boiler and heat pump | |
| Cooling | Heat pump | |
Table 2.
Objectives considered in the research to fulfil in the improvement scenarios in 2030 and 2050 regarding the base scenario in 2020, taking into account the EU directive. The negative value is a reduction and the positive value an increase.
Table 2.
Objectives considered in the research to fulfil in the improvement scenarios in 2030 and 2050 regarding the base scenario in 2020, taking into account the EU directive. The negative value is a reduction and the positive value an increase.
| Objectives | 2020 | 2030 | 2050 | ||||||
|---|---|---|---|---|---|---|---|---|---|
| GHG 1 | RE 2 | EEI 3 | GHG | RE | EEI | GHG | RE | EEI | |
| EU (compared to 1990) | −20% | 20% | 20% | −40% | 32% | 32.50% | −80% | 80% (electricity) | Undefined |
| Case study (compared to 2020) | Baseline scenario. Assumption for calculating minimums: 2020 objectives achieved. | −20% | 12% | 12.50% | −60% | 60% (electricity) | Undefined | ||
1 GHG-greenhouse gases. 2 RE-renewable energy production. 3 EEI-energy efficiency improvement.
Table 3.
Summary of strategies proposed in the baseline scenario and improvement scenarios, general information. A negative value indicates a reduction and a positive value an increase.
Table 3.
Summary of strategies proposed in the baseline scenario and improvement scenarios, general information. A negative value indicates a reduction and a positive value an increase.
| Renovation Strategy | Baseline | 2030 | 2050 | |
|---|---|---|---|---|
| Passive strategies | Façade | None | 62.4% | 73.2% |
| Windows | None | 27.0% | 50.7% | |
| Active strategies (heating and DHW) considering the building’s useful surface area | Electric boiler | 0.00% | 0.00% | 0.00% |
| Natural gas boiler | 84.3% | 55.0% | 15.7% | |
| Gas condensing boiler | 13.7% | 21.1% | 41.5% | |
| Biomass boiler | None | 11.4% | 23.6% | |
| Heat pump | None | 10.6% | 17.4% | |
| Renewable strategies | Thermal solar | 48.0 m² | 550.5 m² | 1371.7 m² |
| Photovoltaic | 0.0 m² | 11,000.5 m² | 22,001.1 m² | |
| Public lighting | HPSV 1 100% | HPSV 70%, LED 30% | HPSV 25%, LED 75% |
1 High-pressure sodium-vapour (HPSV).
Table 4.
Results obtained in the NEST simulation of the improvement scenarios for the years 2030 and 2050.
Table 4.
Results obtained in the NEST simulation of the improvement scenarios for the years 2030 and 2050.
| Impact Indicator | Sector | Life-Cycle Stage | Baseline Scenario | 2030 | 2050 |
|---|---|---|---|---|---|
| PE (MJ/year) | Buildings (BP) Buildings (BU) Public lighting (PL) Mobility | A1-3, A4-5, B2, B4, C1-4 B6 B6 A1-3, B6, C1-4 | 7.5 × 10⁶ 132.7 × 10⁶ 2.2 × 10⁶ 1.8 × 10³ | 17.3 × 10⁶ 105.0 × 10⁶ 1.7 × 10⁶ 1.8 × 10³ | 34.0 × 10⁶ 93.3 × 10⁶ 1.1 × 10⁶ 1.8 × 10³ |
| GWP (kgeqCO2/year) | Buildings (BP) Buildings (BU) Public lighting (PL) Mobility | A1-3, A4-5, B2, B4, C1-4 B6 B6 A1-3, B6, C1-4 | 3.5 × 10⁵ 6.3 × 10⁶ 2.3 × 10⁵ 1.0 × 10² | 8.1 × 10⁵ 5.0 × 10⁶ 1.9 × 10⁵ 1.0 × 10² | 9.7 × 10⁵ 4.4 × 10⁶ 1.2 × 10⁵ 1.0 × 10² |
| Energy consumption (kWh/year) | Natural gas (NG) Electricity (E) Biomass (B) | B6 B6 B6 | 17.0 × 10⁶ 9.1 × 10⁶ 7.0 × 10³ | 9.4 × 10⁶ 10.3 × 10⁶ 6.3 × 10⁵ | 5.7 × 10⁶ 10.7 × 10⁶ 1.0 × 10⁶ |
| Renewable energy production (kWh) | Thermal solar (TS) Photovoltaic (P) | 3.6 × 10⁴ 0.0 | 2.4 × 10⁵ 1.8 × 10⁶ | 6.6 × 10⁵ 3.7 × 10⁶ |
Table 5.
Comparison of results obtained to 2030 and 2050 EU objectives.
| Objectives | 2020 | 2030 | 2050 | ||||||||
|---|---|---|---|---|---|---|---|---|---|---|---|
| GHG 1 | RE 2 | EEI 3 | GHG | RE | EEI | GHG | RE | EEI | |||
| Case study (compared to 2020) | Baseline scenario. Assumption for calculating minimums: 2020 objectives achieved. | −20% | 12% | 12.50% | −60% | 60% (electricity) | Undefined | ||||
| Results | −28.6% | 13.4% | 24.0% | −50.6% | 30.9% | 34.8% | |||||
1 GHG–greenhouse gases. 2 RE–renewable energy production. 3 EEI–energy efficiency improvement.
Publisher’s Note: MDPI stays neutral with regard to jurisdictional claims in published maps and institutional affiliations. |
© 2021 by the authors. Licensee MDPI, Basel, Switzerland. This article is an open access article distributed under the terms and conditions of the Creative Commons Attribution (CC BY) license (https://creativecommons.org/licenses/by/4.0/).
Share and Cite
MDPI and ACS Style
Arias, A.; Leon, I.; Oregi, X.; Marieta, C. Environmental Assessment of University Campuses: The Case of the University of Navarra in Pamplona (Spain). Sustainability 2021, 13, 8588. https://0-doi-org.brum.beds.ac.uk/10.3390/su13158588
AMA Style
Arias A, Leon I, Oregi X, Marieta C. Environmental Assessment of University Campuses: The Case of the University of Navarra in Pamplona (Spain). Sustainability. 2021; 13(15):8588. https://0-doi-org.brum.beds.ac.uk/10.3390/su13158588
Chicago/Turabian StyleArias, Alba, Iñigo Leon, Xabat Oregi, and Cristina Marieta. 2021. "Environmental Assessment of University Campuses: The Case of the University of Navarra in Pamplona (Spain)" Sustainability 13, no. 15: 8588. https://0-doi-org.brum.beds.ac.uk/10.3390/su13158588
Note that from the first issue of 2016, this journal uses article numbers instead of page numbers. See further details here.