
Environmental Attitudes and Willingness to Purchase Online—Classification Approach


Department of Marketing, Faculty of Management, Lublin University of Technology, ul. Nadbystrzycka 38D, 20-618 Lublin, Poland
Sustainability 2021, 13(15), 8592; https://0-doi-org.brum.beds.ac.uk/10.3390/su13158592
Submission received: 29 June 2021
/
Revised: 26 July 2021
/
Accepted: 27 July 2021
/
Published: 1 August 2021
(This article belongs to the Special Issue New Technologies in Customer Value Management in the Perspective of Sustainable Development)
Abstract
:During the last several years, a tremendous increase in the popularity of online shopping has been observed. There are several possible reasons behind it, some of them, like competitive pricing, convenience or low cost of information search, considered to be extrinsic, others—like ease of use of this channel, pleasure related to it or willingness to reduce social interactions—intrinsic. The purpose of this research is to evaluate another factor, i.e., consumers’ environmental attitudes, in the perspective of their possible relation with the perception and willingness to use online and conventional shopping channels. In order to achieve this, a self-reporting questionnaire was developed and the data from a representative sample of 1000 Polish Internet users was gathered. The research procedure included cluster analysis, whose objective was to identify groups of customers with similar composition of environmental attitudes and next, a set of Kruskal–Wallis tests, aimed at identifying differences in opinions on channels between these clusters. The research proved that large groups of consumers with consistent sets of environmental attitudes exist and the scope of differences between such clusters is not reduced to a unidimensional, “positive–negative” continuum. Furthermore, there are significant differences between clusters in the declared willingness to use online and conventional shopping channels—groups more environmentally-oriented are more willing to purchase online and trust online shops, although they neither perceive conventional retail in a more negative way nor directly prefer online over conventional channels. The nature of such a phenomenon is open to explanation and interpretation, nevertheless, the research proves that environmental attitudes should be included in future models of consumers’ channel choice.
1. Introduction
The constant development of the Internet as well as its steadily increasing accessibility, both in terms of the cost of access and geographical availability, have led to a tremendous growth in online commerce. Between 2014 and 2019, the value of sales grew from 1336 to 3535 billion U.S. dollars, and pre-COVID-19 estimation was that it would reach 6542 billion by the end of 2023 [1]. It is estimated that there will be a constant increase of the value of online trade of at least 15% yearly, and that the online trade will cover 22% of total retail sales by year 2023 [2]. Moreover, these values will most probably be modified by the COVID-19 pandemic, which already reshaped the way most retailers operate, by affecting international trade, cost of transportation, product availability, or manufacturing output [3], but, on the other hand, led to a visible, further increase in the amount and value of online trade [4,5,6], and the willingness to use it more frequently in the future [7].
A growth of popularity of online shopping as well as a constant expansion of the volume of online commerce has resulted in an increasing number of research into e-consumer behaviour, which is now considered an important area of studies [8,9]. Understating how and why consumers choose a certain channel—conventional or online, and a particular place of purchase within that channel, is nowadays critical not only from scientific, but also from practical, business point of view. It provides insights into new and dynamically evolving areas of human behaviour as well as grounds for developing or reshaping marketing strategies and building competitive advantages, e.g., by addressing particular, purchase-related needs and providing related values, optimising shopping experience, creating relationships, mitigating possible risks or increasing trust and credibility of a company.
There is a considerable amount of factors shaping and influencing e-consumer behaviour as well as mechanisms governing purchase activities, which are subjects of extensive discussion in the literature (see in [8,10,11,12,13,14]). At the end, they all lead to a choice—a decision which, in the case of a e-consumer, include three aspects: channel choice—whether to purchase online or in a conventional brick-and-mortar shop; vendor choice—related to a particular place of purchase; and product choice—related to particular brand and product model. These areas of the decision, although seemingly separate, are in fact inextricably intertwined, as each of them may define a set of possible alternatives for others.
This research is focused on the first, most general of mentioned choice aspects, i.e., on the choice of the channel. The main goal of this study is to evaluate whether the willingness to choose a particular channel is dependent on the attitude towards the environment and its protection. In order to achieve that, four research questions were introduced:
- Is it possible to divide consumers into groups based on their attitude towards the environment and its protection?
- Is the particular channel evaluation, in terms of its impact on the environment, and willingness to choose it is different in such groups?
- Is different channels’ environmental impact evaluation similar or different within a group of consumers with a particular set of environmental attitudes?
- Do more environment-conscious customers tend to choose channel which is, in their opinion, more environment friendly?
2. Literature Review
There are multiple reasons behind consumers’ willingness to purchase products online, which may be divided into two categories—extrinsic and intrinsic [15]; the first one includes those factors which are external to the consumer, the second one—those related to their internal, psychological processes, experience and knowledge. Additionally, note that the factors affecting abovementioned willingness may be positive—i.e., encouraging and motivating to use that channel, but also negative, discouraging from online trade and transactions [16,17].
The literature identifies a significant number of specific factors which encourage or motivate potential clients to choose online channel instead of conventional, brick-and-mortar shops, most of which follow two general variables defined by technology acceptance model (TAM/TAM2) and its extensions [18,19,20]: perceived usefulness and perceived ease of use. Particular factors established in the previous studies involve attractive prices [21,22] and customer’s price consciousness [23], time conservation, availability of extensive product information and reviews [24], channel’s perceived security [25], time pressure and distance to conventional store, ease of use, enjoyment of the Internet, hedonic orientation [26], variety-seeking, interactivity and personalised actions [24]. Other, frequently mentioned reasons include convenient delivery and convenient return policies, low effort, lack of necessity to establish or participate in social interactions, better customer protection, a wider choice of alternatives and the ability to purchase regardless of the physical localisation of the company.
Additionally, the willingness to use online channels may be moderated by several, different variables: demographic—e.g., consumer’s gender [27], age or income [28,29], frequency of previous, online purchases [30], consumer traits [31], e-commerce-related experiences, negative and positive purchase episodes, personal purchase style, trust, as well as marketing communications of companies [32]. It is also tightly dependent on the product type—which visibly influences the level of importance of particular variables relevant for channel choice [24,26,30]. Moreover, as the combination of all the abovementioned factors is not constant for each potential consumer, it is possible to search for and identify different patterns of relevance of factors motivating towards online channels—such segmentations are also present in the literature [23,26].
Apart from factors that motivate or encourage consumers to use online channels, there are also those, which may discourage from using it. Such factors may also follow TAM/TAM2, by reducing usefulness and ease of use of the channel, and include long waiting time for product delivery [33], risk perception [34], consumer’s risk aversion and uncertainty avoidance [35], additional costs, as well as privacy and security concerns [36]. There are also several factors which are considered valuable and preferred by some consumers, which are not present in the online environment, such as contact with the product and opportunity to validate it [37], social interaction with other consumers or staff and receiving a personalised one-to-one customer service [24].
Channel choice determinants may be divided into particular, more general categories. Trenz [38] proposed four groups of determinants: individual differences—including factors specific for a consumer, channel determinants—representing channel characteristics and properties, purchase specifics, related to a product category and external influences, representing the impact of the consumer’s environment. The other classification, presented by Neslin et al. [39], includes channel attributes, channel integration, social influence, company’s marketing efforts, individual differences and situational factors.
Pro-environmental attitudes as a factor influencing channel choice and willingness to purchase online can be perceived as a dimension of individual differences both in Trenz’s and Neslin’s classifications. It may also be considered a part of extended technology acceptance model—as an additional belief factor [18], influencing attitude toward using. It should be pointed out, however, that pro-environmental attitudes’ should not be considered a completely independent factor as their impact is related to the perception of the channel itself—more environment-oriented consumers are expected to choose, or at least prefer a channel they perceive to be more environment-friendly (which is not necessarily an online purchase), while those less willing to care about environment—not to consider environmental impact of a channel.
There are numerous studies related to channel sustainability and its potential influence on the choice, although surprisingly, the evidence is rather scarce. Ignat and Chankov [40] evaluated if e-commerce customers would change their preferred last-mile delivery when they are provided with additional information on the sustainability impact of the available options. They established that such knowledge, in fact, influences customers and that they are more likely to choose a more sustainable delivery. Nevertheless, this research was focused on e-commerce delivery alternatives, not on general channel choice, and did not cover the potential differences in customers’ opinions related to different levels of environmental awareness. Similar conclusions were presented by Stöckigt et al. [41] in the context of a product choice.
Sustainable shopping orientation, as a latent construct, was also included in the research of place of purchase choice by Cervellon et al. [42]. This attitude expressed willingness to choose sustainable shops and products, and it was operationalised as a tendency to choose organic stores with healthy and environmentally friendly, unprocessed products and being attracted by the local markets, while perception of channel impact on the environment was not included. The research proved that online stores attract consumers with sustainable store orientation, but not those with sustainable product orientation. Authors also noticed that consumers seem to distinguish between eco-friendliness of the online channel and of products being sold there.
Unfortunately, consumers’ perception of environmental friendliness of different channels does not seem to attract much attention in the research, although such perception is discussed when it comes to a product choice [43,44,45] or consumption in general [46,47,48]. Frequently, it is assumed that potential buyers see the difference between channels, often online channels are considered to have less impact on the environment, but no actual evidence of consumers’ opinions is presented. Moreover, it is often assumed that all consumers perceive available channels in the same way, which is not necessarily true.
Nevertheless, the differences between online and conventional channels in terms of their factual or potential impact on the environment were researched, but the results do not seem to be conclusive. Edwards, McKinnon and Cullinane had conducted a comparative analysis of the carbon footprints of conventional and online retailing [49], comparing shopping trips and home delivery, and found that neither has an advantage, yet home delivery is likely to generate less carbon dioxide. The authors, however, pointed out that this conclusion is dependent on the number of items purchased, travel mode and other variables. A similar assumption was presented by Saha et al. [50], who explained that online purchases can support environmental sustainability by reducing the number of shopping trips.
On the other hand, Niu, Mu and Li [51] proved that the online to offline (O2O) model—a solution where customers order a product online but collect it personally, in the conventional store, can reduce traffic congestion and improve trade sustainability. Hischier [52] discussed potential differences between personal travel to shop and online purchase and noticed that the potential impact could be similar, but it is dependent on the means of transport and frequency of shopping. It was also pointed out that the online channel’s environmental impact may be related not only to transportation, but also to the packaging. The sustainability of packaging in e-commerce was also discussed by Escursell et al. [53], while other, possible areas of e-commerce impact on the environment were summarised by Oláh et al. [54], but no comparison or reference to conventional trade was presented.
3. Materials and Methods
3.1. Questionnaire
In order to gather the necessary data, an online questionnaire was developed—adopted items and variables are presented in Table 1. The questionnaire consisted of four parts:
- (a)
- a set of questions related to environmental attitudes;
- (b)
- a set of questions related to the perception of different channels in terms of their environmental impact;
- (c)
- a set of questions related to willingness to purchase in online and conventional shops, and to frequency of online shopping; and
- (d)
- a set of demographic questions.
In the first part, a set of question related to environmental attitudes, was based on two existing approaches: Milfont and Duckitt’s Environmental Attitudes Inventory (EAI) [55] and Environmental Attitudes Scale (EAU) developed by Fernández-Manzanal, Rodríguez-Barreiro and Carrasquer [56]. From EAI, three scales were used: scale 6—environmental fragility, scale 8—personal conservation behaviour and scale 11—eco-centric concern, from each, two items (brief version, EAI-24) were adopted. From the EAU scale, two out of four dimensions were included, C3: Conservation, C4: Disposition to act or Intention—as others were related to university work and students. Three variables from each dimension were used.
Next, two parts of the questionnaire were related to consumers’ perception of the channels and their willingness to use conventional or online shops. The evaluation of the perception was based on three direct questions (CH1-CH3) in which participants were asked, using 7-point semantic scales, whether, in their opinion, a particular channel has a harmful impact on the natural environment or is environmentally neutral. Willingness to purchase online was based on four variables: the fact of considering purchasing over the internet, willingness to choose an online shop, willingness to choose a conventional place of purchase and trust in online shops. All mentioned variables were adopted from the existing research [31,57,58,59,60].

Table 1.
Questionnaire items.
| Item | Variable/Question | Source |
|---|---|---|
| EAI_6_1 | Humans are severely abusing the environment | [55] |
| EAI_6_2 | I do not believe that the environment has been severely abused by humans | |
| EAI_8_1 | Whenever possible, I try to save natural resources | |
| EAI_8_2 | I am NOT the kind of person who makes efforts to conserve natural resources. | |
| EAI_11_1 | It makes me sad to see forests cleared for agriculture | |
| EAI_11_2 | It does NOT make me sad to see natural environments destroyed | |
| C3_1 | The benefits of modern consumer products are more important than the contamination caused by their production and use | [56] |
| C3_2 | The progress of a district should not be held up with the excuse of protecting some birds | |
| C3_3 | I believe that environmental problems are exaggerated, nature balances out over time | |
| C4_1 | If I have to choose between the construction of a motorway and the protection of a plant species, I choose the motorway | |
| C4_2 | I am willing to consume less and go without some comforts if it helps to protect the environment | |
| C4_3 | Even if public transport were more efficient than it currently is, I would still prefer to use my own car | |
| CH1 | Perceived impact on the environment—purchase over the Internet, home delivery | |
| CH2 | Perceived impact on the environment—purchase over the Internet, self-service delivery | |
| CH3 | Perceived impact on the environment—conventional (off-line) purchase | |
| CH4_1 | Willingness to consider purchase over the Internet | |
| CH4_1 | Willingness to choose online shop over conventional one | [57,58,59,60] |
| CH4_1 | willingness to choose conventional shop over the online one | |
| CH4_1 | Trust in online shops | [31] |
| Freq | Frequency of online purchases | |
| D1 | Gender | |
| D2 | Age | |
| D3 | Size of the place of residence |
After the research tool was created, its construction, validity and reliability were tested in a pilot study conducted on a sample of 120 participants. It made it possible to adjust content and wording of questions and thus further minimise potential errors.
3.2. Research Sample
The sample used in the research was obtained commercially, by specialised, Polish research agency BioStat, which carried the research on a random, representative sample of population, using the Internet Opinion Research Panel. In order to provide the structural representation of Polish Internet users, stratified sampling has been used with weights adjusting gender, age and place of residence distributions in the way they would reflect appropriate characteristics of the general population. The structure of the sample is presented in Table 2, Table 3 and Table 4.
The research was conducted in December 2020, the sample included 1000 participants.
3.3. Analysis Procedure
The analysis procedure that was used to evaluate the relationship between environmental attitudes and willingness to choose an online channel of purchase consisted of three steps:
- exploratory factor analysis used to establish hidden variables which represent consumers’ environmental attitudes;
- cluster analysis—used on factors extracted in the previous step, to group consumers with a similar set of attitudes; and
- Kruskal–Wallis nonparametric ANOVA, used to compare differences between members of different clusters in their approach towards online trade, and Friedman’s non-parametric ANOVA test to evaluate differences of perception of different channels within one cluster.
After gathering the data, in the first step of the procedure, an exploratory factor analysis has been used on items EAI, C3 and C4 in order to extract hidden variables, which represent consumers’ attitudes towards the environment and its protection. Kaiser–Meyer–Olkin test proved that such a procedure is valid—Measure of Sampling Adequacy (MSA) is 0.89, while MSAs for particular items are between 0.85 and 0.94. Note that removing lowest-ranking items did not result in a significantly better factoring solution. Additionally, Bartlett’s test of sphericity has been conducted, with chi squared test statistic equal 3705.238 and corresponding p-value lower than 0.001. Therefore, it was assumed that the data was suitable for the factor analysis.
The optimal number of factors was evaluated using several methods. First of all, a scree plot has been generated—it suggested extracting 4 factors. Parallel analysis [61,62] suggested 5 factors, VSS (Very Simple Structure) procedure [63]—3 factors, while sample size adjusted BIC, as reported by the procedure, achieves a minimum with 5 factors. Finally, considering the amount of variance extracted and possibility of logical interpretation of factors, 5 factors were retained.
The procedure was conducted using a minimum residual method and, since the data was assumed to be ordinal, it was based on polychoric correlation matrix [64]. Although it might be beneficial to use oblique rotation, as the lack of correlation between factors, especially those related to quite similar psychological constructs, should not be assumed, an orthogonal (varimax) approach was used instead. The reason behind such a solution was that in the next stage of the procedure obtained factors would be used in cluster analysis, and therefore it would be undesirable if they were not independent (although several solutions for clustering based on correlated variables exist; see, e.g., in [65]). Factors scores were calculated using a method proposed by ten Berge et al. [66].
The parameters of the obtained model suggest its validity and reliability. Cumulative variance explained by 5 established factors (MR1-MR5) reached 0.62, root mean square of residuals is 0.01, while df corrected RMSR—0.02. Tucker–Lewis Index of factoring reliability is 0.993, Bayesian Information Criterion (BIC) reached −86.45 while RMSEA index—0.022. Factors loadings, communalities and Hoffman’s index of complexity are presented in Table 5.
Additionally, the obtained model is fairly logical, and it is possible to introduce a rational interpretation of extracted factors. Factor MR1 is mostly loaded by items representing negative attitudes towards the notion of humanity negatively influencing the environment, therefore it will be named lack of belief in impact. The second factor (MR2) is loaded almost exclusively by one item—willingness to use one’s own car even if effective public transport is available (0.94)—it will be named preference of own car. The situation in which a factor is so strongly loaded by only one item seems to be fairly unique, but it can be, to some degree, attributed to the significant psychological, social and symbolic meaning of a car ownership which can be observed in Poland—the literature provide some grounds for such a hypothesis [68,69,70].
The third factor (MR3) is loaded by items representing awareness of the impact on the environment and general willingness to take actions towards its protection—it will be named environmental concern. The fourth factor (MR4) is related to the balance between a negative impact on the environment and benefits of particular actions—it is loaded by items representing conviction that such benefits outweigh the damage they cause. Therefore, it can be called orientation on benefits. The last, the fifth factor (MR5) is mainly defined by unwillingness to take actions in order to protect the environment, to some degree also by lack of concern, thus it was named personal reluctance.
In the next stage of the research procedure, cluster analysis was employed, in order to identify groups of cases—participants characterised by a similar combination of attitudes, represented by formerly established factors’ values. First, NbClust package [71], which provides 30 indices for determining the optimal number of clusters, including silhouette index [72], Krzanowski and Lai [73], or Caliński-Harabasz [74] indexes, has been used. The number of suggested clusters varied from 2 to 10, while the majority of indices suggested 3 and that number was assumed for further analysis. The final clusters were extracted using partitioning around medoids (PAM) algorithm.
Finally, several variables which represent attitudes towards and the perception of online shopping (items CH and Freq) were compared. Since those variables were considered ordinal, Kurskal–Wallis nonparametric ANOVA test was used to verify the existence of differences between extracted clusters, and Friedman’s ANOVA—to evaluate the differences in channel perception within a cluster. Simultaneously, in order to visualise the scale of the differences, a series of box plots was prepared.
4. Results
4.1. Consumer Classification Based on Attitudes towards the Environment
The described procedure led to the extraction of three clusters, which group customers with a consistent set of attitudes towards the environment. Arithmetic averages of values of all variables used in clustering, for each cluster, are presented in Table 6 and visualised in Figure 1, Figure 2 and Figure 3. Additionally, the Kruskal–Wallis test was used in order to evaluate whether the differences between clusters are significant. Obtained p-values, in all cases lower than 0.001, suggest that in each case at least one cluster is different, in terms of variable distribution, from others. The scope of differences was checked using Dunn’s multiple comparison post hoc test, which proved that
- in the case of environmental concern, lack of belief in impact, orientation on benefits and personal reluctance all clusters significantly differ;
- in the case of preference of own car, there is a significant difference between cluster 1 and cluster 3, and cluster 2 and cluster 3.
Table 6.
Environmental attitudes’ values in clusters.
| Variable | Cluster 1 | Cluster 2 | Cluster 3 | p-Value 1 | |||
|---|---|---|---|---|---|---|---|
| Avg. | Std. Dev. | Avg. | Std. Dev. | Avg. | Std. Dev. | ||
| environmental concern | 0.507 | 0.669 | 0.130 | 0.779 | −0.678 | 1.113 | <0.001 |
| lack of belief in impact | −0.209 | 0.783 | −0.628 | 0.782 | 0.851 | 0.802 | <0.001 |
| orientation on benefits | −0.921 | 0.535 | 0.729 | 0.780 | 0.268 | 0.803 | <0.001 |
| preference of own car | 0.115 | 1.114 | −0.006 | 1.000 | −0.118 | 0.847 | <0.0001 |
| personal reluctance | 0.099 | 0.938 | −0.459 | 0.935 | 0.351 | 0.957 | <0.001 |
1 Kruskal–Wallis test p-value.
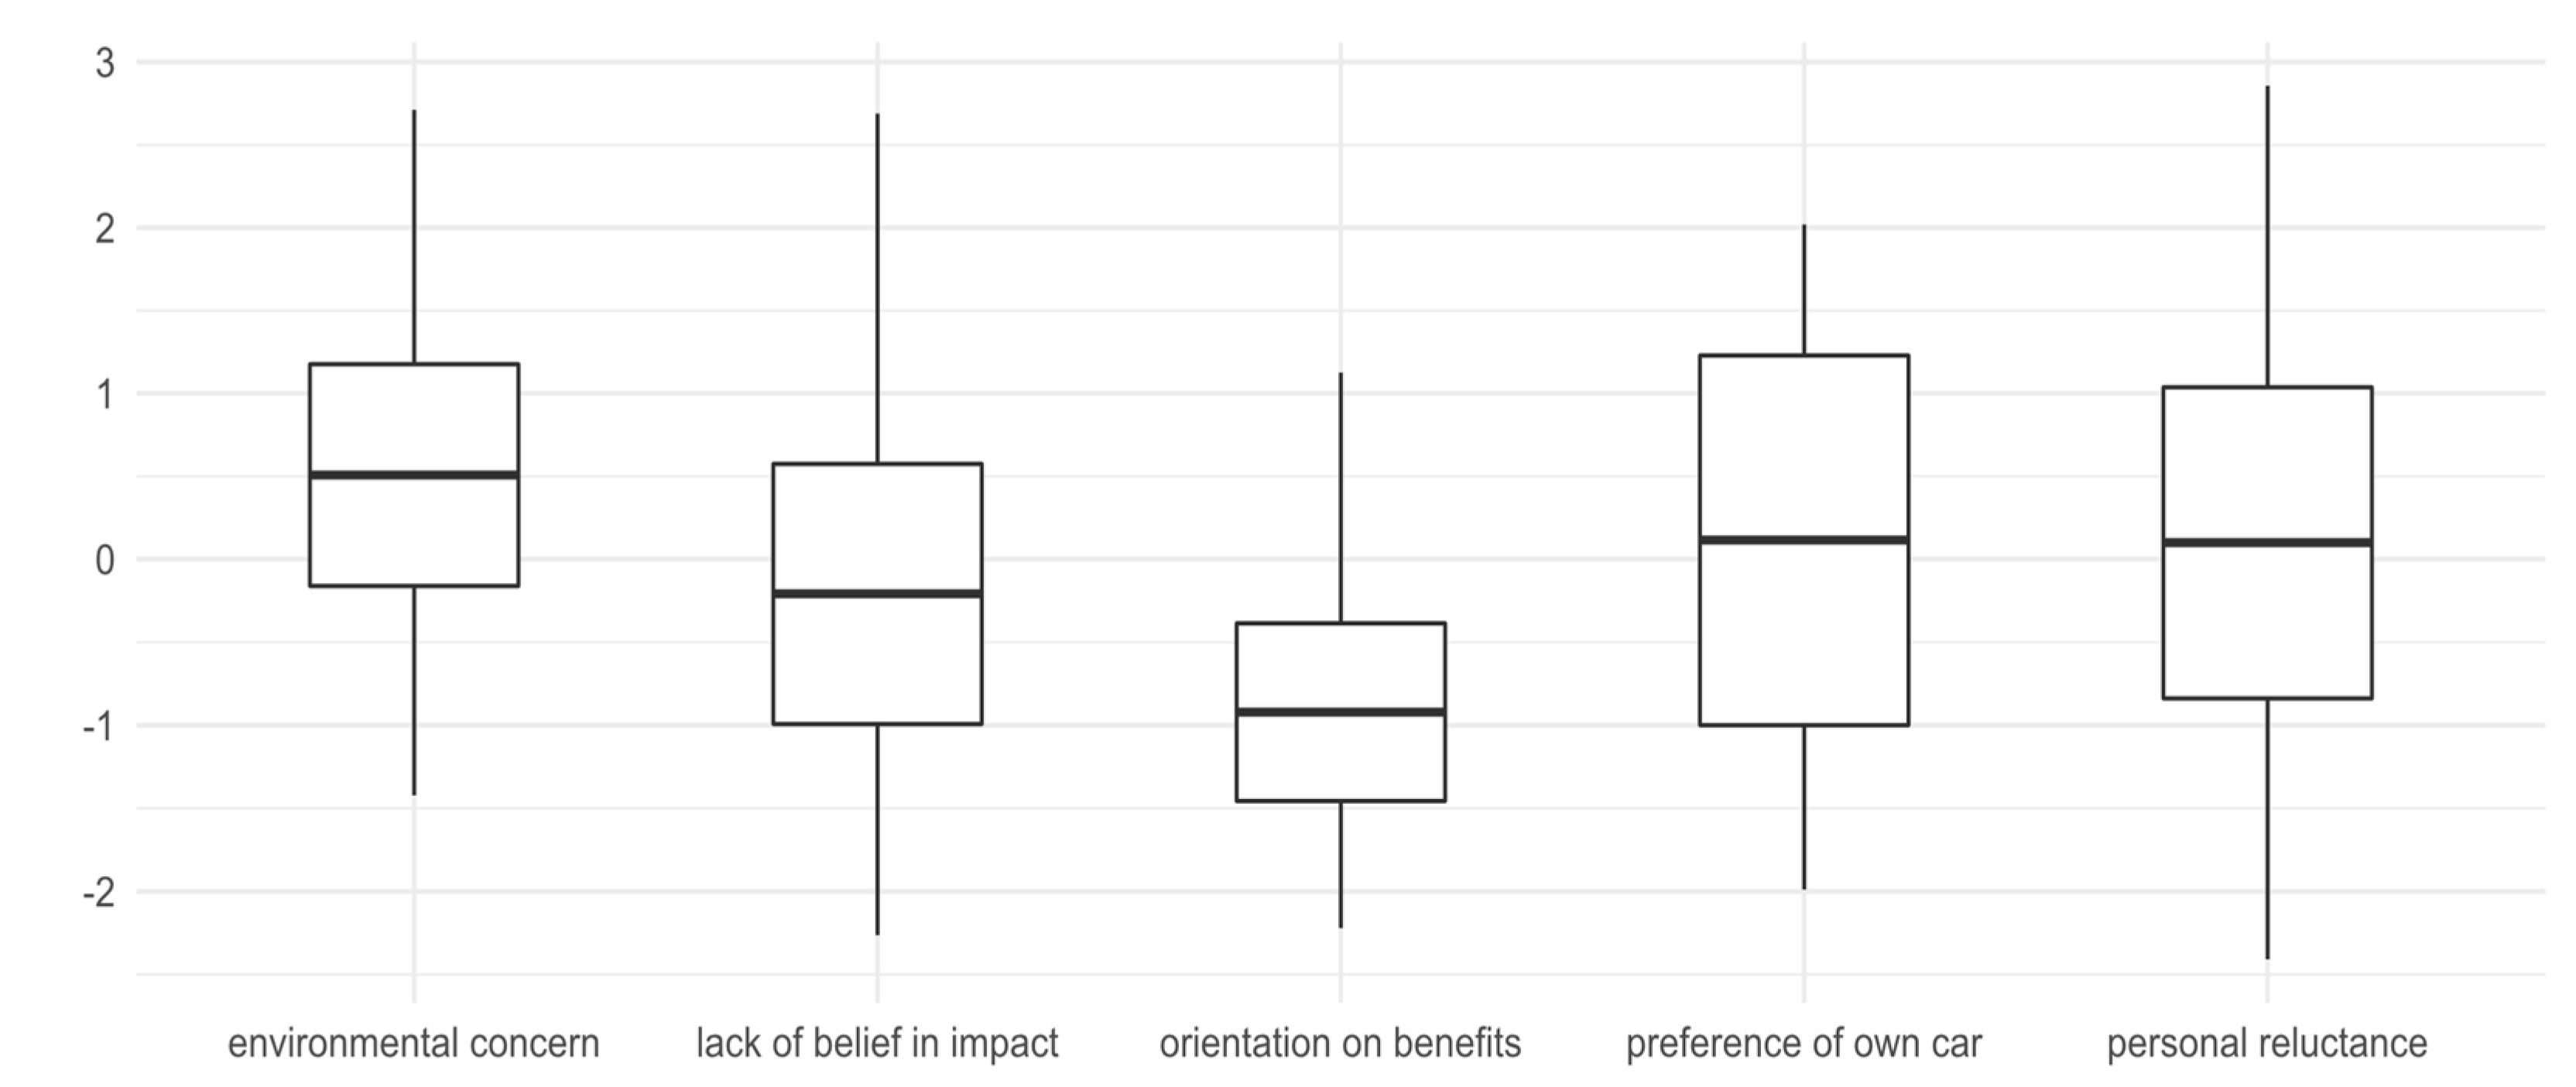
The first defined cluster (cluster 1) gathers customers who express visible environmental concern (0.507), a below-average level of disbelief in a negative impact on the environment (−0.209) and who clearly state that benefits of environment exploitation should never outweigh the damage it could possibly cause (−0.921). Interestingly, that group does not declare behaviours aimed at the environment protection—they prefer their own car instead of mass transport (0.115), although given the standard deviation, opinions significantly vary, they also declare a slightly above-average level of personal reluctance towards such actions (0.099). It may be assumed that consumers gathered in this cluster are aware of possible dangers but not visibly willing to address issues of environment protection in any personal way. Therefore, they were named concerned.
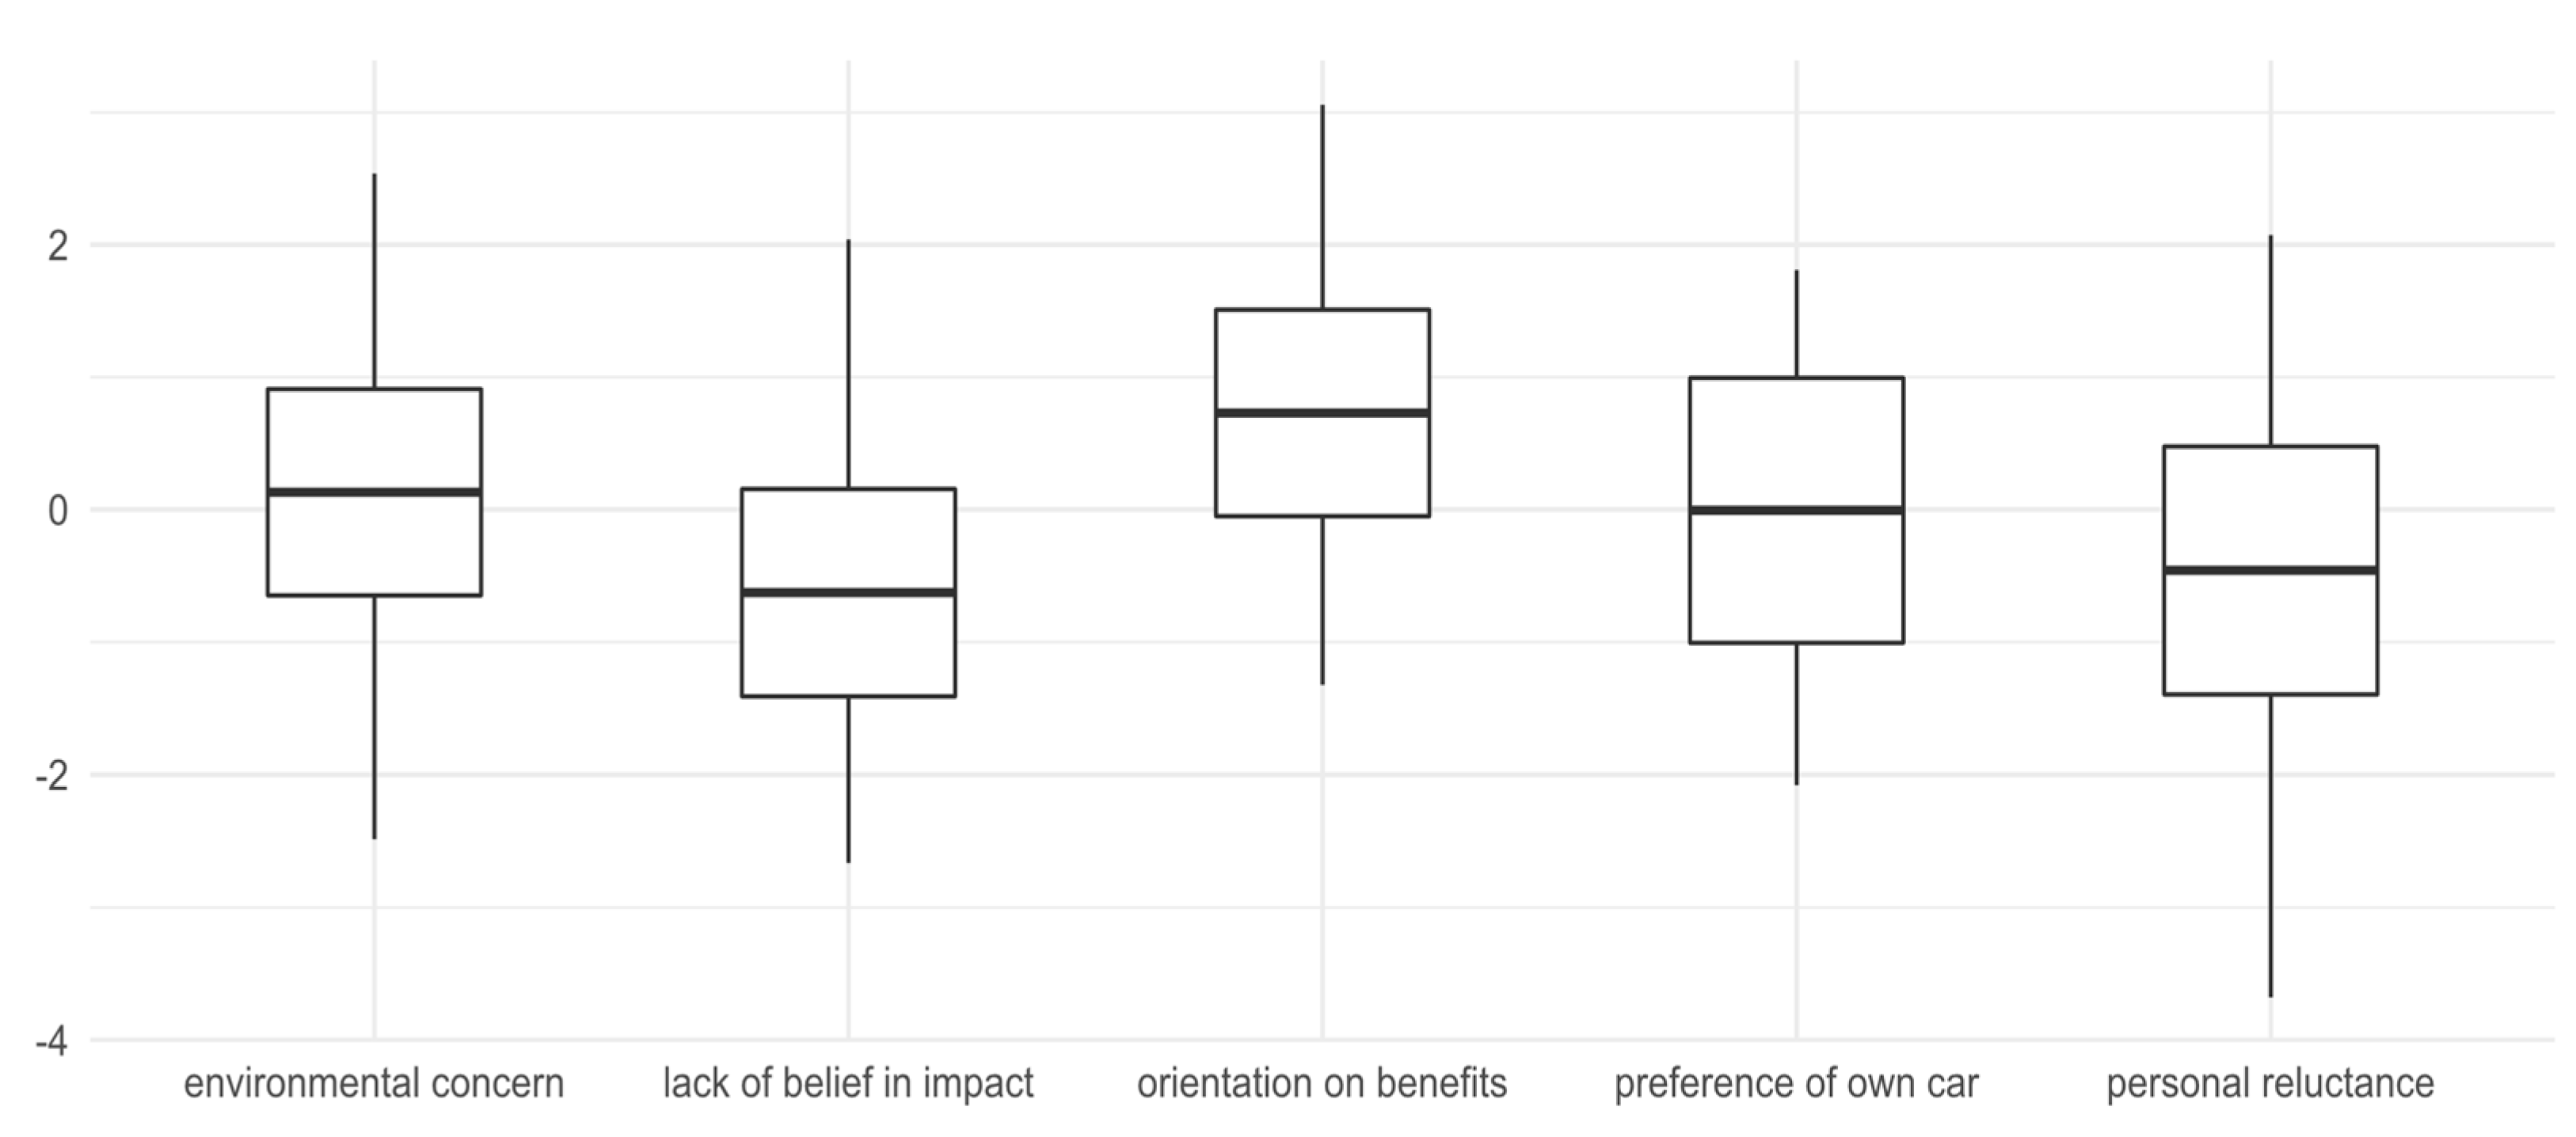
The second extracted cluster groups consumers with a very down-to-earth, realistic approach towards the environment protection. First of all, in this group there is a very strong orientation on the outcome—its members believe that damage done to the environment may be justified by potential benefits related to such actions (orientation on benefits—0.729). Simultaneously, this group strongly believes in the humanity’s impact on the environment (−0.628) and they do not declare personal reluctance towards personal pro-environment behaviours (−0.459). The level of environmental concern is above-average (0.130), preference of own car—average (−0.006), again, with significant standard deviation, which suggests divergence of opinions. Customers grouped in this cluster seem to actively care and protect the environment, but only providing that it does not cause or involve any social or economic costs or sacrifices. Such consumers were named pragmatic.
Figure 1.
Cluster 1 (concerned) profile. A horizontal line represents the arithmetic average of a variable, box—average +/− standard deviation, whiskers—its minimal and maximal value.
Figure 1.
Cluster 1 (concerned) profile. A horizontal line represents the arithmetic average of a variable, box—average +/− standard deviation, whiskers—its minimal and maximal value.

Figure 2.
Cluster 2 (pragmatic) profile. A horizontal line represents the arithmetic average of a variable, box—average +/− standard deviation, whiskers—its minimal and maximal value.
Figure 2.
Cluster 2 (pragmatic) profile. A horizontal line represents the arithmetic average of a variable, box—average +/− standard deviation, whiskers—its minimal and maximal value.

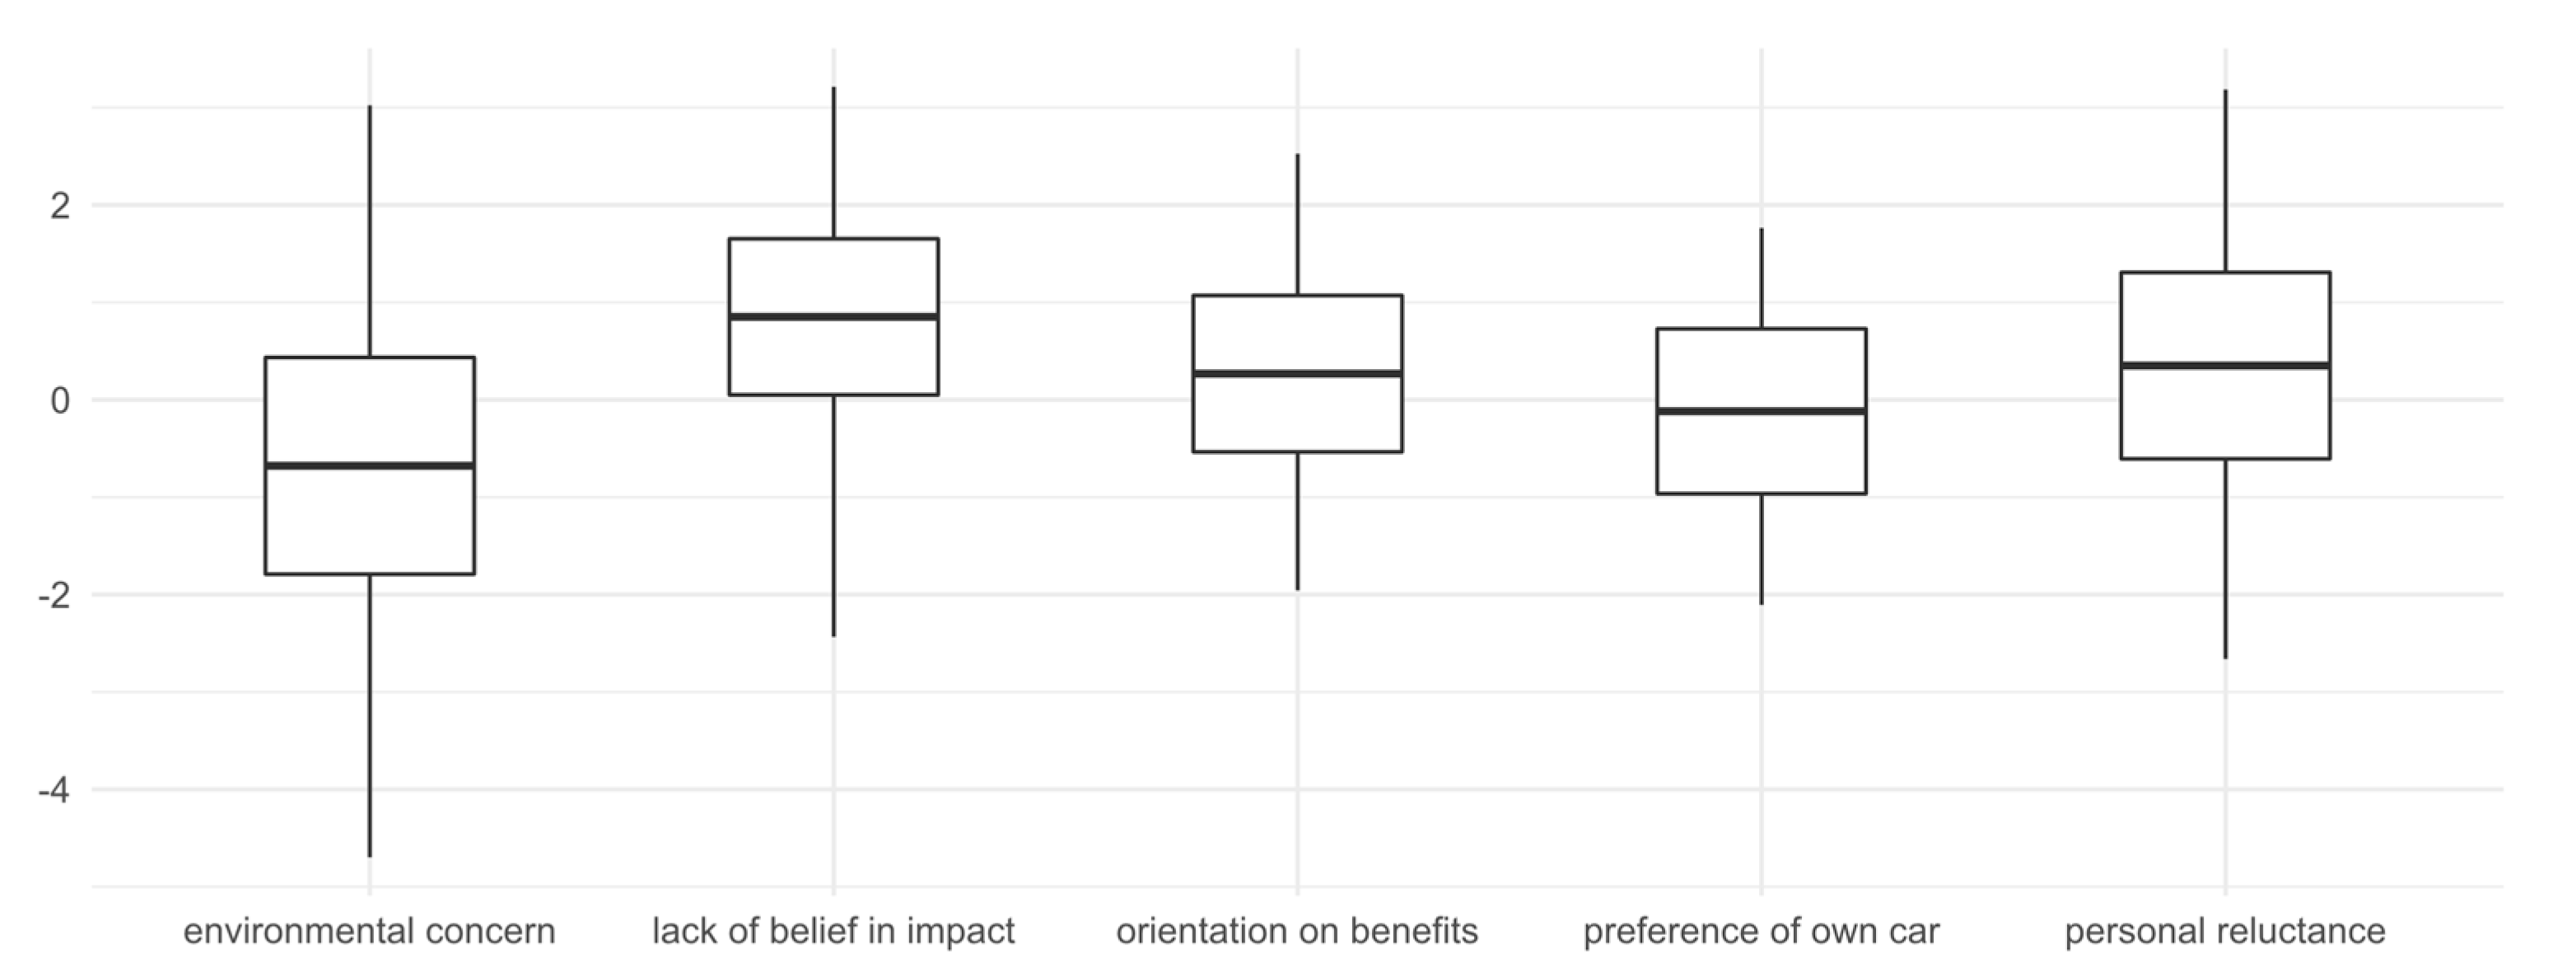
Figure 3.
Cluster 3 (neglecting) profile. A horizontal line represents the arithmetic average of a variable, box—average +/− standard deviation, whiskers—its minimal and maximal value.
Figure 3.
Cluster 3 (neglecting) profile. A horizontal line represents the arithmetic average of a variable, box—average +/− standard deviation, whiskers—its minimal and maximal value.

The last, third cluster groups consumers with the most negative attitudes towards the environment protection. First of all, its members visibly declare a lack of belief in humanity’s negative impact on the natural environment (0.851), they are also reluctant to take any action aimed at protecting it (0.351) and believe that benefits for the society and consumers may outweigh possible negative outcomes of environment abuse (0.268). That group declares a very low level of environmental concern (−0.678), and surprisingly, is willing to use mass transport instead of their own cars (−0.118). Due to such a combination of attitudes, these consumers were named neglecting.
Additionally, as a part of clusters’ evaluation, their demographic structures were assessed (Table 7)—in order to verify to what extent the attitudes defined in each cluster may be a consequence of cluster members’ characteristics. First, this analysis revealed that there are significant differences in the gender structure of each group—the first cluster (concerned) consists of significantly more females, the third one (neglecting)—males, while in the second group (pragmatic) both genders are represented on a similar level.
Second, there is a significant difference (Kruskal–Wallis test p = 0.0183) in the age structure of segments. Post hoc test (Dunn’s multiple comparison test) suggests that this difference may be observed between cluster 2 and 3 (p = 0.0179). Differences between cluster 1 and 3, and 1 and 2 were not significant. Interestingly, qualitative evaluation reveals that members of cluster 3 are younger than these in cluster 2, which, to some degree, contradicts the stereotype that young people are more pro-environmental.
4.2. Environmental Attitudes and Willingness to Purchase Online
The second part of the procedure involved the evaluation of several variables representing attitude towards and willingness to purchase products over the Internet. The aforementioned variables were divided into two groups: one including those representing beliefs that particular channels may have a negative impact on the environment, and the second one, including those representing attitudes towards online and conventional trade. Averages and standard deviations for the discussed variables in particular clusters and in complete samples are presented in Table 8. Additionally, the Kruskal–Wallis test was used in order to evaluate significance of differences between clusters while Friedman’s ANOVA—to compare variables’ distributions within a particular cluster.
Considering three evaluated, possible methods of purchase, significant differences between clusters were observed only in two of them—in case of purchase over the Internet with home delivery (K-W p = 0.0293) and conventional purchase (K-W p = 0.0437), while purchase over the Internet, self-service delivery was not proved to be perceived differently by extracted clusters. The first discussed method (over the Internet, home delivery) is considered fairly neutral (avg. 5.198 in the complete sample), with a slightly lower result (perceived a more negative impact) in the first cluster (concerned, 5.000), higher (less negative) in the second one (pragmatic, 5.244) and the third cluster (neglecting, 5.366). Post hoc test proved that there is a significant difference between cluster 1 and 3, and 2 and 3.
Table 8.
Clusters’ attitudes towards online purchases.
| Variable | Compete Sample | Cluster 1 | Cluster 2 | Cluster 3 | p-Value 1 | ||||
|---|---|---|---|---|---|---|---|---|---|
| Concerned | Pragmatic | Neglecting | |||||||
| Avg. | Std. Dev. | Avg. | Std. Dev. | Avg. | Std. Dev. | Avg. | Std. Dev. | ||
| Perceived, negative impact on the natural environment 2: | |||||||||
| purchase over the Internet, home delivery | 5.198 | 1.631 | 5 | 1.724 | 5.244 | 1.637 | 5.366 | 1.5 | 0.0293 |
| purchase over the Internet, self-service delivery | 5.384 | 1.529 | 5.35 | 1.593 | 5.454 | 1.493 | 5.351 | 1.495 | 0.6041 |
| conventional purchase | 4.844 | 1.481 | 4.738 | 1.556 | 4.806 | 1.452 | 4.997 | 1.417 | 0.0437 |
| p-value 3: | 0.038 | 0.031 | 0.023 | 0.112 | |||||
| Attitudes towards online trade 4: | |||||||||
| trust in online shops | 4.716 | 1.395 | 4.897 | 1.329 | 4.929 | 1.362 | 4.308 | 1.411 | <0.0001 |
| willingness to choose online shop over conventional one | 4.158 | 1.85 | 4.308 | 1.983 | 4.022 | 1.923 | 4.132 | 1.604 | 0.1272 |
| willingness to consider purchase over the Internet | 4.917 | 1.611 | 5.137 | 1.675 | 5.201 | 1.542 | 4.397 | 1.482 | <0.0001 |
| willingness to choose conventional shop over the online one | 3.947 | 1.644 | 3.88 | 1.774 | 3.917 | 1.677 | 4.049 | 1.454 | 0.312 |
1 Kruskal–Wallis test for differences between clusters p-value; 2 the scale included seven, numerical items, with low values representing assuming a negative impact, while high—assuming the particular channel is neutral; 3 Friedman’s ANOVA test for differences between variables’ distributions within a cluster p-value; 4 the scale included seven items, with low values representing negative, while high—positive evaluation of the statement.
Conventional purchase is generally considered to be slightly less neutral in terms of the impact on the natural environment; nevertheless, the obtained average for the complete sample (4.884) does not indicate that it is considered harmful. Comparing averages between clusters leads to similar conclusions as previously—cluster 1 considers this method less neutral (4.738), cluster 2 (4.806) and cluster 3 (4.997)—slightly more neutral. Similarly, post hoc test suggests that a significant difference may be observed between cluster 1 and 3, and 2 and 3.
Additionally, distributions of all three variables were compared within each cluster separately. That test proved that the first two clusters (concerned and pragmatic) consider the evaluated methods of delivery to be different in terms of their impact on the environment. In the case of the third identified cluster (neglecting), however, the test was not significant, which means that they do not perceive such differences between the included methods—it cannot be assumed that the third cluster considers a particular method to be more or less environment-friendly.
The second set of variables expresses attitudes towards online trade. Significant differences between clusters have been observed in the case of two of them—trust in online shops (K-W p < 0.0001) and willingness to consider purchase over the Internet (K-W p < 0.0001), while the values of other two, i.e., willingness to choose online shop over conventional one and preference of conventional shops do not differ significantly between clusters. Trust in online shops is highest within cluster 2 (pragmatic, average 4.929), slightly lower—in cluster 1 (concerned, 4.897) and visibly lower—in cluster 3 (neglecting, 4.308). Even bigger differences are observed in the case of willingness to consider purchase over the Internet—here, again, consumers in cluster 2 are most willing to do so (average 5.201), cluster 1—slightly less (5.137), while members of cluster 3—significantly less (4.397). In both variables, post hoc test proved the difference between clusters 1 and 3, and 2 and 3.
Last, the frequency of online purchases was evaluated (Table 9) in each cluster. Similarly to the previous sets of variables, and also in the case of frequency, differences between clusters are noticed and confirmed by Kruskal–Wallis test (p < 0.0001). Post hoc test reveals that there are significant differences between cluster 1 and 3, and 2 and 3—consumers in the third cluster declare that they buy over the Internet less frequently than those in cluster 1 and 2.
5. Discussion
The presented research resulted in several interesting findings. First of all, it proved that it is possible to find groups of consumers with similar attitudes towards the environment and its protection, and that such groups do not necessarily favour a single-dimensional classification that divides the population into groups of a high and low level of concern about the environment. The research showed that actually individuals who demonstrate a positive level of such concern may differ, especially in terms of willingness to accept abuse of the environment if this would be in some way beneficial to the society or economy. It also ought to be pointed out that pro-environment attitudes do not visibly correlate with the willingness to take action—as it could be noticed in the case of cluster 1. Such a phenomenon has already been noticed in the former research [75].
As it was expected, different channels of purchase are considered to have a different impact on the environment. The differences are small, yet statistically significant—in a complete sample, purchase over the Internet with self-service delivery was considered most neutral (mean average 5.38 on a 7-point scale), purchase over the Internet, home delivery—slightly less (5.20), while conventional purchase—least neutral (4.84), although, given the obtained mean averages’ values, all possible alternatives were considered rather not harmful.
Considering the inconclusive discussion of the channel impact, presented at the beginning, it is impossible to explain whether the population identifies the scale and hierarchy of channels’ levels of neutrality correctly. It could be hypothesised that the online channel is considered more environment-friendly as it is perceived to be more modern or not associated with a personal trip to a shop. Nevertheless, such beliefs could be culture- and country-specific, and may differ in different communities.
Comparing the established clusters proved that in fact there is a difference in perception of environmental friendliness of different channels—both purchase over the Internet with home delivery and conventional purchase are considered more neutral by the less environment-orientated cluster (neglecting, cluster 3), which is a consequence of that cluster not declaring any concern over the environment, and not willing to notice or marginalising the potential impact of the channel. Additionally, that cluster does not see differences between different, evaluated channels, in terms of their impact on the environment.
Surprisingly, purchase over the Internet with self-service delivery does not differ significantly between clusters—perhaps because it is a fairly new and uncommon mode of purchase, and it could not be identified correctly by participants of the research.
The willingness to choose a particular channel also differs between clusters, but only on the cognitive level—expressed by trust and willingness to consider purchase over the Internet—with both pro-environment groups (cluster 1 and cluster 2) more willing to accept online transactions than the third, less environmentally concerned cluster. On the behavioural level, expressed by the declaration of choice of some particular channel, differences between groups are insignificant.
6. Conclusions and Limitations
All the presented data led to the conclusion that there is a visible relationship between attitudes towards the environment, perception of the channels and willingness to, at least, accept, trust in and consider an online channel. Those groups who are more concerned over the environment tend to notice the difference in the environmental impact between different channels, and are more trusting and more willing to consider an online channel, which they perceive to be slightly more neutral, in terms of the impact on the environment.
Although the gathered data do not make it possible to identify the nature of such a relationship, three hypotheses, which could be addressed in future research, may be suggested in order to explain it:
- in fact, there is a direct relationship between the discussed attitudes and the perception of the channel, and customers who are concerned over the environment, more or less consciously prefer or tend to choose a channel they consider more environment-friendly;
- the relationship is caused by an external variable—the income level or affluence of the consumer, which may be related with a higher level of the environmental concern (see in [76,77,78]) and also higher openness to online trade (see in [79,80]; although some research did not find such a relationship [81,82]); and
- the relationship is caused by an external variable—conservativeness and traditionalism of the consumer, which led to less environmentally-concerned attitudes [83,84] and lower willingness to use modern technology, and thus, online purchase channels; it is also reported that the Internet use may be correlated with the pro-environmental behaviour [85].
Regardless of the possible reasons behind the discussed phenomena, the research proves that the compositions and the levels of pro-environmental attitudes as well as a channel perception should be included in models that explain mechanisms behind a channel choice. Future research should be carried out in order to establish, whether the same relationships could be observed on the second dimension of consumer’s decision—that related to the choice of particular vendor.
Additionally, the research proved that consumers’ (and, in general, individuals’) pro-environmental attitudes cannot be reduced to a simple, unidimensional construct described in terms of concern about the environment or the lack thereof. There is a difference between cognitive and behavioural level of environmental concern (also see in [86,87,88]), and other attitudes, here—advantages of the environment usage, may moderate an individual’s perception.
Although the research proved the significance of the pro-environmental attitudes as a factor influencing channel choice, several limitations that should be addressed in the future studies may be pointed out. First of all, the research was related to the channel choice, and, as a consequence, does not answer a question on the difference between willingness to use different entities operating within particular channel and the role of pro-environmental attitudes in moderating it. Particular places of purchase may be of different size, may have different images, different approach to the environment issues etc. All these factors would be identified by potential customers and influence their choice of vendor, which, under special circumstances, may influence the choice of the channel itself. Existing research to some extent already proved that consumers will choose a vendor that is somehow consistent with their own pro-environment attitude [89,90], thus it should be evaluated to what extent consumers would be willing to choose other channel, if no acceptable stores were available in the preferred one.
Second, the research was focused on the role of the mentioned attitudes and did not evaluate the relationship between them and other factors that may possibly influence consumer behaviour, in terms of the choice of a channel, and it should be expected that such factors at least moderate the observed relationship. The trade-off between willingness to choose a pro-environmental channel and willingness to accept higher price, more significant risk or a less acceptable waiting time should also be evaluated, as it could lead to a fairly significant scientific and practical implications. Unfortunately, the size of the research tool made it impossible to include variables related to other areas of consumer activity, and therefore such evaluation is beyond of scope of the presented research.
Funding
This research received no external funding.
Institutional Review Board Statement
Not applicable.
Informed Consent Statement
Not applicable.
Data Availability Statement
The data presented in this study are available on request from the corresponding author.
Conflicts of Interest
The author declares no conflict of interest.
References
- Global Retail E-Commerce Market Size 2014–2023. Available online: https://0-www-statista-com.brum.beds.ac.uk/statistics/379046/worldwide-retail-e-commerce-sales/ (accessed on 15 March 2021).
- Lipsman, A. Global Ecommerce 2019. Available online: https://www.emarketer.com/content/global-ecommerce-2019 (accessed on 15 March 2021).
- United Nations Conference on Trade and Development Imapct of the COVID-19 Pandemic on Trade and Development: Transitioning to a New Normal; United Nations: Geneva, Switzerland, 2020; ISBN 978-92-1-113000-3.
- Salem, M.A.; Nor, K. The effect of COVID-19 on consumer behaviour in Saudi Arabia: Switching from brick and mortar stores to E-Commerce. Int. J. Sci. Technol. Res. 2020, 9, 15–98. [Google Scholar]
- Tran, L.T.T. Managing the effectiveness of e–commerce platforms in a pandemic. J. Retail. Consum. Serv. 2021, 58, 102287. [Google Scholar] [CrossRef]
- Bonilla-Molina, L. Covid-19 on route of the fourth industrial revolution. Postdigital Sci. Educ. 2020, 2, 562–568. [Google Scholar] [CrossRef]
- Alfonso, V.; Boar, C.; Frost, J.; Gambacorta, L.; Liu, J. E-Commerce in the pandemic and beyond. BIS Bull. 2021, 36, 12. [Google Scholar]
- Dennis, C.; Merrilees, B.; Jayawardhena, C.; Tiu Wright, L. E-consumer behaviour. Eur. J. Mark. 2009, 43, 1121–1139. [Google Scholar] [CrossRef] [Green Version]
- Cummins, S.; Peltier, J.W.; Schibrowsky, J.A.; Nill, A. Consumer behavior in the online context. J. Res. Interact. Mark. 2014, 8, 169–202. [Google Scholar] [CrossRef]
- Jaciow, M.; Wolny, R.; Stolecka-Makowska, A.; Świątek, A. Wydawnictwo Helion E-Consumer in Europe: Comparative Analysis of Behaviours; Helion: Gliwice, Poland, 2013; ISBN 978-83-246-8188-4. [Google Scholar]
- Nisar, T.M.; Prabhakar, G. What factors determine e–satisfaction and consumer spending in e–commerce retailing? J. Retail. Consum. Serv. 2017, 39, 135–144. [Google Scholar] [CrossRef]
- Lee, P.M. Behavioral model of online purchasers in e–commerce environment. Electron. Commer. Res. 2002, 2, 75–85. [Google Scholar] [CrossRef]
- Mavlanova, T.; Benbunan-Fich, R.; Lang, G. The role of external and internal signals in e–commerce. Decis. Support. Syst. 2016, 87, 59–68. [Google Scholar] [CrossRef]
- Huseynov, F.; Özkan Yıldırım, S. Online consumer typologies and their shopping behaviors in B2C e–commerce platforms. SAGE Open 2019, 9, 2158244019854639. [Google Scholar] [CrossRef]
- Shang, R.A.; Chen, Y.C.; Shen, L. Extrinsic versus intrinsic motivations for consumers to shop on–line. Inf. Manag. 2005, 42, 401–413. [Google Scholar] [CrossRef]
- Pusatli, T.; Akman, I. Exploring supportive and deterrent factors on online shopping in a developing country. Res. Anthol. E-Commer. Adopt. Models Appl. Mod. Bus. 2021, 12, 1290–1312. [Google Scholar] [CrossRef]
- Saxena, E.; Gupta, D.D. Factors influencing online shopping behaviour: A review of motivating and deterrent factors. Mark. Rev. 2018, 18, 3–24. [Google Scholar] [CrossRef]
- Marangunić, N.; Granić, A. Technology acceptance model: A literature review from 1986 to 2013. Univers. Access Inf. Soc. 2015, 14, 81–95. [Google Scholar] [CrossRef]
- Venkatesh, V.; Davis, F.D. A Theoretical extension of the technology acceptance model: Four longitudinal field studies. Manag. Sci. 2000, 46, 186–204. [Google Scholar] [CrossRef] [Green Version]
- Legris, P.; Ingham, J.; Collerette, P. Why do people use information technology? A critical review of the technology acceptance model. Inf. Manag. 2003, 40, 191–204. [Google Scholar] [CrossRef]
- Keen, C.; Wetzels, M.; de Ruyter, K.; Feinberg, R. E-Tailers versus retailers: Which factors determine consumer preferences. J. Bus. Res. 2004, 57, 685–695. [Google Scholar] [CrossRef]
- Chiang, K.P.; Dholakia, R.R. Factors driving consumer intention to shop online: An empirical investigation. J. Consum. Psychol. 2003, 13, 177–183. [Google Scholar] [CrossRef]
- Konus, U.; Verhoef, P.; Neslin, S. Multichannel shopper segments and their covariates. J. Retail. 2008, 84, 398–413. [Google Scholar] [CrossRef]
- Haridasan, A.C.; Fernando, A.G. Online or in-store: Unravelling consumer’s channel choice motives. J. Res. Interact. Mark. 2018, 12, 215–230. [Google Scholar] [CrossRef]
- Alba, J.; Lynch, J.; Weitz, B.; Janiszewski, C.; Lutz, R.; Sawyer, A.; Wood, S. Interactive home shopping: Consumer, retailer, and manufacturer incentives to participate in electronic marketplaces. J. Mark. 1997, 61, 38–53. [Google Scholar] [CrossRef] [Green Version]
- Frasquet, M.; Mollá, A.; Ruiz, E. Identifying patterns in channel usage across the search, purchase and post–sales stages of shopping. Electron. Commer. Res. Appl. 2015, 14, 654–665. [Google Scholar] [CrossRef] [Green Version]
- Slyke, C.V.; Bélanger, F.; Johnson, R.D.; Hightower, R. Gender–based differences in consumer e-commerce adoption. Commun. Assoc. Inf. Syst. 2010, 26, 17–34. [Google Scholar] [CrossRef]
- Hwang, Y. The moderating effects of gender on e–commerce systems adoption factors: An empirical investigation. Comput. Hum. Behav. 2010, 26, 1753–1760. [Google Scholar] [CrossRef]
- Kushwaha, T.; Shankar, V. Are multichannel customers really more valuable? The moderating role of product category characteristics. J. Mark. 2013, 77, 67–85. [Google Scholar] [CrossRef] [Green Version]
- Chocarro, R.; Cortiñas, M.; Villanueva, M.L. Situational variables in online versus offline channel choice. Electron. Commer. Res. Appl. 2013, 12, 347–361. [Google Scholar] [CrossRef] [Green Version]
- Perea y Monsuwé, T.; Dellaert, B.G.C.; de Ruyter, K. What drives consumers to shop online? A literature review. Int. J. Serv. Ind. Manag. 2004, 15, 102–121. [Google Scholar] [CrossRef] [Green Version]
- Valentini, S.; Montaguti, E.; Neslin, S.A. Decision process evolution in customer channel choice. J. Mark. 2011, 75, 72–86. [Google Scholar] [CrossRef]
- Chatterjee, P. Multiple-channel and cross-channel shopping behavior: Role of consumer shopping orientations. Mark. Intell. Plan. 2010, 28, 9–24. [Google Scholar] [CrossRef]
- BEZES, C. Comparing online and in–store risks in multichannel shopping. Int. J. Retail. Distrib. Manag. 2016, 44. [Google Scholar] [CrossRef]
- Lu, Q.S.; Pattnaik, C.; Xiao, J.; Voola, R. Cross–national variation in consumers’ retail channel selection in a multichannel environment: Evidence from Asia-Pacific countries. J. Bus. Res. 2018, 86, 321–332. [Google Scholar] [CrossRef]
- Pavlou, P.A.; Fygenson, M. Understanding and predicting electronic commerce adoption: An extension of the theory of planned behavior. MIS Q. Manag. Inf. Syst. 2006, 30, 115–143. [Google Scholar] [CrossRef]
- Spangenberg, E.R.; Sprott, D.E.; Grohmann, B.; Tracy, D.L. Gender–congruent ambient scent influences on approach and avoidance behaviors in a retail store. J. Bus. Res. 2006, 59, 1281–1287. [Google Scholar] [CrossRef]
- Trenz, M. Multichannel Commerce: A Consumer Perspective on the Integration of Physical and Electronic Channels; Springer: Cham, Switzerland, 2015; ISBN 978-3-319-16115-0. [Google Scholar]
- Neslin, S.A.; Grewal, D.; Leghorn, R.; Shankar, V.; Teerling, M.L.; Thomas, J.S.; Verhoef, P.C. Challenges and opportunities in multichannel customer management. J. Serv. Res. 2006, 9, 95–112. [Google Scholar] [CrossRef]
- Ignat, B.; Chankov, S. Do e–commerce customers change their preferred last–mile delivery based on its sustainability impact? Int. J. Logist. Manag. 2020, 31, 521–548. [Google Scholar] [CrossRef]
- Stöckigt, G.; Schiebener, J.; Brand, M. Providing sustainability information in shopping situations contributes to sustainable decision making: An empirical study with choice–based conjoint analyses. J. Retail. Consum. Serv. 2018, 43, 188–199. [Google Scholar] [CrossRef]
- Cervellon, M.C.; Sylvie, J.; Ngobo, P.V. Shopping orientations as antecedents to channel choice in the French grocery multichannel landscape. J. Retail. Consum. Serv. 2015, 27, 31–51. [Google Scholar] [CrossRef]
- Skowron, L.; Sak-Skowron, M. Environmental sensitivity and awareness as differentiating factors in the purchase decision-making process in the smartphone industry–case of polish consumers. Sustainability 2021, 13, 348. [Google Scholar] [CrossRef]
- Moisander, J.; Markkula, A.; Eräranta, K. Construction of consumer choice in the market: Challenges for environmental policy. Int. J. Consum. Stud. 2010, 34, 73–79. [Google Scholar] [CrossRef]
- Rokka, J.; Uusitalo, L. Preference for green packaging in consumer product choices–do consumers care? Int. J. Consum. Stud. 2008, 32, 516–525. [Google Scholar] [CrossRef]
- Skowron, S.; Szymoniuk, B. Marketing and Sustainable Development; Social Science Research Network: Rochester, NY, USA, 2014. [Google Scholar]
- Jackson, T. Sustainable Consumption. In Handbook of Sustainable Development; Edward Elgar Publishing: Cheltenham, UK, 2014. [Google Scholar]
- Seyfang, G. The New Economics of Sustainable Consumption: Seeds of Change; Springer: Cham, Switzerland, 2008; ISBN 978-0-230-23450-5. [Google Scholar]
- Edwards, J.B.; McKinnon, A.C.; Cullinane, S.L. Comparative analysis of the carbon footprints of conventional and online retailing: A “last mile” perspective. Int. J. Phys. Distrib. Logist. Manag. 2010, 40, 103–123. [Google Scholar] [CrossRef]
- Saha, S.K.; Duarte, P.; Silva, S.C.; Zhuang, G. Supporting sustainability by promoting online purchase through enhancement of online convenience. Environ. Dev. Sustain. 2020, 23, 7251–7272. [Google Scholar] [CrossRef]
- Niu, B.; Mu, Z.; Li, B. O2O Results in traffic congestion reduction and sustainability improvement: Analysis of “Online-to-Store” channel and uniform pricing strategy. Transp. Res. Part E Logist. Transp. Rev. 2019, 122, 481–505. [Google Scholar] [CrossRef]
- Hischier, R. Car vs. packaging–a first, simple (environmental) sustainability assessment of our changing shopping behaviour. Sustainability 2018, 10, 3061. [Google Scholar] [CrossRef] [Green Version]
- Escursell, S.; Llorach-Massana, P.; Roncero, M.B. Sustainability in e–commerce packaging: A review. J. Clean. Prod. 2021, 280, 124314. [Google Scholar] [CrossRef] [PubMed]
- Oláh, J.; Kitukutha, N.; Haddad, H.; Pakurár, M.; Máté, D.; Popp, J. Achieving sustainable e-commerce in environmental, social and economic dimensions by taking possible trade–offs. Sustainability 2019, 11, 89. [Google Scholar] [CrossRef] [Green Version]
- Milfont, T.L.; Duckitt, J. The environmental attitudes inventory: A valid and reliable measure to assess the structure of environmental attitudes. J. Environ. Psychol. 2010, 30, 80–94. [Google Scholar] [CrossRef]
- Fernández-Manzanal, R.; Rodríguez-Barreiro, L.; Carrasquer, J. Evaluation of environmental attitudes: Analysis and results of a scale applied to university students. Sci. Educ. 2007, 91, 988–1009. [Google Scholar] [CrossRef]
- Maxwell, S. Rule–based price fairness and its effect on willingness to purchase. J. Econ. Psychol. 2002, 23, 191–212. [Google Scholar] [CrossRef]
- Zielke, S.; Dobbelstein, T. Customers’ willingness to purchase new store brands. J. Prod. Brand Manag. 2007, 16, 112–121. [Google Scholar] [CrossRef] [Green Version]
- Poushneh, A.; Vasquez-Parraga, A.Z. Discernible impact of augmented reality on retail customer’s experience, satisfaction and willingness to buy. J. Retail. Consum. Serv. 2017, 34, 229–234. [Google Scholar] [CrossRef]
- Mannan, M.; Ahamed, R.; Zaman, S.B. Consumers’ willingness to purchase online mental health services. J. Serv. Mark. 2019, 33, 557–571. [Google Scholar] [CrossRef]
- Horn, J.L. A rationale and test for the number of factors in factor analysis. Psychometrika 1965, 30, 179–185. [Google Scholar] [CrossRef]
- Hayton, J.C.; Allen, D.G.; Scarpello, V. Factor retention decisions in exploratory factor analysis: A tutorial on parallel analysis. Organ. Res. Methods 2004, 7, 191–205. [Google Scholar] [CrossRef]
- Revelle, W.; Rocklin, T. Very simple structure: An alternative procedure for estimating the optimal number of interpretable factors. Multivar. Behav. Res. 1979, 14, 403–414. [Google Scholar] [CrossRef] [PubMed]
- Holgado–Tello, F.P.; Chacón–Moscoso, S.; Barbero–García, I.; Vila–Abad, E. Polychoric versus pearson correlations in exploratory and confirmatory factor analysis of ordinal variables. Qual. Quant. 2008, 44, 153–166. [Google Scholar] [CrossRef]
- Zhang, H.; Zou, Y.; Terry, W.; Karmaus, W.; Arshad, H. Joint clustering with correlated variables. Am. Stat. 2019, 73, 296–306. [Google Scholar] [CrossRef] [Green Version]
- Ten Berge, J.M.F.; Krijnen, W.P.; Wansbeek, T.; Shapiro, A. Some new results on correlation–preserving factor scores prediction methods. Linear Algebra Its Appl. 1999, 289, 311–318. [Google Scholar] [CrossRef] [Green Version]
- Hofmann, R.J. Complexity And simplicity as objective indices descriptive of factor solutions. Multivar. Behav. Res. 1978, 13, 247–250. [Google Scholar] [CrossRef]
- Kołsut, B. The import of used cars to poland after EU accession. Pr. Kom. Geogr. Przem. Pol. Tow. Geogr. 2020, 34, 129–143. [Google Scholar] [CrossRef]
- Jastrząb, M. Cars as Favors in People’s Poland; Cornell University Press: Ithaca, NY, USA, 2013; pp. 30–46. ISBN 978-0-8014-6321-1. [Google Scholar]
- Melosik, Z. Samochód, Tożsamość i płeć Kulturowa; Wydawnictwo Naukowe UAM: Poznań, Poland, 2015; ISBN 978-83-232-2958-2. [Google Scholar]
- Charrad, M.; Ghazzali, N.; Boiteau, V.; Niknafs, A. NbClust: An R package for determining the relevant number of clusters in a data set. J. Stat. Softw. 2014, 61, 1–36. [Google Scholar] [CrossRef] [Green Version]
- Rousseeuw, P.J. Silhouettes: A graphical aid to the interpretation and validation of cluster analysis. J. Comput. Appl. Math. 1987, 20, 53–65. [Google Scholar] [CrossRef] [Green Version]
- Krzanowski, W.J.; Lai, Y.T. A criterion for determining the number of groups in a data set using sum-of–squares clustering. Biometrics 1988, 44, 23–34. [Google Scholar] [CrossRef]
- Caliński, T.; Harabasz, J. A dendrite method for cluster analysis. Commun. Stat. 1974, 3, 1–27. [Google Scholar] [CrossRef]
- Asvatourian, V.; Craig, T.; Horgan, G.W.; Kyle, J.; Macdiarmid, J.I. Relationship between pro–environmental attitudes and behaviour and dietary intake patterns. Sustain. Prod. Consum. 2018, 16, 216–226. [Google Scholar] [CrossRef] [Green Version]
- Martinsson, J.; Lundqvist, L.J.; Sundström, A. Energy saving in Swedish households. The (relative) importance of environmental attitudes. Energy Policy 2011, 39, 5182–5191. [Google Scholar] [CrossRef]
- Scott, D.; Willits, F.K. Environmental attitudes and behavior: A Pennsylvania survey. Environ. Behav. 1994, 26, 239–260. [Google Scholar] [CrossRef]
- Franzen, A.; Vogl, D. Two decades of measuring environmental attitudes: A comparative analysis of 33 countries. Glob. Environ. Chang. 2013, 23, 1001–1008. [Google Scholar] [CrossRef]
- Rossolov, A.; Rossolova, H.; Holguín-Veras, J. Online and in–store purchase behavior: Shopping channel choice in a developing economy. Transportation 2021, 48, 1–37. [Google Scholar] [CrossRef]
- Bryła, P. Organic food online shopping in Poland. Br. Food J. 2018, 120, 1015–1027. [Google Scholar] [CrossRef]
- Hernández, B.; Jiménez, J.; José Martín, M. Age, gender and income: Do they really moderate online shopping behaviour? Online Inf. Rev. 2011, 35, 113–133. [Google Scholar] [CrossRef] [Green Version]
- Kalia, P. Does demographics affect purchase frequency in online retail? Int. J. Online Mark. IJOM 2017, 7, 42–56. [Google Scholar] [CrossRef]
- Feygina, I.; Jost, J.T.; Goldsmith, R.E. System justification, the denial of global warming, and the possibility of “system–san–tioned change. ” Pers. Soc. Psychol. Bull. 2010, 36, 326–338. [Google Scholar] [CrossRef] [Green Version]
- Hamilton, L.C. Education, politics and opinions about climate change evidence for interaction effects. Clim. Chang. 2011, 104, 231–242. [Google Scholar] [CrossRef]
- Gong, X.; Zhang, J.; Zhang, H.; Cheng, M.; Wang, F.; Yu, N. Internet use encourages pro–environmental behavior: Evidence from China. J. Clean. Prod. 2020, 256, 120725. [Google Scholar] [CrossRef]
- Casaló, L.V.; Escario, J.J. Heterogeneity in the association between environmental attitudes and pro–environmental behavior: A multilevel regression approach. J. Clean. Prod. 2018, 175, 155–163. [Google Scholar] [CrossRef]
- Liu, P.; Teng, M.; Han, C. How does environmental knowledge translate into pro–environmental behaviors?: The mediating role of environmental attitudes and behavioral intentions. Sci. Total Environ. 2020, 728, 138126. [Google Scholar] [CrossRef]
- Tamar, M.; Wirawan, H.; Arfah, T.; Putri, R.P.S. Predicting pro–environmental behaviours: The role of environmental values, attitudes and knowledge. Manag. Environ. Qual. Int. J. 2020, 32, 328–343. [Google Scholar] [CrossRef]
- Cicia, G.; Furno, M.; Del Giudice, T. Do consumers’ values and attitudes affect food retailer choice? Evidence from a national survey on farmers’ market in Germany. Agric. Food Econ. 2021, 9, 3. [Google Scholar] [CrossRef]
- Nguyen, H.V.; Nguyen, N.; Nguyen, B.K.; Lobo, A.; Vu, P.A. Organic food purchases in an emerging market: The influence of consumers’ personal factors and green marketing practices of food stores. Int. J. Environ. Res. Public Health 2019, 16, 1037. [Google Scholar] [CrossRef] [PubMed] [Green Version]
Table 2.
Sample structure—gender.
| Gender | Quantity | % |
|---|---|---|
| Females | 501 | 50.10% |
| Males | 499 | 49.90% |
| Total | 1000 | 100.00% |
Table 3.
Sample structure—age.
| Age | Quantity | % |
|---|---|---|
| 18 to 24 | 127 | 12.70% |
| 25 to 34 | 241 | 24.10% |
| 35 to 44 | 258 | 25.80% |
| 45 to 54 | 168 | 16.80% |
| 55 to 64 | 135 | 13.50% |
| 65 and more | 71 | 7.10% |
| Total | 1000 | 100.00% |
Table 4.
Sample structure—place of residence.
| Place of Residence | Quantity | % |
|---|---|---|
| Rural areas | 201 | 20.10 |
| Cities up to 20,000 residents | 87 | 8.70 |
| Cities from 20,000 to 50,000 residents | 163 | 16.30 |
| Cities from 51,000 to 100,000 residents | 212 | 21.20 |
| Cities bigger than 100,000 residents | 337 | 33.70 |
| Total | 1000 | 100.00% |
Table 5.
Exploratory factor analysis—factor loadings.
| Item | MR3 | MR1 | MR4 | MR2 | MR5 | h2 | u2 | com |
|---|---|---|---|---|---|---|---|---|
| C3_1 | −0.20 | 0.41 | 0.44 | 0.13 | 0.32 | 0.52 | 0.48 | 3.5 |
| C3_2 | −0.17 | 0.22 | 0.79 | 0.07 | 0.12 | 0.72 | 0.28 | 1.3 |
| C3_3 | −0.32 | 0.60 | 0.37 | 0.10 | 0.26 | 0.68 | 0.32 | 2.8 |
| C4_1 | −0.16 | 0.25 | 0.58 | 0.16 | 0.13 | 0.47 | 0.53 | 1.8 |
| C4_2 | 0.67 | −0.04 | −0.20 | −0.14 | −0.13 | 0.53 | 0.47 | 1.4 |
| C4_3 | −0.07 | 0.10 | 0.16 | 0.94 | 0.08 | 0.94 | 0.06 | 1.1 |
| EAI_11_1 | 0.58 | −0.28 | −0.18 | 0.01 | −0.08 | 0.45 | 0.55 | 1.7 |
| EAI_11_2 | −0.24 | 0.49 | 0.31 | 0.00 | 0.32 | 0.49 | 0.51 | 3.1 |
| EAI_6_1 | 0.67 | −0.51 | −0.17 | 0.02 | 0.06 | 0.75 | 0.25 | 2.0 |
| EAI_6_2 | −0.23 | 0.72 | 0.28 | 0.14 | 0.18 | 0.70 | 0.30 | 1.7 |
| EAI_8_1 | 0.72 | −0.20 | −0.05 | −0.05 | −0.37 | 0.70 | 0.30 | 1.7 |
| EAI_8_2 | −0.22 | 0.26 | 0.25 | 0.10 | 0.56 | 0.50 | 0.50 | 2.3 |
h2—communalities, u2—uniqueness (1-h2), com—Hoffman’s index of complexity [67].
Table 7.
Clusters’ demographic structures.
| Cluster 1 | Cluster 2 | Cluster 3 | |
|---|---|---|---|
| Concerned | Pragmatic | Neglecting | |
| Gender | |||
| females | 59.30% | 48.80% | 41.50% |
| males | 40.70% | 51.20% | 58.50% |
| Age | |||
| 18 to 24 | 13.96% | 10.80% | 13.23% |
| 25 to 34 | 21.08% | 21.30% | 30.15% |
| 35 to 44 | 27.64% | 26.23% | 23.38% |
| 45 to 54 | 15.10% | 19.75% | 15.69% |
| 55 to 64 | 15.10% | 12.35% | 12.92% |
| 65 and more | 7.12% | 9.57% | 4.62% |
Table 9.
Frequency of online shopping.
| Compete | Cluster 1 | Cluster 2 | Cluster 3 | |
|---|---|---|---|---|
| Sample | Concerned | Pragmatic | Neglecting | |
| Never | 1.40% | 0.57% | 0.93% | 2.77% |
| Several times a year | 27.00% | 22.79% | 19.75% | 38.77% |
| At least once a month | 51.40% | 51.28% | 58.95% | 44.00% |
| At least once a week | 20.20% | 25.36% | 20.37% | 14.46% |
Publisher’s Note: MDPI stays neutral with regard to jurisdictional claims in published maps and institutional affiliations. |
© 2021 by the author. Licensee MDPI, Basel, Switzerland. This article is an open access article distributed under the terms and conditions of the Creative Commons Attribution (CC BY) license (https://creativecommons.org/licenses/by/4.0/).
Share and Cite
MDPI and ACS Style
Gąsior, M. Environmental Attitudes and Willingness to Purchase Online—Classification Approach. Sustainability 2021, 13, 8592. https://0-doi-org.brum.beds.ac.uk/10.3390/su13158592
AMA Style
Gąsior M. Environmental Attitudes and Willingness to Purchase Online—Classification Approach. Sustainability. 2021; 13(15):8592. https://0-doi-org.brum.beds.ac.uk/10.3390/su13158592
Chicago/Turabian StyleGąsior, Marcin. 2021. "Environmental Attitudes and Willingness to Purchase Online—Classification Approach" Sustainability 13, no. 15: 8592. https://0-doi-org.brum.beds.ac.uk/10.3390/su13158592
Note that from the first issue of 2016, this journal uses article numbers instead of page numbers. See further details here.