
Techno-Assessment of the Use of Recycled Plastic Waste in RE


1
Sustainable Engineering Group, School of Civil and Mechanical Engineering, Curtin University, Perth, WA 6845, Australia
2
Centre for Infrastructural Monitoring and Protection, School of Civil and Mechanical Engineering, Curtin University, Perth, WA 6845, Australia
*
Author to whom correspondence should be addressed.
Sustainability 2021, 13(16), 8678; https://0-doi-org.brum.beds.ac.uk/10.3390/su13168678
Submission received: 6 July 2021
/
Revised: 29 July 2021
/
Accepted: 30 July 2021
/
Published: 4 August 2021
(This article belongs to the Special Issue Trends in Waste Utilization in Construction)
Abstract
:Effectively consumed plastic waste is an emerging technical and social issue for Australia. Adding plastic waste into construction material and ensuring minimised impact to the mechanical performance of the construction material could bring significant benefits. In this study, plastic waste material was mixed into cement-stabilised rammed earth (RE) material for brick manufacture. Techno framework consisting of compressive strength test and split tensile strength derivation for structural performance assessment and life cycle assessment for determining EE(EE) performance was applied to compare recycled high-density polyethylene (HDPE) added RE with conventional bricks. The compressive properties of different mixtures were studied. The replacement of conventional rock aggregates in stabilised RE brick with recycled plastic waste was found to improve the structural mechanical performance with the developed composition. Following this, an EE analysis was important to assess whether these waste-based bricks can improve environmental performance in a cost-competitive manner while maintaining structural performance. The increase of recycled HDPE in RE was found to likely affect the EE performance of RE, which could possibly be overcome by using less energy-intensive cementitious materials and recycled HDPE.
1. Introduction
The diversion rate of plastic wastes from landfill is a challenging issue mainly due to significant decrease in the export of scrap plastics to China [1]. This situation demands more reprocessors and recyclers. In a situation where there is a very small market for recycled plastic, the growth of recyclers is difficult. Only around 2% of plastic waste is reprocessed and the rest ends up in landfill. Since these plastics are not biodegradable, they remain in the environment for decades to centuries and can kill birds and marine species like coral reefs. In addition, incineration of plastics for energy extraction also generates more carbon than disposing them into landfill [2].
In the case of Western Australia (WA), the market of recycled plastic is very weak due to the lack of demand for processed plastic. As a result, plastic diversion was reduced from 16.4 kilo tonnes during 2014–2015 to 13.1 kilo tonnes in 2016–2017 [1]. A notable oversupply of recycled plastics is starting to be observed by some local reprocessors. In many cases reprocessors are not interested as their facilities are already operating at capacity. Whilst the government has imposed a law banning non-recyclable plastic, its amount in landfill will still be substantial. Slim margins are available as recycled plastics due to oil and gas prices making virgin plastics cheaper. These aforementioned factors will impede the diversion rate of plastic wastes from landfill. If this diversion rate is decreased, landfill size and associated environmental degradation will continue to increase.
The reprocessing industry is calling for assistance to help it transition to a so-called ‘circular economy’ where waste would be collected, processed and reused to make new products such as construction materials here in Western Australia. One way to address this situation would be to make these recycled plastics marketable items by establishing their structural suitability for this sector. The construction industries that use a variety of materials in large quantities could open up marketing opportunities for the recyclers/reprocessors. This paper addresses both engineering and sustainability challenges.
There is an urgent need to find alternative avenues to recycle these plastic wastes in a sustainable manner. The recycling of shredded high-density polyethylene (HDPE) can be used as a partial replacement for natural aggregates in concrete, bricks and asphalt concrete mixtures. It can also be used as a reinforcing fibre to increase the tensile/flexural strength of concrete and to reduce its cracking problem. Once HDPE waste is found to be structurally sound in civil construction materials, it will enable reprocessors/recyclers to sell recycled plastics to construction industries.
A number of studies have been carried out on incorporating plastic aggregate to partially replace natural aggregates to develop lightweight concrete. Different types of plastics, including polyethylene terephthalate (PET), commonly used for bottles, low-density polyethylene (LDPE) and high-density polyethylene (HDPE), have been investigated by being added to a concrete mixture. It was found that a PET aggregate could increase water absorption and decrease concrete strength [3]. HDPE is one of the most highly produced plastic waste materials. Because of its high density, which is mostly associated with high strength, HDPE is very ideal as a substitute aggregate in concrete. A previous study by Rumsys et al. found lightweight concrete with HDPE aggregates could reduce concrete density to between 1950 to 2050 kg/m3, while achieving a compressive strength of higher than 40 MPa [4].
Some preliminary studies have also reported RE materials with plastic waste. Araya-Letelier added micro-polypropylene to RE blocks. It was found that with fibres of 12 mm length added to RE materials, localised cracking in clay soil is effectively mitigated and the toughness of material is also improved [5]. Subramaniaprasad introduced fibres made of PET bottles and plastic carrier bags to cement-stabilised RE blocks. Laboratory testing showed that water absorption increased with increased fibre length, which can be due to movement of fibres and weak bonding with soil particles [6]. These studies demonstrate that the application of plastic fibre could possibly help to increase the mechanical performance of RE materials. However, more systematic study is still required.
RE is a comprehensive building technique that dates back to ancient times in China and around the Mediterranean regions [7]. It has been reinvented as a sustainable technique with low building cost, outstanding thermal performance and utilisation of onsite building materials, i.e., soil. According to Dobson, one third of the world population, which is nearly 3 billion people, lives in earth buildings made from RE, mud bricks and other techniques [8]. This legacy construction material has been rejuvenated by introducing “modern” stabilizers for better durability. Cement-stabilised RE (CSRE) not only improves material strength and erosion resistance but also reduces swelling and shrinkage against excessive cracks [9]. Overall, introducing plastic waste such as HDPE into stabilised RE for brick units could be an interesting topic worth investigation.
There could be several environmental and economic benefits with the use of recycled HDPE in RE. Firstly, the use of recycled HDPE in RE will reduce the environmental impact associated with landfilling. Secondly, the partial replacement of natural aggregates in RE by HDPE could reduce the cost of RE as well as the environmental impact associated with the mining of natural rocks for manufacturing of aggregates. Therefore, this recycling strategy can benefit both waste plastic recycling and RE manufacturing industries.
In the case of sustainability challenges, life cycle analysis (LCA) has been widely used to determine the social, economic and environmental impacts of structurally sound civil and construction materials. Fernandes et al. [10] assessed the environmental performance of earth materials (i.e., compressed earth blocks) using a cradle-to-gate LCA approach and found that the use of earth building elements as a replacement for conventional construction materials can result in the reduction of potential environmental impacts by about 50%. Using an LCA analysis, Arrigoni et al. [11] found that the replacement of cement with calcium carbide residue-fly ash (CCR-FA) in RE resulted in considerable energy saving. Results demonstrated that it is possible to have durable stabilised ram earth mixes without paying the cost of using environmentally expensive stabilizers. Asman et al. [12] conducted an LCA assessment to compare the global warming potential (GWP) impact of a residential house using conventional fire clay bricks (FCB) with one using interlocking compressed earth bricks (ICEB) as the wall. It was found that ICEB has less carbon dioxide emissions compared to conventional FCB in building construction. Alexandra et al. [13] determined the greenhouse gas emissions (GHG) associated with the production of RE materials incorporating industrial by-products (ground granulated blast furnace slag, fly ash and silica fume), recycled waste (crushed brick and concrete) and hydrated lime in order to compare with the construction techniques traditionally used in Australia (cavity brick and brick veneer). They found that the GHG emissions per square metre of vertical wall could be reduced by 73% and 57% by replacing traditional cavity brickwork and brick veneer, respectively. Arrigoni et al. [11] conducted a life cycle environmental impact of a typical Western Australian RE building to estimate the variation in the structural sustainabilities of different soil mixtures and recycled and waste materials (e.g., recycled concrete, fly ash and carbide lime). The LCA found that the choice of materials in the mixture and their source could significantly affect the structure’s overall environmental performance. It appears from these studies that there could be environmental benefits associated with the use of recycled HDPE in RE. None of these aforementioned LCAs considered the use of recycled HDPE in RE for environmental performance assessment. The change in composition or specification of RE can change both the environmental and economic performance. It is therefore important to use an EEframework to assess whether the incorporation of recycled HDPE can deliver the required level of environmental performance in a cost-competitive manner.
2. Materials and Methods
2.1. Technical Assessment
2.1.1. Specimen Preparation
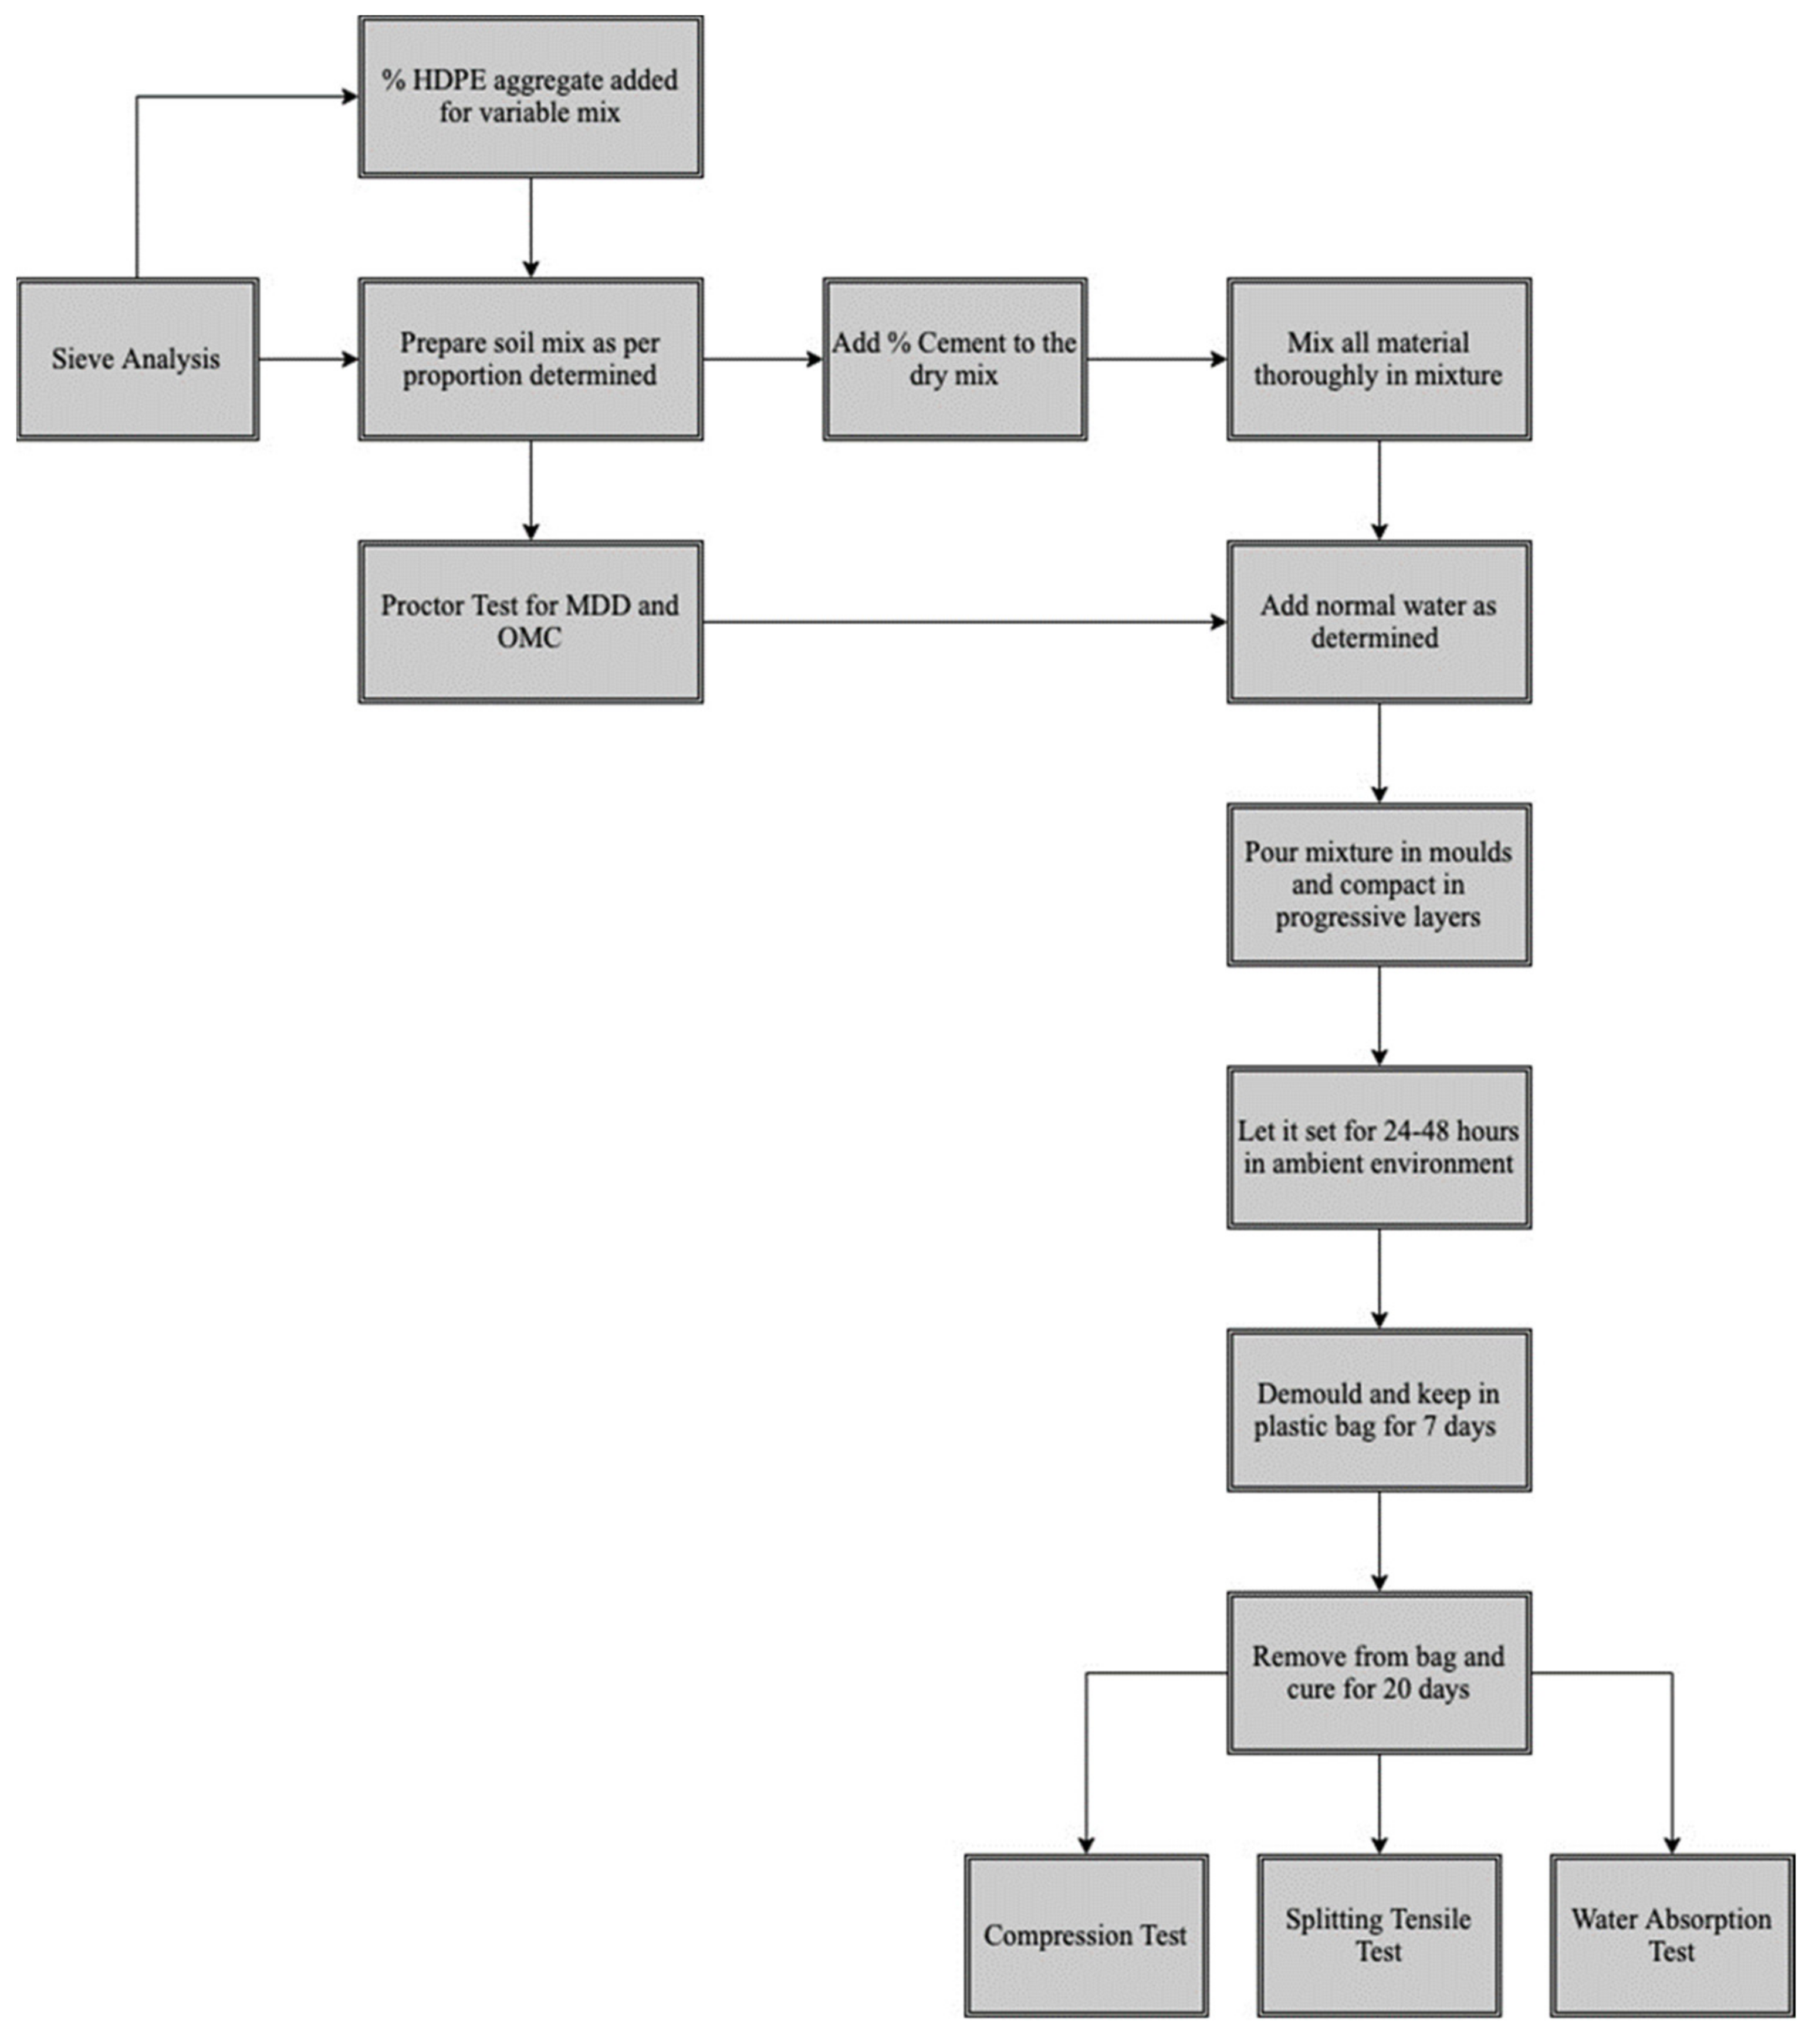
To quantify the mechanical properties of cement-stabilised RE (CSRE) when natural aggregates are replaced with recycled plastic aggregates, four different groups of mixtures are prepared with standard CSRE and various ratios of plastic aggregates. The experimental process follows by obtaining grading for the natural soil mix using a particle size distribution method and defining clay properties using the Atterberg limit test. This soil mixture is stabilised with Portland cement content percentage by dry soil mass. The mixture is then tested to define the maximum dry density (MDD) and the optimum moisture content (OMC). Standard water is added to the mixture as required to obtain OMC just before placing into the mould. Control mix and variable mixes for specimens are prepared utilising the results obtained from this abovementioned standard geotechnical engineering soil testing. The process for specimen preparation is summarised in the flow chart displayed in Figure 1.
Local kaolin clay in Western Australia is used for RE in this study. The 10 mm aggregates and fine to coarse silica sand are used following the design mix ratio as in Table 1. Furthermore, 10 mm HDPE aggregates sourced (Figure 2) from crushing plastic wheelie bins, soft drink bottle caps and nally bins are used as the plastic aggregates. Material is tested for contamination prior to utilisation for the study to ensure safety. Next, 5%, 7% and 10% by mass ratio mixtures are designed to replace the natural aggregate in the CSRE as Mix 2, 3 and 4. CSRE with no plastic and with plastic of 5%, 7% and 10% of the total aggregate are termed in the paper as RE1, RE2, RE3 and RE4, respectively. Since CSRE is very sensitive to mix sizes, sieve analysis test was conducted in accordance with AS 1289.3.6.1–2009 to achieve particle size distribution of the control mix design. Figure 3 illustrates the grading curves, in which the grading curves for the aggregate and HDPE are plotted and which turn out to agree well. It is therefore confident that the sourced HDPE aggregate is suitable for replacing the natural aggregates. Since a clay is used whose content and reactivity with mixture will impact on RE strength performance [14], the Atterberg limits test was conducted to attain the Liquid Limit (41.23%) and Plastic Limit (23.61%), which are used to verify stabilization against guidelines provided for stabilizer usage in HB 195–2002 [15]. General Purpose Portland cement is used as a stabilizer for this study with 8% by dry soil mass content. The mixtures for different groups are compacted mechanically to fill out air voids and enhance strength and durability. A proctor test in accordance with AS 1289.5.1.1 was conducted to determine the maximum dry density (MDD) and the optimum moisture content (OMC). As listed in Table 1, OMC and MDD for the prepared mix designs fall within the range provided by standard. An accurate proportion of dry material was weighed and placed in the mixer. Water was then gradually added to the mixture to the determined moisture content. HDPE aggregates were prepared in the same way as control mix design mixture. The prepared mixtures were gradually poured into these moulds in layers and were compacted in accordance with AS 1289.5.2.1 using a steel proctor. The specimens were then ambient cured for 28 days.
2.1.2. Unconfined Compressive Strength Test
The unconfined compressive strength (UCS) of different mixtures was firstly examined to quantify the mechanical properties of the CSRE with HDPE aggregates. Five specimens were tested for the four types of mixtures. The Universal Testing Machine (UTM) Shimadzu 300 kN at Curtin University was utilised. The UCS test was conducted in accordance with HB 195–2002 to meet the minimum requirement of 2 MPa [15].
2.1.3. Split Tensile Test
Split tensile test was also conducted on the CSRE to determine their split-tensile strengths. The test was performed using the UTM Shimadzu 50 kN. Five specimens for each mix were tested. Displacement control method was applied with the top plate at a constant rate of 0.5 mm/min. The split-tensile strength is calculated using the following equation
where P is the applied load, L is the length of the specimen and Ds is the diameter of the specimen s.
2.1.4. Water Absorption Test
Water absorption test was also performed to examine the durability of the material. Change in mass of a specimen was recorded and three samples for each mix were tested. The test was carried out following HB 195–2002 on the cured specimens [15]. All specimens were firstly weighted and then immersed in normal water for 24 h as shown in Figure 4. Specimens were removed from water after 24 h and were weighed after drying them with paper towel to remove excess water from surface. The samples were oven dried for 48–72 h at 105° C. Oven dried samples were re-weighed once the constant mass was achieved. The water absorption index (Wi) is determined using the below formula:
2.2. Eco-Efficiency Framework
Once the mixes RE1, RE2, RE3 and RE4 were found structurally sound, the EE framework based on recent studies [16,17] was used to compare the EE performance of these materials. The environmental impacts and costs of RE mixes were first determined to ascertain their EEperformance. The objective of EE is to produce these RE mixes with reduced environmental impacts and costs. The EE strategies that are sometimes used for reducing environmental impacts could increase costs or vice versa. Therefore, an EE framework was used to address this dilemma through a comparative assessment process to identify the RE mixes that deliver the higher environmental performance in a cost-effective manner. The EE framework uses both environmental impacts and cost values of REs to determine their EE portfolios for comparison purposes.
The first step of the Eco-efficiency Assessment (EEA) framework is to carry out a life cycle assessment to calculate the life cycle environmental impacts of RE mixes. The next step calculates the costs of concrete beam mixes.
2.2.1. Life Cycle Assessment
Fourteen environmental impacts in terms of per inhabitant (Inh) that are relevant to the environmental assessment of Australia’s building and construction sector were calculated. These impacts are listed below and are based on local situations and were obtained from the Building Product Innovation Council [18]:
- Global warming (kg CO2 eq per Inh per year);
- Abiotic resource depletion (kg Sb eq per Inh per year);
- Land use and ecological diversity (ha. a per Inh per year);
- Water depletion (m3 H2O per Inh per year);
- Eutrophication (kg PO4 eq per Inh per year);
- Acidification (kg SO2 eq per Inh per year);
- Fresh water aquatic ecotoxicity (kg 1,4-DB eq per Inh per year);
- Marine aquatic ecotoxicity (kg 1,4-DB eq per Inh per year);
- Terrestrial ecotoxicity (kg 1,4-DB eq per Inh per year);
- Photochemical smog (kg NMVOC per Inh per year);
- Ozone depletion kg CFC-11 eq per Inh per year;
- Ionising radiation kBq U235 eq per Inh per year;
- Human toxicity kg 1,4-DB eq per Inh per year;
- Respiratory inorganics kg PM2.5 eq per Inh per year.
ISO14040-44 guidelines [19] were used to calculate these aforementioned environmental impacts of the RE mixes. The four steps of the guideline are goal and scope, life cycle inventory (LCI), environmental impact assessment and interpretation. The goal of the LCA is to determine the environmental impacts associated with the use of recycled HDPE in RE mixes. This LCA applies a ‘cradle to gate’ approach, including the mining and production of raw materials, transportation of these materials for RE manufacturing and the manufacturing stages. For this LCA, 1 m3 of RE mix was chosen as the functional unit in order to carry out a mass balance or to estimate energy and materials for developing a life cycle inventory (LCI) (Table 2).
Developing an LCI is a pre-requisite for estimating 14 environmental impacts. The energy consumed in manufacturing these RE is based on AS1289.5.2.1 [20]. Table 2 shows the LCIs consisting of inputs, including cement, gravel, clay and silt and recycled HDPE, electricity for manufacturing and transportation in terms of tonnes per kilometer travelled, for four RE mixes. These values are mainly based on the aforementioned experiments conducted for testing the structural performance. These mixes are selected based on the required level of structural performance of RE mixes.
The inputs of life cycle inventory in Table 2 were entered into SimaPro 9.2 LCA software [21] and then they were linked to the corresponding emission factor databases. The emission databases for most of the inputs were based on local conditions of Western Australia. Firstly, the inputs of each RE/brick mix were multiplied by the corresponding emission factors to determine 14 environmental impacts of each input and then the impacts of all inputs were added to determine the total life cycle environmental impacts of each RE mix. Australian emission databases were considered for cement, sand, electricity and transportation [22]. New databases were created for gravel and recycled HDPE using available local raw data from industries/processes. In the case of gravel, new databases were created in the software by using the information on the amount of diesel consumption for crushing the gravel (i.e., 0.052 mega Joule per kg of 10 mm coarse aggregate crushed) [23]. Australian emission databases for the combustion of diesel for crushing aggregates was used in this case. Emission factors of Western Australia’s energy mix were multiplied by electricity used in shredding HDPE to create its emission database.
Only a few environmental impacts can be estimated using the Australian impact method available in the SimaPro LCA software. Since this study requires the estimation of 14 environmental impacts, a number of relevant methods available in SimaPro 9.2 were calculated following Bengtsson and Howard [18] and Renouf et al. [24]. The assessment methods that were used to calculate the environmental impacts are provided in Table 3. The input values in the LCI of each RE mix were multiplied by the corresponding emission factors to estimate the environmental impacts.
2.2.2. Economic Costs
The same system boundaries are used in LCA and LCC in order to produce a consistent, comparable result [29]. The costing was done on the basis of inputs to produce 1 m3 of RE mix. The functional unit is therefore the same for both LCA and economic costs to maintain the consistency. The same inputs that are available in the life cycle inventory are used in this cost calculation. Only the labour cost that is not available in the LCI was included in this economic analysis based on recent documents [30,31]. The market prices were sourced locally to present the local situation. All past prices are converted to 2020 prices using the inflation rate of Australia (Table 4).
2.2.3. Eco-Efficiency Portfolio Analysis
The economic and environmental impacts values of RE mixes are incorporated into the EE analysis (EEA) framework [16,17] to calculate the EEportfolios for comparison purposes. It should be notable that the environmental impacts and costs values of 2 types of traditional bricks (TB1 and TB2) and concrete bricks (CB) were taken from Zhang and Biswas [16,23], respectively, for inclusion in the EEA framework for comparing the EE performance of these materials with four RE mixes.
In order to provide a link between the environmental impacts and costs, the results are normalised. It is required to normalise environmental values of RE with respect to the total environmental impact of a country or a region [37]. Australian gross domestic environmental impacts (GDEI) (Table 5) were used to normalize these impacts.
Normalisation of Environmental Impact: Firstly, the environmental impacts determined are normalised in terms of ‘inhabitant equivalents’ that is the equivalent impact per inhabitant in Australia per year [37] The normalised value of each environmental impact of each rth RE mix is calculated using Equation (3).
= The normalised value of the environmental impact i of brick mix b;
= The life cycle environmental impact i of RE mix r over all life cycle stages;
= The gross domestic environmental impact i;
= The net capita of inhabitants;
= Refers to the impact category considered in the LCIA.
The are multiplied by the corresponding weight to reflect the relative degree of importance to the system boundary conditions before the aggregation of the individual environmental impacts into a single environmental impact value for each RE mix. The weights of impacts, shown in Table 5, were used to reflect their importance in Australian conditions [38]. The total environmental impact (EI) for each RE mix r was determined by weighting and aggregating using Equation (4).
= The total normalised environmental impact of a RE mix r;
= The weighting factor of impact category i.
The summation of each must add to 100 %.
Normalisation of Economic Impact: The economic cost was normalised in a similar method by using the Australian Gross Domestic Product in 2020 [39,40] to reflect the costs in the same units as environmental impacts (i.e., inhabitants per year) [37]. The equation used to calculate the normalised cost is shown in Equation (5).
r = The normalised total cost of RE mix r;
= Economic cost of RE mix r;
= Gross domestic product per capita of the region.
Eco-Efficiency Portfolio:
To calculate the preliminary portfolio position of each RE mix r, Equations (6) and (7) were used.
= environmental impact preliminary portfolio position for option ;
= cost preliminary portfolio position for option ;
= refers to the RE mix.
In order to describe the , and a visualisation has to be created through the development of the EE portfolios of mixes. Figure 5 shows an example of a portfolio, where it can be seen that the is plotted on the abscissa and on the ordinate [37]. It should be noted that the most eco-efficient mix will be located towards the top-right of the diagram. A diagonal line which runs through the origin is used to decide whether the mix will be eco-efficient. The RE mix on or above the line is considered as eco-efficient. The most eco-efficient mix will be that which will have the largest perpendicular distance above the diagonal line.
Relevance Factor: This is the ratio of the average environmental impact of all RE mixes to the average cost of all these mixes as shown in Equation (8).
= The relevance factor of environmental impact to cost of all options;
= The number of RE mixes to be considered in this portfolio.
To determine the final portfolio position of each option, Equations (9) and (10) were used.
= adjusted environmental portfolio position of RE mix ;
= adjusted cost portfolio position of RE mix .
The relevance factor was used to adjust the portfolio positions to achieve a balanced position between the environmental and economic factors [37]. The final positions are plotted graphically to visually determine the potential eco-efficient RE mixes. The resulting portfolio is ideal for comparison of multiple eco-efficient RE mixes, which was a main aim of this research.
2.3. Implications of Recycled HDPE
The EE approach was based on the attributional LCA concerning only the emissions associated with the production of RE. However, there are some indirect consequences associated with the use of recycled HDPE in RE that need to be taken into account in order to further highlight the benefits of recycling strategies.
2.3.1. Land Conservation
The land conservation associated with the diversion of HDPE waste from landfill to RE manufacturing plant during 2021–2030 was determined. Since it was not possible for LCA software to determine the region-based land use changes, the following were followed to determine the amount of land use that can be saved due to use of recycled HDPE in RE mixes. The estimation is based on the amount of land avoided in gravel quarries and the diversion of HDPE waste from the landfill.
- Avoided land use of gravel quarries: To produce 1 tonne of gravel, 0.55 m2 of land is required [42]. This value was multiplied by the amount of gravel that can be substituted by recycled HDPE per year to calculate the amount of quarry area avoided (Aq).
- Avoided land due to diversion of HDPE wastes from landfill: Following Paul et al. [43], the shape of the landfill was assumed to be a conical frustum. Accordingly, the area of the landfill that can be saved due to use of recycled plastic has been determined. Firstly, the volume of a conical frustum (V) was calculated using Equation (11) [43],where ‘D’ is the top diameter, ‘d’ is the bottom diameter and is equal to (D/2-75) and h = 25 m. These dimensions are based on [43].
Since ‘d’ and ‘D’ in Equation (11) are unknown, the second step was to calculate the value of ‘V’ by using the information on the amount of recycled HDPE waste that was actually used in RE and its density. On the basis of ABS and the Australian government’s environment department, 2,125,000 tonnes of plastic wastes go to landfill and 32% of it is HDPE. The annual brick production data were available for the year 2002 only, therefore, the growth rate of building sector (i.e., 8% per year) was used to estimate the amount of bricks that will be produced during 2021–2030. This helped us to work out the amount of recycled HDPE that can be used in RE mixes during this period. Accordingly, the amount of landfill area that can be avoided due to diversion of these amount of HDPE wastes was calculated using the below equations.
Once the value of ‘V’ in Equation (11) was determined, the ‘goal seek’ optimization tool in excel was used to determine the values of ‘d’ and ‘D’. The following formula was used to calculate the amount of landfill area avoided (Alf) due to diversion of HDPE wastes to a RE manufacturing plant (Equation (12)).
Therefore, the total amount of land (Atotal) that can be saved both in quarry and landfill locations can be calculated using Equation (13).
2.3.2. Biodiversity Index
The loss of biodiversity can be avoided by conserving land both in quarrying and landfill areas. This parameter can be presented in terms of biodiversity index. BI was calculated using the following equation, as it was particularly developed for Western Australia [44].
where x is the proportion of pristine land not disturbed, i.e., Atotal in Equation (13) This equation also means that the proportion of pristine land not affected by the quarrying or residue storage activities could reduce the loss of biodiversity.
BI = 0.6844x + 33.63
3. Results
3.1. Technical Performance Analysis
3.1.1. Compressive Behavior
Table 6 lists the compressive strengths of the specimens in different groups together with the corresponding strains. An averaged compressive strength of 7.8 MPa was found for the reference group Mix 1, in which 0% of plastic was added. With 5% HDPE aggregate in Mix 2, the averaged compressive strength swayed to 7.2 MPa. When further increasing the HDPE percentage to 7% and 10% in Mix 3 and 4, respectively, the compressive strengths were found to increase steadily to 8.68 MPa and 9.66 MPa, respectively. This indicates that using HDPE plastic to replace practically the natural aggregates in CSRE would lead to minor influence on the compressive strength or even improve the compressive strength of the material. This is probably because compared to natural aggregates, HDPE is much softer with a lower compressive strength, and the deformation of HDPE under compressive force is more compatible with cement-stabilised RE material.
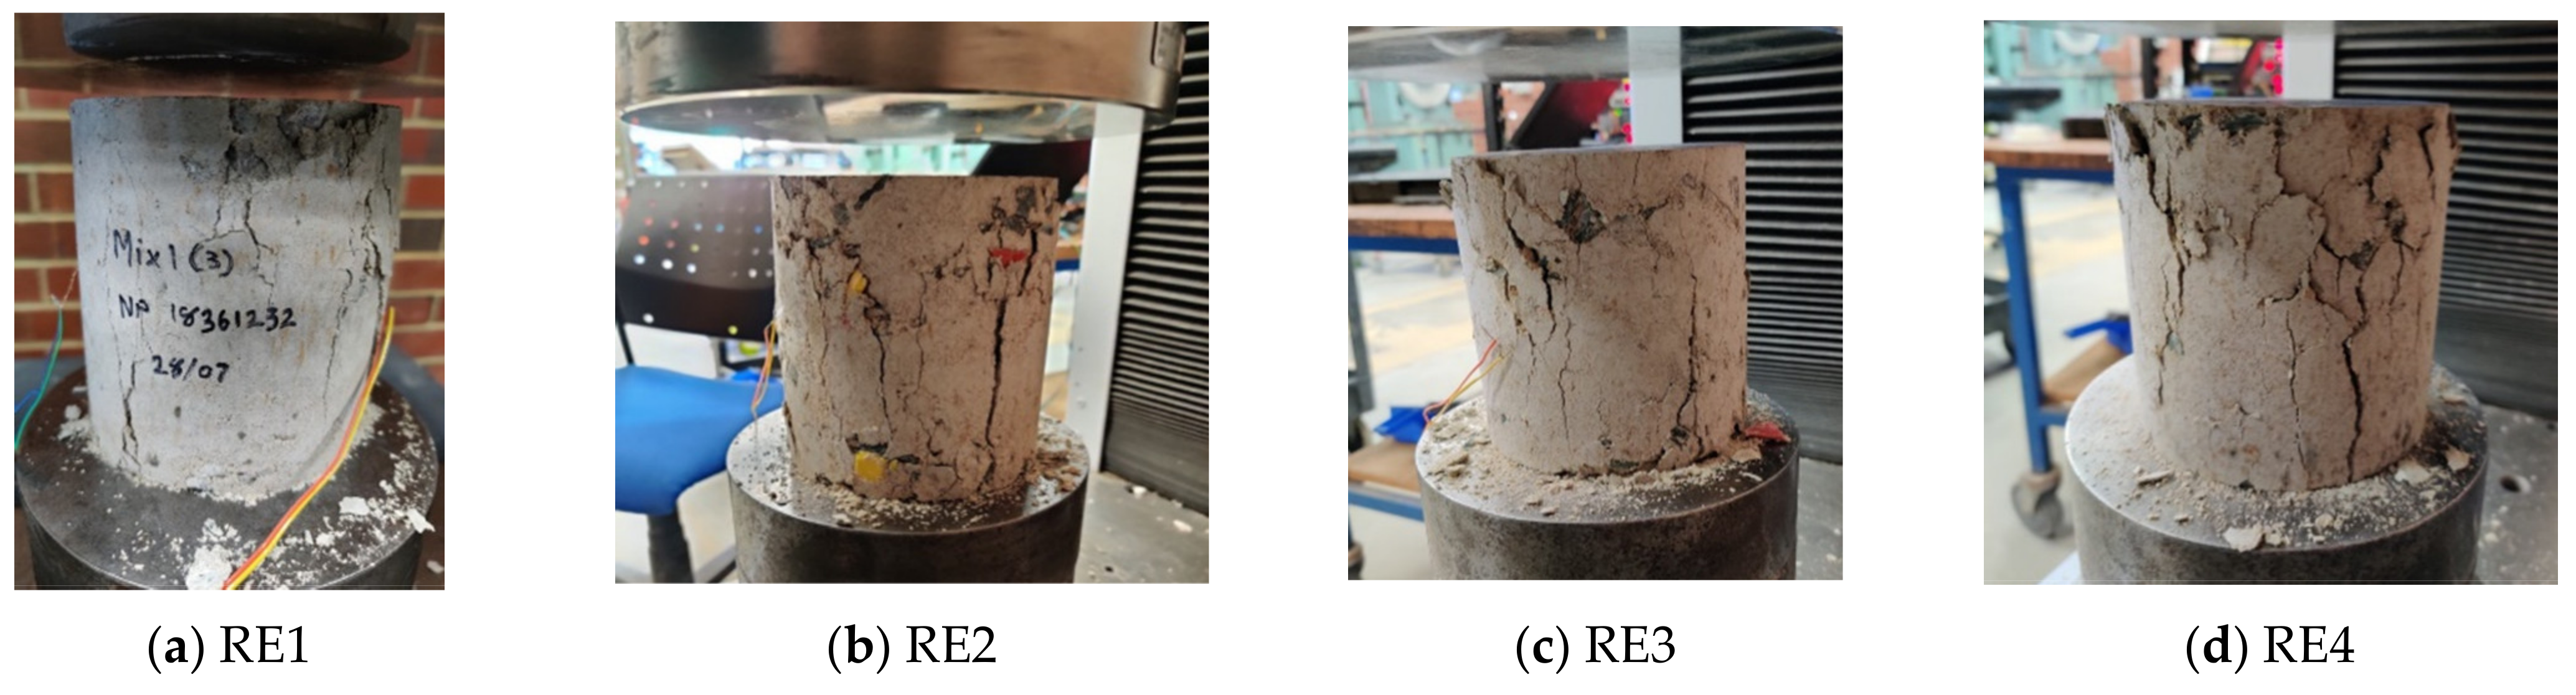
Figure 6 shows the tested specimens under compression. Those CSRE specimens with no HDPE (as Mix 1) failed in a brittle manner with splitting cracks throughout the specimens leaving the tested specimens shattered in numerous pieces. When HDPE aggregates were included, the specimens still failed with lateral splitting cracks, but were held in one piece as HDPE flakes maintain a bridge after failure which reduced brittle failure and improved the ductility of the CSRE. A similar observation was also found in a previous study where polypropylene fibers were added to stabilised soil [45].
Table 7 lists the results of the split tensile strength test of the specimens. When no HDPE is included in Mix 1, the split-tensile strength is 1.51 MPa. When 5% and 7% plastic aggregates are used in Mix 2 and 3, the split-tensile strengths reduce to 1.14 MPa and 1.16 MPa, respectively. When further increasing the plastic percentage to 10%, the split-tensile strength dropped to 1.08 MPa. This indicates weaker bond between HDPE aggregates and CSRE matrix.
3.1.2. Water Absorption
Table 8 summarizes the testing results, from which it can be found that as the percentage of HDPE plastic aggregate increases, more water is absorbed. For Mix 1 where no plastic aggregate is used, the averaged water absorption is 6.46%. When 5% HDPE was used to replace the natural aggregates, Wi increases to 6.60%. As more plastic is added to the matrix, Wi further increases to 6.72% and 6.82% when 7% and 10% of aggregates are replaced with HDPE, respectively. This indicates that adding plastic into CSRE could lead to a higher water absorption. A previous study on cement-stabilised soil blocks with plastic fibre also reported an increase in water absorption with the increase in fibre amount [5].
3.2. Environmental Impacts
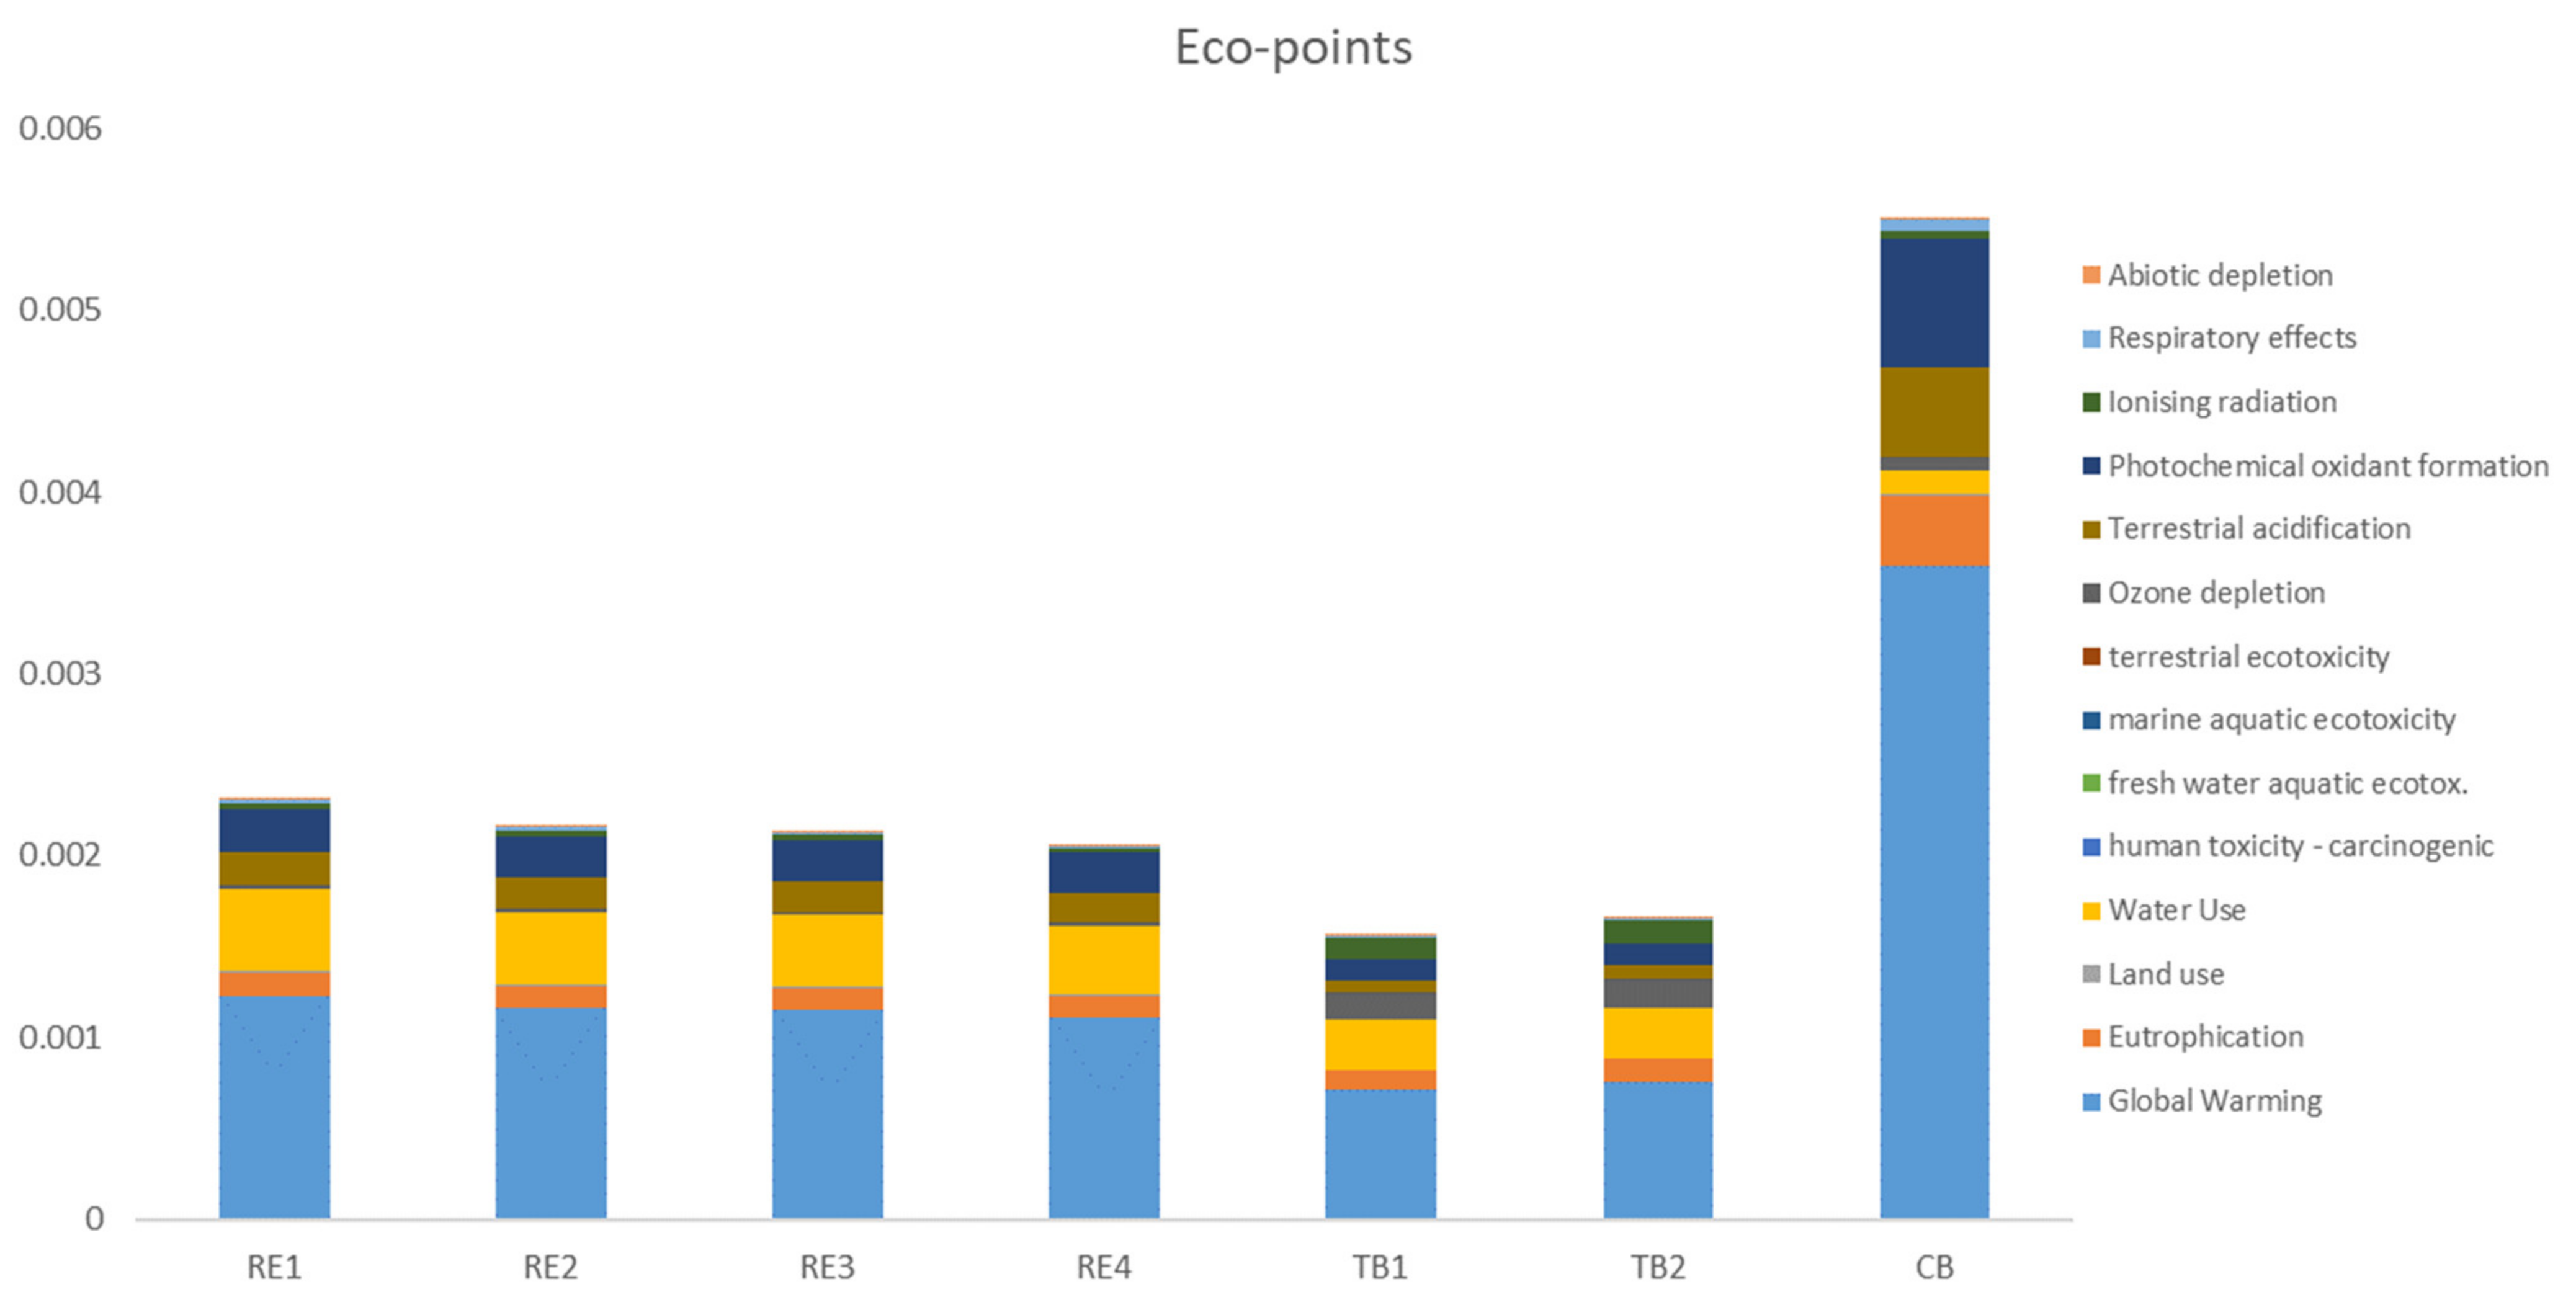
Figure 7 shows the total environmental scores of all brick mixes in terms of eco-points. The environmental impact values for RE1, RE2, RE3, RE4, TB1, TB2 and CB are 2.30 × 10⁻³, 2.15 × 10⁻³, 2.13 × 10⁻³, 2.06 × 10⁻³, 1.56 × 10⁻³, 1.66 × 10⁻³and 5.50 × 10⁻³, respectively. RE mixes are not environmentally friendlier than traditional bricks. The impact contributing significantly to the overall performance of these mixes is the global warming impact, accounting for between 45% and 65% of the overall environmental impacts for these seven mixes. RE 4 using the highest amount of recycled HDPE (i.e., 10% of the total weight of the brick) has lower environmental impact than concrete brick, but has 24% and 19% higher impact than traditional bricks 1 and 2, respectively. Figure 8 shows that cement alone accounts for 87% of the total global warming impact. Future studies will therefore need to consider the partial replacement of Ordinary Portland Cement (OPC) with less carbon-intensive materials with cementitious or pozzolanic properties while maintaining the required level of structural performance. Fly ash, geo-polymer concrete, ground granular blast furnace slag and nano-silica, which are derived from coal power plants steel mills and mineral processing, can be considered for partial replacement for cement. After global warming impact, water use is the second largest hotspot (17–19%) for all mixes except for the concrete brick (Figure 8). This is also associated with the water used in cement production (Figure 8). The recent LCA study conducted at the University of Western Australia found that RE mixes containing different portions of industrial by-products (ground granulated blast furnace slag, fly ash and silica fume), recycled waste (crushed brick and concrete) and hydrated lime produced between 75 kg CO2 eq. and 100 kg CO2 eq, which are 119% and 64% less than the global warming impact of RE 4 (i.e., 164 kg CO2 eq.), respectively [11]. The GWI of RE4 in the current study is high mainly due to the use of energy-intensive HDPE and OPC. Since the current research for the first time considered the use of recycled HDPE in RE, other constituents had to be virgin in order to maintain the structural performance of the RE mixes.
3.3. Economic Costs
The economic costs of the aforementioned brick mixes vary with the variation of materials of different prices (Figure 9). It appears that the use of recycled HDPE in RE significantly increased the cost of this brick. Although this material accounts for 10% of the total weight of RE, it is about twice the price of OPC and clay and silt due to slower penetration of these new recycled materials in the market. This is one of the reasons that RE (RE2, RE2, RE3) is more expensive than traditional and concrete bricks. However, the increased use of recycled HDPE as well as the diversion of this waste from landfill is expected to reduce its market price. The price of clay and silt is almost the same as OPC and the portion of this material along with OPC in RE mix is also quite substantial (20%). Whilst the cost is increased, maintaining certain portions of these materials in RE is important to maintain their structural functionalism. This is a challenging task for an emerging technology when they first appear on the market. Further analysis was carried out to investigate as to whether RE can deliver environmental benefits in a cost-effective manner or if it is eco-efficient compared to other traditional and concrete bricks.
3.4. Eco-Efficiency Analysis
Two RE mixes (RE1 and RE2) were found to be eco-efficient due to their lower environmental impact and economic cost values compared to other RM mixes (Figure 10). RM2 just met the EEcriteria but performed poorer than RE1 mainly due to use of HDPE, which is currently expensive as well as energy intensive. Most importantly, the electricity that is used for shredding HDPE into aggregates is sourced from WA’s grid, which mainly uses coal and gas to generate electricity. As the percentage of HDPE increased in RE3 (7%) and RM (10%), their portfolio positions go slowly below the diagonal line and they are no longer eco-efficient. The portfolio position of the concrete brick is below the diagonal line, indicating it is not eco-efficient. Despite the use of recycled HDPE in RE, these materials were not found to be eco-efficient. Interestingly, the traditional bricks (TB1 and TB2) are eco-efficient due to the use of less expensive and less energy- or carbon-intensive materials, unlike HDPE, OPC and clay and silt. However, there are opportunities for improving the EEperformance of RE mixes by producing electricity either from wind or solar for shedding HDPC and also by using fly ash or by-products as a replacement of OPC in RE while maintaining the structural performance.
This EEanalysis was based on the attributional LCA approach concerning only emissions and consumption associated with the manufacturing of 1 m3 of RE mix. It is therefore important to capture the benefits or indirect consequences resulting from the diversion of this waste from landfill and also the avoidance of quarrying associated with the production of virgin gravel, which further benefits the environment in terms of the reduction in the loss of biodiversity.
3.5. Land Conservation
Whilst RE using the increased amount of recycled HDPE are not eco-efficient as compared to traditional brick, there exists a significant land use saving potential due to the conversion of this plastic waste to aggregates to replace gravel in RE production. Based on a study conducted by Brickmakers [46] and the government of Western Australia [47], it is estimated that approximately around 1.72 to 3.45 million tonnes of bricks are expected to be used in Western Australia in 2021 and 2030, respectively. In addition, we can estimate the amount of land that can be conserved due to diversion of this HDPE waste from landfill to brick makers for making REs. Using Equations (11)–(13), it was calculated that around 51.3, 73.7 and 105.2 hectares of landfill area in WA can be avoided during 2021–2030 by using 4.9, 6.8 and 9.4 million tonnes of recycled HDPE wastes in RE2, RE3 and RE4 mixes, respectively (Table 9). Therefore, a total land area of around 322, 447 and 621 hectares could potentially be conserved both at the quarry and landfill sites for the coming generation in Western Australia, due to use of recycled HDPE in RE2, RE3 and RE4, respectively, as shown in Table 9. In Western Australia, where population and economy are growing at an incredible rate, resource scarcity is going to be a serious problem, especially when we are on the lookout for resources which can be easily and quickly used for infrastructural development. The use of recycled HDPE as a replacement for virgin construction materials will therefore save these finite resources and attain a circular economy.
3.6. Loss of Biodiversity
This research was able to calculate biodiversity increases associated with the use of recycled HDPE by using the work of Majer and Beeston [44] who produced a biodiversity index for a portion of pristine land in Western Australia. From this it was estimated that by replacing gravel with recycled HDPE waste in RE2, RE3 and RE4 in 2021, the biodiversity index ratings can be increased by 45%, 62% and 87%, respectively (Table 10). As the building industries grow over time, there will be more need for bricks and so the diversion of HDPE wastes from the landfill will increase. It is therefore estimated that this biodiversity index can be increased to 91%, 126% and 175% due to use of RE2, RE3 and RE4 mixes in 2030, respectively. This means that the use of recycled waste not only reduces dependence of virgin materials but also improves the health of an ecosystem and increases vegetation coverage for CO2 sequestration by reducing land use changes.
4. Conclusions
The RE containing about 10% of recycled HDPE waste was found to be structurally sound. However, the EEperformance of RE decreases with the increased use of recycled HDPE. RE containing 5% of recycled HDPE waste just met the criteria of an eco-efficient option. When this percentage is increased to 7% or more, RE is no longer efficient due to use of expensive and energy-intensive recycled HDPE and OPC. The use of renewable electricity to produce HDPE and a partial replacement of OPC with by-products such as nano-silica or fly ash can potentially reduce the environmental impacts and costs to further improve the EEperformance. This research roughly estimated that between 322 and 621 hectares of land use could be avoided during 2021-2030 due to use of these RE and the bio-diversity index could increase by more than 100% by 2030. This research clearly demonstrates that the conversion of HDPE waste to construction materials can address resource scarcity in a region such as Western Australia, where both population and the economy are growing exponentially and a circular economy by reducing land use changes can be achieved. Future work should include the use of fly ash or other cementitious by-products as a partial replacement of OPC and measure the durability of new mixes to assess impact of service life on the environmental performance of RE.
Author Contributions
Conceptualization, W.K.B. and X.Z.; methodology, W.K.B. and X.Z.; software, W.K.B.; validation and experimentation, X.Z.; formal analysis, W.K.B. and X.Z.; investigation, X.Z. and W.K.B.; resources, X.Z. and W.K.B.; data curation, X.Z. and W.K.B.; writing—original draft preparation, X.Z. and W.K.B.; writing—review and editing, X.Z. and W.K.B. All authors have read and agreed to the published version of the manuscript.
Funding
The 2nd author would like to acknowledge the financial support from Australian Research Council under DE 210100986.
Institutional Review Board Statement
Not applicable.
Informed Consent Statement
Not applicable.
Data Availability Statement
Not applicable.
Conflicts of Interest
The authors declare no conflict of interest.
References
- Waste Australia. Recycling Activities in Western Australia 2017–2018. Waste Authority, Perth. Available online: https://www.wasteauthority.wa.gov.au/images/resources/files/2019/10/Recycling_Activity_in_WA_2017-2018.pdf (accessed on 15 April 2021).
- WA Today. Perth Engineer Wages War on Plastic with WA’s First Plastic Recycling Plant. Available online: https://www.watoday.com.au/national/western-australia/perth-engineer-wages-war-on-plastic-with-was-first-plastic-recycling-plant-20171102-gzdv9x.html (accessed on 15 April 2021).
- Saikia, N.; de Brito, J. Waste Polyethylene Terephthalate as an Aggregate in Concrete. Mater. Res. 2013, 16, 341–350. [Google Scholar] [CrossRef] [Green Version]
- Rumšys, D.; Bačinskas, D.; Spudulis, E.; Meškenas, A. Comparison of Material Properties of Lightweight Concrete with Recycled Polyethylene and Expanded Clay Aggregates. Proc. Eng. 2017, 172, 937–944. [Google Scholar] [CrossRef]
- Araya-Letelier, G.; Concha-Riedel, J.; Antioco, F.C.; Sandoval, C. Experimental mechanical-damage assessment of earthen mixes reinforced with micro polypropylene fibers. Constr. Build. Mater. 2019, 198, 762–776. [Google Scholar] [CrossRef]
- Subramaniaprasad, C.K. Sorption characteristics of stabilised soil blocks embedded with waste plastic fibres. Constr. Build. Mater. 2014, 63, 25–32. [Google Scholar] [CrossRef]
- Jaquin, P.A.; Augarde, C.E.; Gerrad, C.M. Chronological Description of the Spatial Development of Rammed Earth Techniques. Int. J. Archit. Herit. Conserv. Anal. Restor. 2008, 2, 377–400. [Google Scholar] [CrossRef] [Green Version]
- Dobson, S. Rammed earth in the modern world. Rammed earth construction: Cutting-edge research on traditional and modern rammed earth. In Proceedings of the First International Conference on Rammed Earth Construction, University of Western Australia, Crawley, WA, Australia, 10–13 February 2015; pp. 3–10. [Google Scholar]
- Arrigoni, A.; Ciancio, D.; Beckett, C.; Dotelli, G. Improving rammed earth walls’ sustainability through life cycle assessment (LCA). In Proceedings of the Sustainable Built Environment Regional Conference 2016, Zurich, Switzerland, 15–17 June 2016. [Google Scholar] [CrossRef]
- Fernandes, J.; Peixoto, M.; Mateus, R.; Gervásio, H. Corrigendum to ‘Life cycle analysis of environmental impacts of earthen materials in the Portuguese context: Rammed earth and compressed earth blocks. J. Clean. Prod. 2021, 294, 126361. [Google Scholar] [CrossRef]
- Arrigoni, A.; Beckett, C.; Ciancio, D.; Dotelli, D. Life cycle analysis of environmental impact vs. durability of stabilised rammed earth. Constr. Build. Mater. 2017, 142, 128–136. [Google Scholar] [CrossRef]
- Asman, A.; Bolong, N.; Mirasa, A.K.; Asrah, H. Life Cycle Assessment of Interlocking Compressed Earth Brick and Conventional Fired Clay Brick for Residential House. J. Phys. Conf. Ser. 2020, 1529, 042012. [Google Scholar] [CrossRef]
- Alexandra, A.H.; Mohamed, M.; Christopher, E.; Becketta, T.S.; Grant, T. Alternative stabilised rammed earth materials incorporating recycled waste and industrial by-products: Life cycle assessment. Constr. Build. Mater. 2021, 267, 120997. [Google Scholar] [CrossRef]
- Ciancio, D.; Jaquin, P.; Wwalker, P. Advances on the assessment of soil suitability for rammed earth. Constr. Build. Mater. 2013, 42, 40–47. [Google Scholar] [CrossRef]
- Walker, P. Standards Australia, HB 195-2002. In The Australian Earth Building Handbook; Standard Australia International Ltd.: Sydney, NSW, Australia, 2002. [Google Scholar]
- Zhang, X.; Biswas, W. Development of Eco-efficient bricks—A Life Cycle Assessment Approach. J. Build. Eng. 2021, 42, 102429. [Google Scholar] [CrossRef]
- Burgess, C.; Biswas, W. Eco-efficiency assessment of wave energy conversion in Western Australia. J. Clean. Prod. 2021, 312, 127814. [Google Scholar] [CrossRef]
- Bengtsson, J.; Howard, N. A Life Cycle Impact Assessment Method for Use in Australia. Part 1: Classification and Characterisation; Edge Environment Pty Ltd.: Coorparoo, QLD, Australia, 2010. [Google Scholar]
- ISO ISO 14044:2006. Environmental Management—Life-Cycle Assessment—Requirements and Guidelines; International Organization for Standardization: Geneva, Switzerland, 2006. [Google Scholar]
- Standards Australia. Methods of Testing Soils for Engineering Purposes; AS 1289.5.2.1—2003; Standard Australia International Ltd.: Sydney, NSW, Australia, 2003. [Google Scholar]
- PRé Consultants. Simapro Version 9.2; PRé Consultants: Amersfoort, The Netherlands, 2021. [Google Scholar]
- Life Cycle Strategies Pty Ltd. Australasian Unit Process LCI Library and Methods. Version 2015_02_06. 2015. Available online: http://www.lifecycles.com.au/#!australasian-database/cbm5 (accessed on 15 September 2020).
- Shaikh, F.; Anwar, H.; Biswas, W. Sustainability assessment of reinforced concrete beam mixes containing recycled aggregates and industrial by-products. J. Green Build. 2020, 15, 95–119. [Google Scholar] [CrossRef]
- Renouf, M.A.; Grant, T.; Sevenster, M.; Logie, J.; Ridoutt, B.; Ximenes, F.; Bentgtsson, J.; Cowie, A.; Lane, J. Best Practice Guide for Life Cycle Impact Assessment (LCIA) in Australia. Australian Life Cycle Assessment Society. 2015. Available online: http://www.auslci.com.au/Documents/Best_Practice_Guide_V2_Draft_for_Consultation.pdf (accessed on 15 April 2021).
- Intergovernmental Panel on Climate Change. Climate Change 2013 The Physical Science Basis; The Fifth Assessment Report; Working Group I; The Intergovernmental Panel on Climate Change: Geneva, Switzerland, 2013. [Google Scholar]
- Goedkoop, M.; Oele, M.; Leijting, J.; Ponsioen, T.; Meijer, E. Introduction to LCA with SimaPro; Pré Sustainability: Amersfoort, The Netherlands, 2013. [Google Scholar]
- Guinee, J. Handbook on life cycle assessment: An operational guide to the ISO standards. Int. J. Life Cycle Assess. 2001, 7, 311–313. [Google Scholar] [CrossRef]
- Bare, J.; Young, D.; Hopton, M. Tool for the Reduction and Assessment of Chemical and Other Environmental Impacts; U.S. Environmental Protection Agency: Washington, DC, USA, 2012. [Google Scholar]
- Rebitzer, G. Integrating Life Cycle Costing and Life Cycle Assessment for Managing Costs and Environmental Impacts in Supply Chains. In Cost Management in Supply Chains; Seuring, S., Goldbach, M., Eds.; Physica: Heidelberg, Germany, 2002. [Google Scholar] [CrossRef]
- Jacinto, C.; Martín-del-Río, J.J.; Falcón, R.M.; Rubio-Bellido, C. Rammed Earth Construction: A Proposal for a Statistical Quality Control in the Execution Process. Sustainability 2020, 12, 2830. [Google Scholar] [CrossRef] [Green Version]
- One Flare. How Much Does Bricklaying Cost? 2020. Available online: https://www.oneflare.com.au/costs/bricklaying (accessed on 20 June 2021).
- Cement Australia, GP Cement 20 kg Bag—Bricks Blocks Pavers. 2020. Available online: https://bricksblockspaversonline.com.au/products/cement-australia-gp-cement-20kg-bag-p233 (accessed on 15 June 2021).
- WA Kaolin Limited 2020; (WA Kaolin, Ward Rd., East Rockingham, WA 6168, Australia). Personal communication, 2020.
- Claw Environmental Recycling Perth—Polystyrene Recycling. 2021. Available online: https://www.clawenvironmental.com/ (accessed on 15 June 2021).
- Department of Infrastructure and Regional Development. International Comparison of Australia’s Freight and Supply Chain Performance. 2019. Available online: https://www.freightaustralia.gov.au/sites/default/files/documents/international-comparison-of-australias-freight-and-supply-chain-performance.pdf (accessed on 20 June 2021).
- Perth Energy. Standard Electricity Tariff. 2020. Available online: https://www.perthenergy.com.au/business-electricity/standard-fees-charges-elec/ (accessed on 20 June 2021).
- Kicherer, A.; Schaltegger, S.; Tschochohei, H.; Pozo, B.F. Eco-efficiency: Combining life cycle assessment and life cycle costs via normalization. Int. J. Life Cycle Assess. 2007, 12, 537–543. [Google Scholar] [CrossRef]
- Howard, N.; Bengtsson, J.; Kneppers, B. Weighting of Environmental Impacts in Australia; Building Products Innovation Council: Sydney, NSW, Australia, 2009. [Google Scholar]
- ABS Australian National. Accounts: National Income, Expenditure and Product. 2020. Available online: https://www.abs.gov.au/AUSSTATS/[email protected]/mf/1345.0 (accessed on 25 May 2021).
- ABS Australian Demographic Statistics. 2020. Available online: https://www.abs.gov.au/ausstats%[email protected]/mediareleasesbyCatalogue/CA1999BAEAA1A86ACA25765100098A47 (accessed on 15 June 2021).
- Bidoki, S.M.; Wittlinger, R.; Alamdar, A.A. Eco-efficiency analysis of textile coating materials. J. Iran. Chem. Soc. 2006, 3, 351–359. [Google Scholar] [CrossRef]
- Mistri, A.; Dhami, N.; Bhattacharyya, S.K.; Barai, S.V.; Mukherjee, A.; Biswas, W. Environmental implications of the use of bio-cement treated recycled aggregate in concrete. Resour. Conserv. Recycl. 2021, 167, 105436. [Google Scholar] [CrossRef]
- Paul, K.; Dutta, A.; Krishna, A.P. A comprehensive study on landfill site selection for Kolkata City, India. J. Air Waste Manag. Assoc. 2014, 64, 846–861. [Google Scholar] [CrossRef] [Green Version]
- Majer, J.D. Beeston. The biodiversity integrity index: An illustration using ants in Western Australia. Conserv. G Biol. 1996, 10, 65–73. [Google Scholar] [CrossRef] [Green Version]
- Paulo, J.V.O. Effect of the type of soil on the cyclic behaviour of chemically stabilised soils unreinforced and reinforced with polypropylene fibres. Soil Dyn. Earthq. Eng. 2018, 115, 336–343. [Google Scholar] [CrossRef]
- Brick Makers. Product Catalogue. 2009. Available online: https://brikmakers.com/docs/dec09-catalogue.pdf (accessed on 15 April 2021).
- The Government of Western Australia. Construction Industry Snapshot Western Australia. 2016. Available online: http://ctf.wa.gov.au/wp-content/uploads/2019/10/WA-Construction-Industry-Snapshot-May-2016-.pdf (accessed on 15 April 2021).
Figure 1.
Schematic for experimental process.

Figure 2.
(a) Recycled HDPE crumb; and (b) specimens.

Figure 3.
Particle size distribution for soil mixture, HDPE and natural aggregates.

Figure 4.
Test setup. (a) Unconfined compressive strength; (b) split-tensile test; (c) water absorption test.
Figure 4.
Test setup. (a) Unconfined compressive strength; (b) split-tensile test; (c) water absorption test.

Figure 5.
Example eco-efficiency analysis portfolio [41].
Figure 5.
Example eco-efficiency analysis portfolio [41].

Figure 6.
Failed specimens under compression.

Figure 7.
Environmental impacts of RE, conventional bricks and concrete bricks.

Figure 8.
Breakdown of two dominant impacts (global warming and water use) in terms of inputs.

Figure 9.
Economic costs of REs, traditional bricks and concrete bricks.

Figure 10.
EEportfolios of REs (RM1, RM2, RM3 and RM4), traditional and concrete bricks (TB1, TB2 and CB).
Figure 10.
EEportfolios of REs (RM1, RM2, RM3 and RM4), traditional and concrete bricks (TB1, TB2 and CB).


Table 1.
CSRE mix designs.
| Mixes. | Gravel | Sand | Clay and Silt | HDPE Aggregate | MDD (kg/m3) | OPC (%) |
|---|---|---|---|---|---|---|
| RE1 | 25% | 55% | 20% | - | 2181 | 8.5 |
| RE2 | 20% | 55% | 20% | 5% | 2038 | 8.40 |
| RE3 | 18% | 55% | 20% | 7% | 1973 | 8.35 |
| RE4 | 15% | 55% | 20% | 10% | 1919 | 8.20 |
Table 2.
Life cycle inventory of RE mixtures.
| Inputs/Constituents | RE Brick Mixes | Sources of Materials | |||
|---|---|---|---|---|---|
| RE1 | RE2 | RE3 | RE4 | ||
| Ordinary Portland Cement (OPC) | 176 | 164 | 162 | 156 | Cockburm Swan Munster |
| Sand | 1211 | 1127 | 1110 | 1074 | Hanson, Lexia |
| Clay and silt | 264 | 246 | 242 | 234 | Welshpool |
| Gravel | 550 | 410 | 363 | 293 | Holcim Gosnells |
| HDPE aggregate | 0 | 102 | 141 | 195 | Welshpool |
| Total weight excl. water (kg) | 2201 | 2049 | 2019 | 1952 | |
| tkm | 63.3 | 57.7 | 56.4 | 53.8 | |
| Manufacturing kWh | 0.75 | 0.75 | 0.75 | 0.75 | |
Table 3.
Impact assessment methods to estimate the environmental impacts.
| Impact Assessment Method | Environmental Impact | Unit |
|---|---|---|
| IPCC GWP 100 [25] | Global warming | t CO2 eq |
| Australian indicator set v2.01 | Eutrophication | kg PO43- eq |
| Water depletion | m3 H2O | |
| Land use and ecological diversity | Ha a | |
| ReCiPe 2008 [26] | Human toxicity | kg 1,4-DB eq |
| Terrestrial ecotoxicity | kg 1,4-DB eq | |
| Freshwater ecotoxicity | kg 1,4-DB eq | |
| Marine ecotoxicity | kg 1,4-DB eq | |
| CML 2 baseline 2001 [27] | Abiotic depletion | kg Sb eq |
| ReCiPe Midpoint (E) V1.12/Europe Recipe E [26] | Ozone depletion | kg CFC-11 eq |
| Acidification | kg SO2 eq | |
| Photochemical smog | kg NMVOC | |
| Ionising radiation | kg U235 eq | |
| TRACI v2.1 [28] | Respiratory inorganics | kg PM2.5 eq |
eq—equivalent, CO2—carbon dioxide, PO43-—phosphate, Ha. a—hectare years, NMVOC—non-methane volatile organic compounds, U235—uranium 235, Sb—antimony, CFC—chlorofluorocarbon, SO2—sulphur dioxide, PM—particulate matter.
Table 4.
Cost of inputs of RE mixes.
| Items | Unit Cost | RE1 | RE2 | RE3 | RE4 | Source of Unit Cost |
|---|---|---|---|---|---|---|
| OPC | AUD 0.41/kg | 71.5 | 66.6 | 65.6 | 63.4 | [32] |
| Sand | 0.037/kg | 44.8 | 41.7 | 41.1 | 39.8 | [23] |
| Clay | AUD 0.45/kg | 118.9 | 110.6 | 109 | 105.4 | [33] |
| Gravel | AUD 0.11/kg | 58.0 | 43.2 | 38.3 | 30.9 | [23] |
| HDPE | AUD 0.80/kg | 0.0 | 82.0 | 113 | 156.2 | [34] |
| Transport | AUD 0.082/tkm | 5.2 | 4.7 | 4.6 | 4.4 | [35] |
| Manufacturing | AUD 0.4/kWh | 0.3 | 0.3 | 0.3 | 0.3 | [36] |
| Labour | AUD 31.25/m3 | 31.25 | 31.25 | 31.25 | 31.25 | [30,31] |
Table 5.
Gross domestic environmental impact and weighting factor of impact indicators used in the LCIA.
Table 5.
Gross domestic environmental impact and weighting factor of impact indicators used in the LCIA.
| Indicator | Units | GDEI | WF (%) |
|---|---|---|---|
| Global warming potential | kg CO2 eq | 28690 | 19.5 |
| Eutrophication | kg PO4 eq | 19 | 2.9 |
| Land use | Ha a | 26 | 20.9 |
| Water depletion | m3 H2O | 930 | 6.2 |
| Terrestrial acidification | kg SO2 eq | 123 | 3.1 |
| Ozone depletion | kg CFC−11 eq | 0.002 | 3.9 |
| Abiotic depletion | kg Sb eq | 300 | 8.2 |
| Photochemical oxidant formation | kg NMVOC eq | 17 | 2.8 |
| Terrestrial ecotoxicity | kg 1,4-DB eq | 88 | 10.3 |
| Freshwater ecotoxicity | kg 1,4-DB eq | 172 | 6.9 |
| Marine ecotoxicity | kg 1,4-DB eq | 12,117,106 | 7.7 |
| Human toxicity | kg 1,4-DB eq | 3,216 | 2.7 |
| Ionising radiation | kBq U235 eq | 1,306 | 1.9 |
| Particulate matter formation | kg PM2.5 eq | 45 | 3 |
Table 6.
Summary of compressive test results.
| Specimen No. | Unconfined Compressive Strength (MPa) | |||
|---|---|---|---|---|
| RE1 (0% HDPE) | RE2 (5% HDPE) | RE3 (7% HDPE) | RE4 (10% HDPE) | |
| S1 | 6.62 | 9.28 | 9.43 | 10.74 |
| S2 | 8.18 | 7.46 | 8.64 | 9.93 |
| S3 | 7.76 | 6.62 | 9.59 | 9.55 |
| S4 | 8.45 | 5.32 | 7.71 | 8.55 |
| S5 | 7.98 | 7.33 | 8.05 | 9.53 |
| Average | 7.80 | 7.20 | 8.68 | 9.66 |
| Std | 0.71 | 1.44 | 0.83 | 0.79 |
Table 7.
Summary of split-tensile test results.
| Specimen No. | Split-Tensile Strength (MPa) | |||
|---|---|---|---|---|
| RE1 (0% HDPE) | RE2 (5% HDPE) | RE3 (7% HDPE) | RE4 (10% HDPE) | |
| S1 | 1.48 | 1.10 | 1.16 | 1.21 |
| S2 | 1.49 | 0.93 | 1.13 | 1.01 |
| S3 | 1.53 | 1.23 | 1.06 | 1.14 |
| S4 | 1.30 | 1.19 | 1.24 | 0.95 |
| S5 | 1.73 | 1.24 | 1.20 | 1.06 |
| Average | 1.51 | 1.14 | 1.16 | 1.08 |
| Std | 0.16 | 0.13 | 0.07 | 0.10 |
Table 8.
Summary of water absorption test results.
| Group No. | Specimen No. | Specimen Weight (g) | Wi (%) | Average Wi (%) | |
|---|---|---|---|---|---|
| Water Soaked | Oven Dried | ||||
| RE1 | S1 | 2026 | 1905 | 6.35 | 6.46 |
| S2 | 2039 | 1919 | 6.25 | ||
| S3 | 2020 | 1892 | 6.77 | ||
| RE2 | S1 | 1916 | 1801 | 6.39 | 6.60 |
| S2 | 1848 | 1733 | 6.64 | ||
| S3 | 1875 | 1756 | 6.78 | ||
| RE3 | S1 | 1857 | 1741 | 6.66 | 6.72 |
| S2 | 1755 | 1641 | 6.95 | ||
| S3 | 1884 | 1768 | 6.56 | ||
| RE4 | S1 | 1766 | 1655 | 6.71 | 6.82 |
| S2 | 1790 | 1678 | 6.67 | ||
| S3 | 1772 | 1655 | 7.07 | ||
Table 9.
Land conservation in Western Australia due to use of recycled HDPE in bricks.
| Years | HDPE Waste Produced (Million Tonnes) | Recycled HDPE (Million Tonnes) | Landfill Area Avoided (Ha) | Quarrying Avoided (Ha) | Total Land Avoided (Ha) | ||||||||
|---|---|---|---|---|---|---|---|---|---|---|---|---|---|
| M2 | M3 | M4 | M2 | M3 | M4 | M2 | M3 | M4 | M2 | M3 | M4 | ||
| 2021 | 1.73 | 0.34 | 0.47 | 0.65 | 3.33 | 4.84 | 6.98 | 18.70 | 25.80 | 35.64 | 22.03 | 30.64 | 42.61 |
| 2022 | 1.86 | 0.37 | 0.51 | 0.70 | 3.64 | 5.29 | 7.60 | 20.20 | 27.87 | 38.49 | 23.84 | 33.15 | 46.09 |
| 2023 | 2.01 | 0.40 | 0.55 | 0.76 | 3.99 | 5.77 | 8.28 | 21.82 | 30.09 | 41.57 | 25.80 | 35.86 | 49.84 |
| 2024 | 2.17 | 0.43 | 0.59 | 0.82 | 4.36 | 6.29 | 9.01 | 23.56 | 32.50 | 44.89 | 27.92 | 38.79 | 53.90 |
| 2025 | 2.35 | 0.46 | 0.64 | 0.88 | 4.76 | 6.86 | 9.81 | 25.45 | 35.10 | 48.48 | 30.21 | 41.96 | 58.29 |
| 2026 | 2.54 | 0.50 | 0.69 | 0.95 | 5.20 | 7.47 | 10.67 | 27.48 | 37.91 | 52.36 | 32.68 | 45.38 | 63.03 |
| 2027 | 2.74 | 0.54 | 0.74 | 1.03 | 5.68 | 8.14 | 11.60 | 29.68 | 40.94 | 56.55 | 35.36 | 49.08 | 68.15 |
| 2028 | 2.96 | 0.58 | 0.80 | 1.11 | 6.19 | 8.86 | 12.61 | 32.05 | 44.22 | 61.07 | 38.25 | 53.08 | 73.69 |
| 2029 | 3.20 | 0.63 | 0.87 | 1.20 | 6.75 | 9.65 | 13.71 | 34.62 | 47.76 | 65.96 | 41.37 | 57.40 | 79.67 |
| 2030 | 3.45 | 0.68 | 0.94 | 1.30 | 7.36 | 10.49 | 14.89 | 37.39 | 51.58 | 71.24 | 44.75 | 62.07 | 86.13 |
| Total | 25.01 | 4.93 | 6.80 | 9.39 | 51.27 | 73.67 | 105.16 | 270.95 | 373.77 | 516.24 | 322.22 | 447.44 | 621.40 |
Table 10.
Biodiversity index.
| Years | Biodiversity Index | % of Improvement | |||||
|---|---|---|---|---|---|---|---|
| RE1 | RE2 | RE3 | RE4 | RE2 | RE3 | RE4 | |
| 2021 | 33.63 | 48.71 | 54.60 | 62.79 | 45% | 62% | 87% |
| 2022 | 33.63 | 49.95 | 56.32 | 65.17 | 49% | 67% | 94% |
| 2023 | 33.63 | 51.29 | 58.17 | 67.74 | 53% | 73% | 101% |
| 2024 | 33.63 | 52.74 | 60.18 | 70.52 | 57% | 79% | 110% |
| 2025 | 33.63 | 54.31 | 62.35 | 73.52 | 61% | 85% | 119% |
| 2026 | 33.63 | 56.00 | 64.69 | 76.77 | 67% | 92% | 128% |
| 2027 | 33.63 | 57.83 | 67.22 | 80.27 | 72% | 100% | 139% |
| 2028 | 33.63 | 59.81 | 69.96 | 84.06 | 78% | 108% | 150% |
| 2029 | 33.63 | 61.95 | 72.92 | 88.15 | 84% | 117% | 162% |
| 2030 | 33.63 | 64.26 | 76.11 | 92.58 | 91% | 126% | 175% |
Publisher’s Note: MDPI stays neutral with regard to jurisdictional claims in published maps and institutional affiliations. |
© 2021 by the authors. Licensee MDPI, Basel, Switzerland. This article is an open access article distributed under the terms and conditions of the Creative Commons Attribution (CC BY) license (https://creativecommons.org/licenses/by/4.0/).
Share and Cite
MDPI and ACS Style
Biswas, W.K.; Zhang, X. Techno-Assessment of the Use of Recycled Plastic Waste in RE. Sustainability 2021, 13, 8678. https://0-doi-org.brum.beds.ac.uk/10.3390/su13168678
AMA Style
Biswas WK, Zhang X. Techno-Assessment of the Use of Recycled Plastic Waste in RE. Sustainability. 2021; 13(16):8678. https://0-doi-org.brum.beds.ac.uk/10.3390/su13168678
Chicago/Turabian StyleBiswas, Wahidul K., and Xihong Zhang. 2021. "Techno-Assessment of the Use of Recycled Plastic Waste in RE" Sustainability 13, no. 16: 8678. https://0-doi-org.brum.beds.ac.uk/10.3390/su13168678
Note that from the first issue of 2016, this journal uses article numbers instead of page numbers. See further details here.