
Financial Development and Renewables in Southeast Asian Countries—The Role of Organic Waste Materials


1
Department of Mathematics, Thuongmai University, Hanoi 100000, Vietnam
2
Institute of Graduate Studies, Thu Dau Mot University, Thu Dau Mot City 820000, Vietnam
*
Author to whom correspondence should be addressed.
Sustainability 2021, 13(16), 8748; https://0-doi-org.brum.beds.ac.uk/10.3390/su13168748
Submission received: 28 April 2021
/
Revised: 24 July 2021
/
Accepted: 30 July 2021
/
Published: 5 August 2021
(This article belongs to the Special Issue Sustainability and Innovation in an Era of Global Change)
Abstract
:This paper aims to fill the existing gap by investigating the linkage between organic waste materials, financial development and renewables in Southeast Asia; this is the very first study covering this area. Using panel data of ten economies in this area in the period of 1990–2016 and estimating the advanced regression method in statistics of pooled mean group (PMG) estimates, the paper aims to examine the panel unit root tests in the first and second generations, as well as cointegration tests followed by Pedroni, Kao, and Westerlund tests; the results demonstrate that there is a negative impact from financial development on renewables. Further, biofuel processing is consistent with renewables that are predominantly made from organic matter and wastes. In addition, biofuel sources can be proxied by three factors, namely agricultural land, forest land, and number of heads of cattle livestock. The agricultural land has a negative and statistically significant impact on renewables while cattle livestock has a positive effect in the long run. Additionally, a higher level of trade openness has a lower level of renewables in the case of Southeast Asian countries.
1. Introduction
Renewable energy is energy that is collected from renewable resources, for example, carbon neutral sources, such as light, sun, wind, rain, waves, and heat. Renewables significantly provide energy for the purposes of sustainable development in contrast to fossil fuels. In fact, renewables have largely contributed to energy consumption of humans and electrical demands in production [1]. The renewable-related energy consumption can be divided into traditional biomass, hydroelectricity, wind, solar, geothermal and other kinds of biomass [1,2]. In addition, biofuels have been considered as the main source of renewable energy that significantly reduces CO2 emissions and protects sustainable development. Biofuels are renewable energy sources that are mostly made from organic matter wastes. Theoretically, biofuels are produced through modern processes from biomass while most fuels, i.e., fossil fuels, today are produced from geological processes [1,2,3]. Fossil fuels include natural gas, oil shales, coal, tar sands, bitumen, petroleum, and other resources. As suggested in [4], fossil fuels have played an important role in global energy systems; moreover, the impacts of climate change and the rise in sea level have reached unprecedented levels on a global scale. Accordingly, biofuels in particular and renewables in general represent some of the most important sources of clean energy in use.
In the context of the fourth industrial revolution, the use of renewables has been the crucial target to protect the environment and sustainable development. In particular, due to the increasing demand of energy consumption, fossil fuels have significantly increased over the last few decades. According to the database of World Development Indicators of World Bank, fossil fuel consumption has increased approximately eight-fold since 1950, and has doubled since 1980 [4]. However, a changing climate has impacted ecology and human beings’ lives and has caused the global temperature to rise. The use of renewables can not only protect the environment but also reduce the use of fossil fuels.
Not including Timor-Leste, a small nation occupying half of the island of Timor with approximately 15.005 km2 and 1.27 million habitants in 2018, ten countries in the studied region have joined the Association of Southeast Asian Nations (ASEAN). This organization has some member states with great economies such as Singapore, Malaysia, Thailand, Indonesia, and Philippines (ASEAN5) and some member states with less developed economies such as Cambodia, Laos, Myanmar, and Vietnam (CLMV). In addition, Indonesia is the biggest economy in southeast Asia with more than one trillion dollars in GDP, and is a member of G20, while Singapore is the most developed economy with a per capita GDP higher than most European economies.
Recently, numerous empirical studies have been able to apply economic modeling to estimate factors affecting renewables, especially both organic waste materials and financial development. There have not been any studies that have analyzed how organic waste materials impact renewables in the group of ASEAN economies. Therefore, when conducting this research, the aim of this study was to fulfill the existing gap by discussing the linkages between organic waste materials, financial development, and renewables in southeast Asia. Specifically, organic waste materials can be represented by three factors, namely agricultural land (% total land area), forest land (% total land area), and number of cattle livestock’s heads. Accordingly, the purpose of this study was to find out the links between how major factors can impact renewables throughout 1990–2016. In addition, panel data analysis and pooled mean group (PMG) estimates will be focused on in this study.
One can find some related research on the impacts of financial development on renewables carried out for developed countries [5,6,7] and developing countries in Latin American countries [8], some Eurasian countries [9], and for specific countries such as Brazil [10] or China [11]. Therefore, this is actually the very first study on the group of developing southeast Asian countries.
The structure of this paper is as follows: Section 2 offers a literature review while Section 3 describes the data collection and methodology. The regression results are shown in Section 4, while a discussion is presented in Section 5. Section 6 discusses the enhancement of renewables and biofuel processing. Finally, Section 7 covers the conclusions regarding organic waste materials and financial development in southeast Asian economies.
2. Literature Review
In recent years, a few existing studies have applied economic modeling to investigate factors influencing renewables worldwide. In most cases, fossil fuels are known as the most affected factor that can affect renewables [3,12,13]. Further, fossil fuels have negative and significant impacts in terms of environmental degradation [14,15,16]. In the trends of the fourth industrial revolution and digital transformation, a clean energy and eco-friendly environment are highly sought after. Nowadays, environmental degradation has become a serious global problem damaging health, human beings and sustainable development. Therefore, using more renewables in modern society has been more preferred in numerous previous studies [17,18,19,20,21,22].
By analyzing a group of advanced and developed economies in the European Union, there is a relationship between the development of renewables market in relation to biofuels [17]. A significant change in biofuel development and trends in renewables in the EU could be analyzed. More specifically, while the production in biodiesels increased by approximately 1852.2% between 2003 (719.32 million liters) and 2017 (13,323 million liters), the trends in biofuels processing and production slightly declined at roughly 2.56%, from 13,673 million liters in 2014 to 13,323 million liters in 2017, and further suggested the increase in the green energy market by 2030. Similarly, the competitive renewables have focused on energy transition, especially the biofuel regulation in Brazil [19]. This country has announced the regulatory framework followed by Law of biofuels and the regulation of criteria for emission of tradable goods and services for both producers and importers. In addition, the development of the oil-heat industry dramatically changed, and the use of biodiesel-blended fuel oil was supported by greater standards for fuel quality and therefore supported by the potential market for biodiesel producers [20].
Following [21], a study on the impact of financial development and trade openness with regard to renewables, in a sample of worldwide meta-data with three subsamples such as upper-middle-income, middle-income, and low-income economies, one can see more empirical evidence on this topic. By using panel non-linear autoregressive distributed lagged (NADL), with data covering the 1990–2017 period, a major finding indicates that there existed a long-running relationship between financial development, trade openness, capital flows, and renewables in all three subsamples. Further examining this relationship in the short term, the study still found the evidence for upper-middle-income and middle-income economies, but not lower-income economies.
The authors of [22] conducted a study on the European Union using a panel data of 28 economies in the period 1990–2015; the aim of this study was to estimate the effect of income, energy price shocks, financial development, and foreign investment on renewable energy consumption. To summarize financial development, the authors of [22] proposed three dimensions—capital market, banking sector, and bond market. The results indicated that all three proxies of financial development had a positive and statistically significant effect on share of renewables. Additionally, development in the capital market did not promote renewables in new EU member countries. Therefore, deployment of capital in the renewable sector could predominantly provide cost-competitive selection and generally help to expand high value-added services to customers. Similarly, considering the case of India with time-series data covering the period 1971–2015, the authors of [18] discussed the cointegration test followed by Maki’s theory and included five structural breaks in the series and concluded that there existed a long-running linkage among factors as financial development, renewables, and income. Furthermore, dynamic estimation results indicated positive and significant impacts of income and financial development on consumption of renewables. Causality test results also demonstrated that renewables were driven by financial development in the long run.
Southeast Asia consists of 11 countries stretching from eastern India to China. Southeast Asian countries’ diversity is at the center of the Asia’s swift economic growth. Southeast Asia’s 11 economies have an aggregate gross domestic product (GDP) of $4.7 trillion, with a population of almost 674 million people [23,24]. The incorporation of these countries into the global economy has created a major influence on the distribution of the region in the center of the Asia’s swift economic growth. Additionally, the main source of livelihood in most countries in this region, all except for Brunei and Singapore, is agriculture. Therefore, these countries are great sources for organic waste materials that come from agriculture. This study concerns the impact of both organic waste materials and financial development on renewables—one of the key issues of sustainable economic development.
3. Data and Methodology
3.1. Data
In this study, we collected data from World Development Indicators (WDI) of World Bank, and Department of Statistics (DOS) in southeast Asian countries [25]. There are ten countries in southeast Asia such as Brunei Darussalam, Cambodia, Indonesia, Laos, Myanmar, Malaysia, Philippines, Singapore, Thailand, and Vietnam. The data were collected from 1990 to 2016 and analyzed by Stata 15 software. Unfortunately, due to a lack of data on southeast Asian countries, the time span of the research was restricted. Although, we missed the COVID-19 triggered financial crisis, we will definitely deploy the research of this study and relate it to the pandemic in the near future. Table 1 shows the variables and the measurement of variables in the study, as follows:
Based on [1,2], the renewable-related energy consumption can be divided into traditional biomass, hydroelectricity, wind, solar, geothermal and other kinds of biomass. Thus, renewables can be counted by renewable energy consumption (% of total final energy consumption). This is also supported by [26], who express the need for fixed mandatory national goals for the share of renewable energy consumption on total final energy consumption in EU countries.
In some previous studies, financial development has been denoted as the process of establishing and the growing of financial institutions, instruments, and markets [27]. In addition, a great financial development has brought the connection between savers and borrowers by reducing transaction costs. As shown by [28], financial development indicates a combination of financial institutions and markets. A common proxy of financial development usually shows either the ratio of private credit to GDP or stock market capitalization to GDP. Due to the unavailability of data of stock market capitalization to GDP, the ratio of private credit to GDP is regularly preferred as the proxy of financial development. This proxy is also supported by [29,30].
3.2. Research Model
Theoretically, financial development and its impact on renewables have been examined by a number of previous studies. However, different from previous studies, we will examine the impact of organic waste materials on renewables which has not been much studied worldwide. Regarding the technique used in this study, we will apply Pooled Mean Group (PMG) estimates for panel data. According to [31], both T, the number of time series observations, and N, the number of entities, are large in the background of a panel. While a mean group (MG) is useful for the case of N separate regressions, PMG is acceptable in the case of both long- and short-running relationships and error variances that differ across entities. As suggested in [32], a PMG estimator can promote consistent estimates of short-run coefficients’ means across the entities by deploying the average of individual entity coefficients. Additionally, the asymptotics of a large N and large T in the panel significantly differ from the asymptotics of a traditionally large N and short T in the panel [33]. In light of small T in the panel, the estimation usually relies on either fixed or random effects estimators or a combination of these [34,35].
In addition, the panel unit root tests should be analyzed according to first- and second-generation panel unit root tests. Furthermore, this study will apply Pedroni, Kao, and Westerlund tests for cointegration.
To examine this effect, we propose the following model:
RECit = function (organic waste materialsit, financial developmentit).
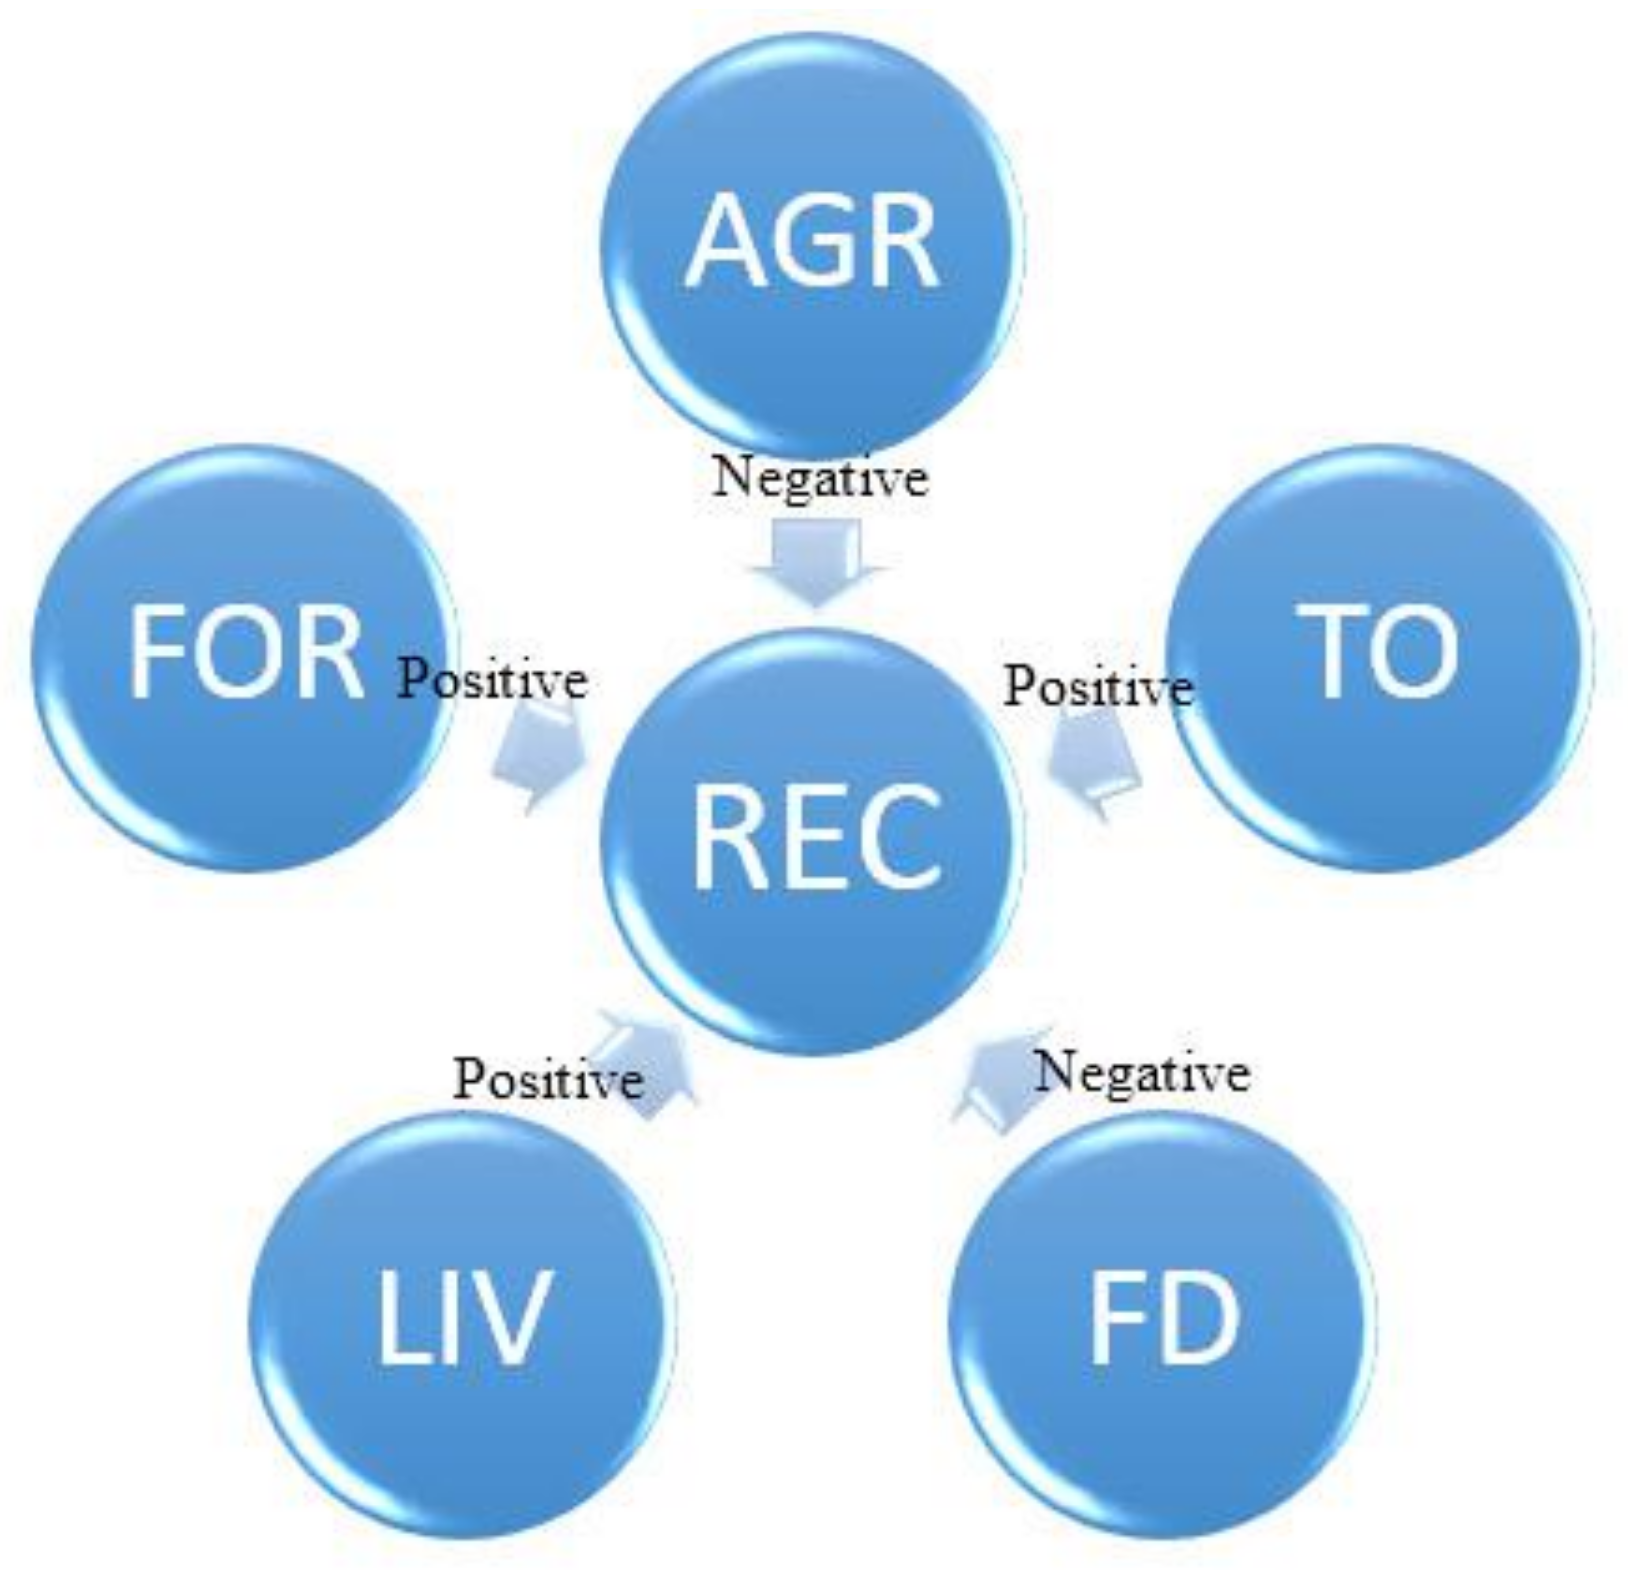
In this case, organic waste materials can be represented by three factors: agriculture land (AGR), forest land (FOR), and number of cattle/livestock (LIV). Therefore, we have:
RECit = function (AGRit, FORit, LIVit, FDit, TOit).
In order to estimate this effect based on the long-running and short-running relationships, the PMG approach corresponding to the above equation with REC as the dependent variable is given as follows:
where
- -
- αi (i = 1, 2…n) is the unknown intercept for each country (n country-specific intercepts);
- -
- RECit is the explanatory variable; i and t denote for country i and the time t;
- -
- Xit denotes an independent variable. It includes AGR, FOR, LIV, FD, and TO;
- -
- β1 is the coefficient for that independent variable;
- -
- uit is the error term;
- -
- , group-specific speed of adjustment coefficient (expected that < 0);
- -
- = vector of long-running relationships;
- -
- ECT = , the error correction terms;
- -
- are the short-running dynamic coefficients.
From the literature review and the authors’ conjecture, Table 2 shows several hypotheses on significance of potential regressors selected from the literature review.
With a proper theoretical and practical background as in Table 2, a research model of the relationship among agriculture land, forest land, cattle livestock, financial development, trade openness and renewables can be modelized, as in Figure 1.
The hypothesis for the research model comes from evaluation of the factors affecting renewables for southeast Asian countries. Therefore, there are five assumptions for the model in Figure 1, as follows:
Hypothesis 1 (H1).
Agriculture land has a negative impact on renewables;
Hypothesis 2 (H2).
Forest land has a positive impact on renewables;
Hypothesis 3 (H3).
Cattle livestock has a positive impact on renewables;
Hypothesis 4 (H4).
Financial development has a negative impact on renewables;
Hypothesis 5 (H5).
Trade openness has a positive impact on renewables.
4. Results of Economic Modelling
4.1. Descriptive Statistics
Table 3 and Table 4 indicate descriptive statistics regarding organic waste materials, financial development, and renewables in southeast Asian countries. There are 270 observations covering 27 years from 1990 to 2016. Firstly, Table 3 shows that renewables have remarkably contributed to total final energy consumption in Cambodia (58.54%), Indonesia (43.21%), Laos (74.86%), Myanmar (79.11%), and Vietnam (50.48%), while have made an insignificant contribution for Singapore (0.48%), Malaysia (6.32%), and Brunei (0.05%). It depicts that few economies have not relied on renewables and still use more non-renewables for their energy consumption. Table 3 also shows that financial development in southeast Asian countries is much too different in the 1990–2016 period with the maximum rates for Malaysia (116.72% GDP), Singapore (98.87% GDP), and Thailand (47.67% GDP), and the minimum rate for Indonesia (11.41% GDP), Cambodia (19.21% GDP), and Brunei (14.64% GDP) on average.
Table 4 indicates that renewables in southeast Asian countries significantly changed, with a minimum value of zero and maximum value of 91.11%. Similarly, a minimum value of zero and maximum value of 158.50% were found for the level of financial development. Regarding organic waste materials, three factors such as forest land (% of total land area), agriculture land (% of total land area), and number of livestock reached, in a logarithm, peaks of 82.10%, 43.28%, and 7.21%, respectively. Table 4 indicates that the value of TO remarkably changed, between 0 and 437.32%, meaning that few countries have high trade openness.
4.2. Panel Unit Root Tests (Purts)
Theoretically, the aim of a panel unit root test is to check the stationarity of series in the study. There are two methods of testing unit root such as first- and second-generation panel unit root tests. The results will be shown in Table 5.
We applied the Levin Lin Chu (LLC), test, and IM Pesaran Shin (IPS) test for the first-generation PURTs and the Breitung test and Fishers PP tests for the second-generation PURTs. Table 5 highlights that all series such as AGR, LIV, and TO are not stationary at this level but are stationary at the first difference. Series such as FOR and REC are not stationary according to the LLC test, IPS test, and Breitung test at this level but are stationary according to the Fishers PP test. In addition, FD is stationary at this level according to the LLC test, but not stationary based on other tests.
Multi-collinearity could exist if the correlation coefficient among variables is 0.8 and more. It means that a strong correlation can be present due to a high value of pairwise collections between independent variables [15,16]. Table 6 shows that the maximum correlation coefficient is 0.7476 and does not exceed 0.8; therefore, we conclude that there is less multi-collinearity in this study. This argument is also confirmed by Variance Inflation Factor (VIF) as shown in Table 7, when the coefficients of all variables are less than 10, showing that no multi-collinearity problem can be present.
4.3. Optimal Lag Length and Cointegration Tests
To conduct the regression, we selected the optimal lag length based on the most common lag for each variable; in this case, it should be (1, 0, 0, 2, 0, 0).
Regarding cointegration tests, it is important to confirm that the presence of a long-running linkage among integrated variables should be analyzed; with time-series data, stationarity is in agreement with constant mean and variance. In this case, we applied three cointegration tests according to Pedroni, Kao, and Westerlund.
Cointegration tests are discussed in Table 8 with a lag length of (1, 0, 0, 2, 0, 0). The Pedroni test uses four factors, panel-v, panel-rho, panel-PP, panel-ADF, and a group statistic such as group-rho, group-PP, and group-ADF; we only found a cointegration phenomenon based on panel-v. In addition, from the Kao t-statistic using assumptions of homogeneity in panel data and performed by a least squared dummy variable, it is evident that a cointegration phenomenon was also found in this test. Additionally, regarding the Westerlund t-statistic with four factors such as Gt, Ga, Pt, and Pt, Table 8 also indicates that there is cointegration. In conclusion, there is a long-running linkage among variables.
4.4. Estimated Results
4.4.1. Estimated Regression
4.4.2. Robustness Check
Robustness checks involve alternative specifications that test the same hypothesis, and the results are robust so it is possible that the assumptions may be true. In this case, this check confirms that the major regression coefficient could be met. Accordingly, we ran the model with/without TO and therefore we could compare both scenarios (see Table 8).
5. Discussion
5.1. Financial Development
As previously suggested, financial development is a crucial factor of economic development and enhancement of productivity. The relationship between financial development and renewables has been extensively examined in a literature review according to the studies of [22].
In this case, Table 9 indicates that the regression coefficient FD is negative and statistically significant in the long run and also insignificant in the short run. This finding can be explained that a higher level in financial development has a negative effect on the use of renewables in the case of southeast Asian economies. This can be explained by the fact that most southeast Asian economies have tried to enhance the economic performance by a large expansion of financial development—for example, Vietnam and the Philippines have lower incomes but higher financial development than Indonesia. Particularly, Vietnam’s level of financial development is similar to Singapore. In addition, southeast Asian economies have focused on green finance initiatives to develop and enhance climate-positive projects and especially ensure green, sustainable development in the region with the target of low-carbon, climate-resilient progress that meets the demands of local [23]. These positive initiatives need a long time to prove the benefits.
This finding is not consistent with [22] in a study on 28 European Union economies in the 1990–2015 period. In fact, these advanced and developed economies have undergone great financial development, while most southeast Asian economies are developing and emerging. In other cases, a long-running relationship between financial development and renewables in all upper-middle- income, middle-income, and low-income economies has been established in the long run, but no impact for lower-income economies in the short run [21]. In addition, the authors of [22] even indicated that capital market development does not enhance renewables in new EU member countries.
5.2. Organic Waste Materials
Theoretically, biofuels are renewable sources and are made from organic matter wastes. Organic waste materials could be used to create biofuels. From the statistics, organic waste materials are proxied by three factors, AGR, FOR, and LIV. Results in Table 9 indicate that AGR is negative and statistically significant in the long run but insignificant in the short run. This effect is somewhat strong, meaning that agriculture land has a great and negative impact on REC in southeast Asian economies in the long run. In contrast, we have found that LIV has a positive and significant impact on REC.
The regression coefficient of the variable of organic waste materials is mixed and dependent on the proxy. Specifically, these findings indicate that more agricultural land will significantly reduce renewables while higher forest land will positively increase renewables. This finding is strongly explained by the suggestions from research into macroeconomics, using agricultural and forest land as substitutes. This finding is mainly supported by [17] in the case of European Union economies. In fact, the trends of biofuel processing and production have significantly changed in recent years in light of competitive renewables and energy transition [19]. In light of using land for agriculture, the demands for all purposes related to land use are greater than the land resources available. Therefore, depending on land use expansion, this is not preferred in most economies. In this case, enhancing productivity per land area unit should be considered; the authors of [41] demonstrate that development of land ownership can significantly enhance efficiency in the case of missing land ownership in southeast Asian countries, especially from Vietnam, Laos, and Myanmar.
5.3. Other Factors
The results of this study indicate that the regression coefficient of TO is positive and significant, meaning that trade openness has a significant positive effect on renewables. Specifically, a country with a higher level of trade openness will entirely generate renewable energy consumption. In this case, Singapore, and Malaysia have high openness economies but renewables have remarkably contributed to total final energy consumption—only 0.48% for Singapore, and 6.32% for Malaysia—but the proportion of renewables used for energy consumption is increasing. Economies with greater renewables and low trade openness are Myanmar, Cambodia, Indonesia, and Laos, but the financial resources of these economies for investing renewables are limited. Consistent with previous studies, [21] also found the relationship between trade openness and renewables in the case of meta-data analysis.
6. Implications of Development of Renewables and Biofuel Processing in Southeast Asia
In the fourth industrial revolution and digital transformation, the change from fossil fuels such as oil, coal, natural gas, petroleum, heavy oils, bitumens, and tar sands to renewables such as wind, solar, hydro, and especially biofuels and other energy sources has been known as an important target to protect environmental degradation and sustainable development. In reality, biofuels are renewables that are mostly produced from biological, organic matter wastes. As suggested in [42], biofuels will be an alternative energy source in southeast Asia in the future. In addition, fossil fuels can be created from decomposed plants and animals which have been predominantly buried underground for tens of years. Regarding the development of human beings, southeast Asian countries have benefitted from the most agricultural products. In fact, agriculture has played a major role in the birth and growth of human civilization in this area by developing farming, harvesting, and domesticating livestock and cattle.
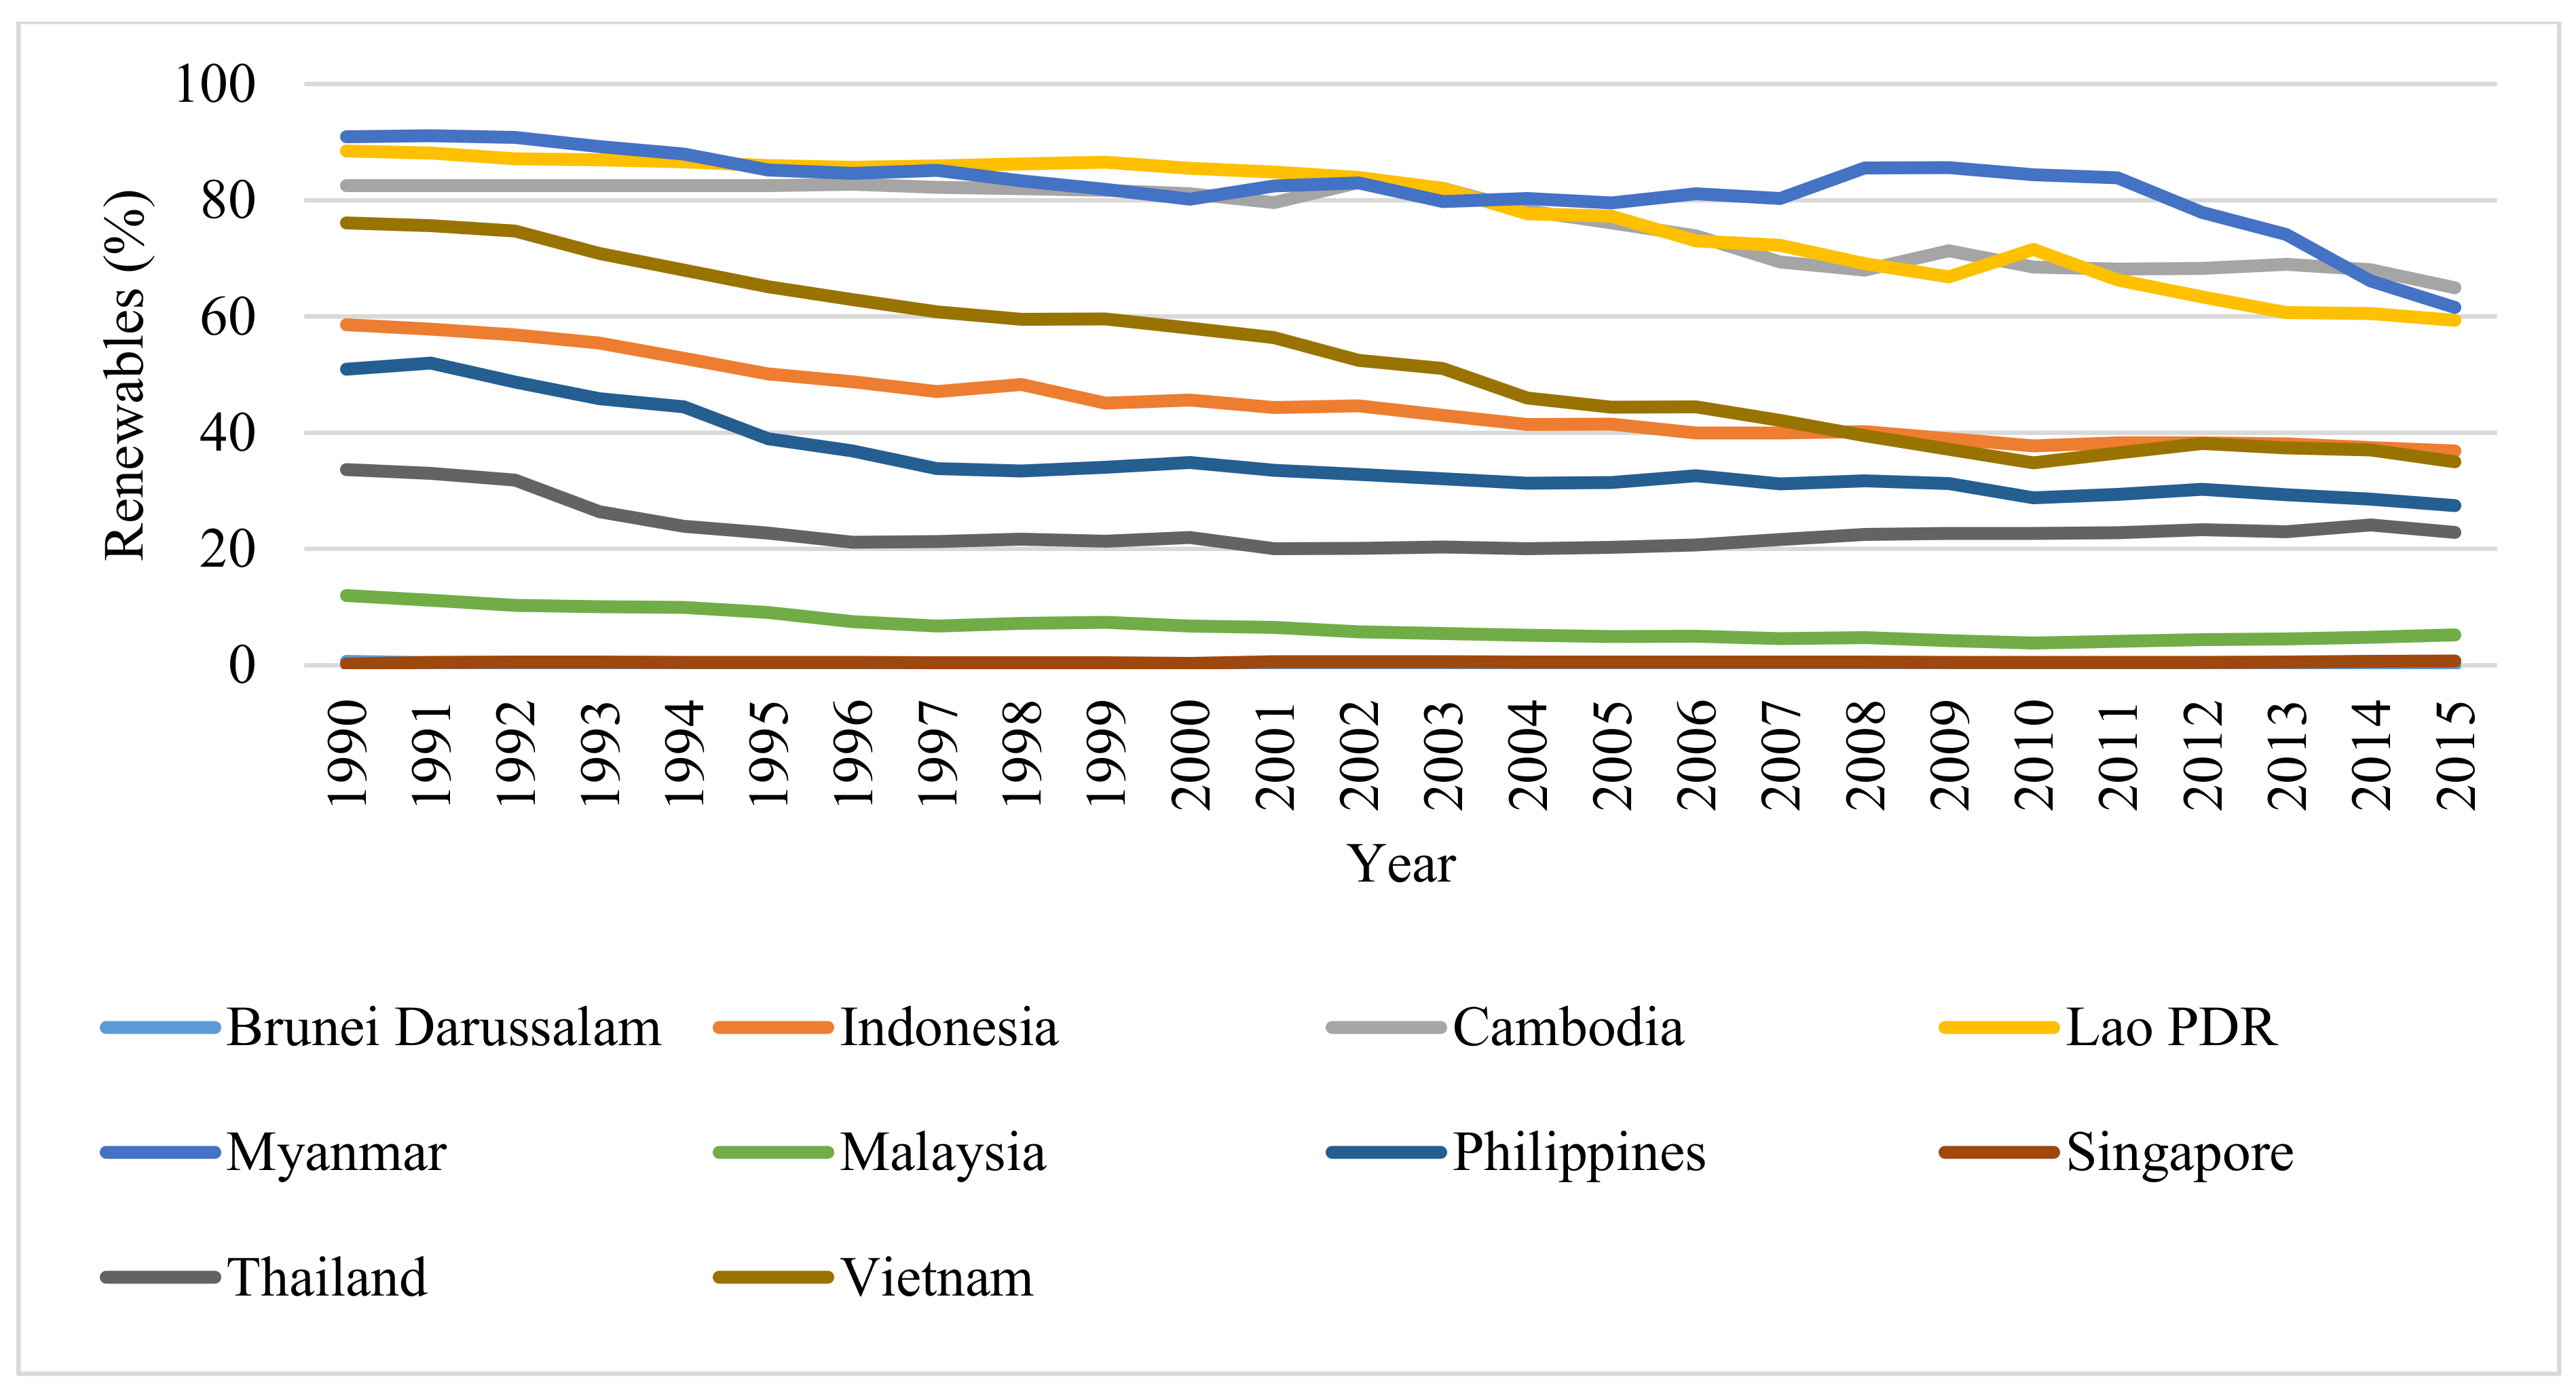
To analyze the renewables development in southeast Asia, followed by the data of World Bank, Figure 2 and Table 10 indicate that the trends in renewables decreased between 1990 and 2015 in all southeast Asian economies. In light of increasing energy demand for human being’s lives, [43] expressed that the electricity demand in the area had an amazing average growth of six percent yearly but renewables only supported 15 percent of its demand, meaning that fossil fuels became the main energy source for energy demand in southeast Asia. Therefore, [43] continued to affirm that southeast Asian countries have been performing a new plan for responding to peak demand. As suggested by [44], renewables will be expected to account for 20 percent of electricity generation in the near future. In addition, Singapore, Malaysia, and Brunei Darussalam have used renewables sparingly, with 0.71%, 5.19%, and 0.02% of total final energy consumption, respectively; therefore, the target of increasing the share of renewables can be challenging.
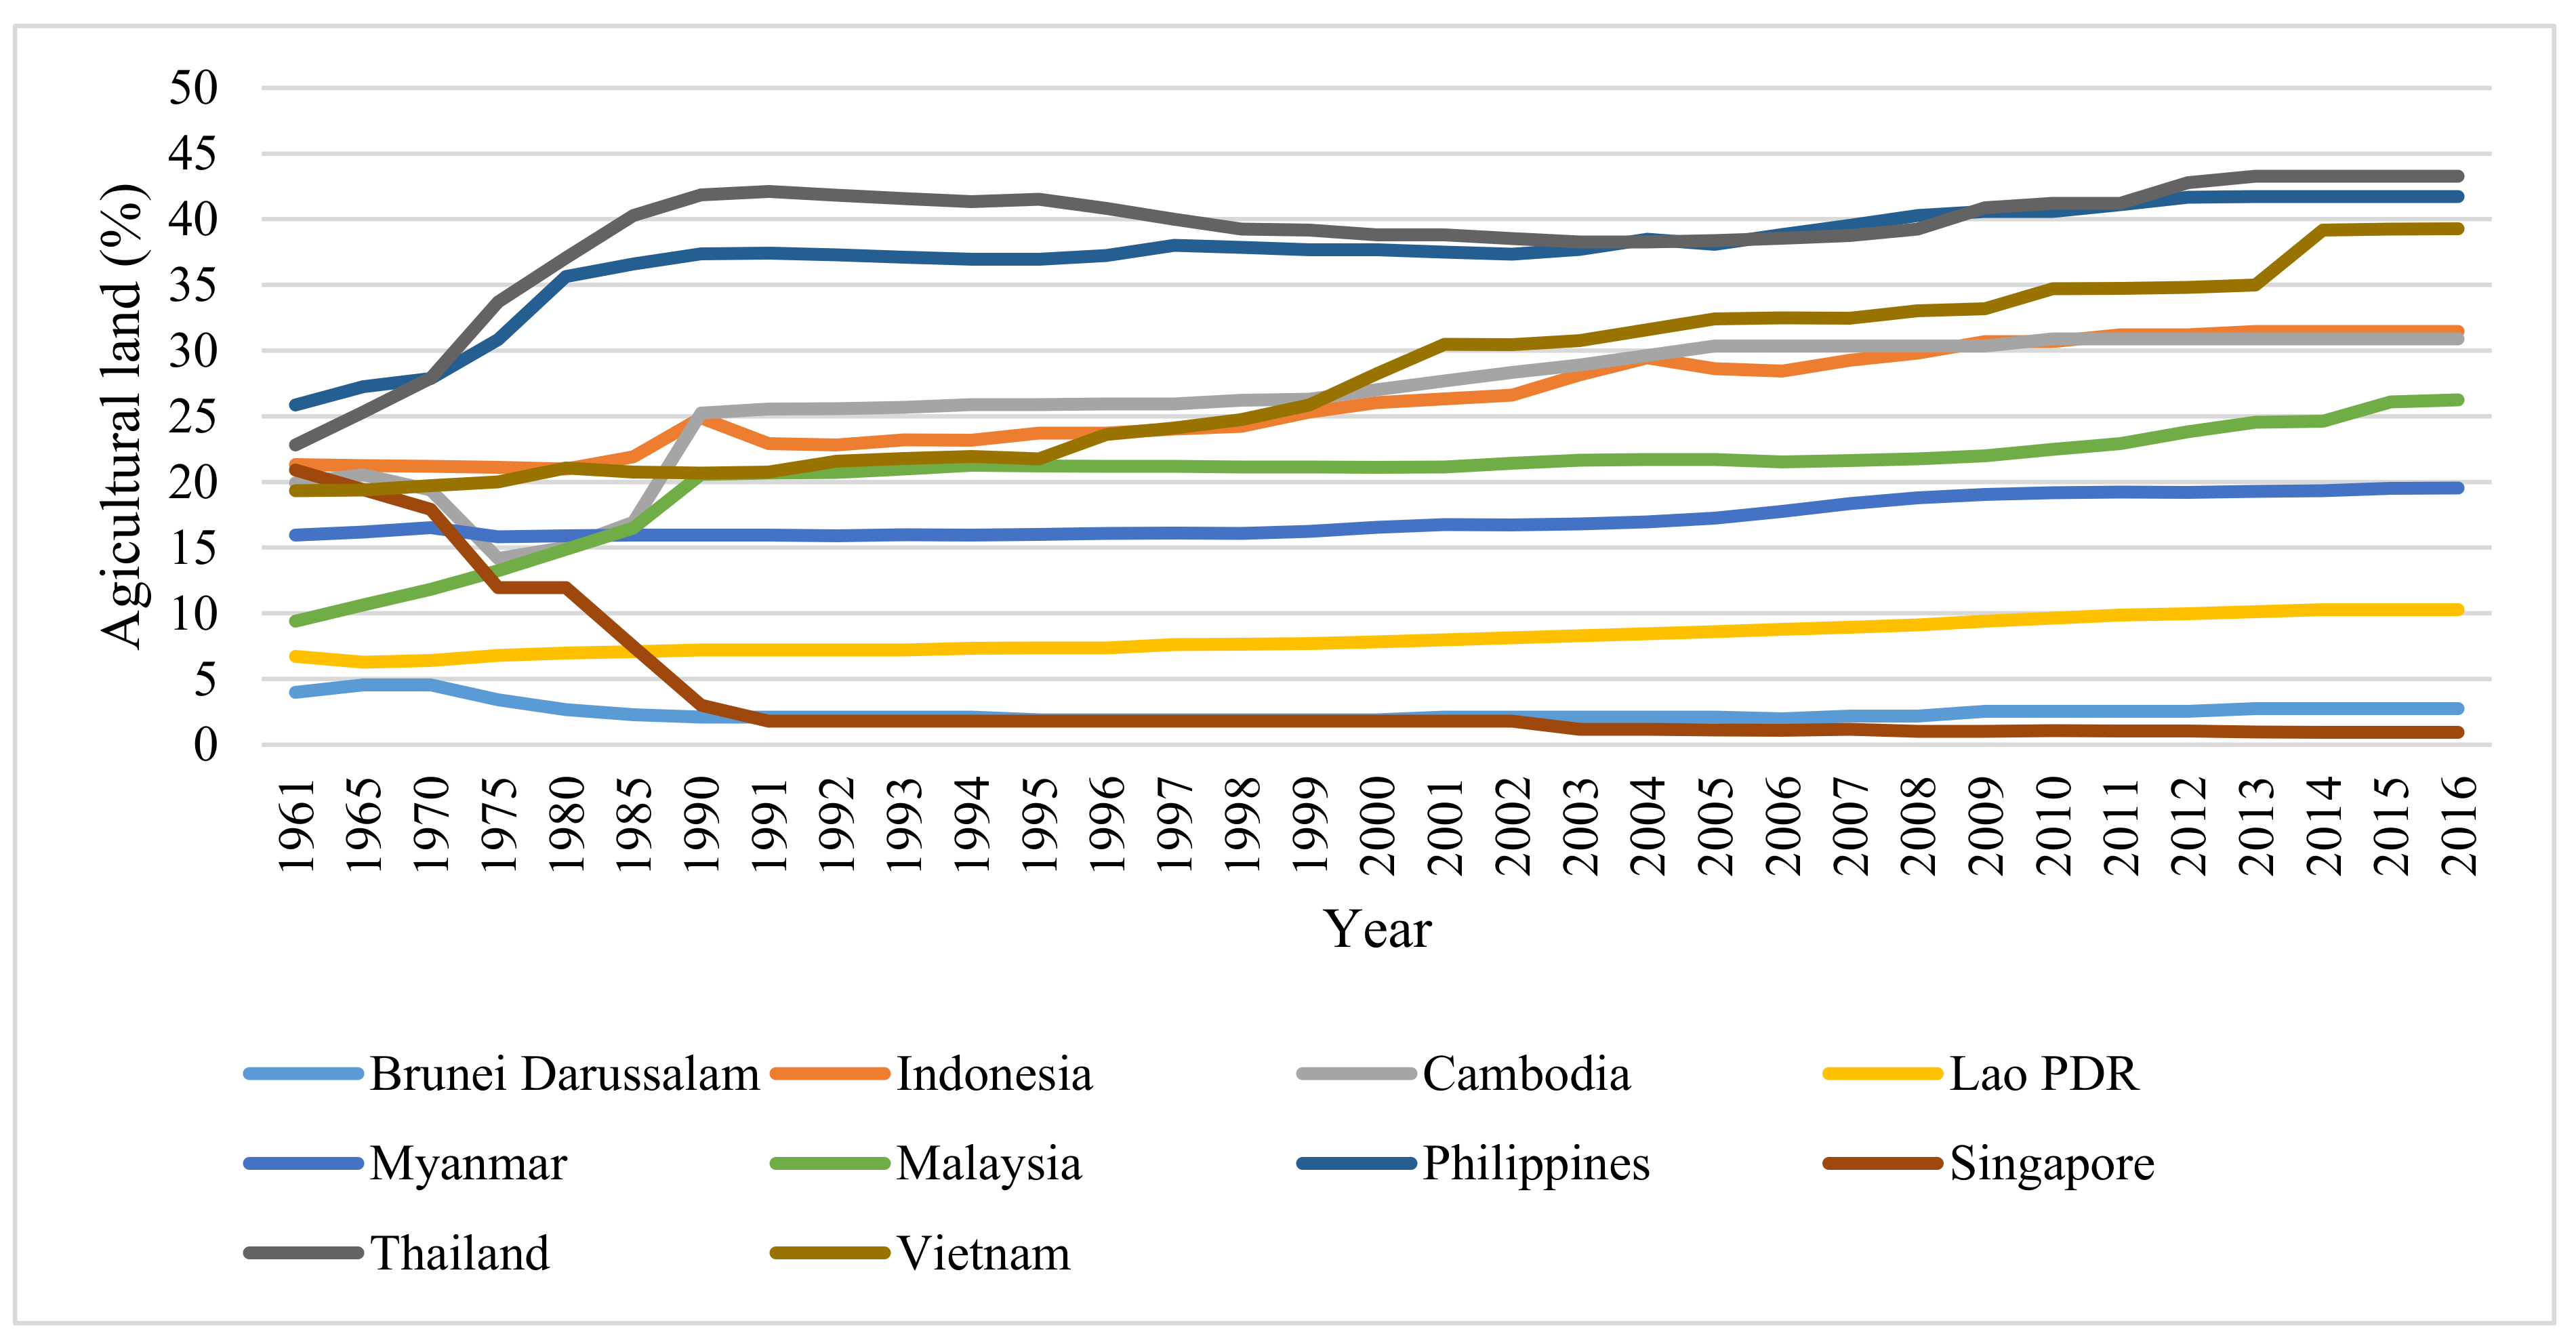
The trends in biofuels in southeast Asia have been consistent with biofuel processing. Further, biofuels are renewables that are predominantly produced from biological, organic matter, and wastes; therefore, the changes in biofuels are strongly associated with biological, organic matter, wastes source. Based on the latest data from World Bank (Figure 3, Figure 4 and Figure 5, Table 11, Table 12 and Table 13) will show the trends of major factors of biofuels source in the case of southeast Asia, as follows:
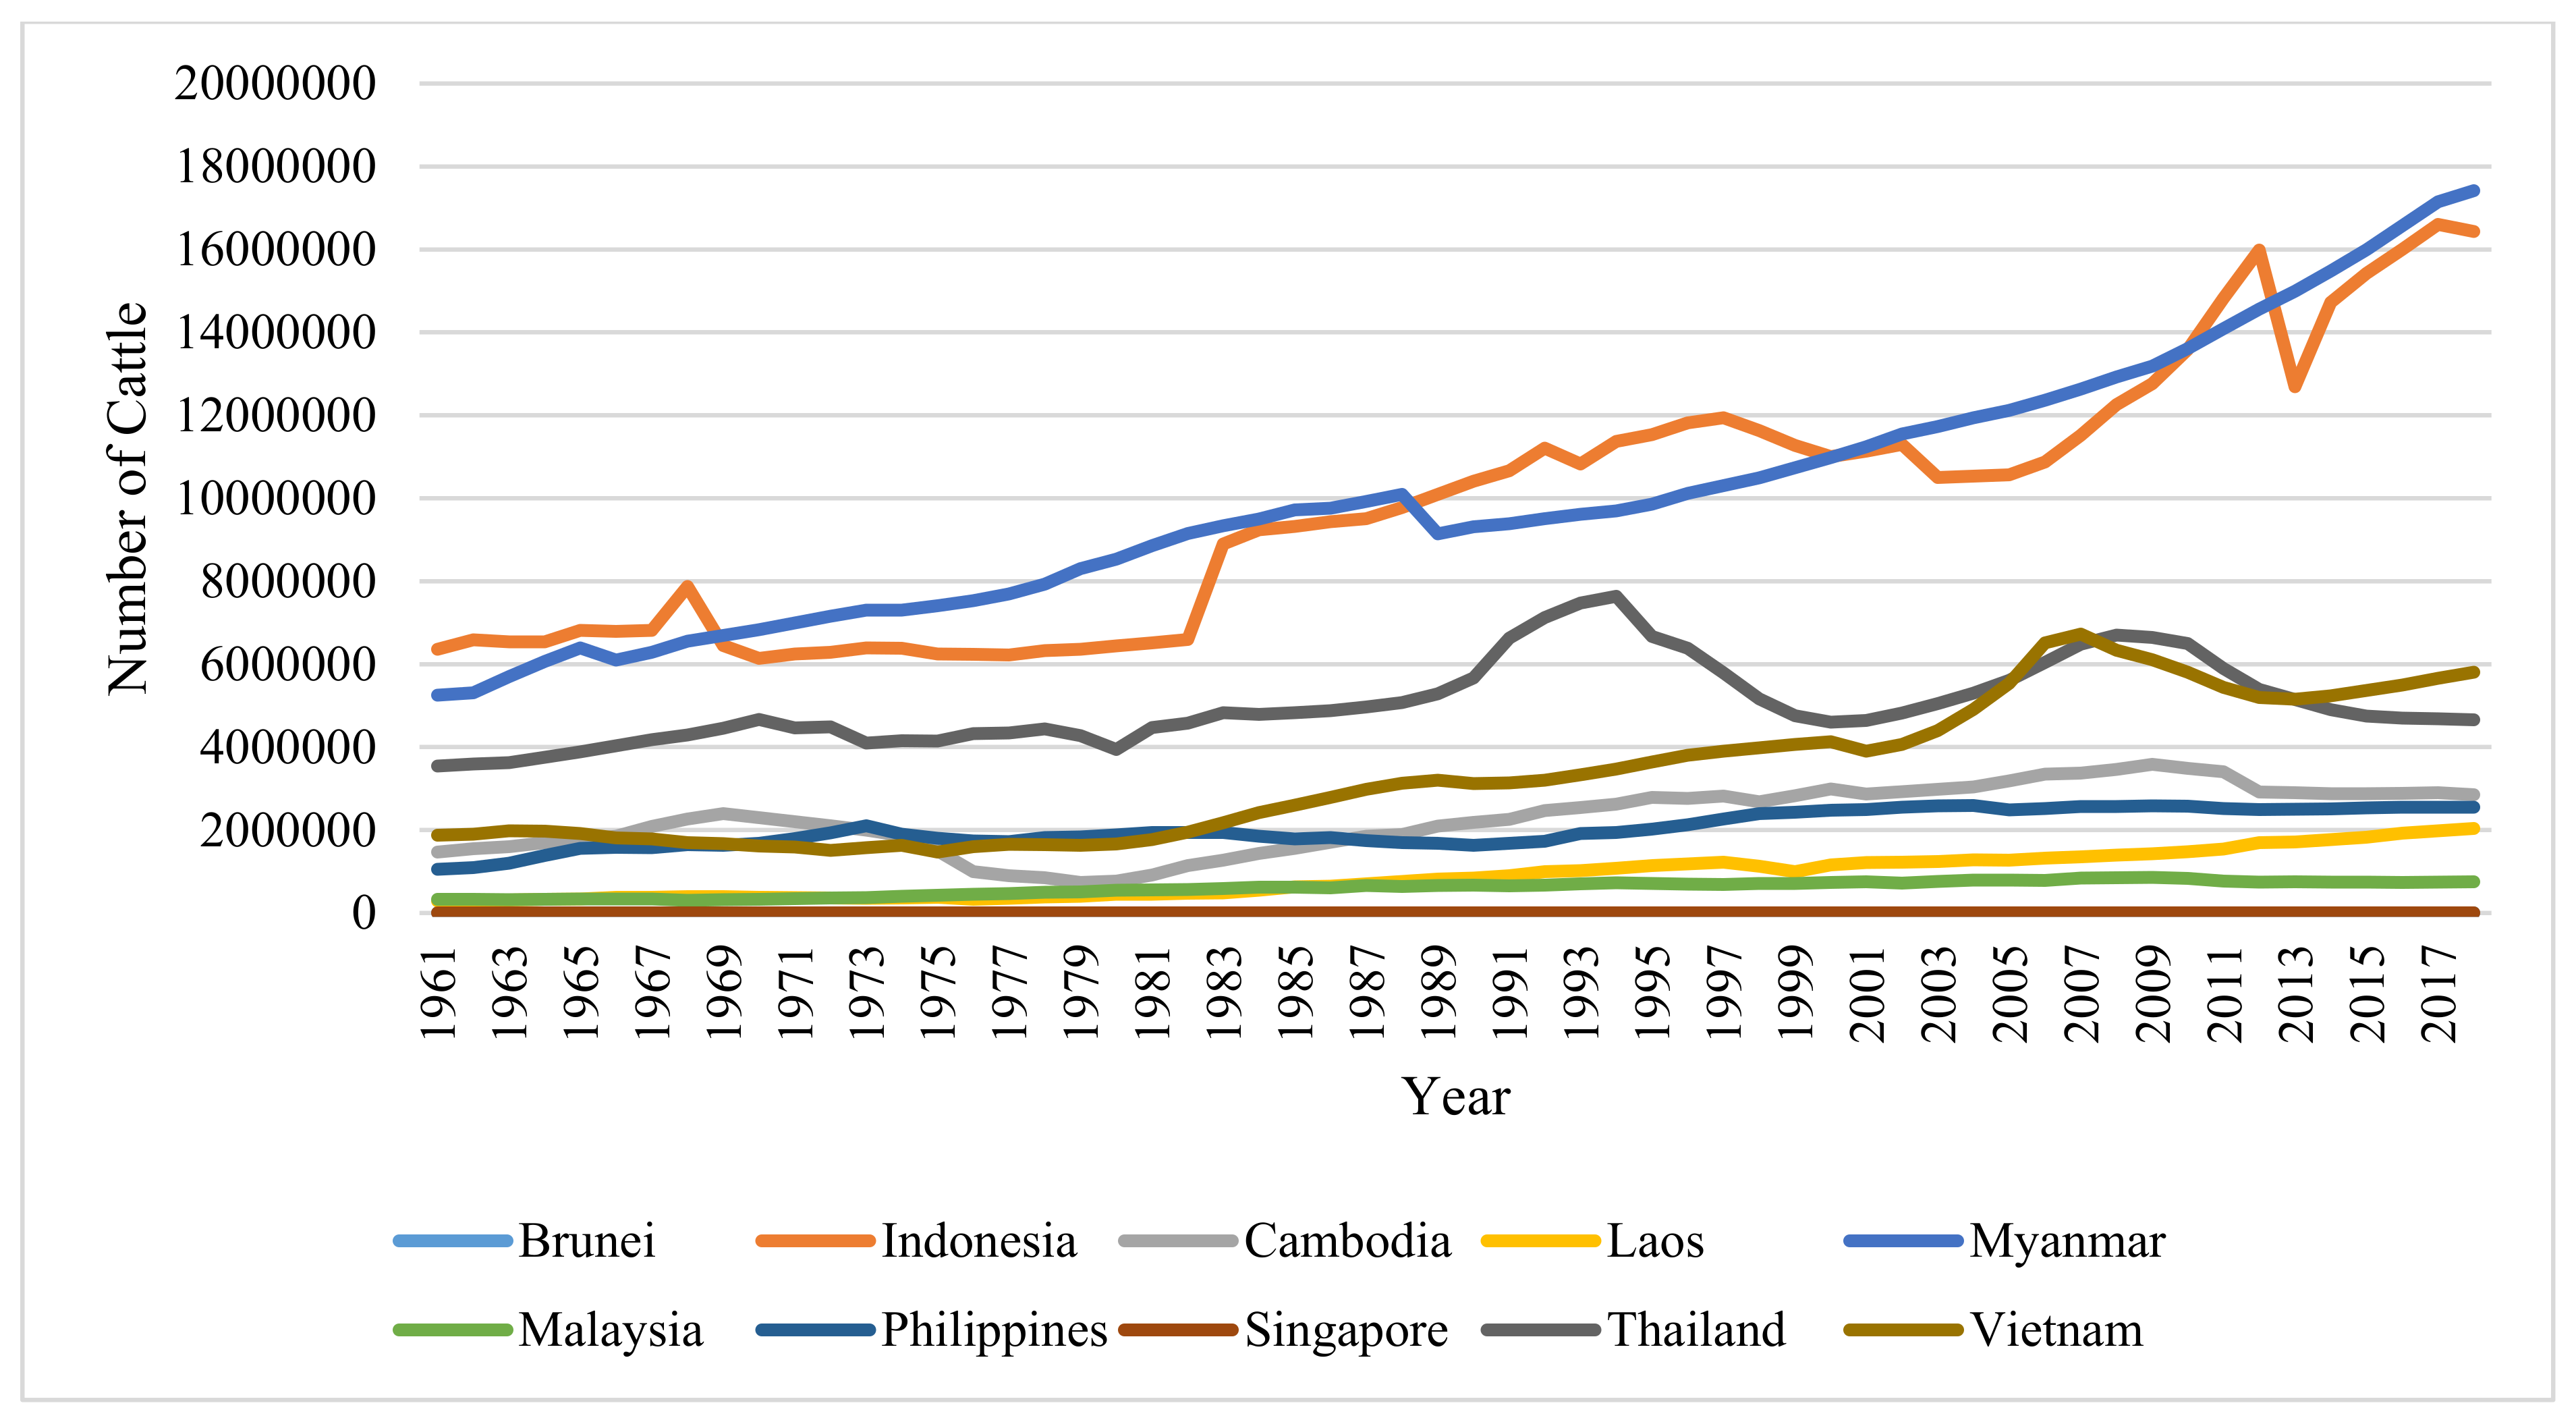
Figure 3, Figure 4 and Figure 5 and Table 11, Table 12 and Table 13 highlight the trends of agricultural land covering the period of 1961–2016, forest land in 1990–2016 period, and number of cattle in livestock between 1961 and 2018. In all data, it is evident that the proportion of agricultural land and forest land on total land area has progressively increased. For agricultural land, apart from a decrease in a sovereign island city-state of Singapore, and a small country of Brunei Darussalam, both Thailand and Vietnam show an interesting two-fold growth, while three-fold growth for Malaysia in the period of 1961–2017. Similar to agricultural land, Figure 5 and Table 13 also indicate that the number of cattle in livestock has significantly increased in most countries, such as Indonesia, Cambodia, Myanmar, Malaysia, the Philippines, and Vietnam. It means that biofuels from products of agriculture such as food products, and agricultural production require land, and especially source from animal waste have gradually improved over time in most southeast Asian countries. The authors of [42] indicated that Thailand seemed to be the largest hub of using liquid biofuels in the region while Malaysia obtained biofuels from palm oil.
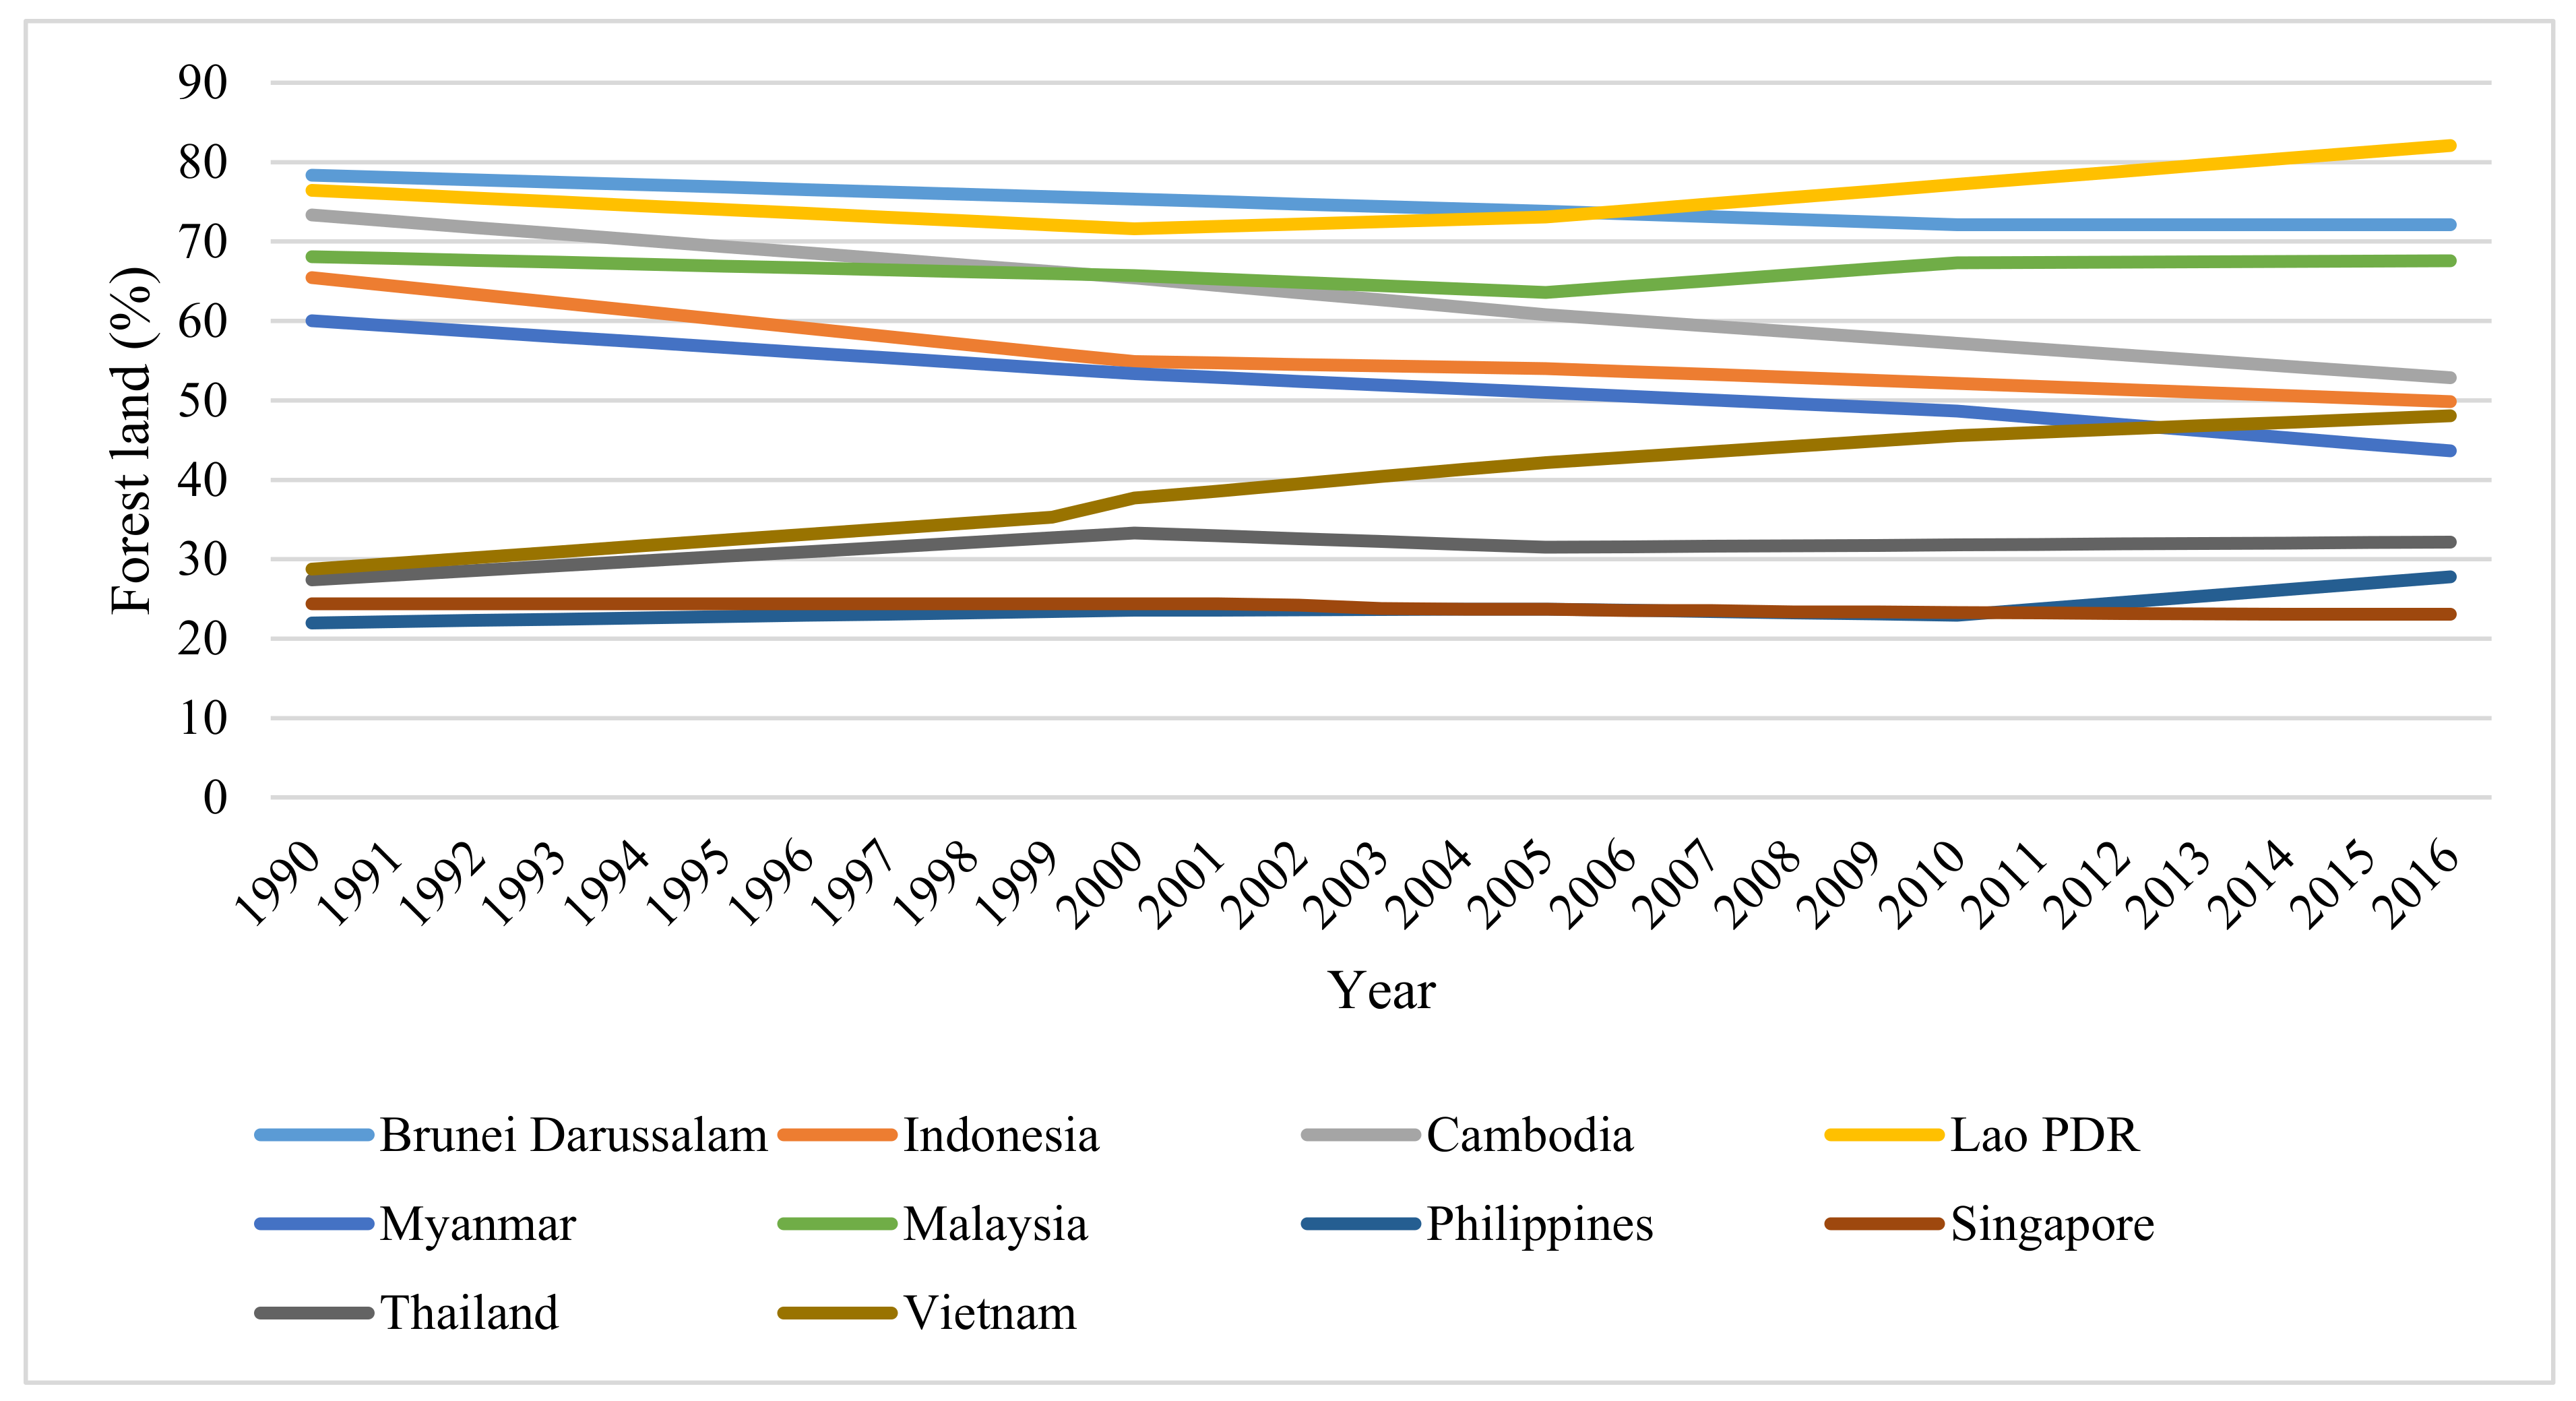
Regarding forest area, there are two trends in forest land. The uptrend is found in the case of Laos, Philippines, and Vietnam by a minor increase at roughly 7.4%, 26.3%, and 67%, respectively. The downtrend is found in the case of other southeast Asian countries by decreases of 8%, 23.8%, 28%, 27.3%, 0.25%, and 5.5% for Brunei Darussalam, Indonesia, Cambodia, Myanmar, Malaysia, Singapore, and Thailand. It shows that forest land-based advantages were not found in the case of most countries in the area. Further increased effectiveness of the biofuel sources, usage of technology in agriculture, forestry, and livestock has been popular in order to achieve sustainable development and renewables. Agritech helps farmers maximize benefits and minimize cost, therefore supporting using data analytics and artificial intelligence. As suggested in the study of [45], southeast Asian countries faced a decline in productivity in the agricultural sector in the 2002–2012 period. However, southeast Asia has implemented these more stably for the growth of agricultural sector than south Asia. In addition, [45] also suggested that ASEAN countries should invest more in human capital and technological innovation and apply more technology in the agricultural sector in order to enhance productivity. Technological innovation by enhancing cooperation between countries in the area should be preferred. As suggested in [44], ASEAN countries have enough land to make highly advanced biofuels, especially for biomass potential from higher yields in 2020 in order to replace 14% of current liquid transport fuel for the case of Indonesia, 13% for the case of Malaysia, and 27% and 37% for Thailand and Vietnam, and even up to 133% for Philippines. In addition, ASEAN countries have had great potential for bioenergy on land freed by decreasing wastes with 40% efficient lignocellulosic conversion; therefore, they have great potential for highly advanced fuels on land that will extend up to 2050.
7. Conclusions
Environmental pollution is one of the most serious global challenges and affects both developed and developing countries. In light of innovations in thermochemical technologies for biofuel processing, the gradual fall in costs of renewables has significantly promoted replacement of fossil fuels by renewables. In fact, fossil fuels are the main factor increasing the effects of climate change, global warming and sea-level rise. In this situation, this study is successful in examining the nexus of organic waste materials, financial development and renewables. Empirical results have found that the financial development has a negative impact on renewables. Further, agricultural land has a negative and significant impact on renewables while a positive impact from cattle livestock is found in the long run. Finally, there is a positive impact from trade openness on renewables in southeast Asia.
This study has some implications. Firstly, southeast Asian economies should focus on green finance in the financial market. In fact, governments adopt policies that support social and green finance, in which financial instruments should be designed to promote environmental and social targets and sustainable development. More specifically, financial systems should aim to support green credit and green growth as well as play an important role in the development of green financial infrastructure. Secondly, green credit should support high-tech, smart, and organic agriculture in the context of climate change and global warming. In addition, planning and expanding high-tech agricultural models with all kinds of crops and livestock in order to balance economic performance and sustainable development. Consistent with these findings, policymakers should encourage renewable energy utilization and strengthen the agriculture and financial development to achieve the sustainable development goals (SDGs 2, 7, and 13).
One of the limitations of this research is the restricted time span of the data. This comes from the difficulties in collecting data from World Bank. Although, we missed the COVID-19 triggered financial crisis, we will definitely deploy the research of this topic related to the pandemic in the very near future, by more divergent methodology.
Author Contributions
Conceptualization, T.T.N. and V.C.N.; methodology, V.C.N.; software, V.C.N.; validation, T.T.N. and V.C.N.; formal analysis, T.T.N. and V.C.N.; investigation, T.T.N. and V.C.N.; resources, T.T.N. and V.C.N.; data curation, V.C.N.; writing—original draft preparation, T.T.N. and V.C.N.; writing—review and editing, V.C.N.; visualization, V.C.N.; supervision, V.C.N.; project administration, V.C.N. All authors have read and agreed to the published version of the manuscript.
Funding
This research received no external funding.
Institutional Review Board Statement
Not applicable.
Informed Consent Statement
Not applicable.
Data Availability Statement
The data presented in this study are available on request from the corresponding author. The data are not publicly available due to confidentiality and privacy issues.
Conflicts of Interest
The authors declare no conflict of interest.
References
- Nguyen, V.C.; Thanh, H.P.; Nguyen, T.T. Do electricity consumption and economic growth lead to environmental pollution? empirical evidence from association of southeast Asian nations countries. Int. J. Energy Econ. Policy. 2020, 10, 297–304. [Google Scholar] [CrossRef]
- Tran, T.N.; Nguyen, T.T.; Nguyen, V.C.; Vu, T.T.H. Energy consumption, economic growth and trade balance in East Asian-A panel data approach. Int. J. Energy Econ. Policy 2020, 10, 443–449. [Google Scholar] [CrossRef]
- Khan, M.I.; Yasmeen, T.; Shakoor, A.; Khan, N.B.; Muhamad, R. 2014 oil plunge: Causes and impacts on renewable energy. Renew. Sustain. Energy Rev. 2017, 68, 609–622. [Google Scholar] [CrossRef]
- Ritchie, H.; Roser, M. Renewable Energy 2017. Available online: https://ourworldindata.org/renewable-energy (accessed on 20 April 2020).
- Kim, J.; Park, K. Financial development and deployment of renewable energy technologies. Energy Econ. 2016, 59. [Google Scholar] [CrossRef]
- Geddes, A.; Schmidt, T.; Steffen, B. The multiple roles of state investment banks in low-carbon energy finance: An analysis of Australia, the UK and Germany. Energy Policy. 2018, 115, 158–170. [Google Scholar] [CrossRef]
- Bayar, Y.; Ozkaya, M.H.; Herta, L.; Gavriletea, M.D. Financial Development, Financial Inclusion and Primary Energy Use: Evidence from the European Union Transition Economies. Energies 2021, 14, 3638. [Google Scholar] [CrossRef]
- Koengkan, M.; Fuinhas, J.A.; Vieira, I. Effects of financial openness on renewable energy investments expansion in Latin American countries. J. Sustain. Financ. Invest. 2019, 10, 65–82. [Google Scholar] [CrossRef]
- Ekwueme, D.C. Footprint of inexhaustible energy usage and financial development on carbon outrush of eurasian countries. In Proceedings of the International Conference on Eurasian Economies, Baku, Azerbaijan, 2–4 September 2020. [Google Scholar] [CrossRef]
- Nwani, C.; Omoke, P.C. Does bank credit to the private sector promote low-carbon development in Brazil? An extended STIRPAT analysis using dynamic ARDL simulations. Environ. Sci. Pollut. Res. 2020, 27, 31408–31426. [Google Scholar] [CrossRef]
- Wang, Y.; Zhang, D.; Ji, Q.; Shi, X. Regional renewable energy development in China: A multidimensional assessment. Renew Sustain. Energy Rev. 2020, 124, 109797. [Google Scholar] [CrossRef]
- Reboredo, J.C. Is there dependence and systemic risk between oil and renewable energy stock prices? Energy Econ. 2015, 48, 32–45. [Google Scholar] [CrossRef]
- Zeppini, P.; Bergh, J.C.J.M. Global competition dynamics of fossil fuels and renewable energy under climate policies and peak oil: A behavioral model. Energy Policy 2020, 136, 110907. [Google Scholar] [CrossRef]
- Abokyi, E.; Konadu, P.A.; Abokyi, F. Industrial growth and emissions of CO2 in Ghana: The role of financial development and fossil fuel consumption. Energy Rep. 2019, 5, 1339–1353. [Google Scholar] [CrossRef]
- Nguyen, T.T.; Nguyen, V.C.; Tran, T.N. Oil price shocks against stock return of oil and gas-related firms in the economic depression: A new evidence from a copula approach. Cogent. Econ. Financ. 2020, 8, 1799908. [Google Scholar] [CrossRef]
- Nguyen, V.C.; Nguyen, T.T.; Nguyen, H.T. government ability, bank-specific factors and profitability: An insight from banking sector of vietnam. J. Adv. Res. Dyn Control. Syst. 2020, 12, 415–424. [Google Scholar] [CrossRef]
- Bórawski, P.; Bórawska, A.B.; Szymańska, E.J.; Jankowski, K.J.; Dubis, B.; Dunn, J.W. Development of renewable energy sources market and biofuels in The European Union. J. Clean. Prod. 2019, 228, 467–484. [Google Scholar] [CrossRef]
- Eren, B.M.; Taspinar, N.; Gokmenoglu, K.K. The impact of financial development and economic growth on renewable energy consumption: Empirical analysis of India. Sci. Total. Environ. 2019, 663, 189–197. [Google Scholar] [CrossRef]
- Denny, D.M.T. Chapter 13-Competitive renewables as the key to energy transition—RenovaBio: The Brazilian biofuel regulation. In The Regulation and Policy of Latin American Energy Transitions, 1st ed.; Elsevier Science Publisher: Amsterdam, The Netherlands, 2020; pp. 223–242. [Google Scholar]
- Tyner, W.E. Chapter 33-Biofuel economics and policy: The Renewable Fuel Standard in 2018. In Bioenergy-Biomass to Biofuels and Waste to Energy, 2nd ed.; Academic Press: Cambridge, Elsevier, USA, 2020; pp. 695–704. [Google Scholar]
- Qamruzzaman, M.; Jianguo, W. The asymmetric relationship between financial development, trade openness, foreign capital flows, and renewable energy consumption: Fresh evidence from panel NARDL investigation. Renew. Energy 2020, 159, 827–842. [Google Scholar] [CrossRef]
- Anton, S.G.; Nucu, A.E.A. The effect of financial development on renewable energy consumption. A panel data approach. Renew. Energy 2020, 147, 330–338. [Google Scholar] [CrossRef]
- ADB. The ASEAN Catalytic Green Finance Facility (ACGF): 12 Things to Know. 2021. Available online: https://www.adb.org/news/features/asean-catalytic-green-finance-facility-acgf-12-things-know (accessed on 10 June 2020).
- Nehru, V.; Southeast Asian: Crouching Tiger or Hidden Dragon. Carnegie Endownment for International Peace. 2011. Available online: https://carnegieendowment.org/2011/07/07/southeast-asia-crouching-tiger-or-hidden-dragon-pub-44964 (accessed on 20 April 2020).
- World Bank. World Development Indicators; World Bank: Washington, DC, USA, 2020. Available online: https://databank.worldbank.org/source/world-development-indicators (accessed on 10 June 2020).
- Simionescu, M.; Strielknowski, W.; Tvaronavičienė, M. Renewable energy in final energy consumption and income in the EU-28 Countries. Energies 2020, 13, 2280. [Google Scholar] [CrossRef]
- Guru, B.K.; Yadav, I.S. Financial development and economic growth: Panel evidence from BRICS. J. Econ. Financ. Adm. Sci. 2019, 24, 113–126. [Google Scholar] [CrossRef] [Green Version]
- IMF. Financial Development Index Database. 2020. Available online: https://data.imf.org/?sk=F8032E80-B36C-43B1-AC26-493C5B1CD33B (accessed on 15 November 2020).
- Levine, R.; Zervos, S. Stock markets, banks, and economic growth. Am. Econ Rev. 1998, 88, 537–558. [Google Scholar]
- Puatwoe, J.T.; Piabuo, S.M. Financial sector development and economic growth: Evidence from Cameroon. Financ. Innov. 2017, 3, 25. [Google Scholar] [CrossRef]
- Pesaran, M.; Shin, Y.; Smith, R. Pooled mean group estimation of dynamic heterogeneous panels. J. Am. Statistical. Assoc. 1999, 94, 621–634. [Google Scholar] [CrossRef]
- Loayza, N.; Rancière, R. Financial Development, Financial Fragility, and Growth. 2004. Available online: https://documents1.worldbank.org/curated/en/493581468761428676/pdf/wps3431.pdf (accessed on 20 April 2020).
- Blackburne, E.F.; Frank, M.W. Estimation of nonstationary heterogeneous panels. St. J. 2007, 7, 197–208. [Google Scholar] [CrossRef]
- Samargandi, N.; Fidrmuc, J.; Ghosh, S. Is the Relationship between Financial Development and Economic Growth Monotonic? Evidence from a Sample of Middle Income Countries. Cesifo Working Paper No. 4743 Category 6: Fiscal Policy, Macroeconomics and Growth. 2014. Available online: https://www.ifo.de/DocDL/cesifo1_wp4743.pdf (accessed on 20 April 2020).
- Arellano, M.; Bond, S. Some tests of specification for panel data: Monte Carlo evidence and an application to employment equations. Rev. Econ. Stud. 1991, 58, 277–297. [Google Scholar] [CrossRef] [Green Version]
- Ghazouani, T.; Boukhatem, J.; Sam, C.Y. Causal interactions between trade openness, renewable electricity consumption, and economic growth in Asia-Pacific countries: Fresh evidence from a bootstrap ARDL approach. Renew. Sustain. Energy Rev. 2020, 133, 110094. [Google Scholar] [CrossRef]
- Sharma, G.D.; Shah, M.I.; Shahzad, U.; Jain, M.; Chopra, R. Exploring the nexus between agriculture and greenhouse gas emissions in BIMSTEC region: The role of renewable energy and human capital as moderators. J. Environ. Manag. 2021, 297, 113316. [Google Scholar] [CrossRef]
- Usman, M.; Makhdum, M.S.A. What abates ecological footprint in BRICS-T region? Exploring the influence of renewable energy, non-renewable energy, agriculture, forest area and financial development. Renew. Energy 2021, 179, 12–28. [Google Scholar] [CrossRef]
- Pata, U.K. Linking renewable energy, globalization, agriculture, CO2 emissions and ecological footprint in BRIC countries: A sustainability perspective. Renew. Energy 2021, 173, 197–208. [Google Scholar] [CrossRef]
- Wang, Y.; Zhang, Y.; Li, J.; Lin, J.; Zhang, N.; Cao, W. Biogas energy generated from livestock manure in China: Current situation and future trends. J. Environ. Manag. 2021, 297, 113324. [Google Scholar] [CrossRef] [PubMed]
- Koirala, K.H.; Mishra, A.; Mohanty, S. Impact of land ownership on productivity and efficiency of rice farmers: The case of the Philippines. Land. Use Policy 2016, 50, 371–378. [Google Scholar] [CrossRef]
- ASEAN POST. Biofuel, An Alternative Energy Source in Southeast Asia. 2018. Available online: https://theaseanpost.com/article/biofuel-alternative-energy-source-southeast-asia (accessed on 10 June 2020).
- Louis, J. Rising Temperatures Surge Energy Demand in ASEAN. The ASEAN Post. 2020. Available online: https://theaseanpost.com/article/rising-temperatures-surge-energy-demand-asean (accessed on 20 April 2020).
- IRENA. Biofuel Potential in Southeast Asia: Raising Food Yields, Reducing Food Waste and Utilising Residues. International Renewable Energy Agency: Abu Dhabi, United Arab Emirates, 2017. [Google Scholar]
- Liu, J.; Wang, M.; Yang, L.; Rahman, S.; Sriboonchitta, S. Agricultural productivity growth and its determinants in south and Southeast Asian countries. Sustainability 2020, 12, 4981. [Google Scholar] [CrossRef]
Figure 1.
The research model simulation.

Figure 2.
Trends in renewables in southeast Asia between 1990 and 2015 (% total final energy consumption).
Figure 2.
Trends in renewables in southeast Asia between 1990 and 2015 (% total final energy consumption).

Figure 3.
Trends in agricultural land in southeast Asia between 1961 and 2016 (% total land area).

Figure 4.
Trends in forest land in southeast Asia between 1990 and 2016 (% total land area).

Figure 5.
Trends in number of cattle in southeast Asia between 1961 and 2018.


Table 1.
Measurement of variables.
| Dependent Variables | Measurement | Unit | Abbreviation | Source |
|---|---|---|---|---|
| Renewables | % of total final energy consumption | % | REC | WDI |
| Independent Variables | ||||
| Agriculture land | % of land area | % | AGR | WDI, DOS |
| Forest land | % of land area | % | FOR | WDI, DOS |
| Cattle livestock | Counted by heads | number | LIV | WDI, DOS Our world in data |
| Financial development | Domestic credit to private sector, % of GDP | % | FD | WDI, DOS |
| Trade openness | (Export + Import)/GDP | % | TO | WDI and authors’ calculations |
Table 2.
Factors influencing the renewables. Overview of modern scholars’ opinions.
| References | Variables | Direction of Influence |
|---|---|---|
| [36] | Trade openness, renewable electricity consumption, and economic growth. | A short-run analysis reveals mixed results in term of the direction of the causality among different variables for various countries. |
| [37] | Agriculture, greenhouse gas emissions, renewable energy, human capital. | U-shaped nexus between agriculture value-added and greenhouse gas emissions. |
| [38] | Ecological footprint, renewable energy, non-renewable energy, agriculture, forest area and financial development. | There exists the subsistence of feedback effect between agriculture, financial development, and ecological footprint. |
| [39] | Renewable energy, globalization, agriculture, CO2 emissions and ecological footprint. | There exists a bidirectional causality between agriculture and environmental degradation. |
| [40] | Biogas energy, livestock manure. | Livestock manure increases biogas production. |
Table 3.
Descriptive statistics.
| Country | Variable | AGR | FOR | LIV | REC | FD | TO |
|---|---|---|---|---|---|---|---|
| Brunei | Obs. | 27 | 27 | 27 | 27 | 27 | 27 |
| Mean | 2.20 | 74.59 | 3.09 | 0.05 | 14.64 | 103.84 | |
| Std. Dev. | 0.30 | 2.16 | 0.15 | 0.15 | 18.34 | 7.57 | |
| Min | 1.89 | 72.10 | 2.88 | 0 | 0 | 87.32 | |
| Max | 2.73 | 78.36 | 3.32 | 0.67 | 44.51 | 120.57 | |
| Cambodia | Obs. | 27 | 27 | 27 | 27 | 27 | 27 |
| Mean | 28.44 | 62.86 | 6.46 | 58.54 | 19.21 | 97.45 | |
| Std. Dev. | 2.27 | 6.35 | 0.05 | 32.40 | 23.22 | 43.26 | |
| Min | 25.23 | 52.85 | 6.33 | 0 | 0 | 0 | |
| Max | 30.90 | 73.32 | 6.55 | 83.01 | 81.67 | 144.61 | |
| Indonesia | Obs. | 27 | 27 | 27 | 27 | 27 | 27 |
| Mean | 27.41 | 55.65 | 7.08 | 43.21 | 11.41 | 55.72 | |
| Std. Dev. | 3.23 | 4.54 | 0.06 | 10.93 | 16.66 | 11.09 | |
| Min | 22.82 | 49.86 | 7.01 | 0 | 0 | 37.42 | |
| Max | 31.46 | 65.43 | 7.20 | 58.59 | 39.40 | 96.18 | |
| Laos | Obs. | 27 | 27 | 27 | 27 | 27 | 27 |
| Mean | 8.50 | 75.36 | 6.11 | 74.86 | 6.84 | 71.94 | |
| Std. Dev. | 1.11 | 3.02 | 0.09 | 17.93 | 5.38 | 16.95 | |
| Min | 7.19 | 71.60 | 5.92 | 0 | 0 | 35.84 | |
| Max | 10.26 | 82.10 | 6.28 | 88.44 | 20.91 | 99.06 | |
| Malaysia | Obs. | 27 | 27 | 27 | 27 | 27 | 27 |
| Mean | 22.09 | 66.38 | 5.87 | 6.32 | 116.72 | 175.81 | |
| Std. Dev. | 1.58 | 1.31 | 0.03 | 2.67 | 20.80 | 28.11 | |
| Min | 20.56 | 63.58 | 5.81 | 0 | 69.41 | 126.89 | |
| Max | 26.26 | 68.10 | 5.93 | 11.98 | 158.50 | 220.40 | |
| Myanmar | Obs. | 27 | 27 | 27 | 27 | 27 | 27 |
| Mean | 17.42 | 52.05 | 7.07 | 79.11 | 8.27 | 9.53 | |
| Std. Dev. | 1.42 | 4.69 | 0.07 | 17.17 | 4.50 | 18.76 | |
| Min | 15.91 | 43.63 | 6.96 | 0 | 3.12 | 0 | |
| Max | 19.53 | 60.00 | 7.21 | 91.11 | 21.21 | 61.02 | |
| Philippines | Obs. | 27 | 27 | 27 | 27 | 27 | 27 |
| Mean | 38.89 | 23.68 | 6.36 | 33.90 | 32.99 | 74.73 | |
| Std. Dev. | 1.80 | 1.38 | 0.06 | 9.73 | 8.66 | 14.49 | |
| Min | 36.94 | 21.98 | 6.21 | 0 | 17.83 | 55.82 | |
| Max | 41.72 | 27.76 | 6.41 | 51.96 | 56.45 | 108.25 | |
| Singapore | Obs. | 27 | 27 | 27 | 27 | 27 | 27 |
| Mean | 1.44 | 23.85 | 2.35 | 0.48 | 98.87 | 356.24 | |
| Std. Dev. | 0.49 | 0.55 | 0.14 | 0.13 | 14.77 | 36.49 | |
| Min | 0.93 | 23.06 | 2 | 0 | 79.16 | 202.94 | |
| Max | 2.98 | 24.40 | 2.60 | 0.71 | 128.13 | 437.32 | |
| Thailand | Obs. | 27 | 27 | 27 | 27 | 27 | 27 |
| Mean | 40.60 | 31.31 | 6.75 | 22.42 | 47.67 | 112.47 | |
| Std. Dev. | 1.77 | 1.48 | 0.07 | 5.83 | 64.20 | 22.32 | |
| Min | 38.28 | 27.41 | 6.66 | 0 | 0 | 75.78 | |
| Max | 43.27 | 33.29 | 6.88 | 33.63 | 149.37 | 140.44 | |
| Vietnam | Obs. | 27 | 27 | 27 | 27 | 27 | 27 |
| Mean | 29.58 | 39.37 | 6.65 | 50.48 | 55.63 | 122.47 | |
| Std. Dev. | 6.05 | 6.42 | 0.10 | 17.01 | 40.29 | 36.69 | |
| Min | 20.66 | 28.76 | 6.49 | 0 | 0 | 66.21 | |
| Max | 39.28 | 48.06 | 6.83 | 76.08 | 123.81 | 184.68 |
Note: AGF, FOR, LIV, REC, FD, TO indicate agriculture land, forest land, cattle livestock, renewables, financial development, and trade openness, respectively. Source: Results from the analysis.
Table 4.
Descriptive statistics (all countries).
| Country | Variable | Obs. | Mean | Std. Dev | Min | Max |
|---|---|---|---|---|---|---|
| Southeast Asian Economies | AGR | 270 | 21.66 | 13.58 | 0.93 | 43.28 |
| FOR | 270 | 50.51 | 18.25 | 21.98 | 82.10 | |
| LIV | 270 | 5.78 | 1.58 | 2 | 7.21 | |
| REC | 270 | 36.94 | 31.49 | 0 | 91.11 | |
| FD | 270 | 41.22 | 45.99 | 0 | 158.50 | |
| TO | 270 | 118.02 | 93.46 | 0 | 437.32 |
Note: AGF, FOR, LIV, REC, FD, TO indicate agriculture land, forest land, cattle livestock, renewables, financial development, and trade openness, respectively. Source: Result from the analysis.
Table 5.
Panel unit root tests (PURTs).
| Variable | Order of Integration | IPS Test | LLC Test | Breitung Test | Fishers PP Test | Hypothesis |
|---|---|---|---|---|---|---|
| AGR | I(0) | 4.6651 (1.0000) | 0.9183 (0.8208) | 1.8829 (0.9701) | −1.2977 (0.9028) | Not rejected |
| I(1) | −4.5880 (0.0000) | −2.4549 (0.0070) | −4.9301 (0.0000) | 27.2264 (0.0000) | Rejected | |
| FOR | I(0) | 1.0454 (0.8521) | −1.2132 (0.1125) | −0.1319 (0.4475) | 3.9346 (0.0000) | Not rejected (Rejected for PP test) |
| I(1) | −0.0396 (0.4842) | −0.7926 (0.2140) | −1.7161 (0.0431) | Rejected | ||
| LIV | I(0) | 0.2404 (0.5950) | 1.2476 (0.8939) | 0.9966 (0.8405) | 1.5863 (0.0563) | Not rejected |
| I(1) | −5.9625 (0.0000) | −4.5006 (0.0000) | −3.6979 (0.0001) | 28.8202 (0.0000) | Rejected | |
| REC | I(0) | 2.5816 (0.9951) | 2.7142 (0.9967) | 0.7891 (0.7850) | 11.3747 (0.0000) | Rejected for PP test |
| I(1) | 0.0622 (0.5248) | 5.9020 (1.0000) | −0.7725 (0.2199) | |||
| FD | I(0) | 2.1254 (0.9832) | −5.2575 (0.0000) | 1.4666 (0.9288) | −1.2662 (0.8973) | Not rejected |
| I(1) | −6.0036 (0.0000) | −3.3929 (0.0000) | 22.7300 (0.0000) | Rejected | ||
| TO | I(0) | 0.6362 (0.7377) | −0.5767 (0.2821) | 0.6031 (0.7268) | 0.1034 (0.4588) | Not rejected |
| I(1) | −7.9082 (0.0000) | −6.6479 (0.0000) | −7.5801 (0.0000) | 41.7815 (0.0000) | Rejected |
Note: LLC, IPS, ADF, PP indicate Levin Lin Chu, IM Pesaran Shin, Phillips–Perron, respectively. Source: Analyzed by the author.
Table 6.
Correlation coefficients between variables.
| AGR | FOR | LIV | FD | TO | |
|---|---|---|---|---|---|
| AGR | 1 | ||||
| FOR | −0.4025 | 1 | |||
| LIV | 0.7476 | 0.0309 | 1.0000 | ||
| FD | 0.0192 | −0.2636 | −0.2918 | 1.0000 | |
| TO | −0.3572 | −0.3618 | −0.7073 | 0.6808 | 1.0000 |
Note: AGF, FOR, LIV, REC, FD, TO indicate agriculture land, forest land, cattle livestock, renewables, financial development, and trade openness, respectively. Source: Result from the analysis.
Table 7.
Variance Inflation Factor (VIF) coefficients of variables.
| Variable | VIF | 1/VIF |
|---|---|---|
| TO | 4.93 | 0.202856 |
| LIV | 4.83 | 0.207021 |
| AGR | 4.25 | 0.235242 |
| FD | 2.39 | 0.418194 |
| FOR | 2.08 | 0.481578 |
| Mean VIF | 3.70 |
Note: AGF, FOR, LIV, REC, FD, TO indicate agriculture land, forest land, livestock, renewables, financial development, and trade openness, respectively. VIF denotes variance inflation factor. Source: Result from the analysis.
Table 8.
Panel cointegration tests.
| Methods | Cointegration Tests | Statistics |
|---|---|---|
| Pedroni | Panel-v | 2.928 *** |
| Panel-rho | 0.9576 | |
| Panel-PP | 0.2076 | |
| Panel-ADF | 1.479 | |
| Group-rho | 1.224 | |
| Group-PP | 0.5411 | |
| Group-ADF | 0.3116 | |
| Kao | t | −2.058 ** |
| Westerlund | Gt | 2.440 *** |
| Ga | 3.113 *** | |
| Pt | 2.444 *** | |
| Pa | 2.744 *** |
Note: Pedroni, Kao, and Westerlund tests were generated on Stata with the command “xtpedroni, xtcointtest kao, xtwest”. ADF, PP indicate IM Pesaran Shin, and Phillips–Perron, respectively. ** Significance at 5%, *** significance at 1%. Source: Results from the analysis.
Table 9.
Pooled mean group (PMG) estimates.
| Variable | PMG Estimates | PMG Estimates | ||||
|---|---|---|---|---|---|---|
| Coefficient | z | p–Value | Coefficient | z | p–Value | |
| Dependent Variable: Renewables—REC | ||||||
| Long-Running Coefficients | ||||||
| AGR | −11.0075 *** | −2.69 | 0.007 | −26.7196 *** | −2.86 | 0.004 |
| FOR | 2.0863 | 1.65 | 0.100 | −0.8302 | −0.41 | 0.683 |
| LIV | 265.323 * | 1.88 | 0.060 | 1206.58 *** | 3.23 | 0.001 |
| FD | −0.6421 ** | −2.18 | 0.030 | −0.0710 | −0.18 | 0.854 |
| TO | 0.8269 *** | 3.58 | 0.000 | |||
| _c | −46.030 | −0.30 | 0.762 | −203.9919 | −0.46 | 0.646 |
| ECM | −0.0357 ** | −2.38 | 0.045 | −0.0303 ** | −2.50 | 0.020 |
| Short-Running Coefficients | ||||||
| ∆AGR | 7.5315 | 1.46 | 0.144 | 6.9025 | 1.30 | 0.195 |
| ∆FOR | −0.1361 | −0.11 | 0.916 | −17.6648 | −1.00 | 0.317 |
| ∆LIV | −49.2908 | −0.87 | 0.385 | 129.0913 | 0.63 | 0.531 |
| ∆LIV(−1) | 21.6254 | 0.52 | 0.603 | −116.247 | −0.73 | 0.464 |
| ∆FD | 0.1447 | 1.01 | 0.312 | 0.3390 | 0.97 | 0.331 |
| ∆TO | −0.0134 | −0.18 | 0.856 | |||
Note: *, **, and *** indicate significant at 10%, 5%, and 1%, respectively. The lag structure is ARDL (1,0,0,2,0,0), and the order of the variable is REC—renewables, AGR—agriculture land (% land area), FOR—forest area (% land area), LIV—number of cattle in livestock counted by heads, FD—financial development, TO—trade openness. Source: Result from the analysis.
Table 10.
Trends in renewables between 1990 and 2015 (% total final energy consumption).
| Country/Year | 1990 | 1993 | 1996 | 1999 | 2002 | 2005 | 2008 | 2011 | 2015 |
|---|---|---|---|---|---|---|---|---|---|
| Brunei Darussalam | 0.67 | 0.00 | 0.00 | 0.00 | 0.00 | 0.00 | 0.00 | 0.02 | 0.01 |
| Indonesia | 58.60 | 55.43 | 48.75 | 45.08 | 44.64 | 41.45 | 40.16 | 38.23 | 36.88 |
| Cambodia | 82.53 | 82.53 | 82.77 | 81.67 | 83.02 | 76.07 | 68.00 | 68.16 | 64.92 |
| Lao PDR | 88.45 | 86.93 | 85.65 | 86.55 | 83.90 | 77.24 | 69.06 | 66.27 | 59.32 |
| Myanmar | 90.91 | 89.25 | 84.61 | 81.88 | 83.00 | 79.55 | 85.57 | 83.86 | 61.53 |
| Malaysia | 11.98 | 10.03 | 7.47 | 7.34 | 5.72 | 4.92 | 4.73 | 4.11 | 5.19 |
| Philippines | 50.95 | 45.86 | 36.88 | 34.07 | 32.83 | 31.43 | 31.73 | 29.40 | 27.45 |
| Singapore | 0.19 | 0.52 | 0.46 | 0.43 | 0.58 | 0.54 | 0.53 | 0.47 | 0.71 |
| Thailand | 33.64 | 26.43 | 21.16 | 21.31 | 20.07 | 20.25 | 22.49 | 22.76 | 22.86 |
| Vietnam | 76.08 | 70.81 | 62.87 | 59.57 | 52.41 | 44.36 | 39.46 | 36.53 | 35.00 |
Table 11.
Trends in agricultural land between 1961 and 2016 (% total land area).
| Country/Year | 1961 | 1970 | 1980 | 1990 | 2000 | 2010 | 2016 |
|---|---|---|---|---|---|---|---|
| Brunei Darussalam | 3.98 | 4.55 | 2.66 | 2.09 | 1.90 | 2.54 | 2.73 |
| Indonesia | 21.31 | 21.20 | 20.98 | 24.89 | 26.04 | 30.69 | 31.46 |
| Cambodia | 19.93 | 19.37 | 15.01 | 25.24 | 27.02 | 30.90 | 30.90 |
| Lao PDR | 6.72 | 6.40 | 6.96 | 7.19 | 7.82 | 9.62 | 10.26 |
| Myanmar | 15.96 | 16.53 | 15.89 | 15.96 | 16.54 | 19.17 | 19.54 |
| Malaysia | 9.39 | 11.82 | 14.87 | 20.56 | 21.12 | 22.49 | 26.26 |
| Philippines | 25.86 | 27.86 | 35.63 | 37.36 | 37.68 | 40.58 | 41.72 |
| Singapore | 20.90 | 17.91 | 11.94 | 2.99 | 1.79 | 1.05 | 0.93 |
| Thailand | 22.81 | 27.89 | 37.07 | 41.85 | 38.82 | 41.22 | 43.28 |
| Vietnam | 19.33 | 19.71 | 21.07 | 20.66 | 28.23 | 34.70 | 39.28 |
Table 12.
Trends in forest land between 1990 and 2016 (% total land area).
| Country/Year | 1990 | 1993 | 1996 | 1999 | 2002 | 2005 | 2008 | 2011 | 2016 |
|---|---|---|---|---|---|---|---|---|---|
| Brunei Darussalam | 78.37 | 77.46 | 76.55 | 75.64 | 74.72 | 73.81 | 72.79 | 72.11 | 72.11 |
| Indonesia | 65.44 | 62.27 | 59.10 | 55.93 | 54.53 | 54.02 | 52.88 | 51.75 | 49.86 |
| Cambodia | 73.33 | 70.95 | 68.58 | 66.20 | 63.56 | 60.79 | 58.63 | 56.46 | 52.85 |
| Lao PDR | 76.45 | 75.00 | 73.54 | 72.09 | 72.20 | 73.09 | 75.55 | 78.01 | 82.11 |
| Myanmar | 60.01 | 58.01 | 56.01 | 54.02 | 52.41 | 51.00 | 49.58 | 47.80 | 43.63 |
| Malaysia | 68.11 | 67.39 | 66.67 | 65.95 | 64.86 | 63.58 | 65.84 | 67.38 | 67.60 |
| Philippines | 21.98 | 22.46 | 22.93 | 23.41 | 23.63 | 23.72 | 23.25 | 23.74 | 27.77 |
| Singapore | 24.40 | 24.40 | 24.40 | 24.40 | 24.22 | 23.73 | 23.36 | 23.22 | 23.06 |
| Thailand | 27.41 | 29.18 | 30.94 | 32.71 | 32.58 | 31.51 | 31.69 | 31.86 | 32.16 |
| Vietnam | 28.77 | 30.94 | 33.12 | 35.30 | 39.50 | 42.17 | 44.21 | 45.98 | 48.06 |
Table 13.
Trends in number of cattle between 1961 and 2018.
| Country/Year | 1961 | 1970 | 1980 | 1990 | 2000 | 2010 | 2018 |
|---|---|---|---|---|---|---|---|
| Brunei Darussalam | 3277 | 2500 | 3000 | 1503 | 1726 | 852 | 681 |
| Indonesia | 6,356,000 | 6,137,000 | 6,440,000 | 10,410,207 | 11,008,000 | 13,581,570 | 16,432,945 |
| Cambodia | 1,470,000 | 2,300,000 | 772,000 | 2,181,000 | 2,992,640 | 3,484,601 | 2,855,353 |
| Lao PDR | 290,000 | 380,000 | 447,000 | 841,900 | 1,157,000 | 1,474,000 | 2,040,907 |
| Myanmar | 5,252,622 | 6,833,256 | 8,531,000 | 9,310,000 | 10,982,000 | 13,608,909 | 17,418,364 |
| Malaysia | 329,555 | 325,522 | 549,522 | 667,720 | 738,783 | 836,859 | 752,547 |
| Philippines | 1,054,700 | 1,678,700 | 1,882,860 | 1,629,230 | 2,478,850 | 2,570,900 | 2,553,937 |
| Singapore | 7114 | 5000 | 1000 | 400 | 200 | 200 | 179 |
| Thailand | 3,542,420 | 4,666,969 | 3,938,221 | 5,668,530 | 4,601,697 | 6,497,996 | 4,656,654 |
| Vietnam | 1,871,800 | 1,616,000 | 1,664,200 | 3,116,900 | 4,127,872 | 5,808,300 | 5,802,907 |
Publisher’s Note: MDPI stays neutral with regard to jurisdictional claims in published maps and institutional affiliations. |
© 2021 by the authors. Licensee MDPI, Basel, Switzerland. This article is an open access article distributed under the terms and conditions of the Creative Commons Attribution (CC BY) license (https://creativecommons.org/licenses/by/4.0/).
Share and Cite
MDPI and ACS Style
Nguyen, T.T.; Nguyen, V.C. Financial Development and Renewables in Southeast Asian Countries—The Role of Organic Waste Materials. Sustainability 2021, 13, 8748. https://0-doi-org.brum.beds.ac.uk/10.3390/su13168748
AMA Style
Nguyen TT, Nguyen VC. Financial Development and Renewables in Southeast Asian Countries—The Role of Organic Waste Materials. Sustainability. 2021; 13(16):8748. https://0-doi-org.brum.beds.ac.uk/10.3390/su13168748
Chicago/Turabian StyleNguyen, Thu Thuy, and Van Chien Nguyen. 2021. "Financial Development and Renewables in Southeast Asian Countries—The Role of Organic Waste Materials" Sustainability 13, no. 16: 8748. https://0-doi-org.brum.beds.ac.uk/10.3390/su13168748
Note that from the first issue of 2016, this journal uses article numbers instead of page numbers. See further details here.