Article

Evaluation of Linear Deformation and Unloading Stiffness Characteristics of Asphalt Mixtures Incorporating Various Aggregate Gradations

1
Department of Transportation Engineering and Management, University of Engineering and Technology Lahore, Lahore 54890, Pakistan
2
HRTC & Design, National Highway Authority of Pakistan, Islamabad 44090, Pakistan
3
Geotechnical Consultant, Lahore 54810, Pakistan
*
Author to whom correspondence should be addressed.
Sustainability 2021, 13(16), 8865; https://0-doi-org.brum.beds.ac.uk/10.3390/su13168865
Submission received: 27 May 2021 / Revised: 21 June 2021 / Accepted: 2 August 2021 / Published: 8 August 2021
(This article belongs to the Special Issue Sustainability in Pavement Design and Pavement Management)

Abstract

:
Optimum stiffness and linear deformation in the unloading phase are fundamental properties of asphalt mixtures required for the durability of flexible pavements. In this research, blends of six different aggregate gradations were used for two base course (BC) and four wearing course (WC) asphalt mixtures. Stability and indirect tensile strength of resulting asphalt mixtures were evaluated to relate to viscoelastic unloading deformation and resilient moduli (instantaneous (MRI) and total (MRT)) at 25 °C using a 40/50 binder for 0.1 and 0.3 s load durations. Results indicated that an increase in coarse aggregate proportion from 48 to 70% for BC has shown a 12% and 14% increase in MRT for 0.1 and 0.3 s load durations, respectively, and an increase in coarse aggregate proportion from 41 to 57.5% for WC has caused a 26% and 20% increase in MRI for 0.1 and 0.3 s load durations, respectively. The same coarse aggregate proportions showed an increase in linear viscoelastic deformation at 0.1 s load duration from 54.6 to 68.2% for WC and from 53.0 to 62.7% for BC, whereas for 0.3 s load duration linear viscoelastic deformation increased from 58.1 to 69.1% for WC and 64.3 to 69.2% for BC. The findings of this study will assist in the selection of aggregate gradations to be used in wearing and base course asphalt mixtures for pavement design, construction and maintenance.

1. Introduction

Resilient modulus (MR) is the key parameter used for the design, evaluation, performance and analysis of flexible pavements [1]. In mechanistic–empirical design and analysis of flexible pavements, the stiffness properties of materials in different layers are related to stresses and strains induced by vehicle loading, hence the main outcome of stress–strain behavior, i.e., resilient modulus is an essential parameter to be used for the assessment of rutting and fatigue [2,3,4]. The elastic modulus is evaluated as a ratio of stresses and strains in monotonic loading, whereas the resilient modulus for the pavements is determined from repeated loading in different waveforms, usually haversine, which closely simulates the traffic loading [5]. The resilient modulus of asphalt mixtures depicts the relative strength coefficient and structural number (SN) used in the design of flexible pavements [6]. MR value is considerably affected by the loading type, loading time (vehicle speed) and mix type [7,8]. The resilient modulus decreases with an increase in temperature [9]. A change in stress level exhibits a change in deformation which further depicts the resilience of the asphalt mixture [9].
In recent years various researchers have carried out experimentation on the stiffness properties of asphalt mixtures [10,11,12]. The effect of mixture stiffness on the fatigue life of asphalt pavements was investigated [13,14,15]. Different studies were performed to assess the durability of laboratory-prepared asphalt mixtures [16,17,18]. The influence of volumetric properties on the performance of asphalt mixtures was evaluated [19,20,21,22]. Extensive past studies are seen to explore the effects of different types of aggregate gradations on the evaluation of MR of asphalt mixtures. The resilient modulus is significantly affected by a change in aggregate type and aggregate gradation [23]. The effects of aggregate gradation and nominal maximum aggregate size on the resilient modulus of asphalt mixes at 25 °C was also experimentally investigated [24]. It was evaluated that significant improvements in resilient modulus of asphalt mixes were observed when coarse aggregates with more irregular morphologies were used. The effect of maximum aggregate size on resilient modulus was investigated [25]. Five gradations of aggregates with maximum aggregate sizes of 3/8, 1/2, 3/4, 1 and 1.5 inches were employed and a good correlation between the resilient modulus and the maximum aggregate size was found. Accordingly, the resilient modulus increases as the maximum aggregate size increases. The effect of diameter/maximum nominal aggregate size ratio was investigated, and it was found that the resilient modulus of asphalt mixtures decreases as the ratio increases [26].
The impact of bitumen and aggregate combination on resilient modulus using four bitumen grades and four aggregate types were explored [27]. The asphalt mixtures with lower penetration grade bitumen exhibited higher resilient modulus and tensile strength, in dry and wet conditions, than those with higher penetration grades.
ASTM D 7369 explains the deformation caused by traffic loading as instantaneous and total deformation. Instantaneous deformation is very significant in the sense that the vehicle load induces deformation in a very short interval of time, whereas total deformation corresponds to the total duration of the application of load. The behavior of asphalt mixtures with different aggregate proportions and binder grades has rarely been studied for deformation caused by vehicle loads for very short intervals of time and total duration of applied load. Rare experimentation is seen in the literature on the role of different aggregate gradations and proportions of coarse aggregate on the instantaneous and total deformation caused by traffic loading for 0.1 s and 0.3 s load durations at 25 °C.
Asphalt mixtures exhibit viscoelastic behavior [28] (combination of elastic and viscous responses) when subjected to repeated vehicle loads. The non-linear viscoelastic properties of asphalt mixtures are significant for the prediction of pavement performance as asphalt pavements present non-linear behavior when subjected to heavy traffic loads [29]. Recoverable strain energy (RSE) is an important parameter for the assessment of asphalt mixtures to store and recover energy [30]. RSE is evaluated from the viscoelastic portion of the load–deformation curve of the resilient modulus test. The deformation curve for the haversine pattern of repeated loading presents two portions, i.e., viscoelastic and viscoplastic portions, where the viscoelastic portion further comprises linear viscoelastic and non-linear viscoelastic deformation. The RSE decreases with an increase in the number of cycles due to the loss of ability of the asphalt sample to store and recover energy as the particles of the sample become loose by repeated loading. The linear viscoelastic deformation is fully recoverable whereas the non-linear viscoelastic portion of the deformation curve is significant as the basis for further disturbances in samples with an increase in the number of cycles. Asphalt mixtures with larger extents of linear viscoelastic and lesser extents of non-linear viscoelastic deformation are considered good quality due to highly elastic behavior against dynamic loads.
It is well established that resilient modulus depends on the properties of binders and aggregates. However, the effect of variation in aggregate gradation and proportion on linear deformation and unloading stiffness is rarely seen in the literature. Therefore, in this research a range of different aggregate gradations and proportions were blended with a single binder to distinguish the effects of aggregate gradations and proportions clearly. The study was specifically oriented to the effects of aggregate gradation on the cyclic properties of asphalt mixtures. As a result, the gradation simulating the typical construction material encountered at road projects, with optimum resilient modulus, can be adopted in pavement construction projects to achieve economy.
The effect of coarse aggregate proportions of different gradations and proportions on resilient modulus and linear and non-linear viscoelastic deformation is rarely seen in the literature, although this aspect is vital in the assessment of the performance of asphalt mixtures. The specific objectives of the study were to evaluate the effect of aggregate gradation and proportion on the stiffness and viscoelastic deformation of asphalt mixtures for flexible pavements.
  • Comparison of MRI and MRT with load duration, i.e., 0.1 s and 0.3 s.
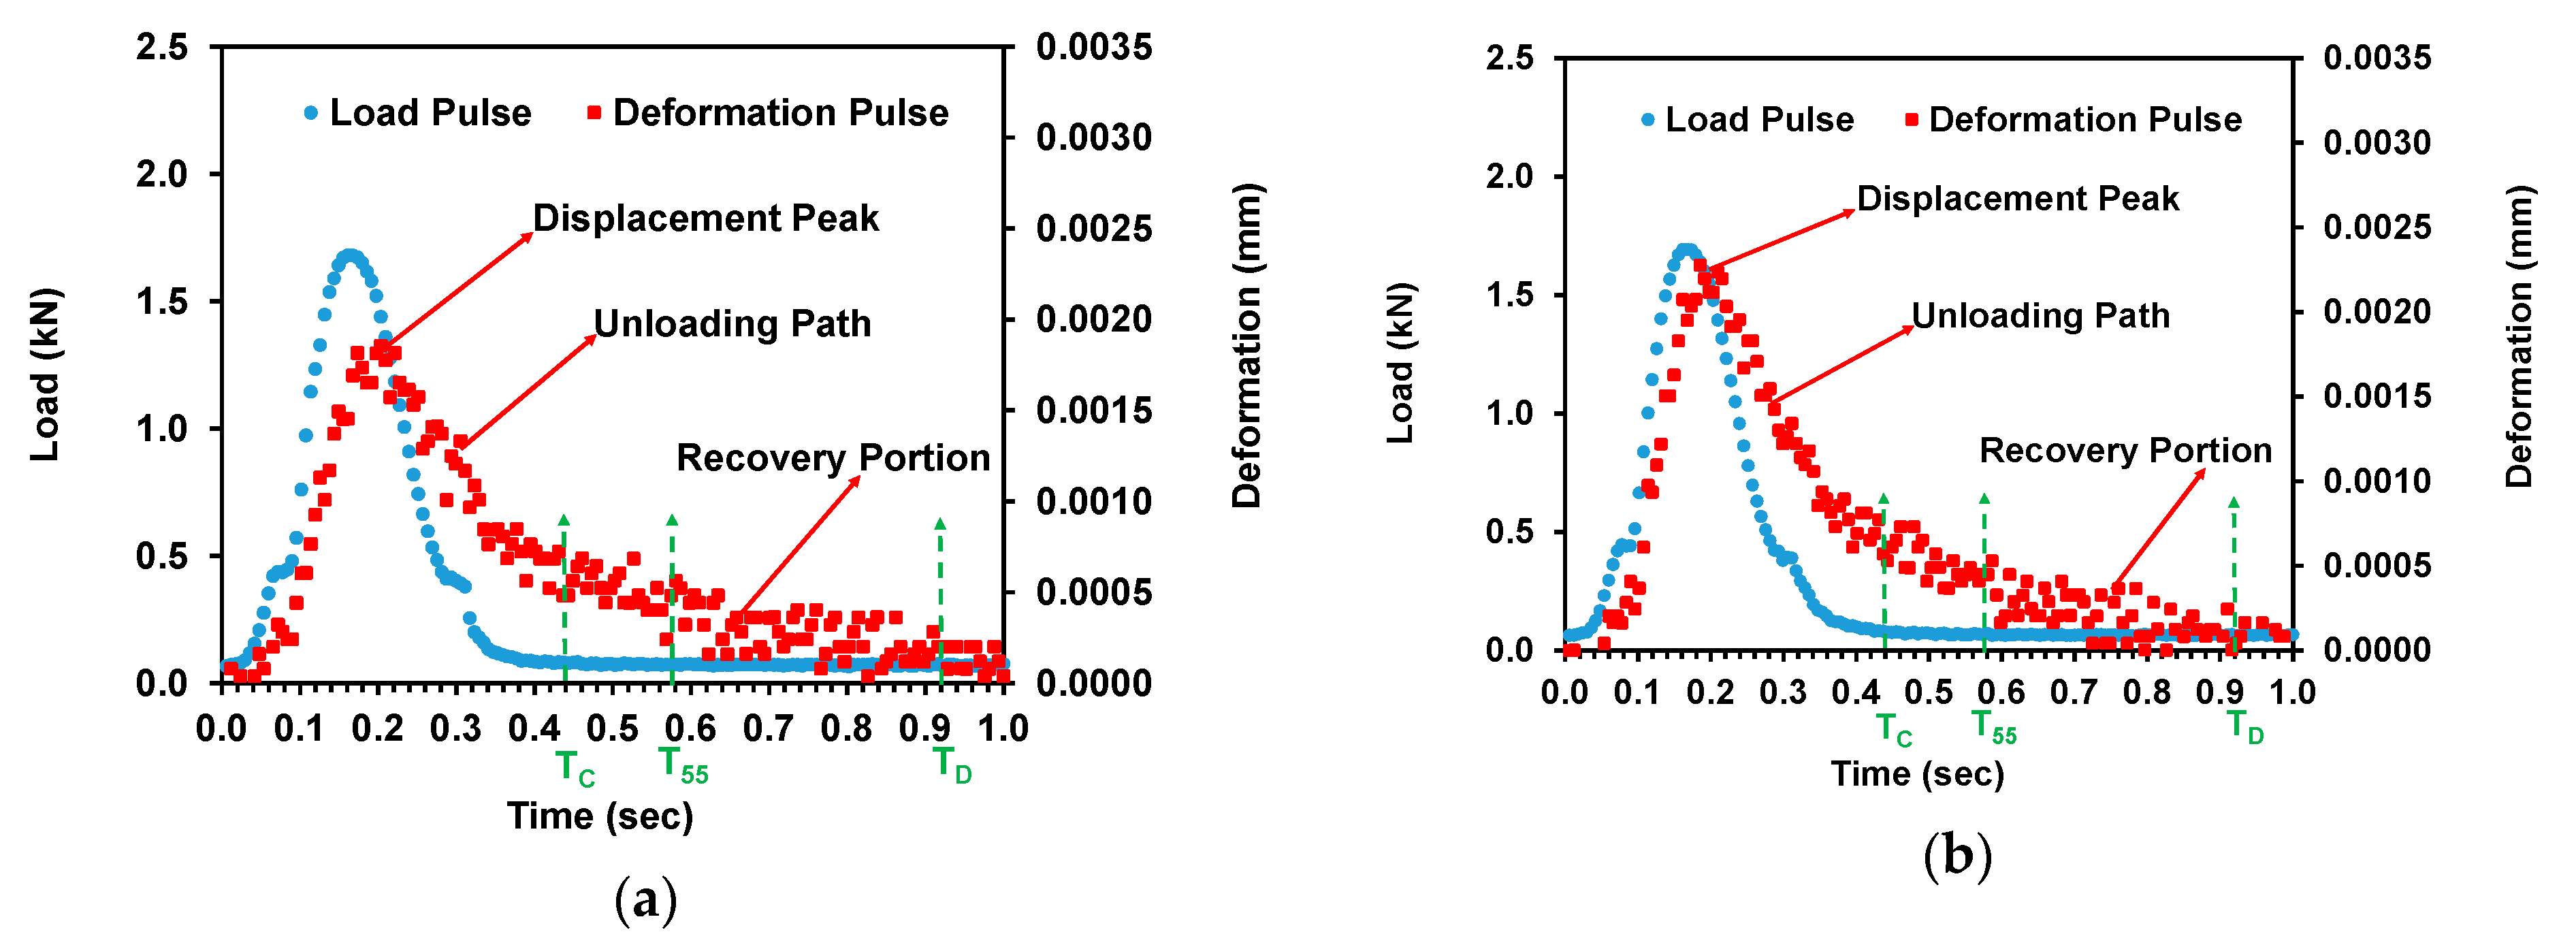
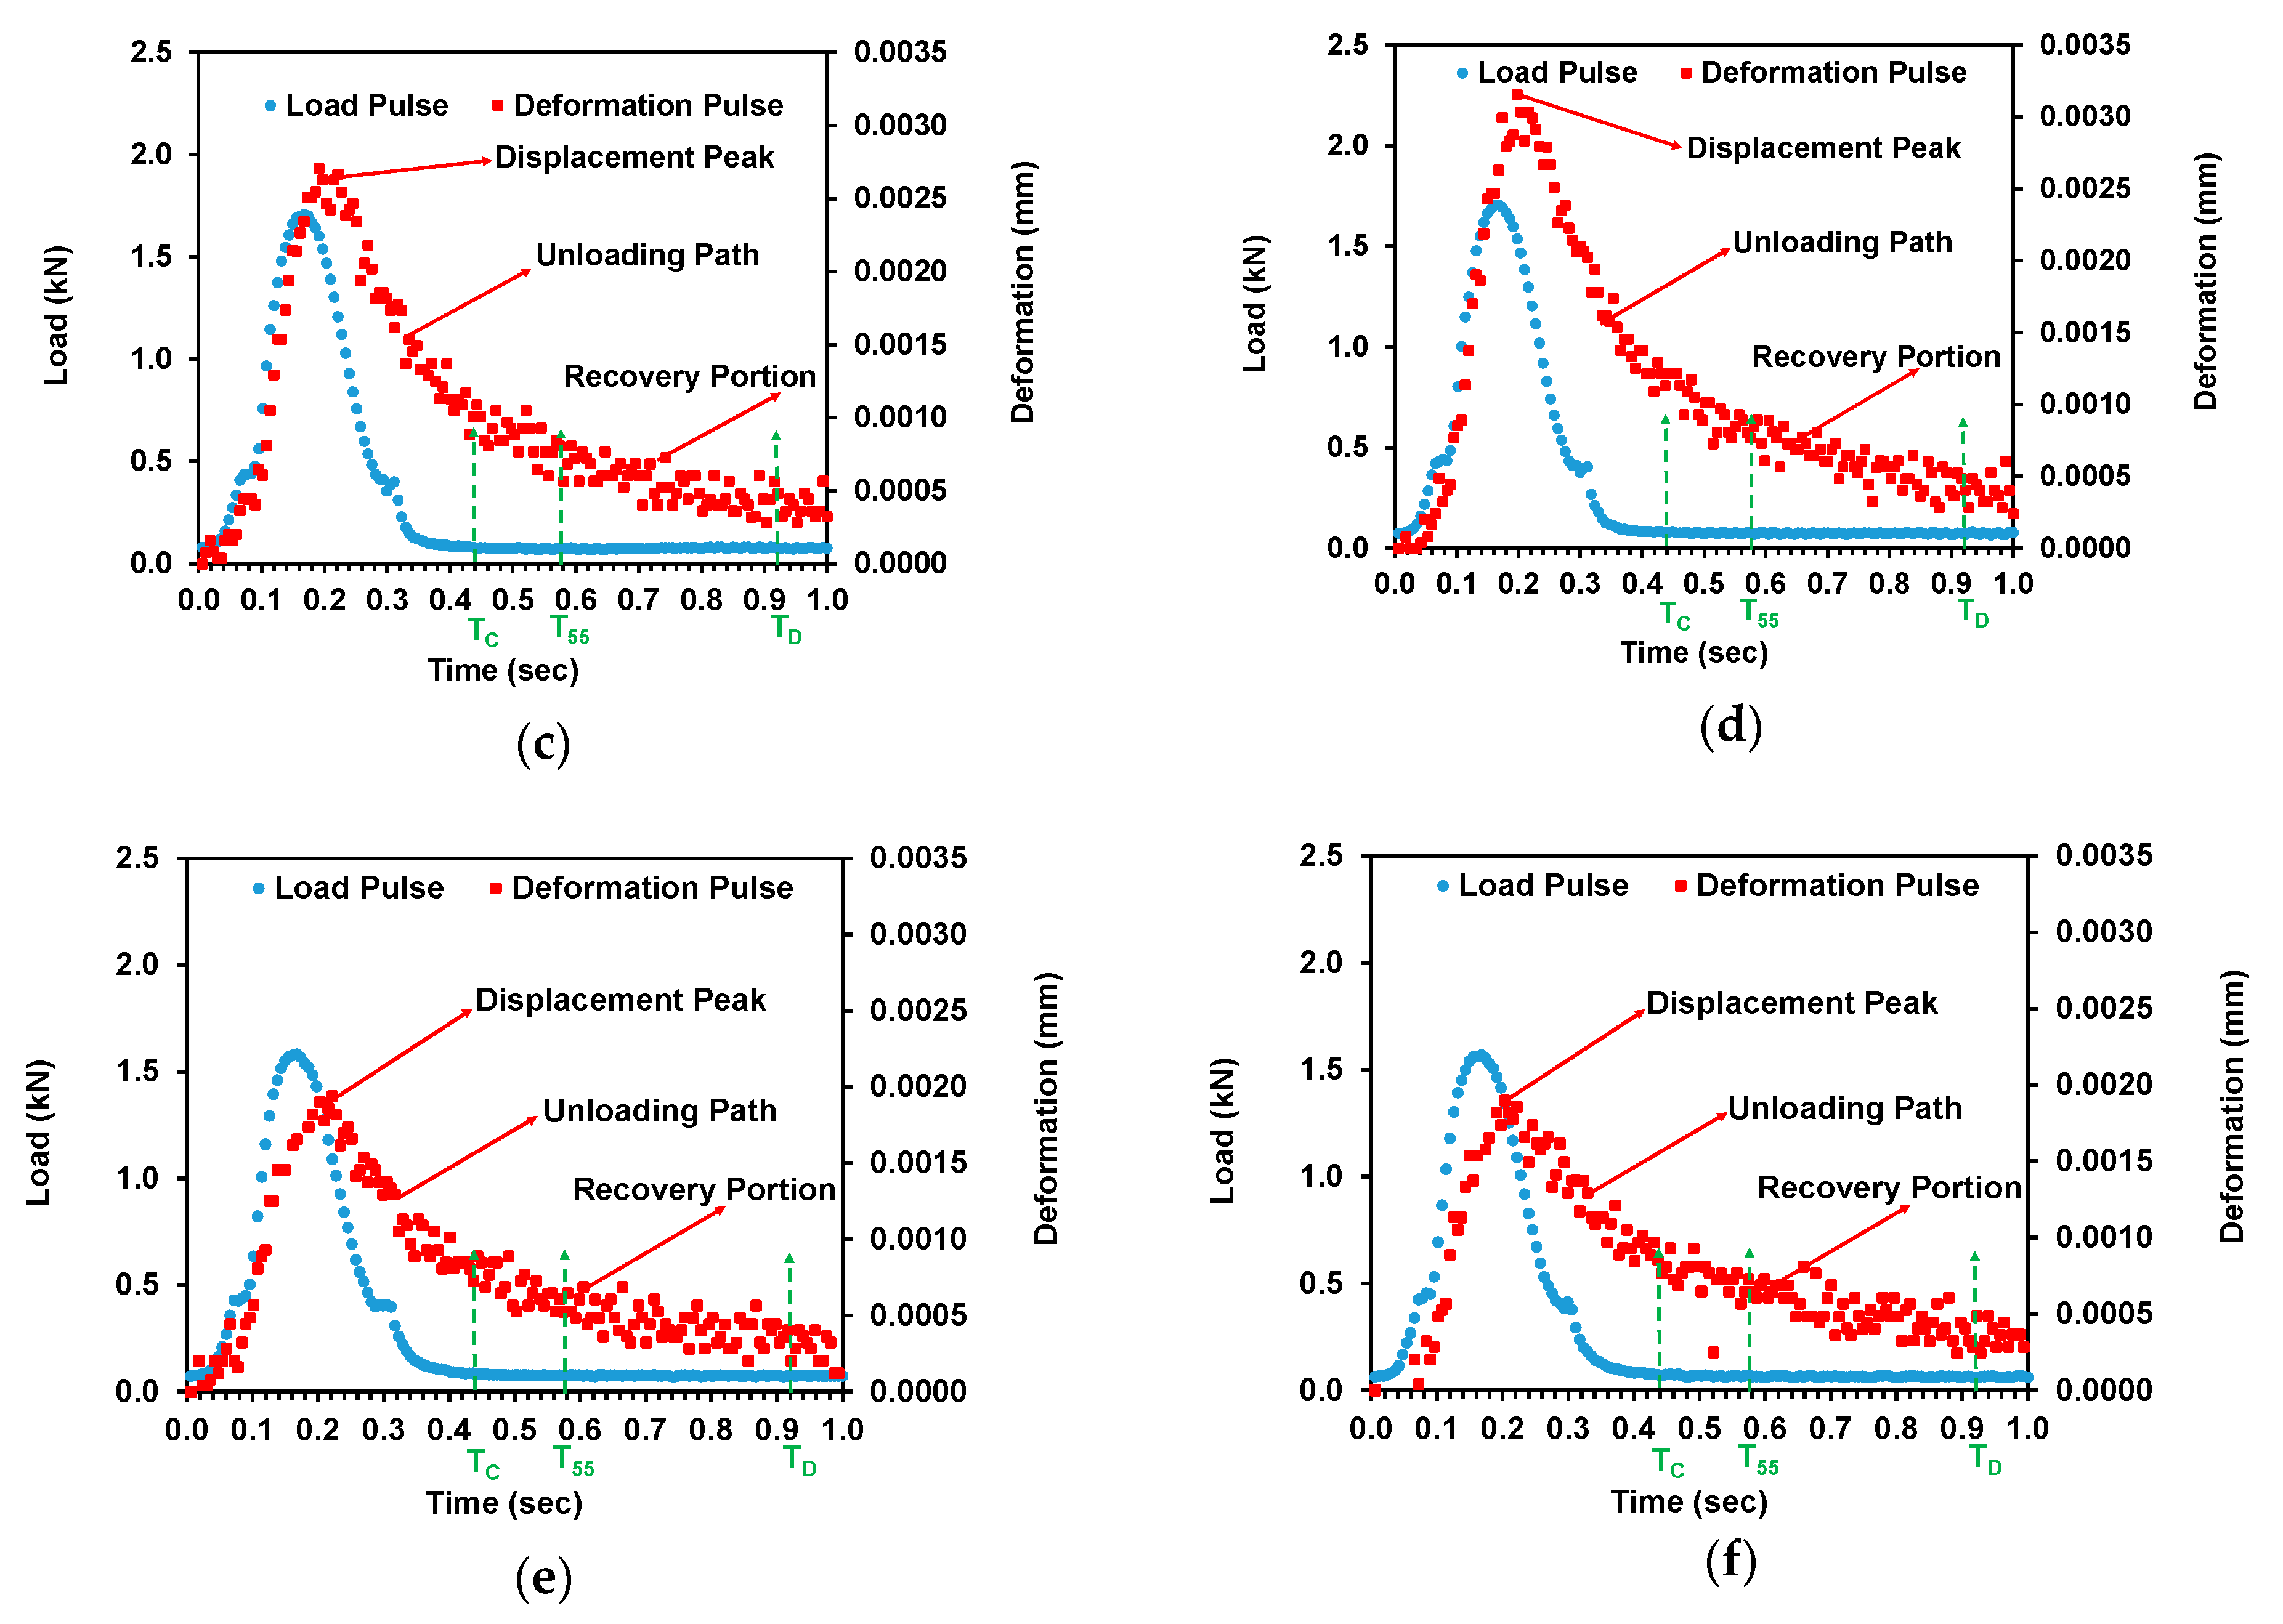
  • Comparison of linear and non-linear viscoelastic deformation induced during 0.1 s and 0.3 s load durations for WC and BC.
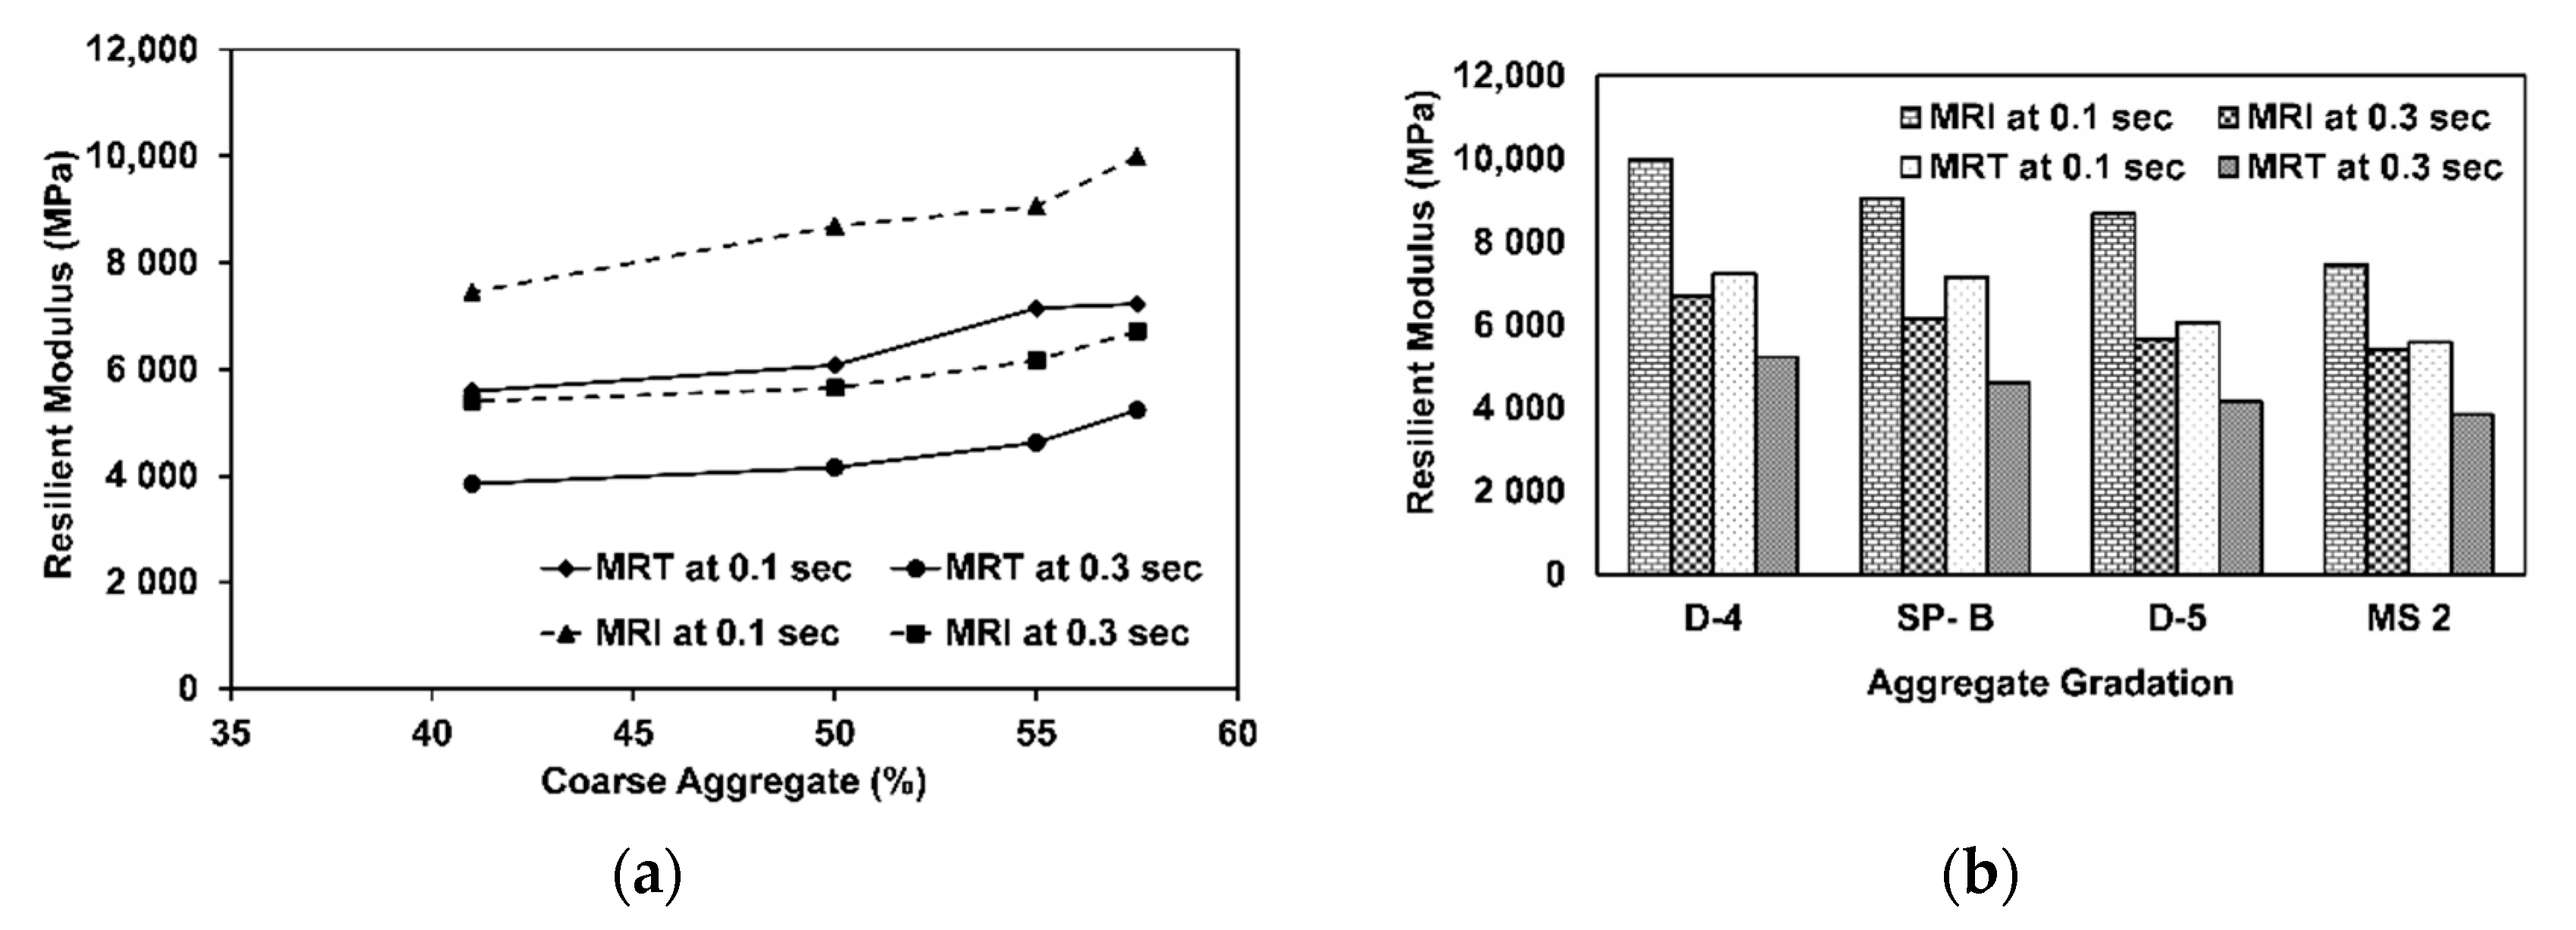
  • Relation of coarse aggregate proportion versus instantaneous and total resilient moduli (i.e., MRI and MRT).
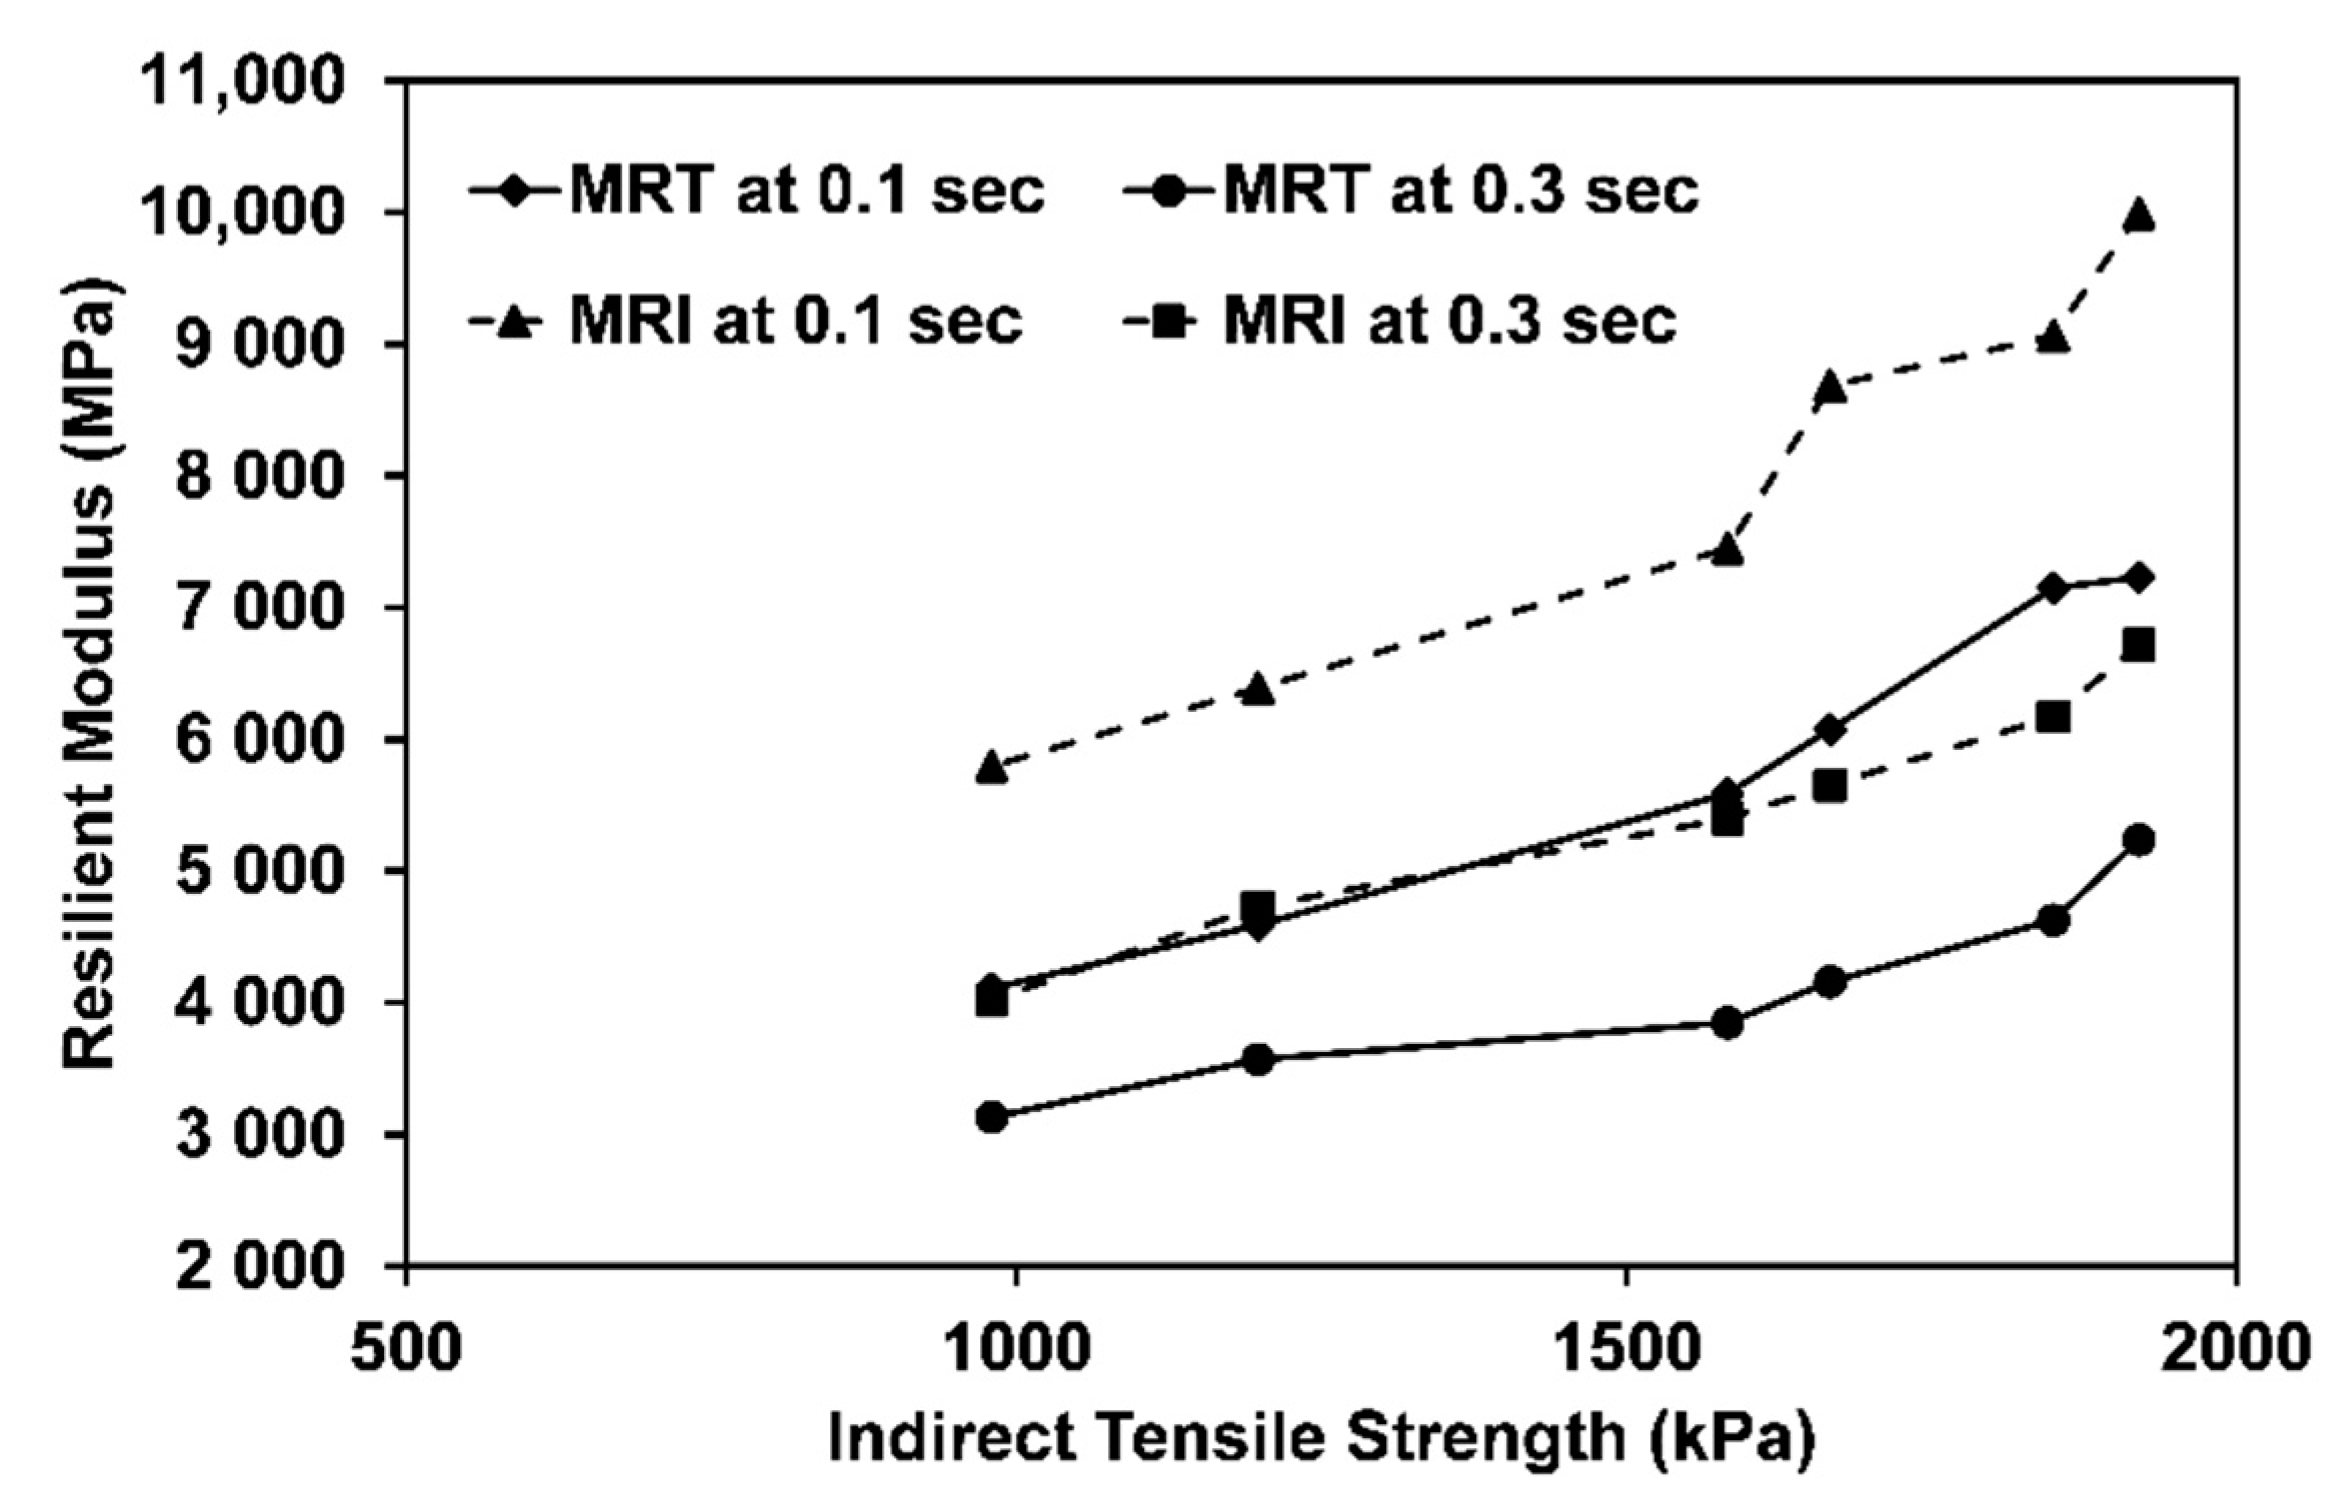
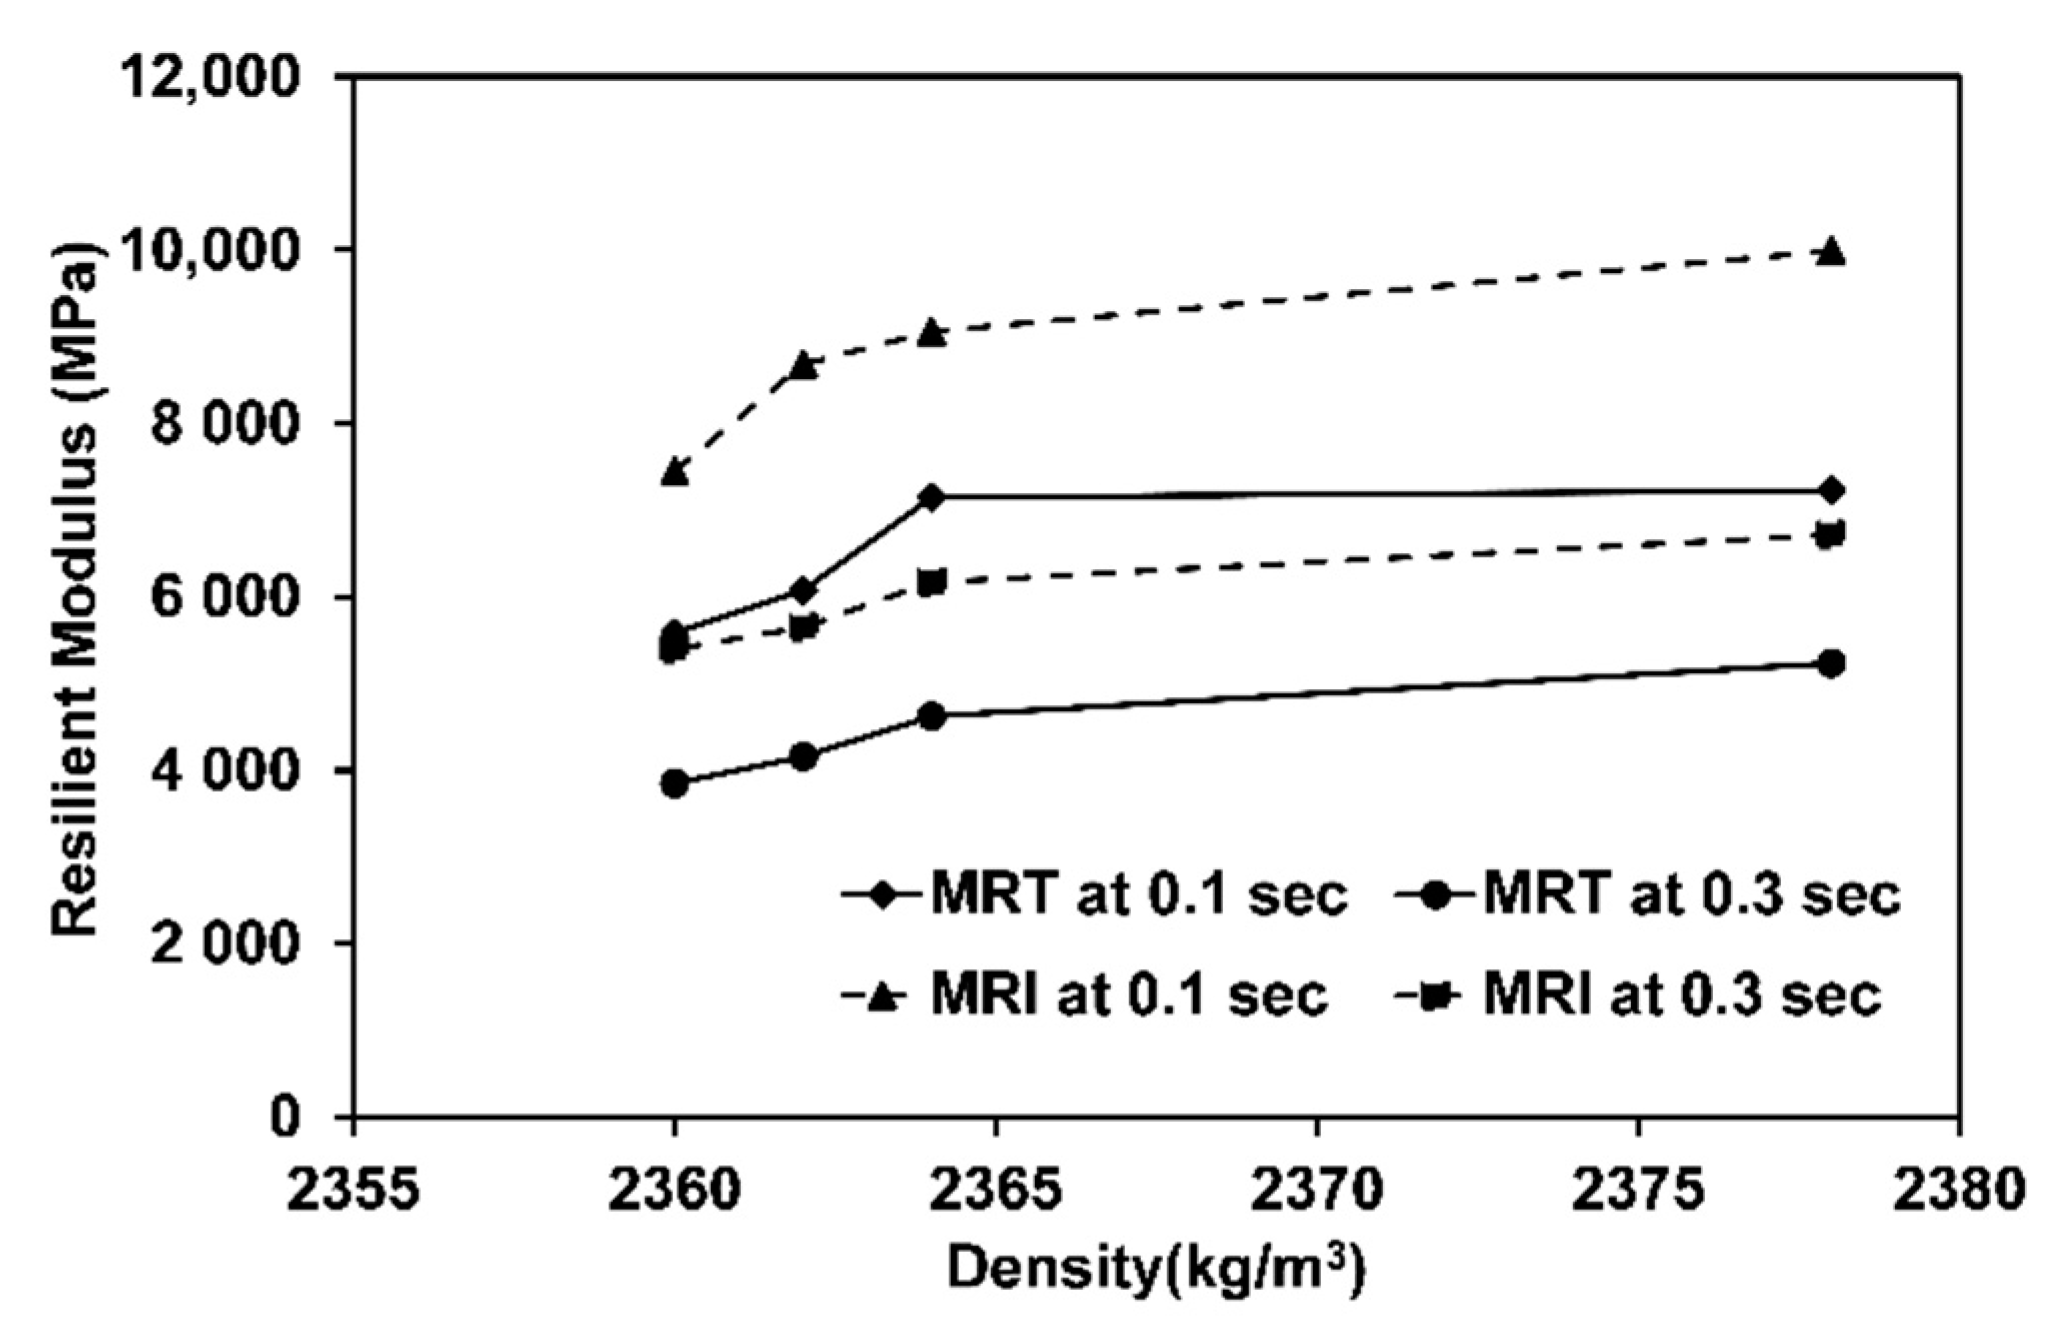
  • Relation of stability, density and indirect tensile strength (ITS) versus MRI and MRT.

2. Materials and Methods

The materials used in this research are the asphalt binder and aggregate, which are characterized by laboratory testing.

2.1. Asphalt Binder

Asphalt binder was acquired from National Refinery Limited (NRL), Karachi, Pakistan. Asphalt binder was characterized by conventional tests such as penetration (ASTM D5) test [31], softening point (ASTM D36) test [32], ductility (ASTM D113) test [33] and flash point (ASTM D92) test [34]. The results of conventional tests are given in Table 1a.
The performance-based properties of asphalt binder were determined using performance-graded (PG) binder specifications AASHTO M-320 [35]. These properties were determined using a rotational viscometer (RV), dynamic shear rheometer (DSR), rolling thin film oven (RTFO), pressure aging vessel (PAV) and bending beam rheometer (BBR). The test conditions are briefly discussed in the following lines.
The rotational viscosity test was performed to check the mixability and workability of the asphalt binder. Rotational viscosity values were obtained in accordance with AASHTO T 316 [36]. The rotational viscosities were determined at seven temperatures ranging from 125 °C to 185 °C.
The viscoelastic properties of the asphalt binder were determined using a dynamic shear rheometer (DSR) in accordance with AASHTO T 315 [37]. The DSR test was conducted under a stress-controlled loading condition using 1.59 Hz frequency at high- (46−82 °C) and intermediate (7–31 °C) temperature ranges. Samples were tested in original, rolling thin film oven (RTFO)-aged and pressure aging vessel (PAV)-aged conditions. The RTFO test was performed to simulate the short-term aging of binders as per AASHTO T 240 [38]. The PAV test was performed on RTFO-aged samples following AASHTO R 28 [39] to simulate the long-term aging effects.
In order to measure the low-temperature cracking performance of the asphalt binder, a BBR test was performed in accordance with AASHTO T313 [40]. The creep stiffness (S) and M-value of PAV-aged samples were determined at three different temperatures: −6, −12 and −18 °C. The S and M-values were used to determine the low-temperature performance grade.

2.2. Aggregate

The aggregate samples of different sizes were selected from a quarry of limestone with high impact and crushing strength, therefore they are widely used in pavement construction with high traffic loads [41]. The same stone quarry was selected for wearing course (WC) and base course (BC) in the present study to clearly distinguish the effect of gradation on linear deformation and unloading stiffness. This study employed four wearing course gradations and two base course gradations. Wearing course (WC) gradations included D-4, D-5 based on ASTM D 3515 [42], Superpave (SP-B) [43] and Asphalt Institute Manual Series (MS-)2 [44]. Base course (BC) gradations utilized Superpave (SP-2) [43] and dense bound macadam (DBM) [45]. These gradations are the most frequently used gradations for both WC and BC mixtures worldwide. This choice of gradations would make the findings of this study globally acceptable. The aggregates were tested by performing tests which include fractured faces, flakiness index, elongation index, Los Angeles abrasion value, water absorption, soundness, uncompacted voids and sand equivalent in accordance with relevant prevailing standards. The aggregate test results are summarized in Table 3.

2.3. Marshal Mix Design

The optimum asphalt content (OBC) of asphalt mixtures was determined using the Marshall mix design method in accordance with ASTM D 6926 [46]. The target air voids were kept at 4% and all volumetric parameters were checked against the recommended values at target air voids.

2.4. Asphalt Mixtures

Asphalt mixtures were prepared by blending each aggregate gradation with optimum bitumen content (OBC) determined from the Marshall mix design method. Four WC and two BC mixtures involving a 40/50 binder and six gradations, D4, SP-B, D5, MS-2, DBM and SP-2, were utilized for the determination of Marshall test properties, indirect tensile strength and resilient modulus. After the blending process, the mixtures were left in an oven for two hours to meet the short-term aging criteria. Specimens for indirect tensile strength (ITS) and resilient modulus (MR) tests were prepared using gyratory compactor AASHTO-T 312 [47] after heating the asphalt mixtures to their compaction temperatures.

2.5. Indirect Tensile Strength (ITS) Test

The indirect tensile strength (ITS) test was performed to determine the tensile properties of gyratory-compacted WC and BC asphalt mixtures as per ASTM D 6931 [48]. The ITS values of asphalt mixtures were determined at 25 °C using a universal testing machine (UTM) with digital loading and temperature control systems. The indirect tensile strength of samples was determined by applying a compressive load along a diametrical plane through two opposite loading strips as shown in Figure 1. Prior to testing, the specimens were conditioned in the temperature-controlled chamber for 4 h. The wearing course samples had 50.4 mm thickness and 99 mm diameter whereas base course samples had 76.2 mm thickness and 147.3 mm diameter. As per ASTM D6931–07, a minimum specimen height of 75 mm is required for specimens with a nominal diameter of 150 mm. As the diameter of BC specimens is 147.3 mm, the thickness of 76.2 mm was used. ITS was calculated using Equation (1).
S t = 2000 P π D T
where:
St = Indirect tensile strength of specimen (kPa)
P = Maximum value of load taken by specimen before failure (N)
D = Diameter of specimen (mm)
T = Thickness of specimen (mm)

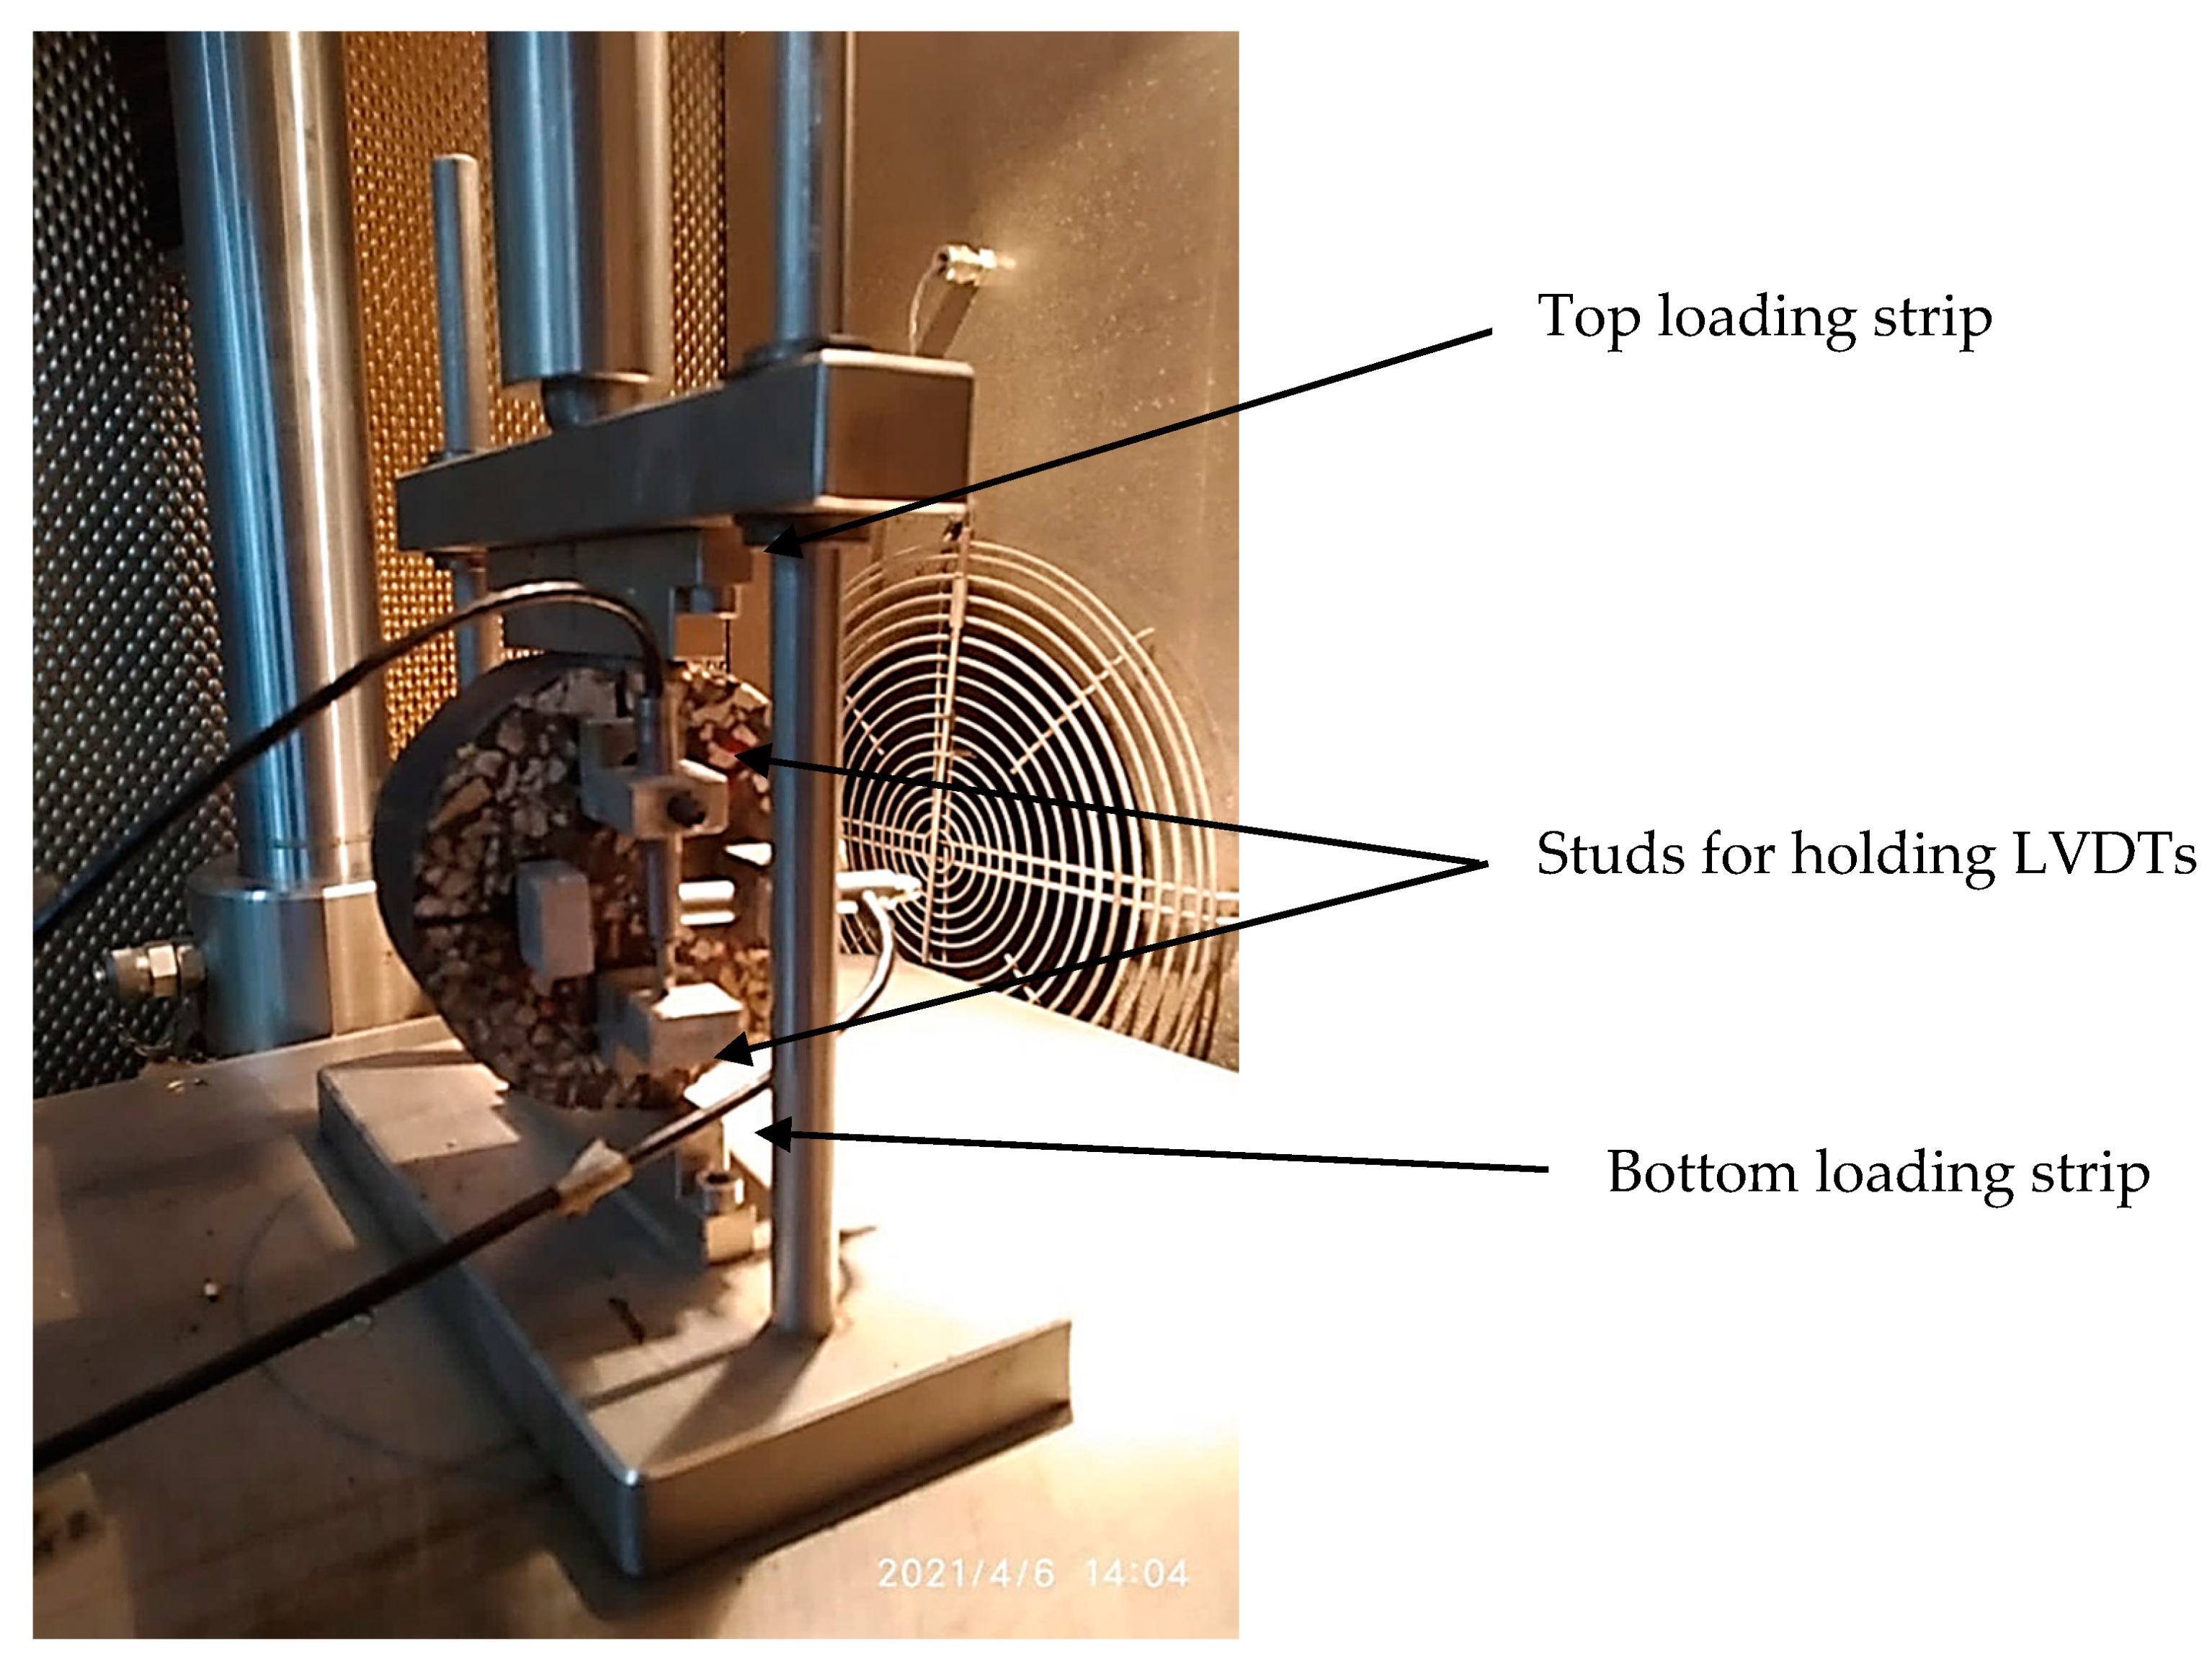
2.6. Resilient Modulus (MR) Test

Resilient modulus test on both WC and BC asphalt mixtures was conducted as per ASTM D 7369 for the evaluation of instantaneous (MRI) and total (MRT) resilient moduli. MR value of asphalt mixtures was determined using a UTM as shown in Figure 2. The load was applied on the specimen through the top loading strip along the diametral axis of the specimen. The contact area of the loading strip was 12.7 mm and 19 mm wide for WC and BC asphalt mixtures, respectively.
The test temperature ± 0.5 °C was maintained in the temperature-controlled chamber throughout the conditioning and testing period. The applied loads and the resulting deformations were measured and recorded through a load cell and a set of linear variable differential transducers (LVDTs), respectively. The load and deformation measurements were monitored continuously through a data acquisition system capable of recording 500 scans per second. Both horizontal and vertical deformations of the specimens were measured by mounting two LVDTs through glued studs on each face. The gauge length was 43 mm and the LVDTs were mounted between gauge points along the horizontal and vertical diameters. The horizontal and vertical alignment of LVDTS were ensured through an alignment device, and the diametral axes were marked.
The wearing course samples had 50.4 mm thickness and 99 mm diameter whereas base course samples had 50.4 mm thickness and 147.3 mm diameter. Three specimens of each mixture were tested for two loading durations (0.1 and 0.3 s) at a temperature of 25 °C.
Prior to testing, the specimens were conditioned in the temperature-controlled chamber for 6 h. A cyclic haversine loading scheme at frequencies of 0.1 Hz and 0.3 Hz were applied with 0.9 s and 0.7 s dwell time, respectively. In each loading sequence the total load was the sum of the cyclic load and the contact load (i.e., load to keep the sample in touch with loading plunger of the UTM). The cyclic load was calculated as 10% of ITS of each mixture. The resilient modulus was reported as the average of the first 5 consecutive cycles (having less than 1% change) after 100 cycles of preconditioning. These preconditioning cycles were applied first along the diametral axis followed by rotating the specimen 90°.
The total resilient modulus was calculated using the ASTM D 7369 equation stated below:
MR = P c y c l i c   δ h t ( I 1 I 2 . μ )
MR = Total resilient modulus, MPa
t = Thickness of specimen, mm
μ = Total Poisson’s ratio
μ = 0.15 + 0.35 1 + exp   ( 3.1849 0.04233 x T e m p )
Pcyclic = Peak cyclic load applied to the specimens, N
Pcyclic = Pmax − Pcontact
Pmax = Maximum applied load, N
Pcontact = Contact load, N
δ h = Total recoverable horizontal deformation, mm
I 1 , I 2 =   constants

3. Results

The results of characterizing tests on constituents of asphalt mixtures (with 40/50 grades and different aggregate gradations) are discussed first so that the effects of aggregate proportions of different gradations may be assessed on the resilient modulus linear and non-linear viscoelastic deformation.

3.1. Asphalt Binder Test Results

The selected binder was analyzed by conventional tests such penetration, flash point, ductility, softening point and solubility. The results of conventional tests presented in Table 1a show that penetration 47, flash point 335 °C, ductility 121 cm, softening point 51.5 °C and solubility 99.9% agree well with the ASTM D946 [49] and AASHTO M 20 [50] specifications for the penetration-graded asphalt binder. The results of performance-based asphalt binder properties are given in Table 1.
Asphalt binders were also characterized by performance tests at different conditions, i.e., rotational viscosity (original condition), dynamic shear rheometer (original, short-term aged and long-term aged) and bending beam rheometer (long-term aged). The rotational viscosities of the asphalt binder determined at seven temperatures (i.e., 125, 135, 145, 155, 165, 175 and 185 °C) are given in Table 1b. The results revealed that the binder has a rotational viscosity lower than 3000 cp at 135 °C and passed the criteria specified by AASHTO M 320.
The viscoelastic properties of the asphalt binder were determined using the DSR test, namely complex shear modulus (G*), phase angle (δ), rutting parameter (G*/Sin δ) and fatigue parameter (G*Sin δ). The rutting parameter of the original and RFTO-aged as well as the fatigue parameter of the PAV-aged binder were used to specify the high-temperature performance grade as per AASHTO M 320. The true grade temperature is 70.5 °C in the original, 67.5 °C in RTFO-aged and 23.5 °C in PAV-aged condition. The BBR test at −6 to −18 °C was performed after a long-term aging process. From the BBR test at three different temperatures, creep stiffness (S) and M-values were calculated. The S and M-values of binders were used to specify the low-temperature performance grade as per AASHTO M 320. The low temperature determined from the BBR test is −10.1 °C. The binder was graded as PG 64−16.

3.2. Aggregate Test Results

Presented in Figure 3 are the gradation curves of WC and BC aggregates which fall in the aggregate size bands, i.e., D-4, D-5 based on ASTM D 3515, Superpave (SP-B) based on Superpave specifications, MS-2 based on Asphalt Institute Manual Series, DBM based on British standards and Superpave (SP-2) based on Superpave specifications. The gradation composition of WC and BC aggregates is presented in Table 2. The properties of aggregates are presented in Table 3.

3.3. Asphalt Mixture Test Results

Properties investigated in this study were Marshall stability, flow, air voids (AV), voids in mineral aggregate (VMA), voids filled with asphalt (VFA), resilient modulus and indirect tensile strength as summarized in Table 4. The results of volumetric properties and optimum asphalt content are presented in Table 5. Stability ranging from 1170 to 3422 kg, flow ranging from 11.2 to 13.8 mm, VMA ranging from 12.19 to 12.75%, VFA ranging from 60.16 to 66.75%, OBC ranging from 3.87 to 4.65%, unit weight ranging from 2360 to 2436 kg/m3 and air voids at 4% were observed.

3.4. Indirect Tensile Strength (ITS) Test Results

In order to evaluate the strength of asphalt mixtures, the indirect tensile strength (ITS) test was performed at 25 °C. Presented in Figure 4 are the average indirect tensile strength values of three replicates of each mixture. The results represent the effect of aggregate gradation on the resistance of asphalt mixtures to tensile loads.

3.5. Resilient Modulus (MR) Test Results

In order to evaluate the stiffness of asphalt mixtures, a resilient modulus (MR) test was performed at 25 °C for 0.1 and 0.3 s load durations. Haversine waveform was applied to simulate the dynamic movement of vehicles as per ASTM D 7369 for the evaluation of MRI and MRT. Two load durations, i.e., 0.1 and 0.3 s, were used to study the effect of fast and slow loading rates respectively. The typical haversine deformation curves for asphalt mixtures for 0.1 and 0.3 s durations corresponding to six aggregate gradations are presented in Figure 5 and Figure 6. All data points are shown in Figure 5 and Figure 6 for the complete picture of resulting behavior from dynamic loads. Data recording was performed as 500 data points per second for 0.1 s load duration by UTM software, as shown in Figure 7. The ASTM D 7369 method was used to analyze the haversine curves for the evaluation of instantaneous and total resilient moduli. Different loads were applied to specimens of asphalt mixtures formed from six aggregate gradations.

4. Discussion

The gradations (Figure 3) are representative of typical construction extremes used in the pavement industry, so that the results of this research are utilized in the pavement construction industry in an optimal way. Different qualitative tests summarized in Table 3 show a summary of aggregate physical properties. Presented in Table 4 is the summary of test matrix of asphalt mixtures.
It can be observed from Table 5 that the stability value of D-4 is higher than that of other WC mixtures. The higher stability of D-4 may be credited to the coarser aggregate gradation of D-4. In BC mixtures, DBM showed higher stability as compared to SP-2. Based on the stability values, the strength of asphalt mixtures investigated in this study is in the order of DBM > SP-2 for BC and D-4 > SP-B > D-5 > MS-2 for WC mixtures, as presented in Figure 8.
It can be seen from Figure 4 that the ITS value of the asphalt mixture with a D-4 aggregate proportion is more than that of other mixtures. The higher ITS of D-4 may be attributed to the coarser aggregate gradation as compared to other mixtures. Based on the ITS values, the strengths of asphalt mixtures evaluated in this study is in the order of D-4 > SP-B > D-5 > MS 2 > DBM > SP-2.
Presented in Figure 5 and Figure 6 are the higher deformations that resulted from higher magnitude of loads. All asphalt mixtures show different patterns of deformation due to different aggregate proportions. These deformation curves are used for the evaluation of instantaneous and total resilient moduli from instantaneous and total deformations, respectively. The deformation curves of 0.1 s load duration shown in Figure 5 present lower deformation as compared with the curves of 0.3 s load duration shown in Figure 6, which infers that the moduli of 0.1 s load duration are comparatively higher than those of 0.3 s load duration.
The typical evaluation for instantaneous and total deformation along with corresponding instantaneous and total loads for 0.1 s load duration for asphalt mixture test specimens as per ASTM D 7369 are shown in Figure 7a,b. For simplicity and ease in calculations the mean value data points are shown with the loading and deformation curves for 0.1 s load duration. The analysis of deformation presents the complete calculation of the resilient moduli (instantaneous, MRI, and total, MRT). The higher values of MRI as 9062 MPa is observed as compared with MRT as 7148 MPa for 0.1 s load duration for a wearing course (WC) specimen. On the other hand, the curves presented in Figure 7c,d show the loading and deformation analysis of a base course (BC) specimen for 0.3 s load duration. The MRI and MRT are evaluated as 4727 MPa and 3570 MPa, which are lower than the resilient moduli evaluated for 0.1 s load duration.
Figure 9a and Figure 10a show an increase in instantaneous resilient modulus from 22.08% to 28.71% as compared with total resilient modulus. Presented in Figure 9b and Figure 10b, coarse aggregate proportions of 48% and 70% for base course (BC) and 41%, 50%, 55% and 57.5% for wearing course (WC) blended with a 40/50 binder grade at 25 °C at 0.1 s showed the total resilient modulus of 4107, 4590, 5586, 6074, 7148 and 7228 MPa and instantaneous resilient modulus of 5795, 6388, 7448, 8682, 9062 and 9991 MPa, respectively. Presented in Figure 9b and Figure 10b, coarse aggregate proportions of 48% and 70% for base course and 41%, 50%, 55% and 57.5% for wearing course blended with a 40/50 binder grade at 25 °C at 0.3 s showed the total resilient modulus of 3130, 3570, 3848, 4158, 4625 and 5234 MPa and instantaneous resilient modulus of 4019, 4727, 5398, 5650, 6170 and 6718 MPa respectively. The resilient modulus values are congruent with the resilient modulus of asphalt mixtures mentioned in past research [58] at 0.1 to 0.5 Hz from 15 to 20 °C. The results of this study also match other related previous studies [59,60]; however, there are some differences due to different asphalt mixtures, test conditions and material properties.
The indirect tensile strength (ITS) is correlated with MRI and MRT for 0.1 and 0.3 s load durations as presented in Figure 11. It is observed from Figure 11 that MRI and MRT increase with an increase in ITS for both WC and BC. It is observed that MRI showed higher values as compared with MRT due to the lesser extent of deformation used in MRI. It was observed that MRI increased by 25.5% for WC and 10.2% for BC for 0.1 s load duration, whereas MRT increased by 22.7% for WC and 11.8% for BC for 0.1 s load duration against ITS values ranging from 980 kPa to 1920 kPa at 25° C with a 40/50 binder grade. It was also observed that MRI increased by 19.6% for WC and 17.6% for BC for 0.3 s load duration whereas MRT increased 26.5% for WC and 14% for BC for 0.3 s load duration against ITS values ranging from 980 kPa to 1920 kPa for WC and BC and 10.3% and 41.9% at 25° C with a 40/50 binder grade.
The relation presented in Figure 12 shows that MRI increased by 25.5% for WC and 10.2% for BC for 0.1 s load duration, whereas MRT increased by 22.7% for WC and 11.8% for BC for 0.1 s load duration against stability values of 1170 kg to 1305 kg for WC and 2412 kg to 3422 kg at 25 °C with a 40/50 binder grade. It was also observed from Figure 13 that MRI increased by 19.6% for WC and 17.6% for BC for 0.3 s load duration, whereas MRT increased by 26.5% for WC and 14% for BC for 0.3 s load duration against stability values of 1170 kg to 1305 kg for WC and 2412 kg to 3422 kg at 25 °C with a 40/50 binder grade.
It was observed from Figure 14 that MRI increased by 25.5% for WC and 10.2% for BC for 0.1 s load duration, whereas MRT increased by 22.7% for WC and 11.8% for BC for 0.1 s load duration against density (unit weight) values of 2360 kg/m3 to 2378 kg/m3 for WC and 2401 kg/m3 to 2436 kg/m3 at 25 °C with a 40/50 binder grade. It was also observed from Figure 15 that MRI increased by 19.6% for WC and 17.6% for BC for 0.3 s load duration whereas MRT increased by 26.5% for WC and 14% for BC for 0.3 s load duration against bulk density values of 2360 kg/m3 to 2378 kg/m3 for WC and 2401 kg/m3 to 2436 kg/m3 at 25 °C with a 40/50 binder grade.
Asphalt mixtures are basically viscoelastic in behavior [61]. Viscoelastic deformation in asphalt mixtures is observed to comprise of linear viscoelastic and non-linear viscoelastic portions. The non-linear viscoelastic deformation mainly falls after the removal of load and is the continuing recoverable portion of total deformation (ASTM D 7369). The linear portion is important in the sense that it is fully recovered and exhibits good quality of asphalt mixture. The reduced non-linear viscoelastic portion and enlarged linear viscoelastic region is seen in the case of improved asphalt mixtures, so that the maximum elastic property may be used against dynamic loading of vehicles on the flexible pavements. Figure 16 and Figure 17 show the evaluation of linear and non-linear viscoelastic deformations resulting from dynamic loading applied in the haversine pattern for 0.1 s and 0.3 s load durations. It is also seen in Figure 16 and Figure 17 that part of the non-linear viscoelastic deformation remains after the load removal, so this deformation may play a critical role in the initiation of deformation to be added to the non-recoverable part of the stress–deformation curve.
In this research, the effect of an increase in coarse aggregate proportion for WC from 41% to 57.5% and for BC from 48% to 70% on linear and non-linear viscoelastic deformation is explored. An increase in linear viscoelastic deformation for 0.1 s duration is observed to be 54.6% to 68.2% for WC and 53.0% to 62.7% for BC, whereas non-linear viscoelastic deformation decreased from 45.4% to 31.8% for WC and from 47.0% to 37.3% for BC. Likewise, 0.3 s load duration was also analyzed for the same aggregate proportions. It was observed that linear viscoelastic deformation increased from 58.1% to 69.1% for WC and 64.3% to 69.2% for BC, whereas non-linear viscoelastic deformation decreased from 41.9% to 30.9% for WC and 35.7% to 30.8% for BC.
In brief, the effect of an increase in percent coarse aggregate (PCA) from 48% to 70% for base course and 41% to 57.5% for wearing course was observed for MRI, MRT, linear viscoelastic deformation and non-linear viscoelastic deformation of asphalt mixtures with a 40/50 binder grade at 25 °C for 0.1 and 0.3 s load durations. The results show that MRI increased from 10.2% to 25.5% and MRT increased from 11.8% to 26.5%, depicting that resilience of asphalt mixtures increases with an increase in PCA. This finding is significant in the sense that equivalent effects of an increase in PCA are observed for instantaneous and total duration of load application. Furthermore, it was observed that an increase in PCA increased linear viscoelastic deformation from 53% to 69.2% and decreased the non-linear viscoelastic deformation from 47.0% to 30.8% for asphalt mixtures, which is a novel finding in the area of flexible pavement construction. It is an interesting finding in the sense that an increase in PCA decreases the non-linearity in stress–strain behavior of asphalt mixtures. The decrease in non-linearity further enhances the resistance to permanent deformation of flexible pavements. The results also show that an increase in PCA causes an increase in ITS of 18.2% for BC and 17.6% for WC, from which it is inferred that an increase in PCA shows almost equivalent effects in BC and WC.
It is worth mentioning that the present study includes tests for the analysis and determination of aggregate and resilient properties of asphalt mixtures, which is defined collectively as multiscale evaluation. Regarding multiscale evaluation, it can be observed that detailed analysis of aggregate characteristics was conducted before resilient modulus, ITS and stability tests on asphalt mixtures. The aggregate was analyzed for different tests as described in Table 3 which shows that soundness values range from 0.43 to 0.93 and uncompacted voids range from 42 to 50. The resilient modulus test was carried out on asphalt mixtures for the determination of linear viscoelastic and non-linear viscoelastic properties.
In order to investigate the relationship between indirect tensile strength (ITS), stability, percent coarse aggregate (PCA), MRI and MRT, test results were analyzed using MINITAB–19 statistical software. On the basis of this analysis, the relationships found between these parameters are summarized in Table 6. These equations can be used to estimate the MRI and MRT values of WC and BC asphalt mixtures at 0.1 and 0.3 s load durations.
The regression models presented in Table 6 were developed for mixtures incorporating a 40/50 grade binder tested at 25 °C; therefore, their applicability is only limited to matching materials and testing conditions.

5. Conclusions

The effect of an increase in percent coarse aggregate (PCA) from 48% to 70% for base course and 41% to 57.5% for wearing course was studied for instantaneous resilient modulus (MRI), total resilient modulus (MRT), linear viscoelastic deformation and non-linear viscoelastic deformation of asphalt mixtures with a 40/50 binder grade at 25° C for 0.1 and 0.3 s load durations. The following was observed:
  • MRI increased from 10.2% to 25.5% and MRT increased from 11.8% to 26.5%, depicting that the resilience of asphalt mixtures increases with an increase in PCA.
  • An increase in PCA increased linear viscoelastic deformation from 53% to 69.2% and decreased the non-linear viscoelastic deformation from 47.0% to 30.8% for asphalt mixtures, which is a novel finding in the area of flexible pavement construction.
  • An increase in PCA results in an increase of ITS of 18.2% for BC and 17.6% for WC, from which it is inferred that an increase in PCA shows an almost equivalent effect in BC and WC.
  • The relations of PCA, ITS and stability versus MRI and MRT are presented using MINITAB–19 statistical software, for rapid and cost-effective assessment of response of flexible pavements using simple laboratory tests.

Author Contributions

Conceptualization, M.A.R. and A.H.K.; methodology, M.A.R.; validation, M.A.R., A.H.K. and Z.u.R.; formal analysis, M.A.R.; investigation, M.A.R.; resources, A.I.; writing—original draft preparation, M.A.R.; writing—review and editing, M.A.R., A.H.K., Z.u.R., Z.M. and A.I.; supervision, A.H.K. All authors have read and agreed to the published version of the manuscript.

Funding

The authors are grateful to Highway Research and Training Center (HRTC), National Highway Authority (NHA), Pakistan, for necessary funding.

Institutional Review Board Statement

Not applicable.

Informed Consent Statement

Not applicable.

Data Availability Statement

The data presented in this study are available on request from the corresponding author.

Acknowledgments

The authors would like to thank HRTC NHA and the department of transportation engineering and management for their support.

Conflicts of Interest

The authors declare no conflict of interest.

References

  1. ASTM D7369. Standard Test Method for Determining the Resilient Modulus of Bituminous Mixtures by Indirect Tension Test; ASTM International: West Conshohocken, PA, USA, 2020. [Google Scholar]
  2. Shalaby, A.; Liske, T.; Kavussi, A. Comparing back-calculated and laboratory resilient moduli of bituminous paving mixtures. Can. J. Civ. Eng. 2004, 31, 988–996. [Google Scholar] [CrossRef]
  3. Loulizi, A.; Flintsch, G.W.; Al-Qadi, I.L.; Mokarem, D.W. Comparing Resilient Modulus and Dynamic Modulus of Hot-Mix Asphalt as Material Properties for Flexible Pavement Design. Trans. Res. Rec. 2006, 23, 161–170. [Google Scholar] [CrossRef]
  4. AASHTO. Guide for Design of Pavement Structures, 157; AASHTO: Washington, DC, USA, 1993. [Google Scholar]
  5. Tahmoorian, F.; Yeaman, J.; Mirzababaei, M. Comparisons of the Resilient Moduli of Asphalt Mixes Containing Recycled Materials through Empirical and Experimental Methods. J. Mat. Civ. Eng. 2020, 32, 04020255. [Google Scholar] [CrossRef]
  6. Timm, D.H.; Peters-Davis, K. Recalibration of the Asphalt Layer Coefficient; NCAT Rep. No. 09-03; National Center for Asphalt Technology: Auburn, AL, USA, 2009. [Google Scholar]
  7. Clyne, T.R.; Li, X.; Marasteanu, M.O.; Skok, E.L. Dynamic and Resilient Modulus of Mn/DOT Asphalt Mixtures; No. MN/RC-2003-09; University of Minnesota: Twin Cities, MN, USA, 2003. [Google Scholar]
  8. Kaseer, F.; Yin, F.; Arámbula-Mercado, E.; Martin, A.E. Stiffness characterization of asphalt mixtures with high recycled material content and recycling agents. Transp. Res. Rec. 2017, 2633, 58–68. [Google Scholar] [CrossRef]
  9. Mamlouk, M.; Sarofim, R.T. Modulus of asphalt mixtures-an unresolved dilemma. Transp. Res. Rec. 1988, 1711, 193–198. [Google Scholar]
  10. Czech, K.; Gardziejczyk, W. Dynamic Stiffness of Bituminous Mixtures for the Wearing Course of the Road Pavement—A Proposed Method of Measurement. Materials 2020, 13, 1973. [Google Scholar] [CrossRef] [Green Version]
  11. Iwański, M. Effect of Hydrated Lime on Indirect Tensile Stiffness Modulus of Asphalt Concrete Produced in Half-Warm Mix Technology. Materials 2020, 13, 4731. [Google Scholar] [CrossRef]
  12. Mackiewicz, P.; Mączka, E. The Impact of Water and Road Salt with Anti-Caking Agent on the Stiffness of Select Mixes Used for the Road Surface. Materials 2021, 14, 1345. [Google Scholar] [CrossRef]
  13. Wu, Z.; Zhang, C.; Xiao, P.; Li, B.; Kang, A. Performance Characterization of Hot Mix Asphalt with High RAP Content and Basalt Fiber. Materials 2020, 13, 3145. [Google Scholar] [CrossRef]
  14. Li, L.; Jiang, X.; Lin, Y.; Yan, H. A Prediction Model on Viscoelastic Fatigue Damage of Asphalt Mixture. Materials 2020, 13, 3782. [Google Scholar] [CrossRef]
  15. Złotowska, M.; Nagórski, R.; Błażejowski, K. Concept of Similarity Method for Prediction of Fatigue Life of Pavement Structures with HiMA Binder in Asphalt Layers. Materials 2021, 14, 480. [Google Scholar] [CrossRef] [PubMed]
  16. Crisman, B.; Ossich, G.; Lorenzi, L.D.; Bevilacqua, P.; Roberti, R. A Laboratory Assessment of the Influence of Crumb Rubber in Hot Mix Asphalt with Recycled Steel Slag. Sustainability 2020, 12, 8045. [Google Scholar] [CrossRef]
  17. Woszuk, A.; Wróbel, M.; Bandura, L.; Franus, W. Brick Debris Dust as an Ecological Filler and Its Effect on the Durability of Asphalt Mix. Materials 2020, 13, 5023. [Google Scholar] [CrossRef] [PubMed]
  18. Skotnicki, L.; Kuźniewski, J.; Szydlo, A. Stiffness Identification of Foamed Asphalt Mixtures with Cement, Evaluated in Laboratory and In Situ in Road Pavements. Materials 2020, 13, 1128. [Google Scholar] [CrossRef] [Green Version]
  19. Chomicz-Kowalska, A.; Maciejewski, K.; Iwański, M.M. Study of the Simultaneous Utilization of Mechanical Water Foaming and Zeolites and Their Effects on the Properties of Warm Mix Asphalt Concrete. Materials 2020, 13, 357. [Google Scholar] [CrossRef] [PubMed] [Green Version]
  20. Skaf, M.; Pasquini, E.; Revilla-Cuesta, V.; Ortega-López, V. Performance and Durability of Porous Asphalt Mixtures Manufactured Exclusively with Electric Steel Slags. Materials 2019, 12, 3306. [Google Scholar] [CrossRef] [Green Version]
  21. White, G. A Synthesis on the Effects of Two Commercial Recycled Plastics on the Properties of Bitumen and Asphalt. Sustainability 2020, 12, 8594. [Google Scholar] [CrossRef]
  22. Omranian, S.R.; Hamzah, M.O.; Pipintakos, G.; Van den bergh, W.; Vuye, C.; Hasan, M.R.M. Effects of Short-Term Aging on the Compactibility and Volumetric Properties of Asphalt Mixtures Using the Response Surface Method. Sustainability 2020, 12, 6181. [Google Scholar] [CrossRef]
  23. Elliot, R.P.; Ford, M.C.; Ghanim, M.; Tu, Y.F. Effect of Aggregate Gradation Variation on Asphalt Concrete Mix Properties. Trans. Res. Rec. 1991, 1317, 52–60. [Google Scholar]
  24. Lim, C.T.; Tan, S.A. Specimen size effects on the diametrical mechanical testing of cylindrical asphalt mixes. J. Test. Eval. 1995, 23, 436–441. [Google Scholar]
  25. Tongyan, P.; Tutumluer, E.; Carpenter, S. Effect of coarse aggregate morphology on the resilient modulus of hot-mix asphalt, Trans. Res. Rec. 2005, 1929, 1–9. [Google Scholar]
  26. Brown, E.R.; Bassett, C.E. Effects of maximum aggregate size on rutting potential and other properties of asphalt-aggregate mixtures. Trans. Res. Rec. 1990, 1259, 107–119. [Google Scholar]
  27. Bagampadde, U.; Isacsson, U.; Kiggundu, B.M. Impact of bitumen and aggregate composition on stripping in bituminous mixtures. Mater. Struct. 2006, 39, 303–315. [Google Scholar] [CrossRef]
  28. Luo, R.; Liu, H.; Zhang, Y. Characterization of linear viscoelastic, nonlinear viscoelastic and damage stages of asphalt mixtures. Constr. Build. Mater. 2016, 125, 72–80. [Google Scholar] [CrossRef] [Green Version]
  29. Ban, H.; Im, S.; Kim, Y.R. Non-linear viscoelastic approach to model damage-associated performance behaviour of asphaltic mixture and pavement structure. Can. J. Civ. Eng. 2013, 40, 313–323. [Google Scholar] [CrossRef]
  30. Luo, X. Characterization of Fatigue Cracking and Healing of Asphalt Mixtures. Ph. D. Thesis, Texas A & M University, College Station, TX, USA, 2012. [Google Scholar]
  31. ASTM D5. Standard Test Method for Penetration of Bituminous Materials; ASTM International: West Conshohocken, PA, USA, 2020. [Google Scholar]
  32. ASTM D36. Standard Test Method for Softening Point of Bitumen (Ring-and-Ball Apparatus); ASTM International: West Conshohocken, PA, USA, 2014. [Google Scholar]
  33. ASTM D113. Standard Test Method for Ductility of Asphalt Materials; ASTM International: West Conshohocken, PA, USA, 2017. [Google Scholar]
  34. ASTM D92. Standard Test Method for Flash and Fire Points by Cleveland Open Cup Tester; ASTM International: West Conshohocken, PA, USA, 2018. [Google Scholar]
  35. AASHTO-M 320. Standard Specification for Performance-Graded Asphalt Binder; American Association of State Highway and Transportation Officials: Washington, DC, USA, 2017. [Google Scholar]
  36. AASHTO-T 316. Standard Method of Test for Viscosity Determination of Asphalt Binder Using Rotational Viscometer; American Association of State Highway and Transportation Officials: Washington, DC, USA, 2019. [Google Scholar]
  37. AASHTO-T 315. Standard Method of Test for Determining the Rheological Properties of Asphalt Binder Using a Dynamic Shear Rheometer; American Association of State Highway and Transportation Officials: Washington, DC, USA, 2010. [Google Scholar]
  38. AASHTO-T 240. Standard Method of Test for Effect of Heat and Air on a Moving Film of Asphalt Binder (Rolling Thin-Film Oven Test); American Association of State Highway and Transportation Officials: Washington, DC, USA, 2013. [Google Scholar]
  39. AASHTO-R 28. Standard Practice for Accelerated Aging of Asphalt Binder Using a Pressurized Aging Vessel (PAV); American Association of State Highway and Transportation Officials: Washington, DC, USA, 2012. [Google Scholar]
  40. AASHTO-T 313. Standard Method of Test for Determining the Flexural Creep Stiffness of Asphalt Binder Using the Bending Beam Rheometer (BBR); American Association of State Highway and Transportation Officials: Washington, DC, USA, 2011. [Google Scholar]
  41. Abbas, S.; Munir, M.J.; Kazmi, S.M.S.; Khitab, A.; Ashiq, S.Z.; Arshad, M.T. Engineering characteristics of widely used coarse aggregates in Pakistan: A comparative study. Pak. J. Eng. Appl. Sci. 2017, 20, 85–93. [Google Scholar]
  42. ASTM D3515. Standard Specification for Hot-Mixed, Hot-Laid Bituminous Paving Mixtures; ASTM International: West Conshohocken, PA, USA, 2009. [Google Scholar]
  43. Halladay, M. The Strategic Highway Research Program: An Investment that Has Paid Off; Public Roads: Washington, DC, USA, 1998; Volume 61. [Google Scholar]
  44. Asphalt Institute, Mix Design Methods for Asphalt Concrete and Other Hot-Mix Types; Asphalt Institute: Lexington, KY, USA, 1997.
  45. BS EN 13108-1 2016: Part 1. Bituminous Mixtures Materials Specification-Asphalt Concrete; European Committee for Standardization, British Standards Institution: London, UK, 2016. [Google Scholar]
  46. ASTM D6926. Standard Practice for Preparation of Asphalt Mixture Specimens Using Marshall Apparatus; ASTM International: West Conshohocken, PA, USA, 2010. [Google Scholar]
  47. AASHTO-T 312. Standard Method of Test for Preparing and Determining the Density of Asphalt Mixture Specimens by Means of the Superpave Gyratory Compactor; American Association of State and Washington Highway Transportation Officials: Washington, DC, USA, 2019. [Google Scholar]
  48. ASTM D6931. Standard Test Method for Indirect Tensile (IDT) Strength of Asphalt Mixtures; ASTM International: West Conshohocken, PA, USA, 2007. [Google Scholar]
  49. ASTM D 946/D946 M-20. Standard Specification for Penetration-Graded Asphalt Binder for USE in Pavement Construction; ASTM International: West Conshohocken, PA, USA, 2020. [Google Scholar]
  50. AASHTO-M 20. Standard Specification for Penetration-Graded Asphalt Cement; American Association of State Highway and Transportation Officials: Washington, DC, USA, 1970. [Google Scholar]
  51. ASTM D5821-13 2017. Standard Test Method for Determining the Percentage of Fractured Particles in Coarse Aggregate; ASTM International: West Conshohocken, PA, USA, 2017. [Google Scholar]
  52. ASTM D4791-19. Standard Test Method for Flat Particles, Elongated Particles, or Flat and Elongated Particles in Coarse Aggregate; ASTM International: West Conshohocken, PA, USA, 2019. [Google Scholar]
  53. ASTM C131/C131M-20. Standard Test Method for Resistance to Degradation of Small-Size Coarse Aggregate by Abrasion and Impact in the Los Angeles Machine; ASTM International: West Conshohocken, PA, USA, 2020. [Google Scholar]
  54. ASTM C127-15. Standard Test Method for Relative Density (Specific Gravity) and Absorption of Coarse Aggregate; ASTM International: West Conshohocken, PA, USA, 2015. [Google Scholar]
  55. ASTM C88/C88M-18. Standard Test Method for Soundness of Aggregates by Use of Sodium Sulphate or Magnesium Sulphate; ASTM International: West Conshohocken, PA, USA, 2018. [Google Scholar]
  56. ASTM C 1252-17. Standard Test Methods for Uncompacted Void Content of Fine Aggregate (as Influenced by Particle Shape, Surface Texture, and Grading); ASTM International: West Conshohocken, PA, USA, 2017. [Google Scholar]
  57. ASTM D 2419-14. Standard Test Method for Sand Equivalent Value of Soils and Fine Aggregate; ASTM International: West Conshohocken, PA, USA, 2017. [Google Scholar]
  58. Li, P.; Zheng, M.; Wang, F.; Che, F.; Li, H.; Ma, Q.; Wang, Y. Laboratory performance evaluation of high modulus asphalt concrete modified with different additives. Adv. Mater. Sci. Eng. 2017, 217, 7236153. [Google Scholar] [CrossRef] [Green Version]
  59. Lytton, R.L.; Gu, F.; Zhang, Y.; Luo, X. Characteristics of undamaged asphalt mixtures in tension and compression. Int. J. Pav. Eng. 2018, 19, 192–204. [Google Scholar] [CrossRef] [Green Version]
  60. Sun, Y.; Gu, B.; Gao, L.; Li, L.; Guo, R.; Yue, Q.; Wang, J. Viscoelastic mechanical responses of HMAP under moving load. Materials 2018, 11, 2490. [Google Scholar] [CrossRef] [PubMed] [Green Version]
  61. Mackiewics, P.; Szydlo, A. Viscoelastic parameters of asphalt mixtures identified in static and dynamic tests. Materials 2019, 12, 2084. [Google Scholar] [CrossRef] [Green Version]
Figure 1. Test setup for indirect tensile strength tests in UTM.
Sustainability 13 08865 g001
Figure 2. Test setup for resilient modulus tests in UTM.
Sustainability 13 08865 g002
Figure 3. Gradation curves for wearing (WC) and base course (BC) mixtures.
Sustainability 13 08865 g003
Figure 4. Indirect tensile strength of asphalt mixtures for different gradations at 25 °C.
Sustainability 13 08865 g004
Figure 5. Typical haversine net deformation waveform at 25 °C for 0.1 s load duration: (a) D-4 (WC), (b) SP-B (WC), (c) D-5 (WC), (d) MS-2 (WC), (e) DBM (BC) and (f) SP-2 (BC).
Sustainability 13 08865 g005aSustainability 13 08865 g005b
Figure 6. Typical haversine net deformation waveform at 25 °C for 0.3 s load duration: (a) D-4 (WC), (b) SP-B (WC), (c) D-5 (WC), (d) MS-2 (WC), (e) DBM (BC) and (f) SP-2 (BC).
Sustainability 13 08865 g006aSustainability 13 08865 g006b
Figure 7. Typical haversine load and deformation waveforms at 25 °C: (a) load SP-B (WC) at 0.1 s, (b) deformation SP-B (WC) at 0.1 s, (c) load DBM (BC) at 0.3 s and (d) deformation DBM (BC) at 0.3 s.
Sustainability 13 08865 g007aSustainability 13 08865 g007b
Figure 8. Stability of asphalt mixtures.
Sustainability 13 08865 g008
Figure 9. (a) Effect of coarse aggregate percentage on MRI and MRT of WC mixtures. (b) Effect of aggregate gradation on MRI and MRT of WC mixtures.
Sustainability 13 08865 g009
Figure 10. (a) Effect of coarse aggregate percentage on MRI and MRT of BC mixtures. (b) Effect of aggregate gradation on MRI and MRT of BC mixtures.
Sustainability 13 08865 g010
Figure 11. Effect of indirect tensile strength on MRI and MRT of asphalt mixture.
Sustainability 13 08865 g011
Figure 12. Effect of stability on MRI and MRT of WC mixtures.
Sustainability 13 08865 g012
Figure 13. Effect of stability on MRI and MRT of BC mixtures.
Sustainability 13 08865 g013
Figure 14. Effect of density on MRI and MRT of WC mixture.
Sustainability 13 08865 g014
Figure 15. Effect of density on MRI and MRT of BC mixture.
Sustainability 13 08865 g015
Figure 16. Linear viscoelastic deformation for WC at 0.1 s load duration.
Sustainability 13 08865 g016
Figure 17. Linear viscoelastic deformation for BC at 0.3 s load duration.
Sustainability 13 08865 g017
Table 1. Results of asphalt binder (a) conventional properties (b) performance-based properties.
ParameterResult
S1 1S2S3Average
(a)
Penetration (0.1 mm)47484547
Flash Point (°C)335336333335
Ductility (cm)121119122121
Softening Point (°C)51.552.051.351.6
Solubility (%)99.9199.7699.9399.87
(b)
Viscosity at 125 °C (cP 2)812.5820.5803.5812.2
Viscosity at 135 °C (cP)462.5450.5475.5462.8
Viscosity at 145 °C (cP)287.5289.5285.5287.5
Viscosity at 155 °C (cP)187.5184.5189.5187.2
Viscosity at 165 °C (cP)125.0122.0128.0125.0
Viscosity at 175 °C (cP)87.584.589.587.2
Viscosity at 185 °C (cP)62.560.564.562.5
True Grade Temperature (°C)
(Original)
70.570.071.070.5
True Grade Temperature (°C) (RTFO)67.568.067.067.5
True Grade Temperature (°C) (PAV)23.524.023.023.5
BBR Low Temperature (°C)−10.1−10.0−10.3−10.1
Performance GradePG 64−16
1 S1: Sample 1, S2: sample 2, S3: sample 3; 2 cP: centipoise.
Table 2. Gradation composition of wearing and base course mixtures.
Sieve Size (mm)Gradation (% Passing)
Wearing Course (WC)Base Course (BC)
D-4D-5SP-BMS-2DBMSP-2
37.5100100100100100100
25.41001001001009595
19951001001008583
12.5768295956070
9.0637084824765
6.4525957693557
4.7542.55045593052
2.36293030432039
1.18202020301530
0.6131515201223
0.38.5101013814
0.156768.5610
0.075554645.5
Table 3. Summary of aggregate physical properties.
TestStandardWearing Course (WC)Base Course (BC)
D-4SP-BD-5MS-2DBMSP-2
Fractured Faces (%)ASTM D 5821 [51]100100100100100100
Flakiness Index (%)ASTM D 4791 [52]5.426.216.877.325.787.48
Elongation Index (%)ASTM D 479116.6818.5219.4317.3119.1518.78
Los Angeles Abrasion Value (%)ASTM C 131 [53]22.0824.4323.1125.6226.8324.88
Water Absorption (%)ASTM C 127 [54]0.30.330.310.320.330.31
Soundness (%)ASTM C 88 [55]0.870.590.610.430.930.82
Uncompacted Voids (%)ASTM C 1252 [56]424446474950
Sand Equivalent (%)ASTM D 2419 [57]807979787778
Table 4. Summary of test matrix of asphalt mixtures.
GradationsMM 1ITS (25 °C)MR (25 °C)
0.1 s0.3 s
D-4xxxx
SP-Bxxxx
D-5xxxx
MS-2xxxx
DBMxxxx
SP-2xxxx
1 MM: Marshall mix, ITS: indirect tensile strength, MR: resilient modulus.
Table 5. Volumetric properties of asphalt mixtures.
GradationVMA 1 (%)VFA (%)Stability (kg)OBC (%)Flow
(0.25 mm)
Unit Weight (kg/m3)AV (%)
D-412.6866.3513053.9912.223784
SP-B12.7560.1612503.8713.423644
D-512.4264.8112154.1113.823624
MS-213.7266.7511704.6511.423604
DBM12.1961.9634223.8812.624364
SP-212.4261.3824123.9511.224014
1 VMA: Voids in mineral aggregates, VFA: voids filled with asphalt, OBC: optimum bitumen content, AV: air voids.
Table 6. Regression models for estimation of MRI and MRT for BC and WC asphalt mixtures.
Mix TypeLoad DurationRegression ModelR2
WC0.1 sMRI = −10983 − 3.537 ITS + 81.80 PCA + 17.67 Stability0.91
MRT = 3704 + 6.504 ITS + 35.79 PCA − 8.446 Stability0.88
0.3 sMRI = −6913 + 2.133 ITS − 36.52 PCA + 8.916 Stability0.86
MRT = −9630 + 1.370 ITS − 32.30 PCA + 10.80 Stability0.89
BC0.1 sMRI = 2173 + 4.614 ITS − 18.75 PCA0.87
MRT = 1058 + 3.957 ITS − 17.27 PCA0.81
0.3 sMRI = −908.3 + 6.709 ITS − 34.32 PCA0.84
MRT = 1573 + 1.185 ITS + 8.245 PCA0.83
MRI = Instantaneous resilient modulus, MPa; MRT = total resilient modulus, MPa; ITS = indirect tensile strength, kPa; PCA = percent coarse aggregate, %; Stability = Marshall stability, kg.
Publisher’s Note: MDPI stays neutral with regard to jurisdictional claims in published maps and institutional affiliations.

