
Assessing Life Cycle Environmental and Economic Impacts of Building Construction Solutions with BIM


1
Institute for Sustainability and Innovation in Structural Engineering (ISISE), University of Minho, 4800-058 Guimarães, Portugal
2
FSV Projetos, Vila Velha 291010-010, Brazil
3
Civil Engineering Department, School of Engineering, University of Minho, 4800-058 Guimarães, Portugal
*
Author to whom correspondence should be addressed.
Sustainability 2021, 13(16), 8914; https://0-doi-org.brum.beds.ac.uk/10.3390/su13168914
Submission received: 9 July 2021
/
Revised: 30 July 2021
/
Accepted: 2 August 2021
/
Published: 9 August 2021
(This article belongs to the Special Issue Life Cycle Assessment Studies Applied to Different Sectors: Fashion, Construction Material and Packaging)
Abstract
:Worldwide authorities are increasingly concerned about construction’s efficiency and sustainability, leading to the development of high-performance buildings. However, such facts have shifted a significant percentage of the building life cycle environmental impacts from the operation to the product and construction phases. Thus, the need to evaluate and select more sustainable materials and construction solutions arises, to also minimize impacts from these stages. To evaluate those impacts, LCA and LCC analysis are usually applied to assess the building impacts and costs, through the different life cycle stages. Despite the usefulness of LCA and LCC methods during the project phase, they are usually evaluated in the project later stages. It is too complex and time-consuming to gather and process all the required data during the project early stages. With the recent deployment of BIM, the opportunity to automate and shift LCA and LCC analysis to project early stages stands out. Facing the research gap, this study aims to develop a BIM-based decision-making tool for designers to evaluate the environmental, economic, and functional performance of different building construction solutions. To do so, 18 different simulation scenarios have been created in Autodesk Revit with different combinations of external walls, roofs, and floors. Then, a framework was developed in Dynamo to automatically characterize the building elements life cycle environmental impacts and costs, as well as to automate the LCA and LCC analysis during the project early stages. The outcomes can significantly reduce the required time, errors and efforts when performing LCA and LCC analysis, providing designers with real time decision support data and making an important contribution to the use of BIM for sustainability purposes.
1. Introduction and Background
Facing increasing concerns about construction’s negative environmental impacts, worldwide governments and society are constantly looking for more efficient and ecological solutions. The relation between environmental impacts and the building sector has already been proved and accepted by the scientific community [1]. Up to now, in Europe, buildings are responsible for 40% of the energy demand, 36% of greenhouse gas emissions and 50% of raw material consumption [2]. To tackle such problems, different methods and techniques are being used and sought by researchers, designers, contractors, and building owners. Despite the importance of acting during the building construction and operation phase, researchers have recognized the importance of decisions made in the early design stages, namely on the selection of materials with low embodied impacts and building performance optimization [2,3,4]. As these decisions cost less and can be easily made, their benefits are more effective to improve the building performance, while reducing environmental impacts.
One of the most recognized methods to reduce the building impacts is the Life Cycle Assessment (LCA) analysis, which acts as a multi-disciplinary method to evaluate the building material environmental impacts [5,6,7]. It covers all the building life cycle from the extraction and processing of the raw materials to the building end-of-life. Through LCA analysis, the building environmental impacts can be assessed in the project early stages, supporting decision-making for sustainable solutions [8]. By allowing designers to compare the embodied and the operational impact of different solutions, LCA stands as a critical tool to reduce buildings’ environmental impacts and its use is continuously increasing [4,8,9,10]. LCA has been standardized by ISO and can be divided into four steps [9,11]: (1) goal and scope definition; (2) inventory analysis; (3) environmental impact assessment and; (4) interpretation. Simultaneously, the Life Cycle Cost (LCC) assessment has also been commonly used to estimate buildings’ costs and revenues in their different life cycle stages. The ISO 15686-5 has divided LCC into construction, operation, occupancy, maintenance, and end-of-life costs [12]. LCC analysis should also be used during the project early stages to evaluate the economic effect and cost of different design alternatives and support decision-making [13,14]. Both LCA and LCC analysis are among the most-used methods to assess the environmental and economic impacts of a product [2,15].
However, performing both LCA and LCC analysis of a building is a complex and time-consuming task [8,9,12]. It requires processing a large amount of information from different life cycle stages, as well as establishing the bill of quantities and databases. Thus, together with the absence of legislation in most countries, designers often did not include such analysis during their projects. There is a need to simplify the process and provide better tools for designers to use during the project phases. Digital tools, like Building Information Modelling (BIM), have been used to accelerate and decrease the efforts of LCA and LCC analysis [9,15]. Several researchers have focused their attention on such integration, and it has been a significant trend in the domain of sustainable construction, especially in the last 5 years [9,12,16].
BIM can be described as a working methodology that allows managing all the project design and data in a virtual environment during the project life cycle [17]. It creates the opportunity to virtually construct and simulate the building performance before the construction itself [18]. Some of the main benefits, which are more noticeable during the design phases, include constant communication among stakeholders, allowing for early detection of errors and incompatibilities, facilitating decision-making, and optimizing costs and time [19,20,21,22]. The methodology requires the development and characterization of a virtual model—BIM model—which is created with object-oriented parametric modelling, and it is defined by the Level of Development (LOD). The LOD ranges from 100 to 500 and it describes the model content and reliability [23].
BIM has already been recognized as an effective platform to improve building sustainability [19,24]. By integrating multi-disciplinary data into a single model, it creates the opportunity to introduce and analyze different sustainability solutions in project early design stages [25]. Among the several uses for building sustainability, the integration of LCA/LCC analysis is a growing topic [2,16]. BIM can significantly reduce the efforts of assessing the building environmental impacts in the project phase, allowing for the development of high-performance buildings. BIM characteristics provide great potential to manage the complex and uncertain data from LCA and LCC analysis [12]. Different authors have used BIM to analyze the environmental impacts of different construction solutions, materials, and designs. A review made by Sous-Verdaguer et al. [26] identified the three principal methods used by researchers to integrate BIM and LCA: Life Cycle Inventory (LCI); LCI with environmental data; and automated processes which link different data and software. To carry out such kinds of analyses, a certain level of detail is required for the BIM models. Overall, the LOD 300 has also been identified as the most appropriate to carry out LCA analysis. Typical approaches consist of the collection of LCI data—Bill of Quantities (BoQ)—from BIM to compare the environmental impacts of different solutions in a specific project phase [27]. Nevertheless, Rezaei et al. [28] made a BIM-based LCA analysis capable of acting from the project conceptual stage until the design stage. They highlighted the achieved concise results by applying LCA from the early stages. Likewise, Naneva et al. [8] developed a BIM-based LCA methodology to continuously evaluate the project environmental impacts in each building phase over the entire building process. The methodology has provided a decision support tool for designers and avoided re-work in transferring material data/quantities to LCA tools. With regard to LCC integration, Santos et al. [15] created and validated a prototype to automate BIM-based LCA and LCC. They linked specific environmental and cost data within the BIM model to automatically generate LCA/LCC analysis. Lu et al. [12] also made a similar procedure, using BIM as well as sensitive, uncertainty and multi-criteria analysis to optimize the building design. Alshamrani [14] developed a model for Saudi Arabia dwellings that can perform LCA and LCC analysis from an early design stage and through the building 50-year life span. It offers the possibility to achieve an optimal scenario, considering both environmental impacts and total cost. Going a little further, Figueiredo et al. [29] developed a novel integration for facilitating decision-making. They have used BIM to establish the LCI and then performed a Life Cycle Sustainability Assessment, which has covered environmental, social, and economic issues.
Typically, the building operational stage is usually the most critical when concerning energy and resources demand and, therefore, environmental impacts [13,28]. According to Chau et al. [7], a huge part of the building impact is made during the operation stage, followed by the building structure construction. However, different authors have recognized that the relation between the embodied energy of materials and the operational energy is changing [10,30]. Facing the recent concerns and legislations about building performance, new buildings are being built at high-performance levels, significantly reducing the impacts from the operational phase. This shift has increased the total impact of construction materials up to 40%, raising the need for the selection of more sustainable materials with less embodied impacts [10,31]. Häfliger et al. [32] also recognized the importance of building materials, both to reduce the environmental impacts and to achieve LCA-reliable results, as material uncertainties can have important consequences on the analysis results.
Facing the need to select more sustainable materials, this research aims to provide a decision-making tool for designers to compare the environmental, economic, and functional performance of building construction solutions. To do so, a BIM-based framework for automating LCA and LCC analysis of building construction solutions in project early stages was developed. The framework will be able to estimate the main costs of the project while identifying the most adequate materials to reduce the environmental impacts without sacrificing the building performance. Designers will be able to quickly select the best combination of construction solutions to minimize impacts while optimizing cost and energy performance.
2. Materials and Methods
To accomplish the research goals, a BIM-based framework was developed and applied to a case study. The analysis focused on the building envelope elements, namely on the floors, external walls, and roofs. Different combinations of those elements were be submitted to LCA and LCC simulations, both to prove the concept and to achieve the best construction scenario in terms of global cost, environmental impacts, and energy performance.
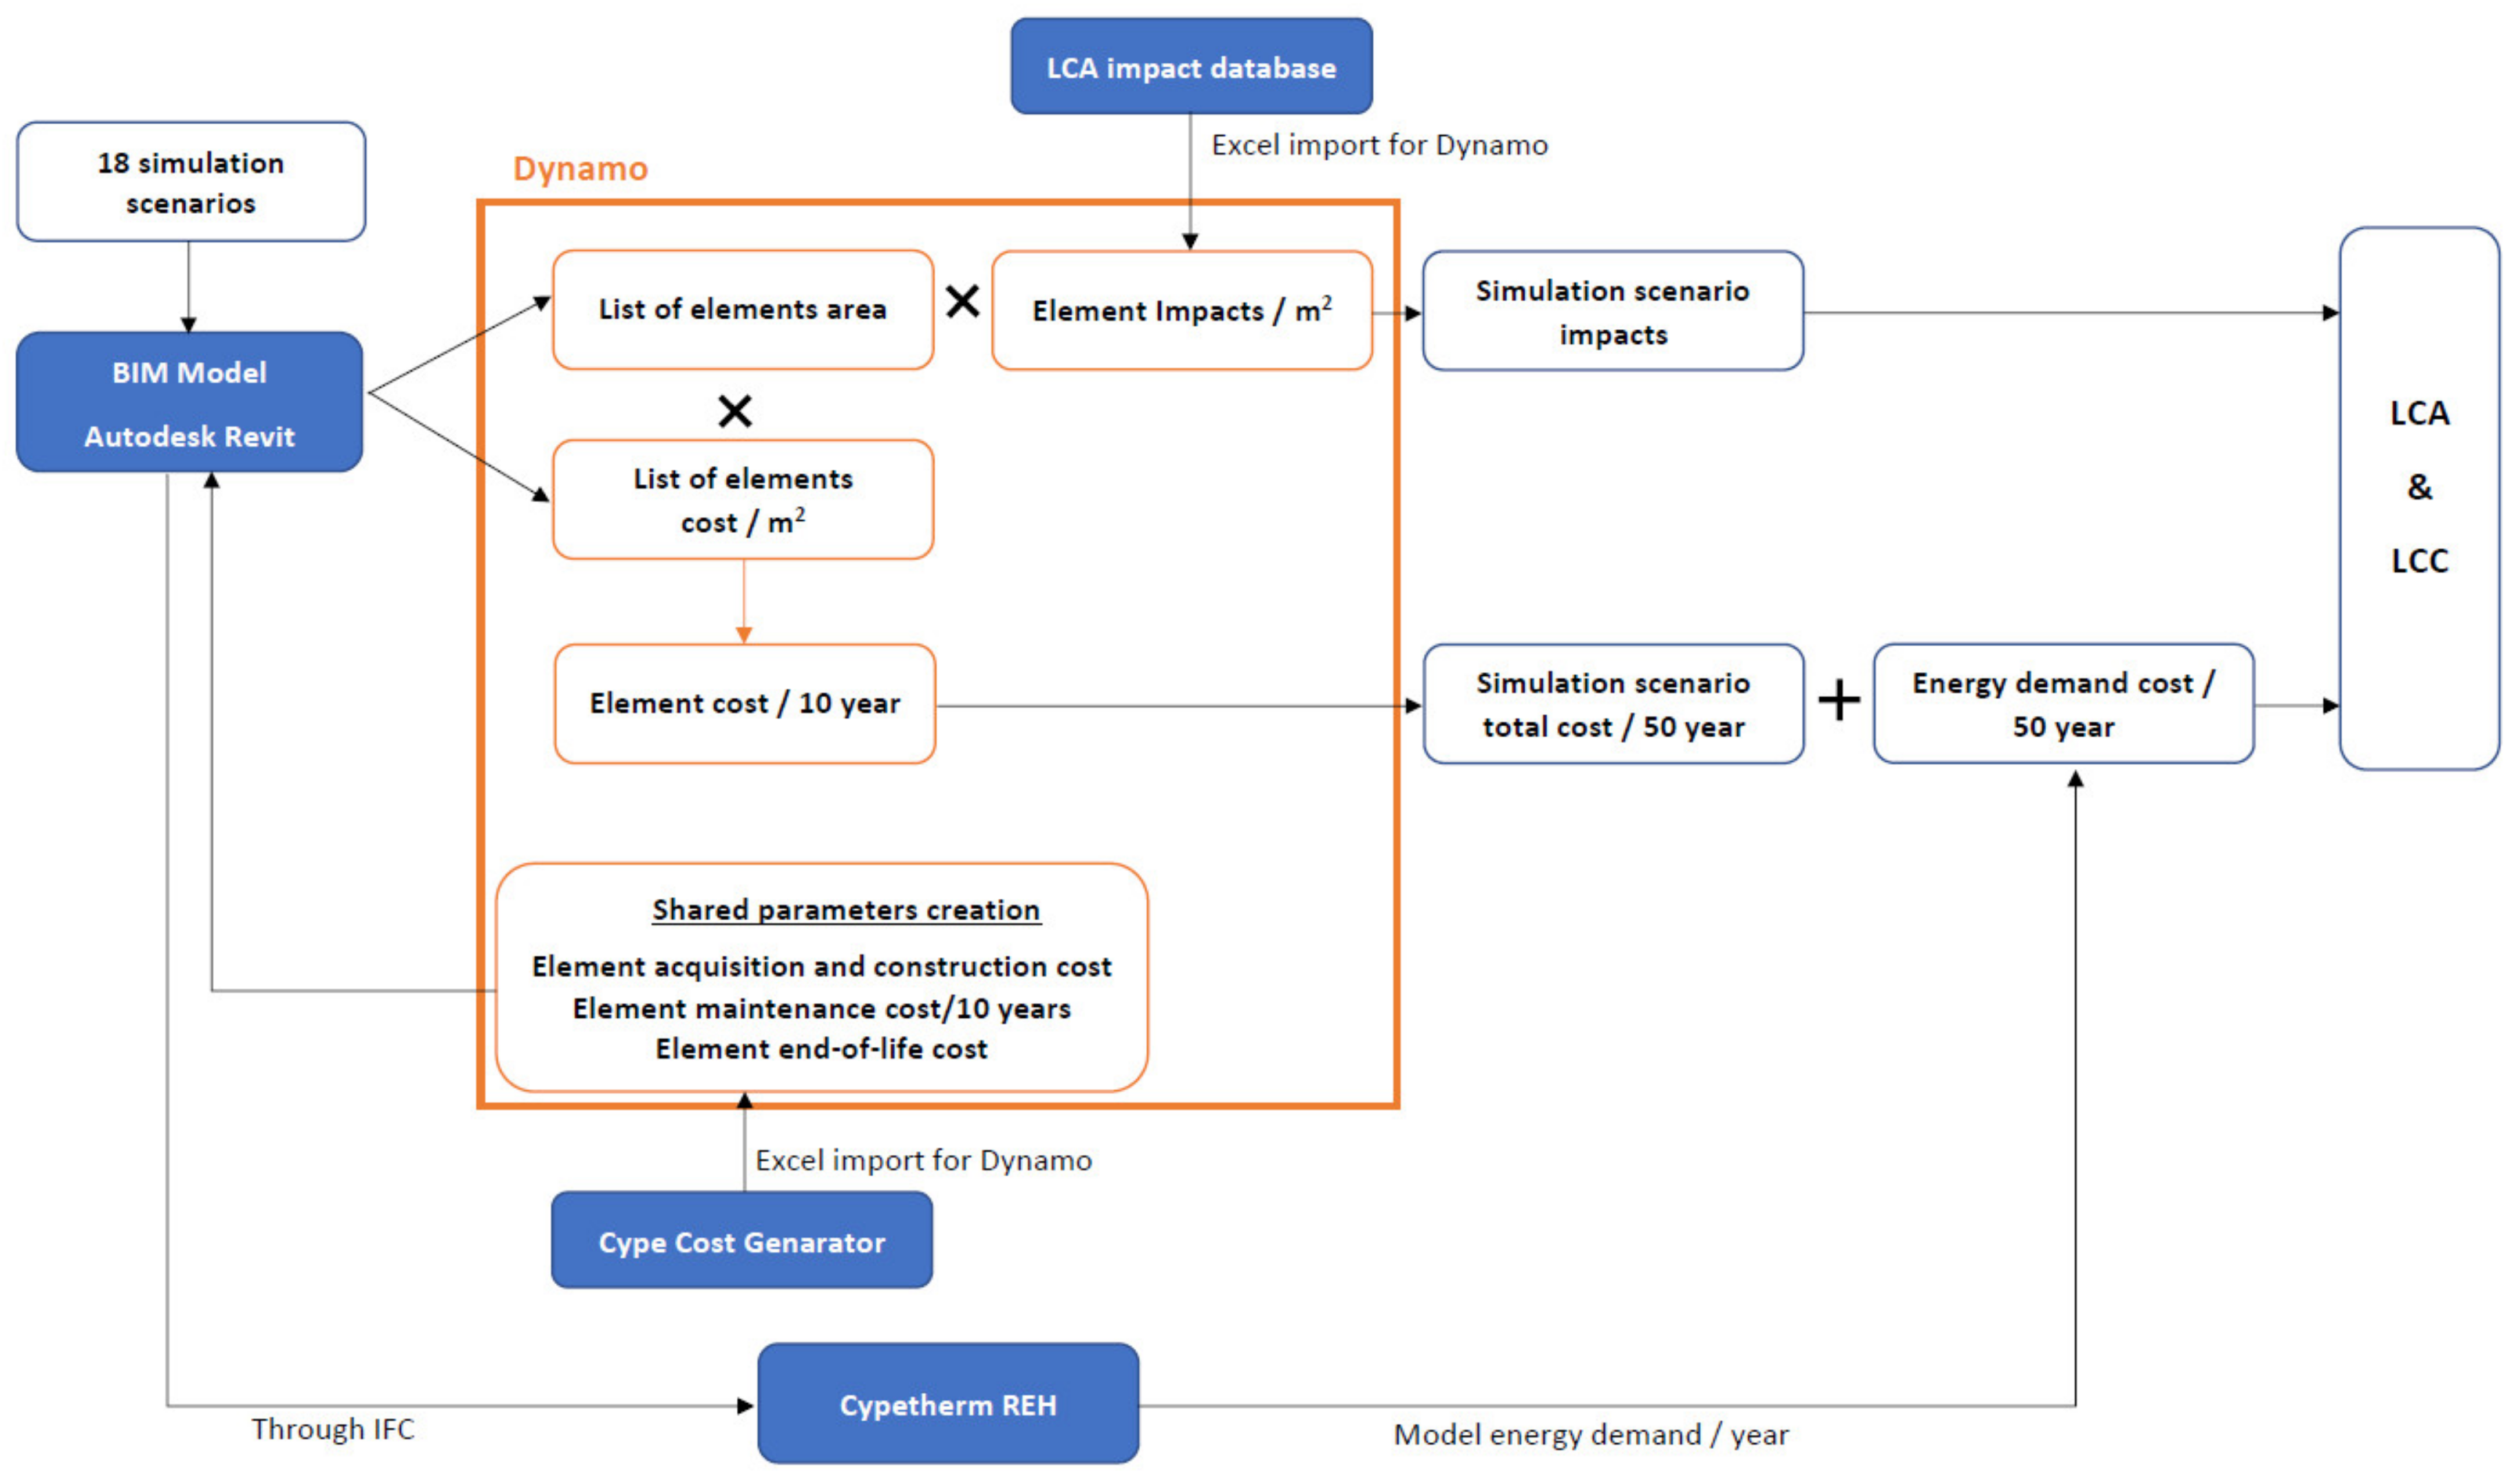
Initially, a BIM model was developed and characterized in Autodesk Revit. This authoring platform was chosen as it is the most used among researchers in the field [16,33]. Simultaneously, different construction solutions for external walls, roofs, and floors were collected and added to the model (Table A2, Table A3 and Table A4 from Appendix A). According to the last building statistics [34], these solutions are among the most used in Portugal. In total, 18 different combinations of building envelopes were analyzed (Table A1, Appendix A). Then, Dynamo was used to create new parameters regarding building elements costs. Dynamo also automated the collection of the elements area and cost through schedules, as well as imported Excel datasheets regarding cost (to support LCC) and environmental impacts (to support LCA). Both datasheets included some key data to perform the analysis and are described in the following sections. Dynamo output was the global building environmental impact and cost per combination. Finally, each combination was submitted to energy analysis to assess the required demand and cost (to support LCC). A final multi-criteria analysis provided the results to select the best combination of construction solutions, which can optimize cost and energy performance while minimizing environmental impacts. The global research methodology is presented in Figure 1.
2.1. Life Cycle Assessment
As stated, Dynamo was used to gather all the building material quantities and impacts, which were used during the LCA and LCC analysis. The LCA analysis was based on EN 15978:2011 and the main scope was to analyze the environmental impact of different building envelope combinations within the Portuguese scenario. To evaluate the environmental impacts, CML 2 baseline was used considering the following life cycle stages: product/manufacture stage, construction process stage, and end-of-life stage. Additionally, the embodied energy was also considered through the Cumulative Energy Demand system. The Ecoinvent system was used to characterize the LCI. The adopted impact categories are: abiotic resource depletion potential (ADP), global warming potential (GWP), ozone depletion potential (ODP), acidification potential (AP), photochemical ozone creation potential (POCP), eutrophication potential (EP), and incorporated non-renewable energy (ENR), as described in Table 1.
Thus, 18 different envelope combinations (Table A1) were submitted for the analysis to assess their environmental performance. The following system boundaries were considered for the analysis:
- The building life span has been established in 50 years, according to the Eurocode EN 1990 recommendations for common buildings (structural class S4);
- The research was restricted to the building envelope elements, namely on floors, roofs, external walls, internal walls and windows (Appendix A). Both the internal walls and windows were kept constant throughout all the simulations, as the goal was to evaluate the envelope opaque elements. Overall, all the materials that constitute the building bulk were considered. Other fixtures and fittings were excluded as they have little influence on the building functional performance;
- The adopted functional unit was 1 m2 of construction solution;
- The product/manufacture stage included the resources extraction and transportation, as well as the product manufacture;
- The considered end-of-life stage was the element demolition, as both the impacts and costs are already well known. The transportation of the demolition waste was also considered (50 km distance).
Finally, to provide a single value to characterize the environmental performance of each solution, an impact weighting system was adopted based on a Portuguese building sustainability assessment method, SBToolPT-H [35]. The system considers the local cultural and environmental aspects to define the weighting percentage for each impact (Table 1).
The environmental impacts were collected and uploaded into Dynamo through datasheets for each construction solution of roofs, external walls, and floors. Dynamo linked those impacts with the respective construction solution within the Autodesk Revit BIM model. Thus, each element environmental performance must be characterized in those datasheets to successfully perform the LCA analysis. This kind of BIM-based integration can be included in the 5th method to link BIM and LCA defined by Obrecht et al. [36]. In this method, the LCA information (presented in the datasheets) is included in the BIM objects through Dynamo, allowing for the assessment of the environmental impacts throughout the project development.
2.2. Life Cycle Cost
The LCC analysis was based on ISO 15686-5 and includes the construction, operation, maintenance, and end-of-life stage. Once again, a life span of 50 years was considered. For the analysis, the building envelope elements costs were considered, as it is intended to analyze the impacts of the envelope opaque elements. The considered costs and justifications for each life cycle stage are presented below:
- Construction stage—Material acquisition and assembly cost, gathered from Cype Cost Generator (Cype GeradorPreços), a platform that includes common construction costs in Portugal;
- Operation stage—As the building envelope greatest impact is related to the building energy demand, the energy performance of each scenario was assessed to identify the annual energy cost. Energy analysis was made in Cypetherm REH software, which complies with Portuguese thermal regulation [36] and ISO 13790:2008. All the scenarios were accomplished with the minimum Portuguese requirements and the building systems kept constant, including heating, cooling, Domestic Hot Water (DHW), ventilation, and renewable energy production. All the energy will be electricity-based and the considered cost for the location is 0.18 €/kWh;
- Maintenance stage—As in the previous LCA analysis, the maintenance stage included the repair of cracks/anomalies, cleaning, and painting. The cost was retrieved from Cype Cost Generator;
- End-of-life stage—The considered scenario was the element demolition, as the impacts and costs are already well-known. Costs were gathered from Cype Cost Generator;
- As the goal is to compare the cost and performance of different scenario combinations, the interest rate was not considered (which would be the same for all the scenarios). However, the authors recognize the importance of the interest rate when performing a concise and reliable LCC analysis;
- Costs and prices are presented in euros (€).
All the costs of each element were organized by the life cycle stage into an Excel datasheet. As in the LCA analysis, the datasheet was uploaded through Dynamo and assigned to the respective element in the BIM model to characterize its price and global cost.
2.3. Case Study
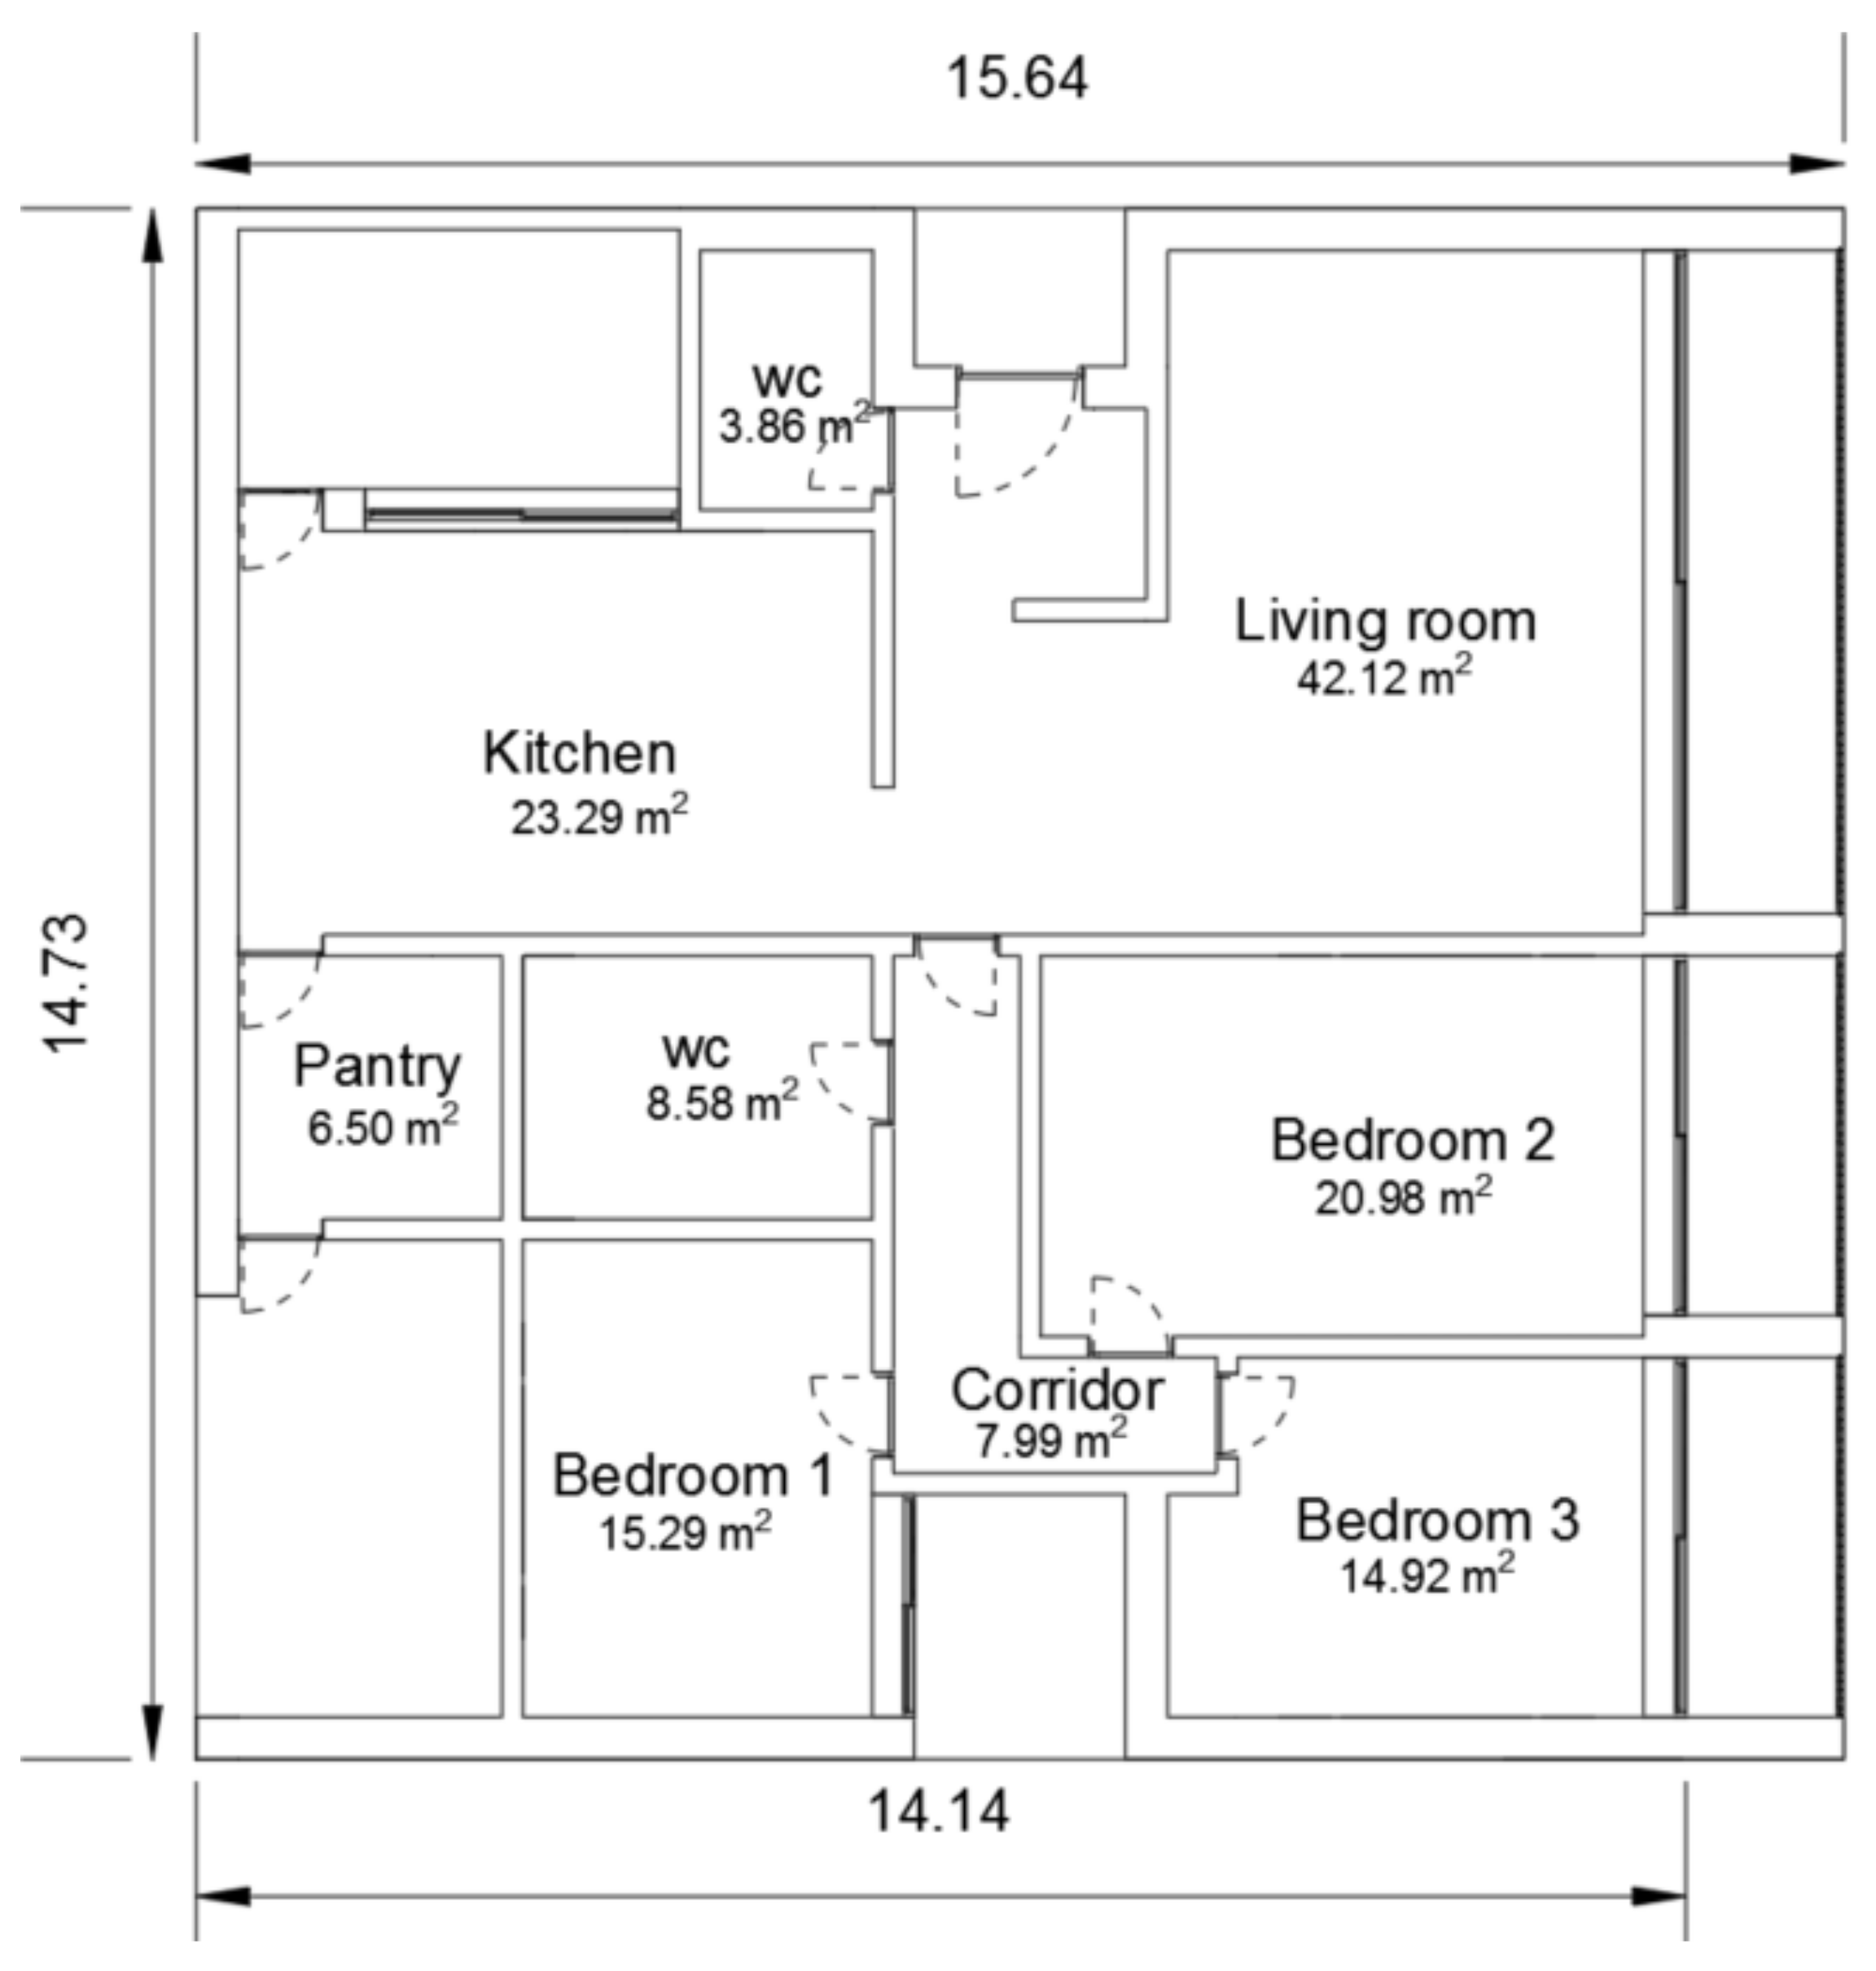
The selected case study was a one-level residential building located in Porto, Portugal. It has some of the most representative characteristics of new Portuguese dwellings [34]—detached single-family house with 3 bedrooms, an average of 150 m2 of net floor area and 46 m2 of glazed area (Figure 2).
The building was characterized by different construction solutions for the external walls, floor, and roof. A total of 18 different simulations scenarios (SS) were submitted to the BIM-based framework, as presented in Table A1 from Appendix A. Each scenario resulted from the combination of 3 external wall types, 3 roof types and 2 pavement types. All of them are presented in Table A2, Table A3 and Table A4 from Appendix A, as well as their construction, maintenance, and demolition costs. All the remaining building characteristics were kept constant, including the internal walls and windows (Table A5, Appendix A).
3. Results
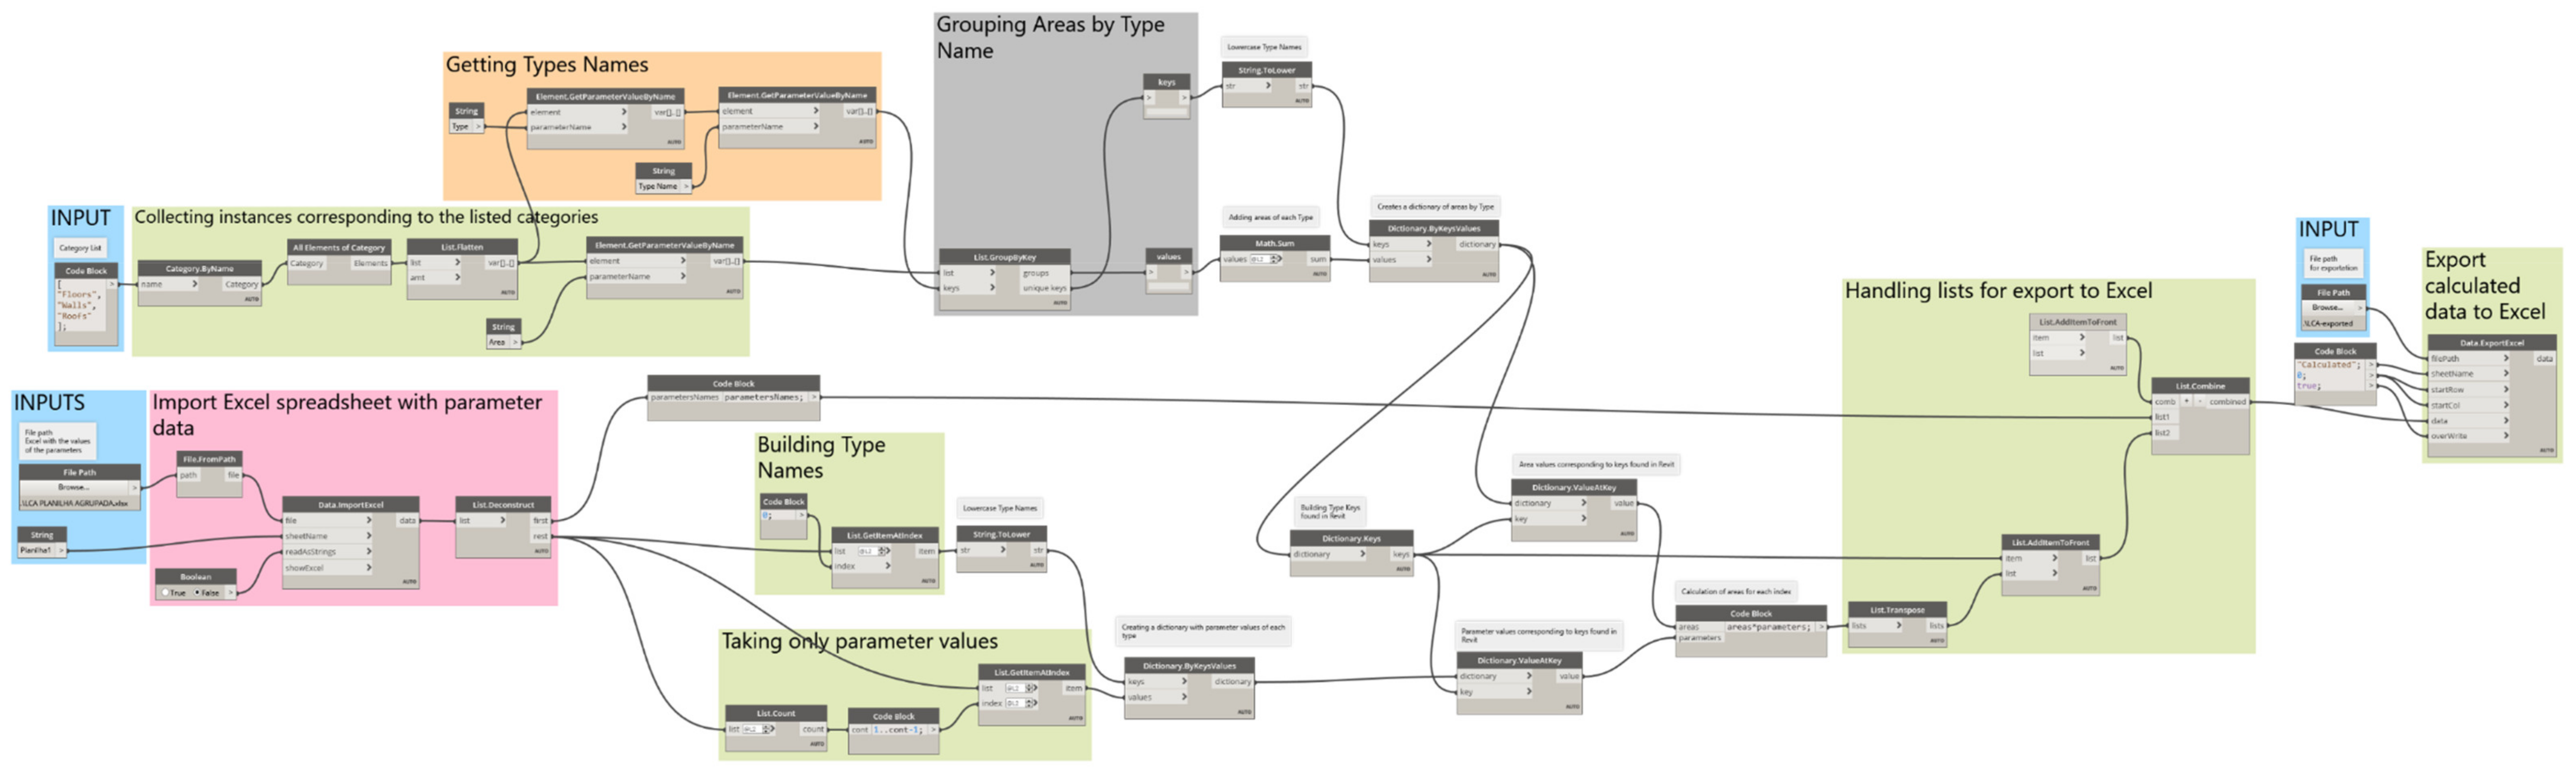
In order to accomplish the intended goals, first, a BIM model representing the case study was created in Autodesk Revit. The model was then characterized with all the construction solutions under analysis to achieve a total of 18 different envelope scenarios for the building. Next, Dynamo was used to introduce new shared parameters to the building elements (external walls, roofs, and floors) regarding their life cycle costs. An Excel import function was used to upload a spreadsheet with all the elements costs (acquisition, construction, maintenance, and demolition) from Cype Cost Generator. Simultaneously, Dynamo was also used to automatically extract the elements area (Bill of Quantities) through schedules. Then, each scenario cost was assessed by multiplying the elements area per the element’s costs imported from Excel. The Bill of Quantities was also used to achieve each scenario’s total life cycle impacts. A similar procedure to cost was used, by uploading to Dynamo an Excel spreadsheet with the elements life cycle impacts to be multiplied by the elements BoQ. Elements impacts were based on a local database [37] and grouped in an Excel spreadsheet. Note that in both uploaded Excel spreadsheets, the elements impact and cost must be associated with a same-identity material in Autodesk Revit. Otherwise, Dynamo would not be able to link the uploaded impacts and costs with the respective BIM model element. The developed Dynamo routine is presented in Figure A1.
Dynamo output was an Excel spreadsheet with each scenario life cycle impact (ADP, GWP, ODP, AP, POCP, EP and ENR) and cost (acquisition, construction, and demolition cost). Table 2 presents an example of Dynamo output for Simulation Scenario 1 (SS1). Dynamo framework generated an identical table for each simulation scenario.
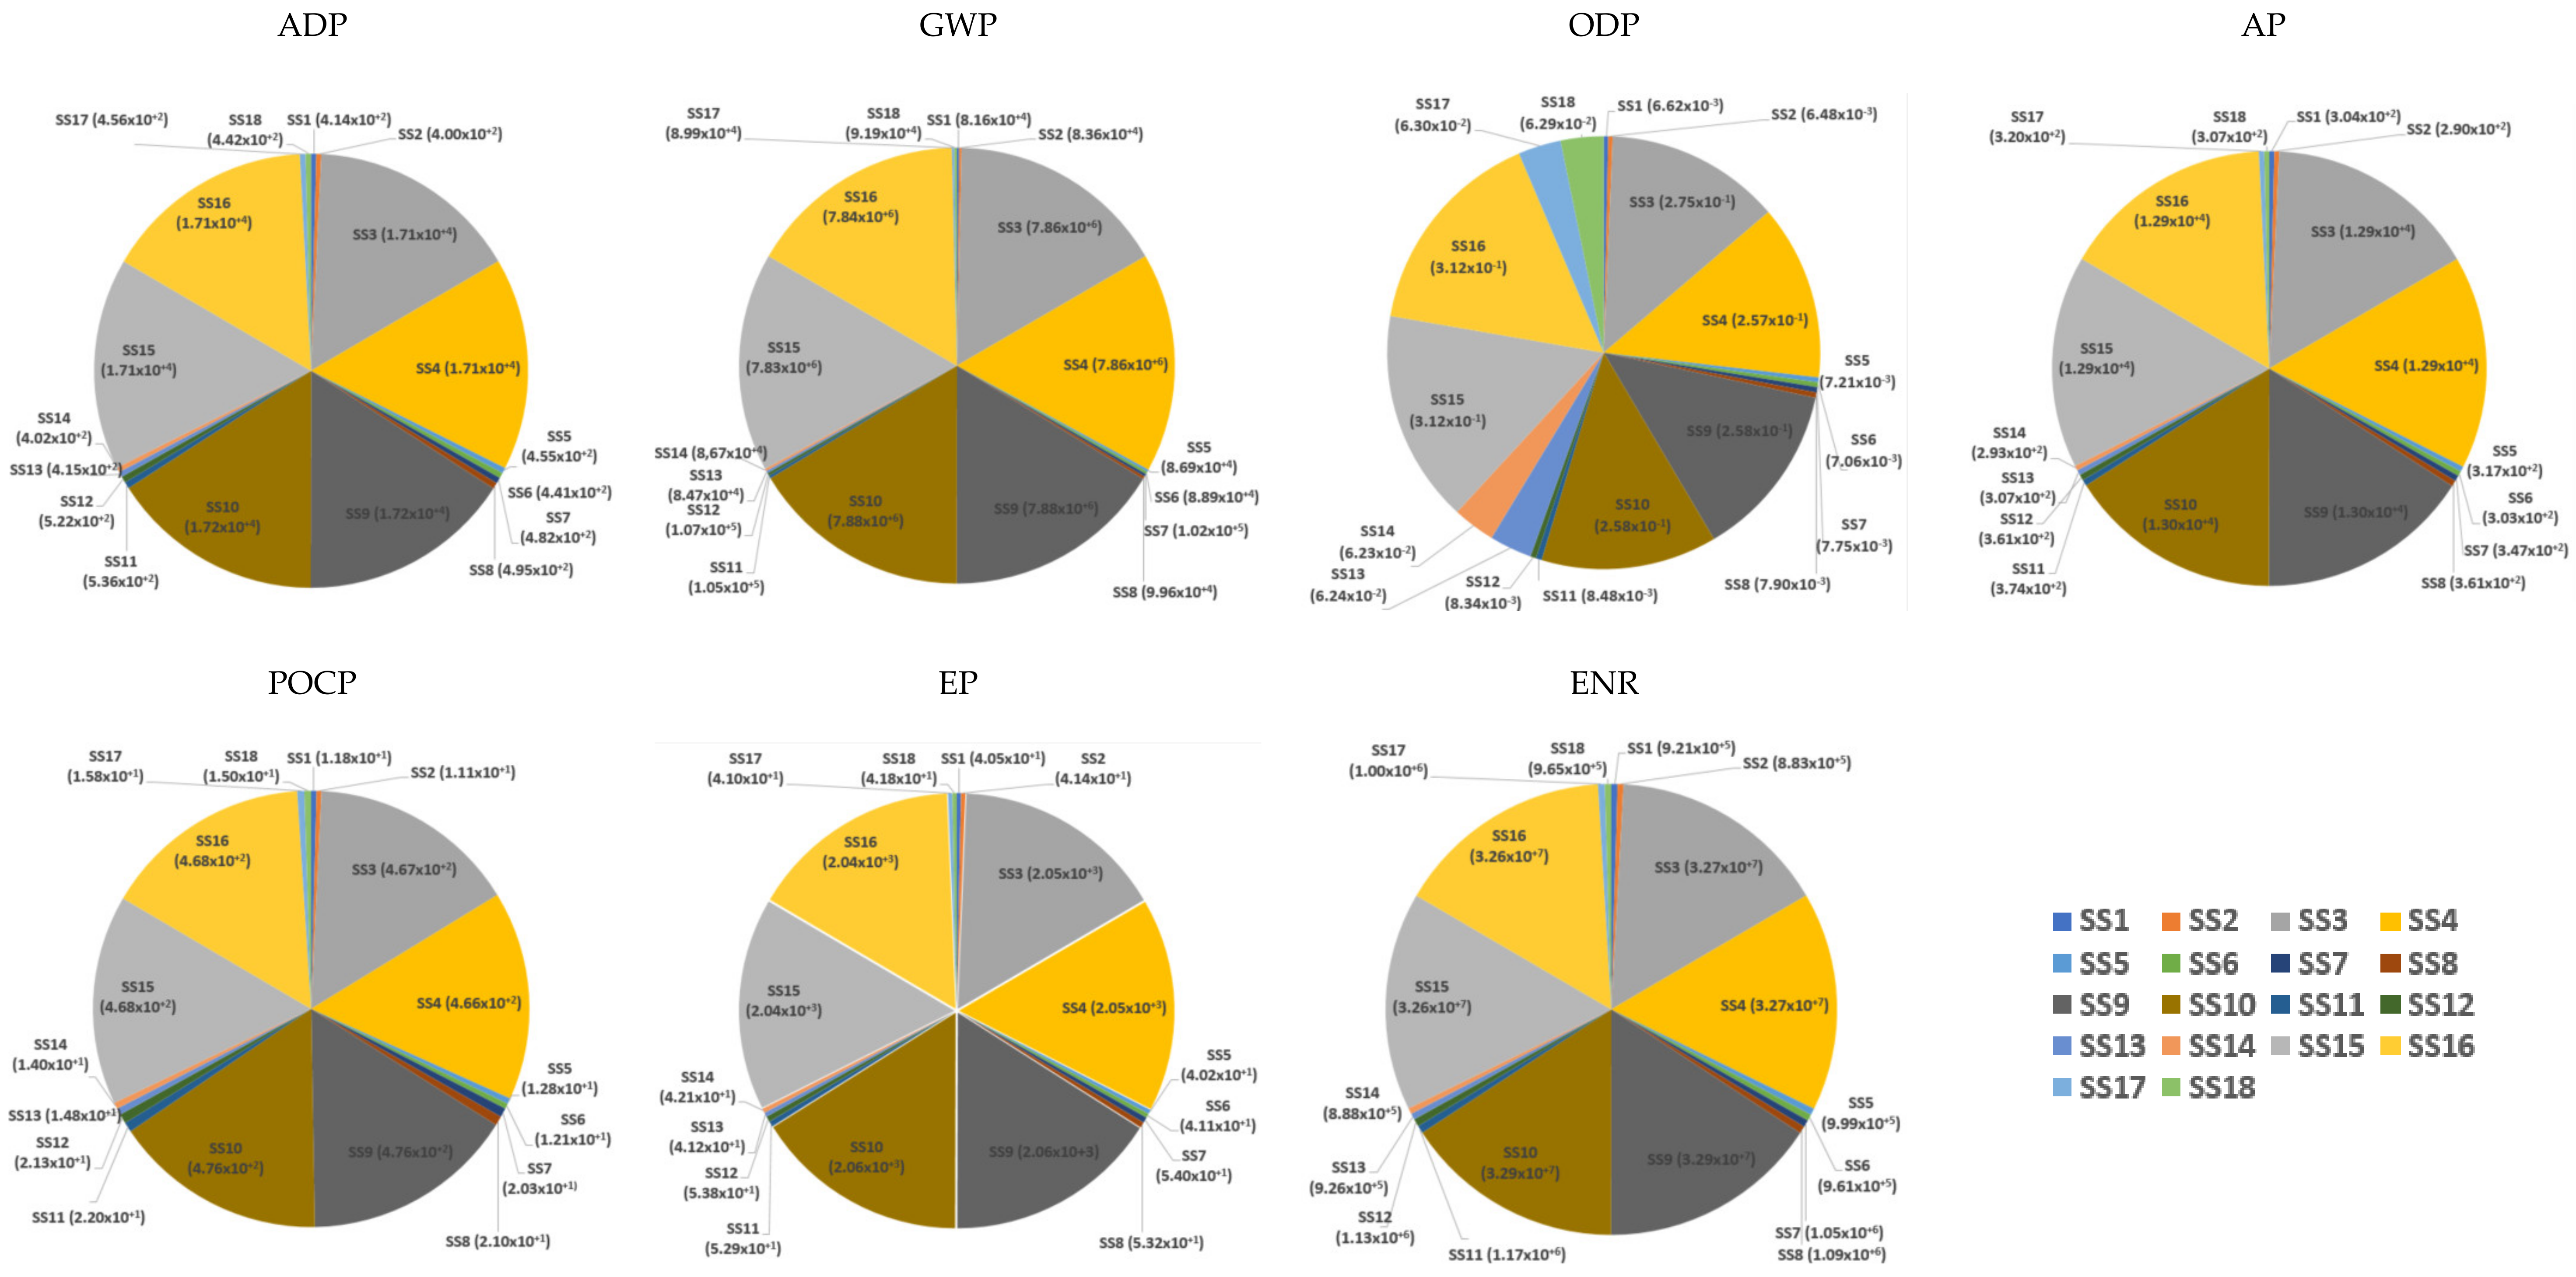
The LCA results for each scenario have been grouped and are presented in Table 3 and Figure 3. To calculate the final global value, a percentage has been given to each impact, considering that the worst solution has a 0% score, resulting from the application of Equation (1) for each simulation scenario. Thus, to the higher impact, a 0% value has been given, while for the others a relative percentage has been calculated based on this value. Thus, the lower impacts have a higher percentage, and the higher impacts have a lower percentage.
After calculating all the percentages for each impact of each simulation scenario, the weighting system from Table 1 was applied to determine the final global score, which can characterize the environmental performance of each scenario on a percentual scale. Once again, the higher percentage corresponds to the scenario with lower impacts. Globally, results show that SS2 presents the lower environmental impacts, while SS15 presents the worst environmental performance. Also note for the significant difference between the best and worst scenarios, with differences over 80% on the building environmental performance.
Regarding the LCC analysis, the building operation phase should also be considered for a complete evaluation. Thus, each simulation scenario was exported by IFC to Cypetherm REH, an energy performance simulation software that takes into consideration the Portuguese thermal regulation. Only the energy cost was considered for the LCC analysis operation phase, as this is where the building envelope can have a significant impact. Cype software contains a plug-in for Autodesk Revit to optimize the interoperability between them. Despite the plug-in usefulness, building materials were not properly imported, and it was required to define them again in Cypetherm REH. Overall, the building geometry and identity data were successfully transferred. By combining the different elements solutions, once again, the 18 simulations scenarios were submitted to energy analysis to assess the energy demand from each one (all of them according to the Portuguese thermal regulation). During the simulations, all the remaining parameters were kept constant, including:
- Building location;
- Building orientation;
- Building systems efficiency (heating, cooling, DHW and renewable energy);
- Electricity as an energy source for the heating, cooling and DHW systems;
- Building ventilation rates for winter (0.4 ach) and summer (0.6 ach);
- Building windows, doors, and internal walls characteristics;
- Simulation thermal parameters.
The energy simulation results for each scenario were multiplied by the current electricity cost in Porto—0.18 €/kWh—to assess the energy annual cost to operate the building. The annual cost was multiplied by 50 years to accomplish the analysis life span. Since the energy analysis must be made outside Autodesk Revit, this data was not included in Dynamo routine and, therefore, it was manually added to the LCC data.
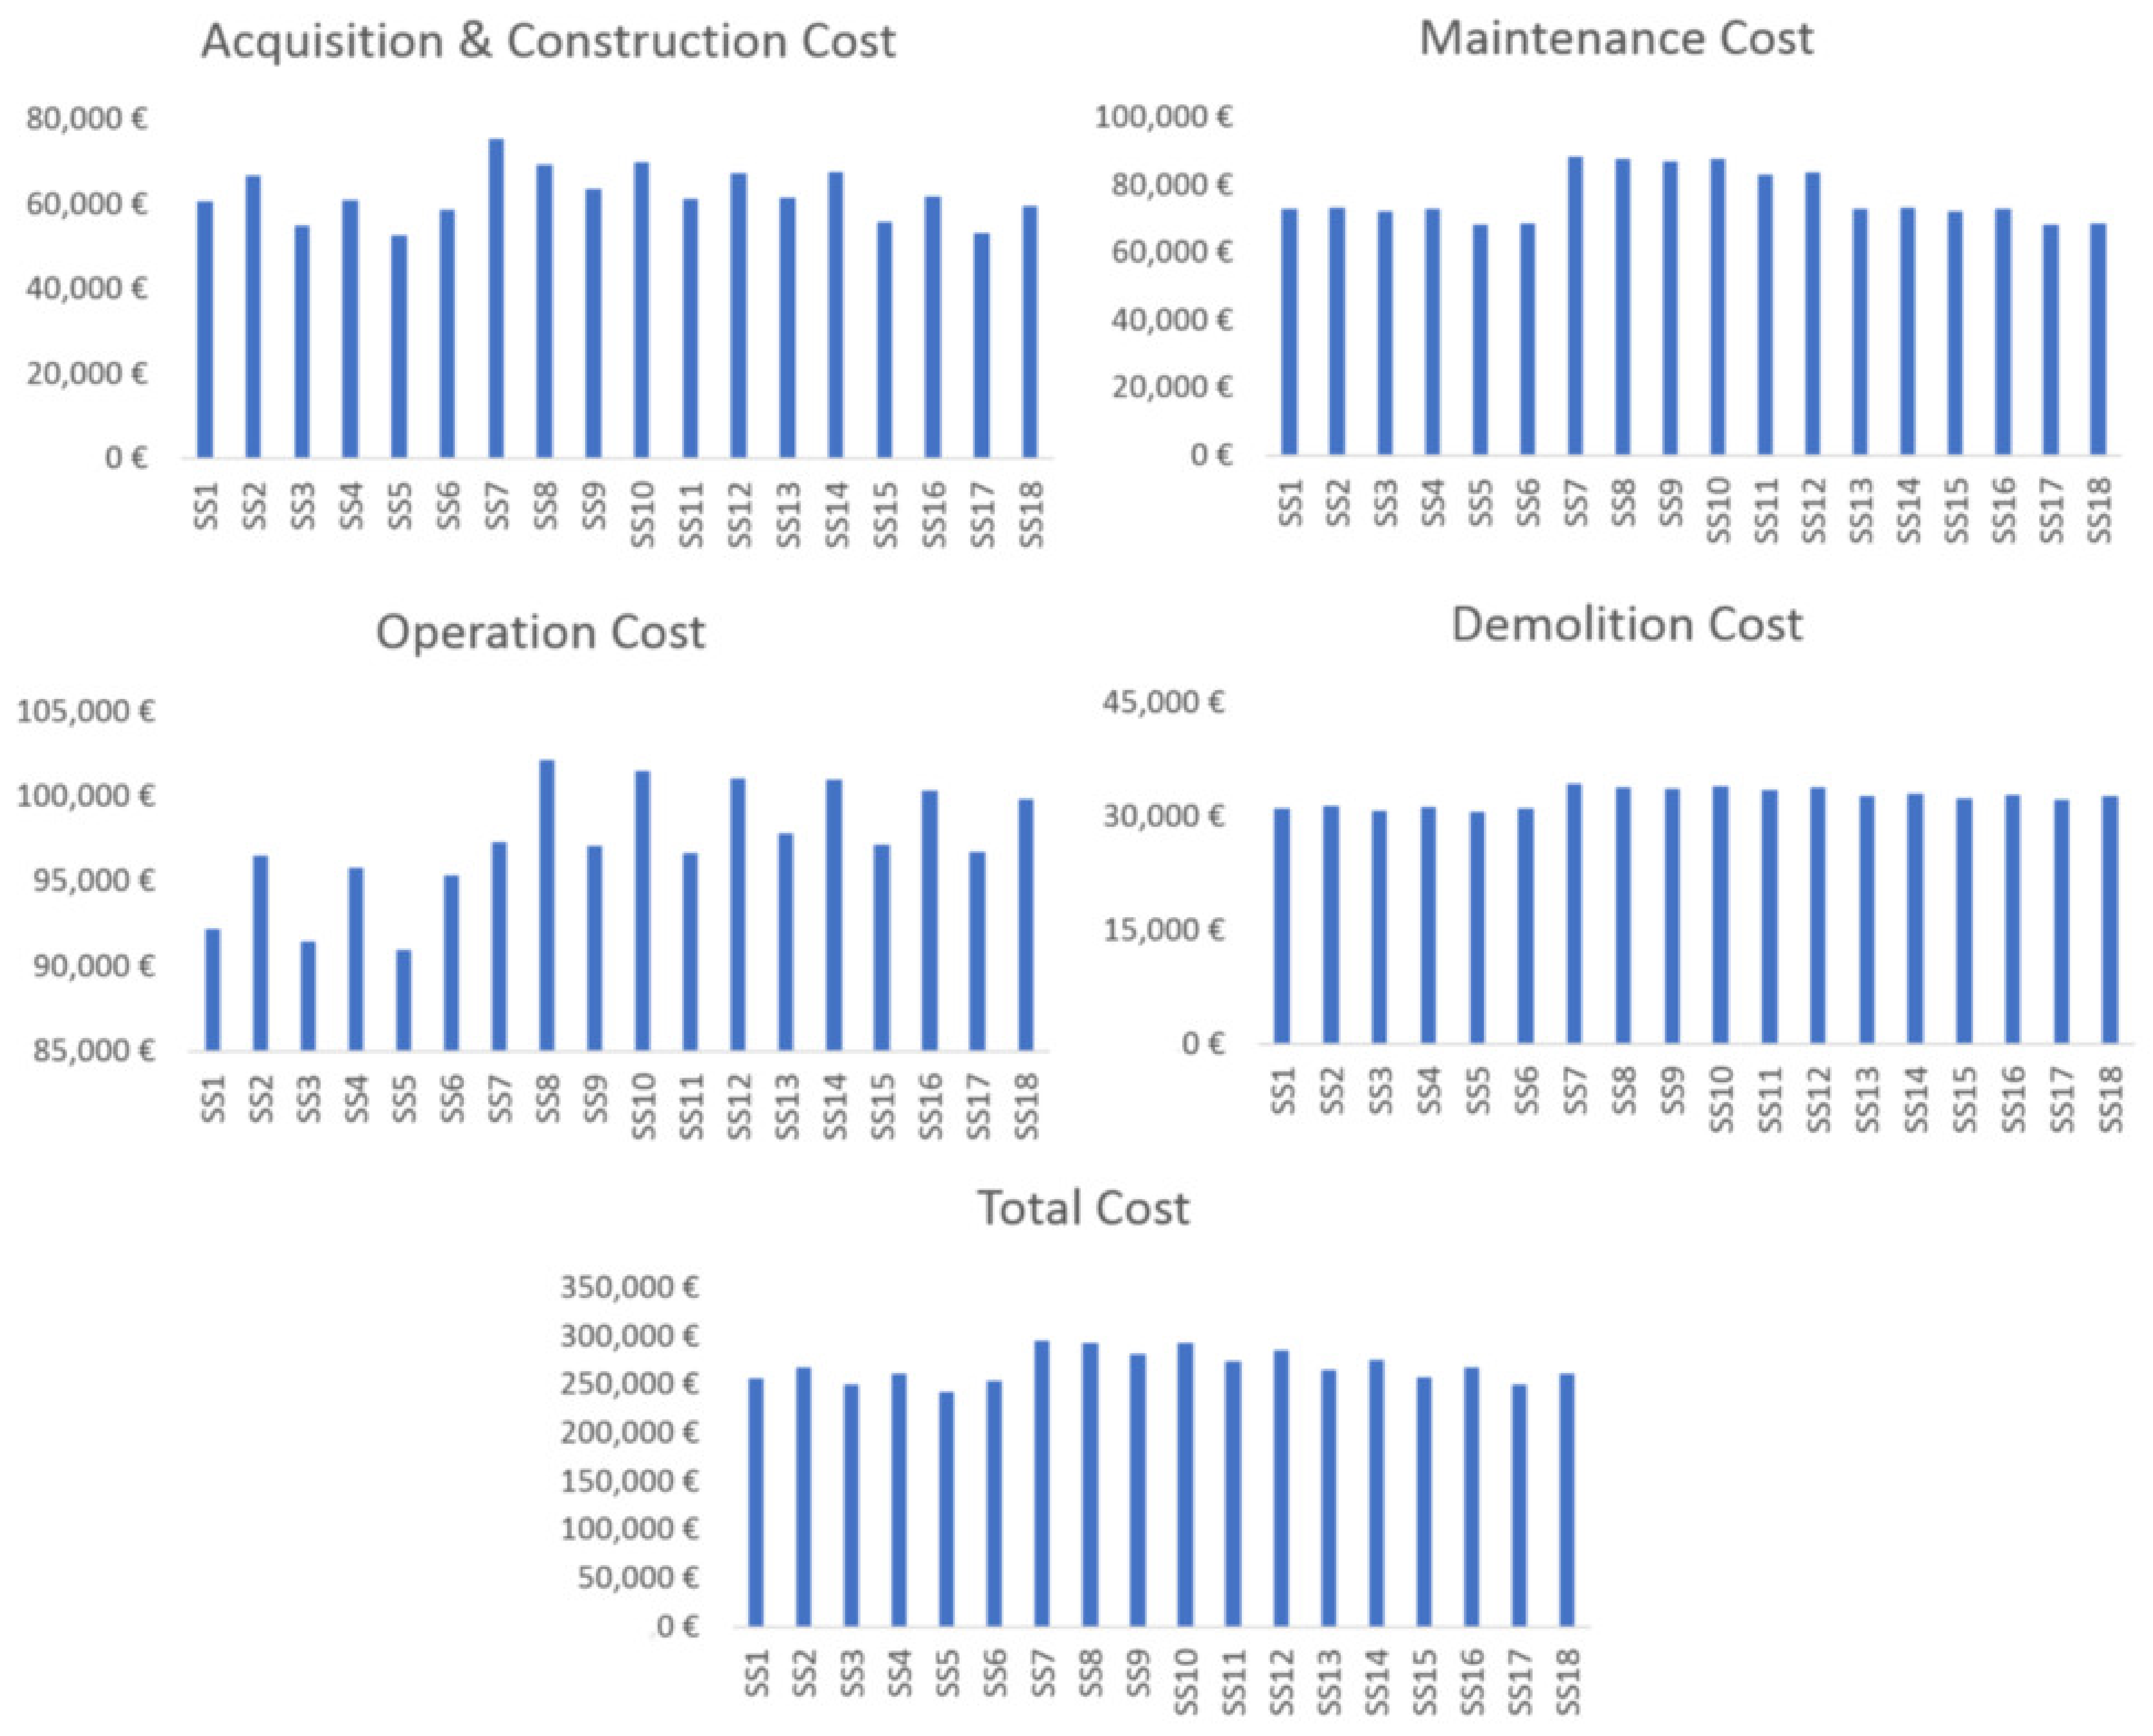
Once again, to create a common and reliable comparison method, a 0-value percentage has been given to the most expensive scenario, using Equation (1). Based on that value, the relative percentage of the other scenarios was determined. Similarly, as the LCA analysis, the higher percentage corresponds to the lower cost. The LCC results are presented in Table 4 and Figure 4 and Figure 5, where it can be noticed that SS5 has the lower life cycle costs, while SS7 has the higher costs.
Combining both LCA and LCC results, Table 5 presents the global LCA and LCC scores of each scenario, as well as their final score when considering a 50%-50% importance for both analyses. Overall, SS5, SS6 and SS17 present the higher ranks, while SS10, SS9 and SS16 present the worst classification.
4. Discussion
LCA results show a significant variance among the considered simulation scenarios. Twelve of the eighteen scenarios reached a total score of over 96%, while the remaining six scenarios were below 1.67%. By analysing Figure 3, those six scenarios (SS3, SS4, SS9, SS10, SS15 and SS16) had the worst performance in all the considered impact categories. When considering the magnitude of the results, the impacts of the remaining 12 scenarios are almost insignificant when compared to the worst 6 simulation models. This difference is enhanced for the GWP impact, while it decreases for the ODP impact. By identifying the elements of those six worst scenarios, it has been noticed that R2 is a common element among them. Thus, the major difference lies in the materials of R2, which have a higher global impact than the other roof solutions (especially on the GWP impact). By investigating the differences among the considered roofs, the higher impacts should be justified by the roof finishing solution (hydraulic tile for R2), as all the considered roofs have a similar support technique.
When concerning the ODP impact category, besides the worst six scenarios, also SS13, SS14, SS17 and SS18 showed a considerable impact. Once again, by analyzing the common elements among them, EW3 has been highlighted. The reason behind this concerns the higher material mass/quantity of EW3 when faced with the other construction solutions, two support panels (bricks), while the other solutions only have one support panel.
Overall, with the LCA analysis, it was possible to quickly identify a total of 10 high-impact scenarios: SS3, SS4, SS9, SS9, SS10, SS13, SS14, SS15, SS16, SS17 and SS18. Moreover, SS9 had the worst performance in ADP, AP, POCP and ENR, SS10 in GWP and EP, and SS15 in ODP.
On the other hand, SS2 has reached a global score of 98.19, followed by SS1 (98.15) and SS6 (98.07). The identified common element among the three best scenarios is EW1, which has proved to be a less impact solution for external walls; it has less mass than EW3 and fewer impacts than EW2 (due to less use of cement and efforts on the end-of-life scenario). Both SS2 and SS1 also share element R1. SS2 has also achieved the highest score in ADP, ODP, AP, POCP and ENR, while SS1 had the highest score in GWP and EP impacts. However, the differences between the eight best scenarios ranged below 0.64%, creating the need for another criterion when selecting the most adequate scenario for the building life cycle.
Therefore, the LCC analysis stands out, where SS5 represented the scenario with lower life cycle costs, followed by SS3 and SS17, respectively. Both of these scenarios share elements EW1 and F1 (which are the less expensive construction solutions). The most expensive scenarios concerned SS7, SS8 and SS10. All of them have EW2 as an external wall element. The construction and maintenance cost of EW2 during the building life cycle period represents the most significant expenses. This was an expected result, as it is more expensive to build and maintain a concrete wall than a masonry wall.
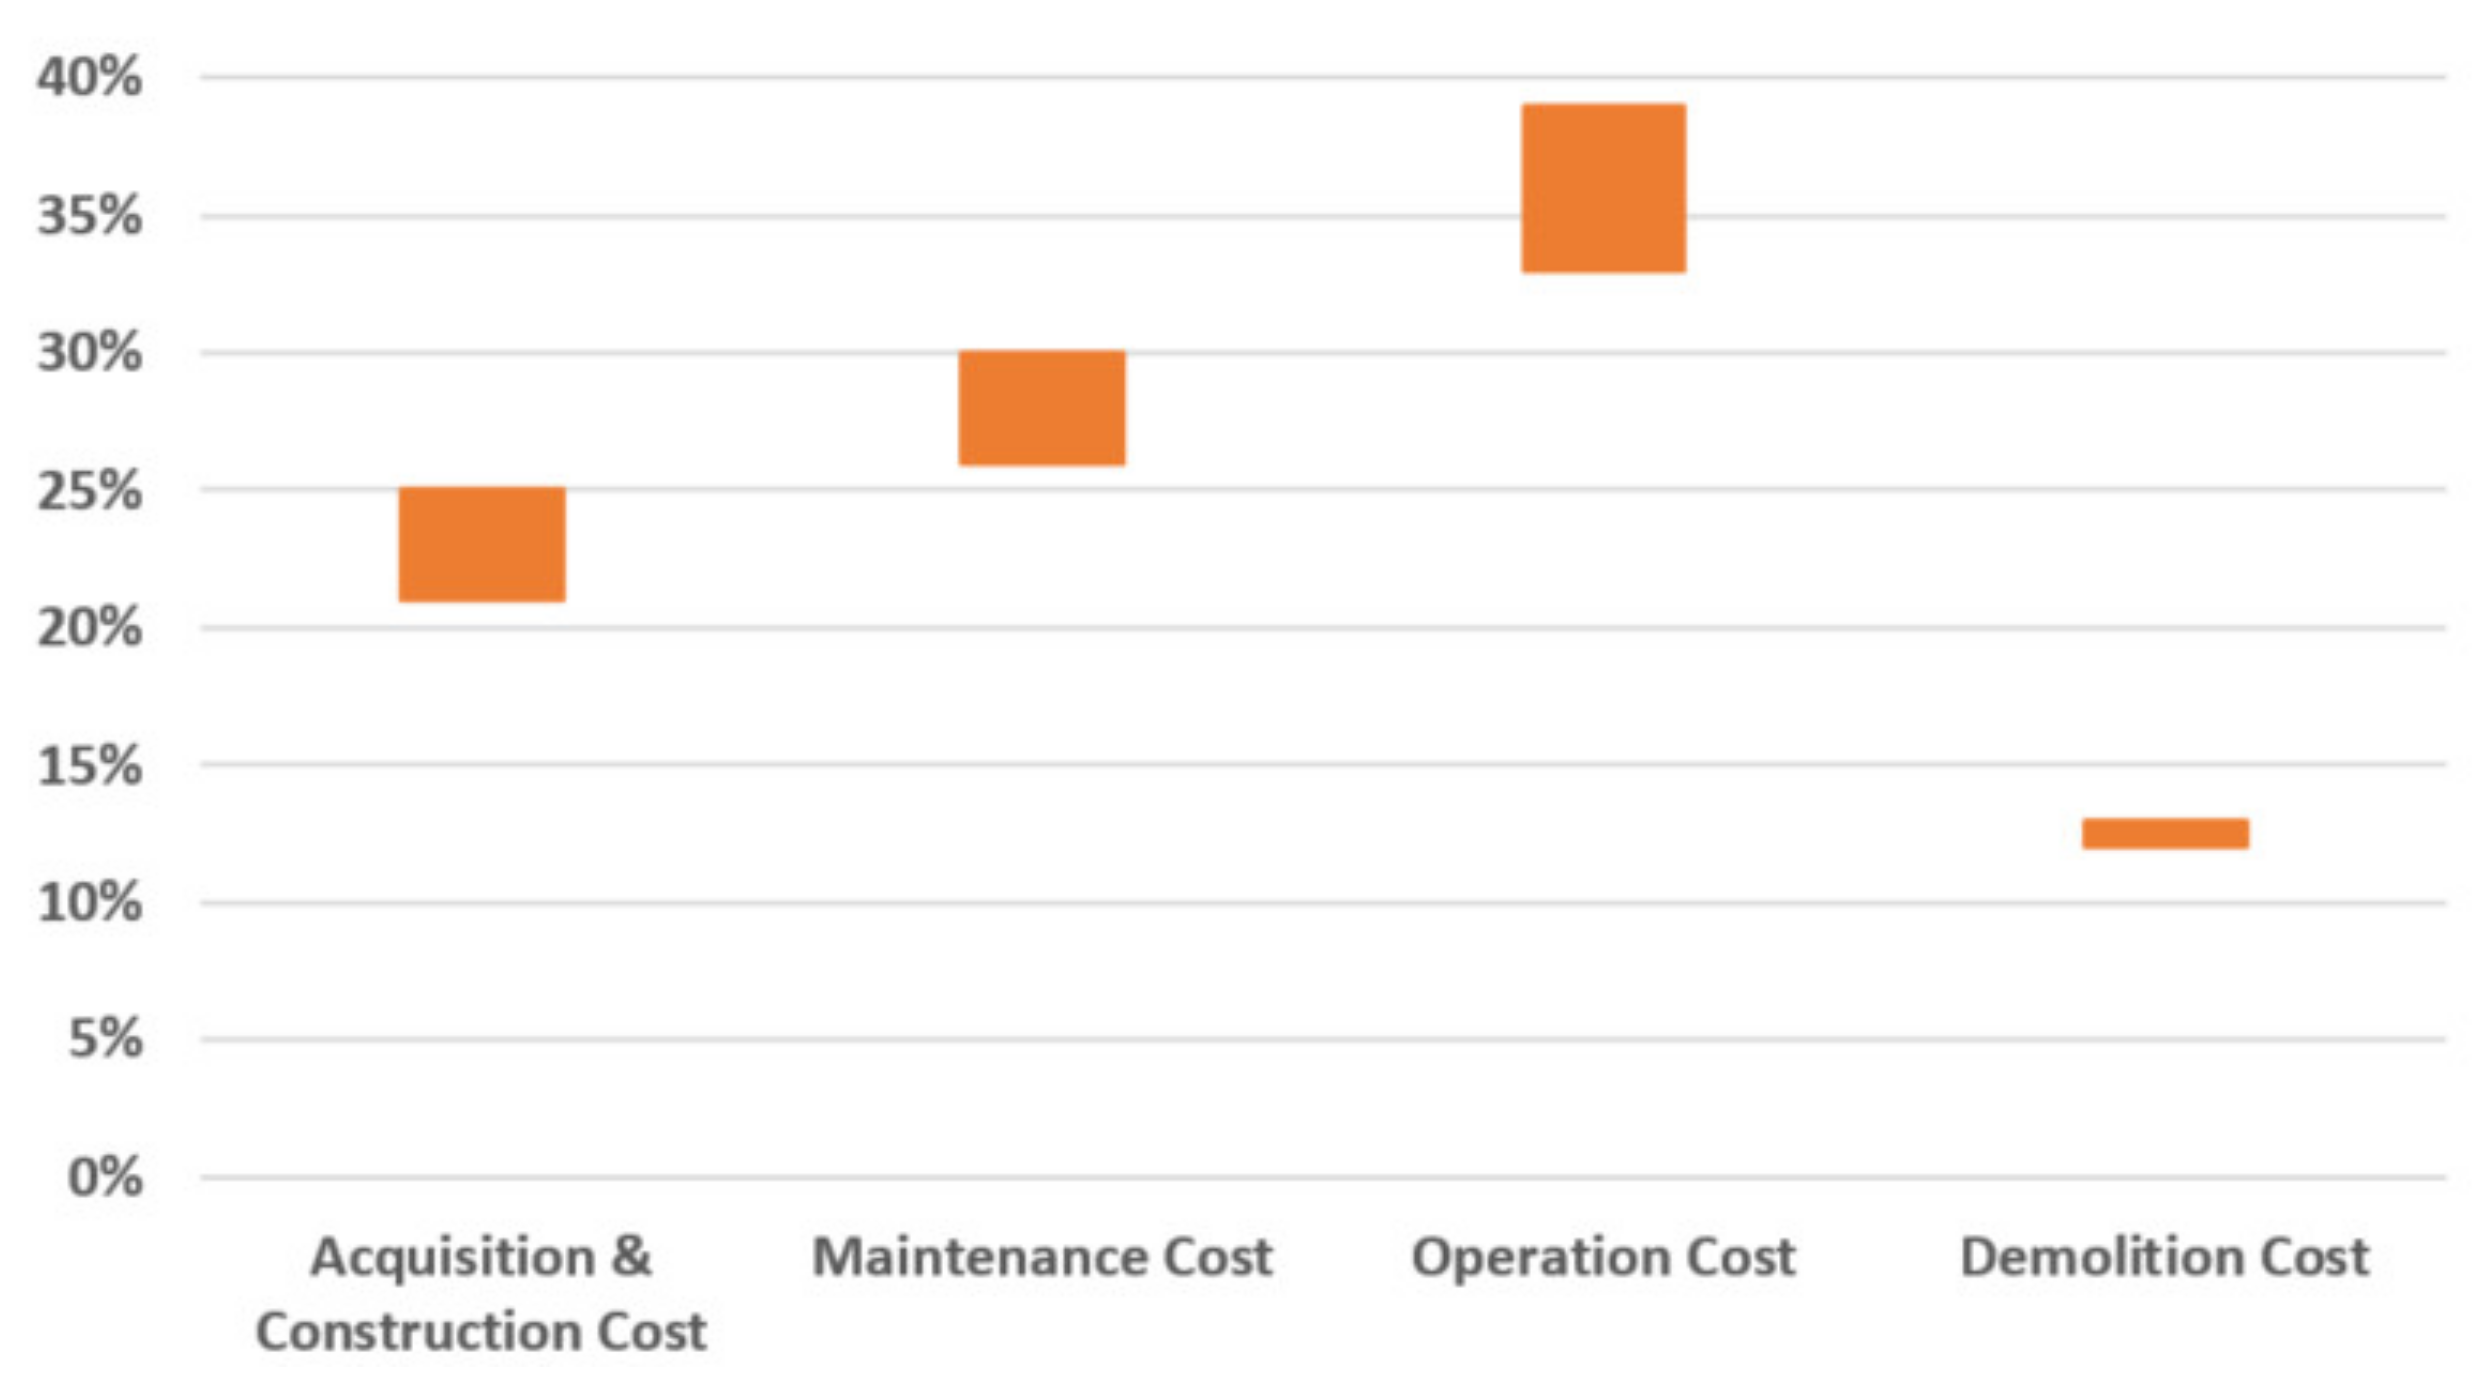
When analyzing the results of variation per life cycle stage (Figure 4), all the considered scenarios had an acquisition/construction cost between 21% and 25% of the total life cycle cost. The maintenance cost ranged between 26% and 30%, while the operation cost ranged between 33% and 39%. The demolition cost was identical for all the scenarios, representing 12% to 13% of the building life cycle cost. When concerning to the analysis per life cycle stage (Figure 5), SS5 had the lower cost during the construction, demolition, and operation phases and SS17 during the maintenance stage. Globally, the first six scenarios (SS1, SS2, SS3, SS4, SS5 and SS6) were usually cheaper in all the building life cycle stages, as they present less mass and material. On the other hand, the higher costs during the construction, maintenance, and demolition life cycle stages belong to SS7, while SS8 had the highest operational cost. Moreover, all the simulation scenarios with EW2 (SS7, SS8, SS9, SS10, SS11 and SS12) had higher maintenance and demolition costs. This result was somehow expected, as it is more expensive to maintain and demolish concrete than masonry walls. Finally, all scenarios with element F2 (SS2, SS4, SS6, SS8, SS10, SS12, SS14, SS16 and SS18) had significantly higher costs during the operation stage when compared with the remaining scenarios. This fact is justified due to element F2 being less thick as compared to element F1, resulting in a reduced thermal resistance.
Overall, the LCC analysis reveals that both the maintenance and operation stages are the main contributors to the building life cycle cost, where expenses are more significant. Furthermore, the results also show that as acquisition and construction costs increase, operation costs tend to decrease, which can be related to the building mass and thermal inertia. By using construction solutions with higher mass, thermal inertia is enhanced, as well as the building energy performance.
When combining LCA and LCC results and giving the same importance to both (50%-50%), the most effective scenario is SS5, followed by SS6 and SS1. SS5 has reached the best score in the LCC analysis (2.44% more than the second most effective) and it is only 0.12% below the best LCA scenario. Despite the use of the most expensive roof (R1), both the external walls (EW1) and floor (F1) have lower acquisition, construction, maintenance, and demolition costs. On the other hand, SS10 and SS9 seem to be the worst scenarios when considering the combination of LCA and LCC results. Both achieved poor scores in the LCA and LCC analysis. This was mainly due to the higher impacts of element R2, as well as due to the higher costs of element EW2.
Regarding the applied BIM-based procedure, several advantages can be identified. First, the framework can be included in common BIM processes, encouraging designers to integrate LCA and LCC analysis into their project’s early stages. Thus, the typical stage of performing LCA/LCC (project later stages) can be made ahead, enhancing the benefits of such analysis. The presented framework is also able to automatically and accurately collect all the project quantitative data from a concise BIM model. It reduces the complex procedure of collecting and processing the building data for the analysis. Together with the automation of repetitive tasks (as material schedules creation or impacts quantification), it can significantly reduce errors and time when performing LCA and LCC analysis. Within the framework, the model LOD has little importance, as most of the material parameters and data are introduced through Excel spreadsheets linked to Dynamo (as environmental impacts and costs). The only requirement concerns the model geometry and elements characterization, which must be made before any analysis.
Overall, the framework provides a reliable and fast method of assessing the environmental impacts, costs, and performance of different construction solutions, allowing for the development of buildings with more sustainable materials. Designers can quickly compare the life cycle impacts and costs of different building elements/envelopes. Additionally, the results of this method are also in line with the sustainability assessment method SBToolPT-H, allowing for the assessment of 3 out of 25 criteria [27,38].
Nevertheless, the method still has some limitations. The framework is limited to Autodesk Revit 2019 use (and above versions). However, Autodesk Revit interoperability capacities allow importing a wide range of different data from other software. Another limitation is that the framework is only able to perform the analysis of one building envelope at a time. Dynamo routine only performs individual analysis of each scenario, creating the need to manually group the results of different solutions to carry out a comparative analysis. Otherwise, it can reduce the analysis to just a couple of different building elements. The framework also requires uploading Excel spreadsheets with the material/element environmental data and costs. The data of those spreadsheets must be properly organized and identified, for Dynamo successfully links them with the respective BIM model material/element. Thus, every time a different material is added, its information must be also added to the spreadsheet. If a material database is created this task can be avoided. Still, this limitation enhances the possibility for the method replicability, as designers only need to create their datasheets with local materials and upload them into Dynamo.
Regarding the research boundaries, this study was applied to the Portuguese context, with local environmental impacts and costs, but it has great replicability potential. Different end-of-life scenarios must also be considered for the analysis. This study has adopted a demolition scenario for the end-of-life, as the costs are already well known. Future research should embrace new innovative, efficient, and sustainable end-of-life scenarios, such as disassembly, reuse and/or recycling.
5. Conclusions
The current concerns about environmental impacts are pushing buildings to become more efficient and sustainable. With the release of more strict energy regulations, buildings are operating even more efficiently, shifting part of the operational life impacts to the product and construction phase. Facing the need to select more sustainable and low-embodied energy materials, this research has created a BIM-based framework for designers to assess the life cycle environmental and economic impact of their construction solutions. It provides an easy-to-use method for the project early stages to enhance building material sustainability. By combining environmental, cost, and functional performance, it allows for analysis of the life cycle influence of different building elements. The automation of repetitive tasks with Dynamo, such as material quantification and LCA/LCC calculation, saves significant time when carrying out the analysis and avoids human errors in assessing building data. Moreover, the framework can also support the designer’s decision-making for more eco-efficient materials. The outcomes have shown the importance of selecting low impact finishing materials and the need to reduce the building mass to achieve more sustainable buildings. The inclusion of a high impact finishing material (such as the hydraulic tile from R2) has immediately excluded six scenarios during the LCA analysis due to the very high impacts. The higher mass from EW3 has also been identified during the LCA analysis, resulting in the exclusion of four additional scenarios. Overall, it has been noticed that the finishing materials and the construction solution mass are key factors when designing sustainable and low-cost buildings. The LCC analysis has also demonstrated the need for low-maintenance materials and energy-efficient construction solutions due to their importance on the life cycle costs.
Future research should focus on integrating a comparison method. The tool should be able to save a few simulations and organize and classify the results for user interpretation. Furthermore, new building elements should be added, different types of building analyzed, and different end-of-life scenarios considered. Method replicability for other regions is assured by the personal material datasheets that must be uploaded into Dynamo routine. Still, this is also a limitation as it is a non-automated process, which requires extra time.
Overall, the outcomes of this study have contributed to the development of a more sustainable built environment, as well as for the integration of LCA and LCC analysis into BIM environment. It also raises the need to adopt new innovative solutions to act during project early stages, to effectively improve building sustainability.
Supplementary Materials
The following are available online at https://0-www-mdpi-com.brum.beds.ac.uk/article/10.3390/su13168914/s1. Table S1: Considered Environmental impacts. Table S2: External Walls 1; External Walls 2; External Walls 3. Table S3: Roof 1; Roof 2; Roof 3. Table S4: Floor 1; Floor 2. Table S5: Remaining elements.
Author Contributions
Conceptualization, J.P.C.; methodology, J.P.C. and F.S.V.; software, F.S.V.; validation, J.P.C., F.S.V. and L.B.; formal analysis, J.P.C. and F.S.V.; investigation, J.P.C. and F.S.V.; writing—original draft preparation, J.P.C.; writing—review and editing, F.S.V. and L.B.; visualization, J.P.C.; supervision, L.B.; funding acquisition, J.P.C. All authors have read and agreed to the published version of the manuscript.
Funding
This research was funded by the Portuguese Foundation for Science and Technology, through the Regional Operation Programme of North (Grant number SFRH/BD/145735/2019).
Institutional Review Board Statement
Not applicable.
Informed Consent Statement
Not applicable.
Data Availability Statement
The data presented in this study are available in supplementary materials.
Conflicts of Interest
The authors declare no conflict of interest.
Appendix A
Construction solutions description.

Table A1.
Simulation scenarios combination.
| Simulation Scenario | External Walls | Floor | Roof |
|---|---|---|---|
| S1 | EW1 | F1 | R1 |
| S2 | EW1 | F2 | R1 |
| S3 | EW1 | F1 | R2 |
| S4 | EW1 | F2 | R2 |
| S5 | EW1 | F1 | R3 |
| S6 | EW1 | F2 | R3 |
| S7 | EW2 | F1 | R1 |
| S8 | EW2 | F2 | R1 |
| S9 | EW2 | F1 | R2 |
| S10 | EW2 | F2 | R2 |
| S11 | EW2 | F1 | R3 |
| S12 | EW2 | F2 | R3 |
| S13 | EW3 | F1 | R1 |
| S14 | EW3 | F2 | R1 |
| S15 | EW3 | F1 | R2 |
| S16 | EW3 | F2 | R2 |
| S17 | EW3 | F1 | R3 |
| S18 | EW3 | F2 | R3 |
Table A2.
Construction Solutions Characterization—External Walls.
| Element | Description/Materials | Stage | Impacts/m2 of External Wall | Costs | ||||||||
|---|---|---|---|---|---|---|---|---|---|---|---|---|
| ADP | GWP | ODP | AP | POCP | EP | ENR | Acquisition & Construction €/m2 | Maintenance €/m2/10 y | Demolition €/m2 | |||
| External Wall 1 (EW1) | Single brick wall (22 cm) with exterior EPS insulation (6 cm) and mortar on both sides (2 cm)—total thickness 32 cm | Cradle-to-gate | 3.11 × 10⁻¹ | 6.11 × 10+1 | 3.40 × 10⁻⁶ | 1.42 × 10⁻¹ | 1.94 × 10⁻² | 1.74 × 10⁻² | 7.12 × 10+2 | 51.12 | 25.34 | 6.11 |
| End-of-life | 1.27 × 10⁻¹ | 1.88 × 10+1 | 3.05 × 10⁻⁶ | 8.70 × 10⁻² | 3.40 × 10⁻³ | 1.80 × 10⁻² | 2.92 × 10+2 | |||||
| External Wall 2 (EW2) | Single concrete wall (20 cm) with exterior XPS insulation (6 cm) and mortar on both sides (2 cm)—total thickness 30 cm | Cradle-to-gate | 3.99 × 10⁻¹ | 9.64 × 10+1 | 3.32 × 10⁻⁶ | 2.05 × 10⁻¹ | 2.65 × 10⁻² | 3.33 × 10⁻² | 8.54 × 10+2 | 82.06 | 35.84 | 16.22 |
| End-of-life | 3.29 × 10⁻¹ | 4.76 × 10+1 | 7.68 × 10⁻⁶ | 2.28 × 10⁻¹ | 8.50 × 10⁻³ | 4.72 × 10⁻² | 7.53 × 10+2 | |||||
| External Wall 3 (EX3) | Double brick wall (11 cm + 11 cm) with XPS insulation (4 cm) in the air cavity (8 cm) and mortar on both sides (2 cm)—total thickness 38 cm | Cradle-to-gate | 3.02 × 10⁻¹ | 6.99 × 10+1 | 2.01 × 10⁻⁴ | 1.45 × 10⁻¹ | 9.18 × 10⁻³ | 1.81 × 10⁻² | 6.91 × 10+2 | 53.90 | 25.34 | 11.67 |
| End-of-life | 1.39 × 10⁻¹ | 2.06 × 10+1 | 3.00 × 10⁻⁶ | 9.50 × 10⁻² | 3.62 × 10⁻³ | 1.96 × 10⁻² | 3.19 × 10+2 | |||||
Table A3.
Construction Solutions Characterization—Roofs.
| Element | Description/Materials | Stage | Impacts/m2 of Roof | Costs | ||||||||
|---|---|---|---|---|---|---|---|---|---|---|---|---|
| ADP | GWP | ODP | AP | POCP | EP | ENR | Acquisition & Construction €/m2 | Maintenance €/m2/10 y | Demolition €/m2 | |||
| Roof 1 (R1) | Concrete slab (20 cm), with mortar on both sides (2 cm), light concrete (10 cm), exterior EPS insulation (8 cm), waterproof membrane and ceramic tile—total thickness 45 cm | Cradle-to-gate | 8.41 × 10⁻¹ | 1.62 × 10+2 | 9.73 × 10⁻⁶ | 7.29 × 10⁻¹ | 4.39 × 10⁻² | 7.74 × 10⁻² | 1.61 × 10+3 | 165.31 | 34.31 | 82.76 |
| End-of-life | −2.47 × 10⁻¹ | −1.64 × 10+1 | 4.19 × 10⁻⁷ | −7.92 × 10⁻² | −1.87 × 10⁻² | −1.04 × 10⁻² | −3.47 × 10+2 | |||||
| Roof 2 (R2) | Lightweight block and beam slab (24 cm), with mortar in both sides (2 cm), light concrete (10 cm), exterior EPS insulation (8 cm), waterproof membrane, concrete floor, and hydraulic tile—total thickness 50 cm | Cradle-to-gate | 8.68 × 10+1 | 4.02 × 10+4 | 1.30 × 10⁻³ | 6.56 × 10+1 | 2.38 × 10+0 | 1.04 × 10+1 | 1.65 × 10+5 | 136.01 | 33.71 | 81.65 |
| End-of-life | −6.56 × 10⁻² | −3.08 × 10+0 | 6.76 × 10⁻⁷ | −1.20 × 10⁻² | −5.84 × 10⁻³ | −5.60 × 10⁻⁴ | −7.77 × 10+1 | |||||
| Roof 3 (R3) | Lightweight block and beam slab (24 cm), with mortar on both sides (2 cm), light concrete (10 cm), waterproof membrane, exterior XPS insulation (8 cm) and concrete floor—total thickness 50 cm | Cradle-to-gate | 8.67 × 10⁻¹ | 1.76 × 10+2 | 1.25 × 10⁻⁵ | 7.32 × 10⁻¹ | 3.63 × 10⁻² | 6.64 × 10⁻² | 1.74 × 10+3 | 123.18 | 29.48 | 80.91 |
| End-of-life | −6.67 × 10⁻² | −3.23 × 10+0 | 6.44 × 10⁻⁷ | −1.29 × 10⁻² | −5.87 × 10⁻³ | −7.40 × 10⁻⁴ | −8.01 × 10+1 | |||||
Table A4.
Construction Solutions Characterization—Floors.
| Element | Description/Materials | Stage | Impacts/m2 of Floor | Costs | ||||||||
|---|---|---|---|---|---|---|---|---|---|---|---|---|
| ADP | GWP | ODP | AP | POCP | EP | ENR | Acquisition & Construction €/m2 | Maintenance €/m2/10 y | Demolition €/m2 | |||
| Floor 1 (F1) | Lightweight block and beam slab (25 cm), air cavity under the slab (15 cm), with 2.5 cm of rockwool and plasterboard finishing (1.25 cm)—total thickness 41.25 cm | Cradle-to-gate | 2.84 × 10⁻¹ | 6.43 × 10+1 | 3.11 × 10⁻⁶ | 1.49 × 10⁻¹ | 1.15 × 10⁻² | 2.34 × 10⁻² | 6.00 × 10+2 | 54.43 | 3.32 | 56.40 |
| End-of-life | 3.04 × 10⁻¹ | 4.47 × 10+1 | 6.67 × 10⁻⁶ | 2.57 × 10⁻¹ | 8.20 × 10⁻³ | 5.40 × 10⁻² | 6.93 × 10+2 | |||||
| Floor 2 (F2) | Concrete slab (20 cm), air cavity under the slab (15 cm), with 2.5 cm of rockwool and plasterboard finishing (1.25 cm)—total thickness 36.25 cm | Cradle-to-gate | 2.90 × 10⁻¹ | 7.44 × 10+1 | 2.81 × 10⁻⁶ | 1.62 × 10⁻¹ | 1.29 × 10⁻² | 2.79 × 10⁻² | 5.99 × 10+2 | 82.13 | 3.81 | 58.25 |
| End-of-life | 2.80 × 10⁻¹ | 4.06 × 10+1 | 6.52 × 10⁻⁶ | 1.94 × 10⁻¹ | 7.20 × 10⁻³ | 4.01 × 10⁻² | 6.38 × 10+2 | |||||
Table A5.
Construction Solutions Characterization—Remaining Elements.
| Element | Description/Materials | Stage | Impacts/m2 of Floor | ||||||
|---|---|---|---|---|---|---|---|---|---|
| ADP | GWP | ODP | AP | POCP | EP | ENR | |||
| Interior Walls | Single brick (15 cm) wall with mortar on both sides (2 cm) | Cradle-to-gate | 1.62 × 10⁻¹ | 3.79 × 10+1 | 2.28 × 10⁻⁶ | 8.18 × 10⁻² | 5.22 × 10⁻³ | 1.08 × 10⁻² | 3.72 × 10+2 |
| End-of-life | 9.00 × 10⁻² | 1.33 × 10+1 | 2.15 × 10⁻⁶ | 6.12 × 10⁻² | 2.33 × 10⁻³ | 1.26 × 10⁻² | 2.07 × 10+2 | ||
| Windows | Single window with double glass (4 + 22 + 4) in aluminum frame | Cradle-to-gate | 1.74 × 10+0 | 2.51 × 10+2 | 4.63 × 10⁻⁵ | 1.48 × 10+0 | 1.46 × 10⁻¹ | 1.24 × 10⁻¹ | 3.19 × 10+3 |
| End-of-life | −1.12 × 10+0 | −1.67 × 10+2 | −1.06 × 10⁻⁵ | −9.11 × 10⁻¹ | −7.71 × 10⁻² | −7.97 × 10⁻² | −2.01 × 10+3 | ||
Figure A1.
Dynamo routine.

References
- Li, Y.; Chen, X.; Wang, X.; Xu, Y.; Chen, P.-H. A review of studies on green building assessment methods by comparative analysis. Energy Build. 2017, 146, 152–159. [Google Scholar] [CrossRef]
- Santos, R.; Costa, A.A.; Silvestre, J.D.; Pyl, L. Integration of LCA and LCC analysis within a BIM-based environment. Autom. Constr. 2019, 103, 127–149. [Google Scholar] [CrossRef]
- Azhar, S.; Brown, J.W.; Sattineni, A. A Case Study of Building Performance Analyses Using Building Information Modeling. In Proceedings of the 27th International Symposium on Automation and Robotics in Construction, Bratislava, Slovakia, 25–27 June 2010; pp. 25–27. [Google Scholar] [CrossRef] [Green Version]
- Basbagill, J.; Flager, F.; Lepech, M.; Fischer, M. Application of life-cycle assessment to early stage building design for reduced embodied environmental impacts. Build. Environ. 2013, 60, 81–92. [Google Scholar] [CrossRef]
- Blengini, G.A.; di Carlo, T. Energy-saving policies and low-energy residential buildings: An LCA case study to support decision makers in piedmont (Italy). Int. J. Life Cycle Assess. 2010, 15, 652–665. [Google Scholar] [CrossRef]
- Nwodo, M.N.; Anumba, C.J. A review of life cycle assessment of buildings using a systematic approach. Build. Environ. 2019, 162, 106290. [Google Scholar] [CrossRef]
- Chau, C.K.; Leung, T.M.; Ng, W.Y. A review on life cycle assessment, life cycle energy assessment and life cycle carbon emissions assessment on buildings. Appl. Energy 2015, 143, 395–413. [Google Scholar] [CrossRef]
- Naneva, A.; Bonanomi, M.; Hollberg, A.; Habert, G.; Hall, D. Integrated BIM-Based LCA for the Entire Building Process Using an Existing Structure for Cost Estimation in the Swiss Context. Sustainability 2020, 12, 3748. [Google Scholar] [CrossRef]
- Hollberg, A.; Genova, G.; Habert, G. Evaluation of BIM-based LCA results for building design. Autom. Constr. 2020, 109, 102972. [Google Scholar] [CrossRef]
- Vilches, A.; Garcia-Martinez, A.; Sanchez-Montañes, B. Life cycle assessment (LCA) of building refurbishment: A literature review. Energy Build. 2017, 135, 286–301. [Google Scholar] [CrossRef]
- Soust-Verdaguer, B.; Llatas, C.; García-Martínez, A. Simplification in life cycle assessment of single-family houses: A review of recent developments. Build. Environ. 2016, 103, 215–227. [Google Scholar] [CrossRef] [Green Version]
- Lu, K.; Jiang, X.; Yu, J.; Tam, V.W.Y.; Skitmore, M. Integration of life cycle assessment and life cycle cost using building information modeling: A critical review. J. Clean. Prod. 2021, 285, 125438. [Google Scholar] [CrossRef]
- Rad, M.A.H.; Jalaei, F.; Golpour, A.; Varzande, S.S.H.; Guest, G. BIM-based approach to conduct Life Cycle Cost Analysis of resilient buildings at the conceptual stage. Autom. Constr. 2021, 123, 103480. [Google Scholar] [CrossRef]
- Alshamrani, O.S. Integrated LCA-LCC assessment model of offsite, onsite, and conventional construction systems. J. Asian Archit. Build. Eng. 2021, 1–23. [Google Scholar] [CrossRef]
- Santos, R.; Costa, A.A.; Silvestre, J.D.; Pyl, L. Development of a BIM-based Environmental and Economic Life Cycle Assessment tool. J. Clean. Prod. 2020, 265, 121705. [Google Scholar] [CrossRef]
- Eleftheriadis, S.; Mumovic, D.; Greening, P. Life cycle energy efficiency in building structures: A review of current developments and future outlooks based on BIM capabilities. Renew. Sustain. Energy Rev. 2017, 67, 811–825. [Google Scholar] [CrossRef] [Green Version]
- Succar, B. Building information modelling framework: A research and delivery foundation for industry stakeholders. Autom. Constr. 2009, 18, 357–375. [Google Scholar] [CrossRef]
- Abanda, F.H.; Byers, L. An investigation of the impact of building orientation on energy consumption in a domestic building using emerging BIM (Building Information Modelling). Energy 2016, 97, 517–527. [Google Scholar] [CrossRef]
- Azhar, S.; Carlton, W.A.; Olsen, D.; Ahmad, I. Building information modeling for sustainable design and LEED® rating analysis. Autom. Constr. 2011, 20, 217–224. [Google Scholar] [CrossRef]
- Santos, R.; Costa, A.A.; Silvestre, J.D.; Pyl, L. Informetric analysis and review of literature on the role of BIM in sustainable construction. Autom. Constr. 2019, 103, 221–234. [Google Scholar] [CrossRef]
- Merschbrock, C.; Munkvold, B.E. Effective digital collaboration in the construction industry—A case study of BIM deployment in a hospital construction project. Comput. Ind. 2015, 73, 1–7. [Google Scholar] [CrossRef]
- Najjar, M.; Figueiredo, K.; Palumbo, M.; Haddad, A. Integration of BIM and LCA: Evaluating the environmental impacts of building materials at an early stage of designing a typical office building. J. Build. Eng. 2017, 14, 115–126. [Google Scholar] [CrossRef]
- AIA. AIA Document G202-2013; Project Building Information Modeling Protocol Form; AIA: Washington, DC, USA, 2013. [Google Scholar]
- Carvalho, J.P.; Bragança, L.; Mateus, R. Optimising building sustainability assessment using BIM. Autom. Constr. 2019, 102, 170–182. [Google Scholar] [CrossRef]
- Wong, J.K.-W.; Kuan, K.-L. Implementing ‘BEAM Plus’ for BIM-based sustainability analysis. Autom. Constr. 2014, 44, 163–175. [Google Scholar] [CrossRef]
- Soust-Verdaguer, B.; Llatas, C.; García-Martínez, A. Critical review of bim-based LCA method to buildings. Energy Build. 2017, 136, 110–120. [Google Scholar] [CrossRef]
- Carvalho, J.P.; Alecrim, I.; Bragança, L.; Mateus, R. Integrating BIM-Based LCA and Building Sustainability Assessment. Sustainability 2020, 12, 7468. [Google Scholar] [CrossRef]
- Rezaei, F.; Bulle, C.; Lesage, P. Integrating building information modeling and life cycle assessment in the early and detailed building design stages. Build. Environ. 2019, 153, 158–167. [Google Scholar] [CrossRef] [Green Version]
- Figueiredo, K.; Pierott, R.; Hammad, A.W.A.; Haddad, A. Sustainable material choice for construction projects: A Life Cycle Sustainability Assessment framework based on BIM and Fuzzy-AHP. Build. Environ. 2021, 196, 107805. [Google Scholar] [CrossRef]
- Anand, C.K.; Amor, B. Recent developments, future challenges and new research directions in LCA of buildings: A critical review. Renew. Sustain. Energy Rev. 2017, 67, 408–416. [Google Scholar] [CrossRef]
- Röck, M.; Hollberg, A.; Habert, G.; Passer, A. LCA and BIM: Visualization of environmental potentials in building construction at early design stages. Build. Environ. 2018, 140, 153–161. [Google Scholar] [CrossRef]
- Häfliger, I.-F.; John, V.; Passer, A.; Lasvaux, S.; Hoxha, E.; Saade, M.R.M.; Habert, G. Buildings environmental impacts’ sensitivity related to LCA modelling choices of construction materials. J. Clean. Prod. 2017, 156, 805–816. [Google Scholar] [CrossRef] [Green Version]
- Carvalho, J.P.; Bragança, L.; Mateus, R. A Systematic Review of the Role of BIM in Building Sustainability Assessment Methods. Appl. Sci. 2020, 10, 4444. [Google Scholar] [CrossRef]
- INE and LNEC. O Parque Habitacional e a sua Reabilitação—Análise e Evolução: 2001–2011 (Housing Stock and Rehabilitation—Analysis and Evolution: 2001–2011), Lisboa. 2013. Available online: https://www.ine.pt/xportal/xmain?xpid=INE&xpgid=ine_publicacoes&PUBLICACOESpub_boui=165231362&PUBLICACOEStema=00&PUBLICACOESmodo=2 (accessed on 11 May 2021).
- Mateus, R.; Bragança, L. Sustainability assessment and rating of buildings: Developing the methodology SBToolPT–H. Build. Environ. 2011, 46, 1962–1971. [Google Scholar] [CrossRef]
- Obrecht, T.P.; Röck, M.; Hoxha, E.; Passer, A. BIM and LCA Integration: A Systematic Literature Review. Sustainability 2020, 12, 5534. [Google Scholar] [CrossRef]
- Bragança, L.; Mateus, R. Avaliação do Ciclo de Vida Dos Edifícios: Impacte Ambiental de Soluções Construtivas (Buildings Life Cycle Assessment: Environmental Impacts of Building Construction Solutions), 1st ed.; iiSBE: Guimarães, Portugal, 2011. [Google Scholar]
- Carvalho, J.P.; Almeida, M.; Bragança, L.; Mateus, R. BIM-Based Energy Analysis and Sustainability Assessment—Application to Portuguese Buildings. Buildings 2021, 11, 246. [Google Scholar] [CrossRef]
Figure 1.
Global research methodology.

Figure 2.
Case study floor plan (in meters).

Figure 3.
LCA graphical results.

Figure 4.
LCC results variation per life cycle stage.

Figure 5.
LCA results per life cycle stage.

Table 1.
Environmental impacts for LCA analysis.
| Environmental Impact | Method | Weight (%) |
|---|---|---|
| ADP [kg Sb eq] | CML 2 baseline | 11.66% |
| GWP [kg CO2 eq] | IPCC 2001 | 38.75% |
| ODP [kg CFC-11 eq] | CML 2 baseline | 6.46% |
| AP [kg SO2 eq] | CML 2 baseline | 11.66% |
| POCP [kg C2H4 eq] | CML 2 baseline | 8.15% |
| EP [kg PO4 eq] | CML 2 baseline | 11.66% |
| ENR [MJ eq] | Cumulative Energy Demand v1.04 | 11.66% |
Table 2.
Dynamo output for SS1.
| SS1 | |
|---|---|
| ADP | 413.72 |
| GWP | 81,622.34 |
| ODP | 0.0066 |
| AP | 303.57 |
| POCP | 11.76 |
| EP | 40.50 |
| ENR | 920,923 |
| Acquisition and construction cost | €60,784 |
| Maintenance cost/50 years | €14,585 |
| Demolition cost | €31,040 |
Table 3.
LCA results.
| SS1 | SS2 | SS3 | SS4 | SS5 | SS6 | SS7 | SS8 | SS9 | SS10 | SS11 | SS12 | SS13 | SS14 | SS15 | SS16 | SS17 | SS18 | |
|---|---|---|---|---|---|---|---|---|---|---|---|---|---|---|---|---|---|---|
| ADP | 4.14 × 10+2 | 4.00 × 10+2 | 1.71 × 10+4 | 1.71 × 10+4 | 4.55 × 10+2 | 4.41 × 10+2 | 4.82 × 10+2 | 4.95 × 10+2 | 1.72 × 10+4 | 1.72 × 10+4 | 5.36 × 10+2 | 5.22 × 10+2 | 4.15 × 10+2 | 4.02 × 10+2 | 1.71 × 10+4 | 1.71 × 10+4 | 4.56 × 10+2 | 4.42 × 10+2 |
| % | 97.60 | 97.68 | 0.47 | 0.55 | 97.36 | 97.44 | 97.20 | 97.12 | 0.00 | 0.08 | 96.89 | 96.97 | 97.59 | 97.67 | 0.81 | 0.89 | 97.35 | 97.43 |
| GWP | 8.16 × 10+4 | 8.36 × 10+4 | 7.86 × 10+6 | 7.86 × 10+6 | 8.69 × 10+4 | 8.89 × 10+4 | 1.02 × 10+5 | 9.96 × 10+4 | 7.88 × 10+6 | 7.88 × 10+6 | 1.05 × 10+5 | 1.07 × 10+5 | 8.47 × 10+4 | 8.67 × 10+4 | 7.83 × 10+6 | 7.84 × 10+6 | 8.99 × 10+4 | 9.19 × 10+4 |
| % | 98.96 | 98.94 | 0.25 | 0.23 | 98.90 | 98.87 | 98.71 | 98.74 | 0.03 | 0.00 | 98.67 | 98.64 | 98.92 | 98.90 | 0.57 | 0.55 | 98.86 | 98.83 |
| ODP | 6.62 × 10⁻³ | 6.48 × 10⁻³ | 2.57 × 10⁻¹ | 2.57 × 10⁻¹ | 7.21 × 10⁻³ | 7.06 × 10⁻³ | 7.75 × 10⁻³ | 7.90 × 10⁻³ | 2.58 × 10⁻¹ | 2.58 × 10⁻¹ | 8.48 × 10⁻³ | 8.34 × 10⁻³ | 6.24 × 10⁻² | 6.23 × 10⁻² | 3.12 × 10⁻¹ | 3.12 × 10⁻¹ | 6.30 × 10⁻² | 6.29 × 10⁻² |
| % | 97.88 | 97.93 | 17.60 | 17.65 | 97.69 | 97.74 | 97.52 | 97.47 | 17.19 | 17.24 | 97.28 | 97.33 | 79.99 | 80.04 | 0.00 | 0.05 | 79.80 | 79.85 |
| AP | 3.04 × 10+2 | 2.90 × 10+2 | 1.29 × 10+4 | 1.29 × 10+4 | 3.17 × 10+2 | 3.03 × 10+2 | 3.47 × 10+2 | 3.61 × 10+2 | 1.30 × 10+4 | 1.30 × 10+4 | 3.74 × 10+2 | 3.61 × 10+2 | 3.07 × 10+2 | 2.93 × 10+2 | 1.29 × 10+4 | 1.29 × 10+4 | 3.20 × 10+2 | 3.07 × 10+2 |
| % | 97.66 | 97.77 | 0.44 | 0.55 | 97.56 | 97.66 | 97.32 | 97.22 | 0.00 | 0.11 | 97.12 | 97.22 | 97.63 | 97.74 | 0.77 | 0.87 | 97.53 | 97.64 |
| POCP | 1.18 × 10+1 | 1.11 × 10+1 | 4.67 × 10+2 | 4.66 × 10+2 | 1.28 × 10+1 | 1.21 × 10+1 | 2.03 × 10+1 | 2.10 × 10+1 | 4.76 × 10+2 | 4.76 × 10+2 | 2.20 × 10+1 | 2.13 × 10+1 | 1.48 × 10+1 | 1.40 × 10+1 | 4.68 × 10+2 | 4.68 × 10+2 | 1.58 × 10+1 | 1.18 × 10+1 |
| % | 97.53 | 97.68 | 1.93 | 2.08 | 97.32 | 97.47 | 95.74 | 95.60 | 0.00 | 0.15 | 95.38 | 95.53 | 96.90 | 97.05 | 1.65 | 1.80 | 96.69 | 97.53 |
| EP | 4.05 × 10+1 | 4.14 × 10+1 | 2.05 × 10+3 | 2.05 × 10+3 | 4.02 × 10+1 | 4.11 × 10+1 | 5.40 × 10+1 | 5.32 × 10+1 | 2.06 × 10+3 | 2.06 × 10+3 | 5.29 × 10+1 | 5.38 × 10+1 | 4.12 × 10+1 | 4.21 × 10+1 | 2.04 × 10+3 | 2.04 × 10+3 | 4.10 × 10+1 | 4.18 × 10+1 |
| % | 98.03 | 97.99 | 0.66 | 0.62 | 98.05 | 98.01 | 97.38 | 97.42 | 0.04 | 0.00 | 97.43 | 97.39 | 98.00 | 97.96 | 0.97 | 0.93 | 98.01 | 97.97 |
| ENR | 9.21 × 10+5 | 8.83 × 10+5 | 3.27 × 10+7 | 3.27 × 10+7 | 9.99 × 10+5 | 9.61 × 10+5 | 1.05 × 10+6 | 1.09 × 10+6 | 3.29 × 10+7 | 3.29 × 10+7 | 1.17 × 10+6 | 1.13 × 10+6 | 9.26 × 10+5 | 8.88 × 10+5 | 3.26 × 10+7 | 3.26 × 10+7 | 1.00 × 10+6 | 9.65 × 10+5 |
| % | 97.20 | 97.31 | 0.52 | 0.64 | 96.96 | 97.08 | 96.79 | 96.68 | 0.00 | 0.11 | 96.44 | 96.56 | 97.19 | 97.30 | 0.86 | 0.97 | 96.95 | 97.07 |
| Global LCA score | 98.15 | 98.19 | 1.64 | 1.67 | 98.03 | 98.07 | 97.67 | 97.64 | 1.13 | 1.16 | 97.52 | 97.55 | 96.92 | 96.96 | 0.75 | 0.79 | 96.80 | 96.83 |
Table 4.
LCC results.
| SS1 | SS2 | SS3 | SS4 | SS5 | SS6 | SS7 | SS8 | SS9 | SS10 | SS11 | SS12 | SS13 | SS14 | SS15 | SS16 | SS17 | SS18 | |
|---|---|---|---|---|---|---|---|---|---|---|---|---|---|---|---|---|---|---|
| Acquisition and construction cost | €60,784 | €66,898 | €55,094 | €61,208 | €52,602 | €58,716 | €75,578 | €69,482 | €63,792 | €69,888 | €61,301 | €67,397 | €61,568 | €67,730 | €55,899 | €62,061. | €53,416 | €59,579 |
| Maintenance cost | €72,926 | €73,466 | €72,343 | €72,884 | €68,236 | €68,777 | €88,269 | €87,730 | €87,147 | €87,687 | €83,040 | €83,579 | €72,902 | €73,447 | €72,322 | €72,867 | €68,229 | €68,774 |
| Operation cost | €92,187 | €96,531 | €91,463 | €95,832 | €91,001 | €95,370 | €97,293 | €102,161 | €97,130 | €101,499 | €96,706 | €101,062 | €97,854 | €100,988 | €97,168 | €100,326 | €96,718 | €99,877 |
| Demolition cost | €31,040 | €31,449 | €30,825 | €31,233 | €30,681 | €31,090 | €34,265 | €33,858 | €33,642 | €34,049 | €33,498 | €33,906 | €32,652 | €33,064 | €32,437 | €32,849 | €32,294 | €32,706 |
| Life cycle total cost | €256,937 | €268,344 | €249,725 | €261,157 | €242,520 | €253,952 | €295,405 | €293,230 | €281,712 | €293,124 | €274,545 | €285,944 | €264,977 | €275,229 | €257,825 | €268,102 | €250,658 | €260,935 |
| Global LCC score | 13.02 | 9.16 | 15.46 | 11.59 | 17.90 | 14.03 | 0.00 | 0.74 | 4.64 | 0.77 | 7.06 | 3.20 | 10.30 | 6.83 | 12.72 | 9.24 | 15.15 | 11.67 |
Table 5.
Overall LCA and LCC results.
| SS1 | SS2 | SS3 | SS4 | SS5 | SS6 | SS7 | SS8 | SS9 | SS10 | SS11 | SS12 | SS13 | SS14 | SS15 | SS16 | SS17 | SS18 | |
|---|---|---|---|---|---|---|---|---|---|---|---|---|---|---|---|---|---|---|
| LCA | 98.15 | 98.19 | 1.64 | 1.67 | 98.03 | 98.07 | 97.67 | 97.64 | 1.13 | 1.16 | 97.52 | 97.55 | 96.92 | 96.96 | 0.75 | 0.79 | 96.80 | 96.83 |
| LCC | 13.02 | 9.16 | 15.46 | 11.59 | 17.90 | 14.03 | 0.00 | 0.74 | 4.64 | 0.77 | 7.06 | 3.20 | 10.30 | 6.83 | 12.72 | 9.24 | 15.15 | 11.67 |
| Total | 55.59 | 53.67 | 8.55 | 6.63 | 57.97 | 56.05 | 48.84 | 49.19 | 2.88 | 0.97 | 52.29 | 50.38 | 53.61 | 51.89 | 6.74 | 5.02 | 55.97 | 54.25 |
Publisher’s Note: MDPI stays neutral with regard to jurisdictional claims in published maps and institutional affiliations. |
© 2021 by the authors. Licensee MDPI, Basel, Switzerland. This article is an open access article distributed under the terms and conditions of the Creative Commons Attribution (CC BY) license (https://creativecommons.org/licenses/by/4.0/).
Share and Cite
MDPI and ACS Style
Carvalho, J.P.; Villaschi, F.S.; Bragança, L. Assessing Life Cycle Environmental and Economic Impacts of Building Construction Solutions with BIM. Sustainability 2021, 13, 8914. https://0-doi-org.brum.beds.ac.uk/10.3390/su13168914
AMA Style
Carvalho JP, Villaschi FS, Bragança L. Assessing Life Cycle Environmental and Economic Impacts of Building Construction Solutions with BIM. Sustainability. 2021; 13(16):8914. https://0-doi-org.brum.beds.ac.uk/10.3390/su13168914
Chicago/Turabian StyleCarvalho, José Pedro, Fernanda Schmitd Villaschi, and Luís Bragança. 2021. "Assessing Life Cycle Environmental and Economic Impacts of Building Construction Solutions with BIM" Sustainability 13, no. 16: 8914. https://0-doi-org.brum.beds.ac.uk/10.3390/su13168914
Note that from the first issue of 2016, this journal uses article numbers instead of page numbers. See further details here.