
Impact of Rainfall on Traffic Speed in Major Cities of China
by
 ,
,
Min Zhang
1, 
Yufu Liu
1,
Wenqi Sun
1,
Yixiong Xiao
1,
Chang Jiang
2,
Yong Wang
1,* and
Yuqi Bai
1,* 1
Department of Earth System Science, Tsinghua University, Beijing 100084, China
2
Beijing Baidu Netcom Science Technology Co., Ltd., Beijing 100085, China
*
Authors to whom correspondence should be addressed.
Sustainability 2021, 13(16), 9074; https://0-doi-org.brum.beds.ac.uk/10.3390/su13169074
Submission received: 21 July 2021
/
Revised: 8 August 2021
/
Accepted: 9 August 2021
/
Published: 13 August 2021
Abstract
:The construction of healthy transportation is an important ingredient for promoting the healthy development of cities. The establishment of an urban traffic evaluation mechanism can provide an important basis for the construction of healthy transportation. This study focused on the impact of precipitation on traffic speed and developed an urban traffic vulnerability index. This index reflects the degree of traffic affected by precipitation, which is calculated based on the traffic congestion index under different rainfall intensities. The traffic vulnerability indices of 41 major cities in China under rainfall conditions were evaluated. Based on the above traffic vulnerability indexes, the impact of socioeconomic factors on urban traffic vulnerability was analyzed. The three key findings of this study are as follows: there was a positive correlation between the vulnerability index and the gross domestic product (GDP); the urban population (POP) had a significant impact on the urban traffic vulnerability; and urban car ownership had little impact on traffic vulnerability. Based on these findings, possible measures to improve urban traffic vulnerability are proposed. The construction of an index system provides a basis for enhancing the urban traffic assessment mechanism, promoting the development of urban physical examinations and building healthy transportation and healthy cities.
1. Introduction
Since the reform and opening up, China has experienced over 40 years of rapid development in urbanization. According to the Statistical Communique of the People’s Republic of China on 2020 National Economic and Social Development [1], the urbanization rate of the population in China exceeded 60% in 2020. The urbanization process helps to alleviate uneven development in urban and rural areas, improve living environments, and enhance the quality of life for people; it is an important aspect of high-quality socioeconomic development [2,3]. In addition, the urbanization process also encounters the emergence of some challenges, e.g., environmental pollution, traffic congestion, shifts in lifestyle and diet, the transmission of infectious diseases, and employment issues [4,5,6]. These problems caused by rapid urbanization have an impact on human health and health equality of urban areas [5,7,8,9]. In response to this challenge, in 1994, the World Health Organization (WHO) proposed the concept of healthy cities, which are “continually creating and improving those physical and social environments and expanding those community resources which enable people to mutually support each other in performing all the functions of life and developing to their maximum potential” [10]. During the urbanization process, China constantly seeks high-quality development and takes measures to build healthy cities [11,12]. For example, the Chinese government has issued the Healthy China 2030 Planning Outline [13]. The Ministry of Housing and Urban-Rural Development has launched the Urban Physical Examination and has established the Urban Physical Examination Evaluation Mechanism [14].
Urban traffic health is closely related to urban health. Urban traffic involves land planning and utilization, vehicles, and energy [15,16], and it is related to social governance, ecological environment, and human well-being [17,18,19,20]. In recent years, due to rapid development in urbanization and population growth, urban traffic problems have become increasingly apparent [21]. These have increased travel costs, environmental pollution, and substantial economic losses [22]. Therefore, the promotion of the healthy development of urban traffic has a profound impact on building a healthy city and promoting the sustainable development of a city [17,23,24].
To promote the construction of healthy urban transportation, an important aspect is to construct an urban traffic assessment mechanism. The existing urban traffic assessment methods have primarily focused on convenience, efficiency, and accessibility in traffic travel, and they have quantitatively evaluated the health level of urban traffic at a microscopic scale (e.g., roads and regions) [21,25,26,27]. Nevertheless, an evaluation of the urban traffic response capability under emergency conditions has been limited, especially for unexpected weather events [28]. Therefore, this study focused on the vulnerability of urban traffic and analyzed the impact of rainfall on urban traffic vulnerability [29,30,31]. This study used cities as the research unit to construct an urban traffic vulnerability evaluation index system to examine the coping abilities of China’s major first-tier, new first-tier, and second-tier cities under weather events. This index system provides a basis for enriching the urban physical examination evaluation mechanism, promoting the development of urban physical examination, and building healthy transportation and healthy cities.
2. Study Area and Data Preprocessing
2.1. Study Area
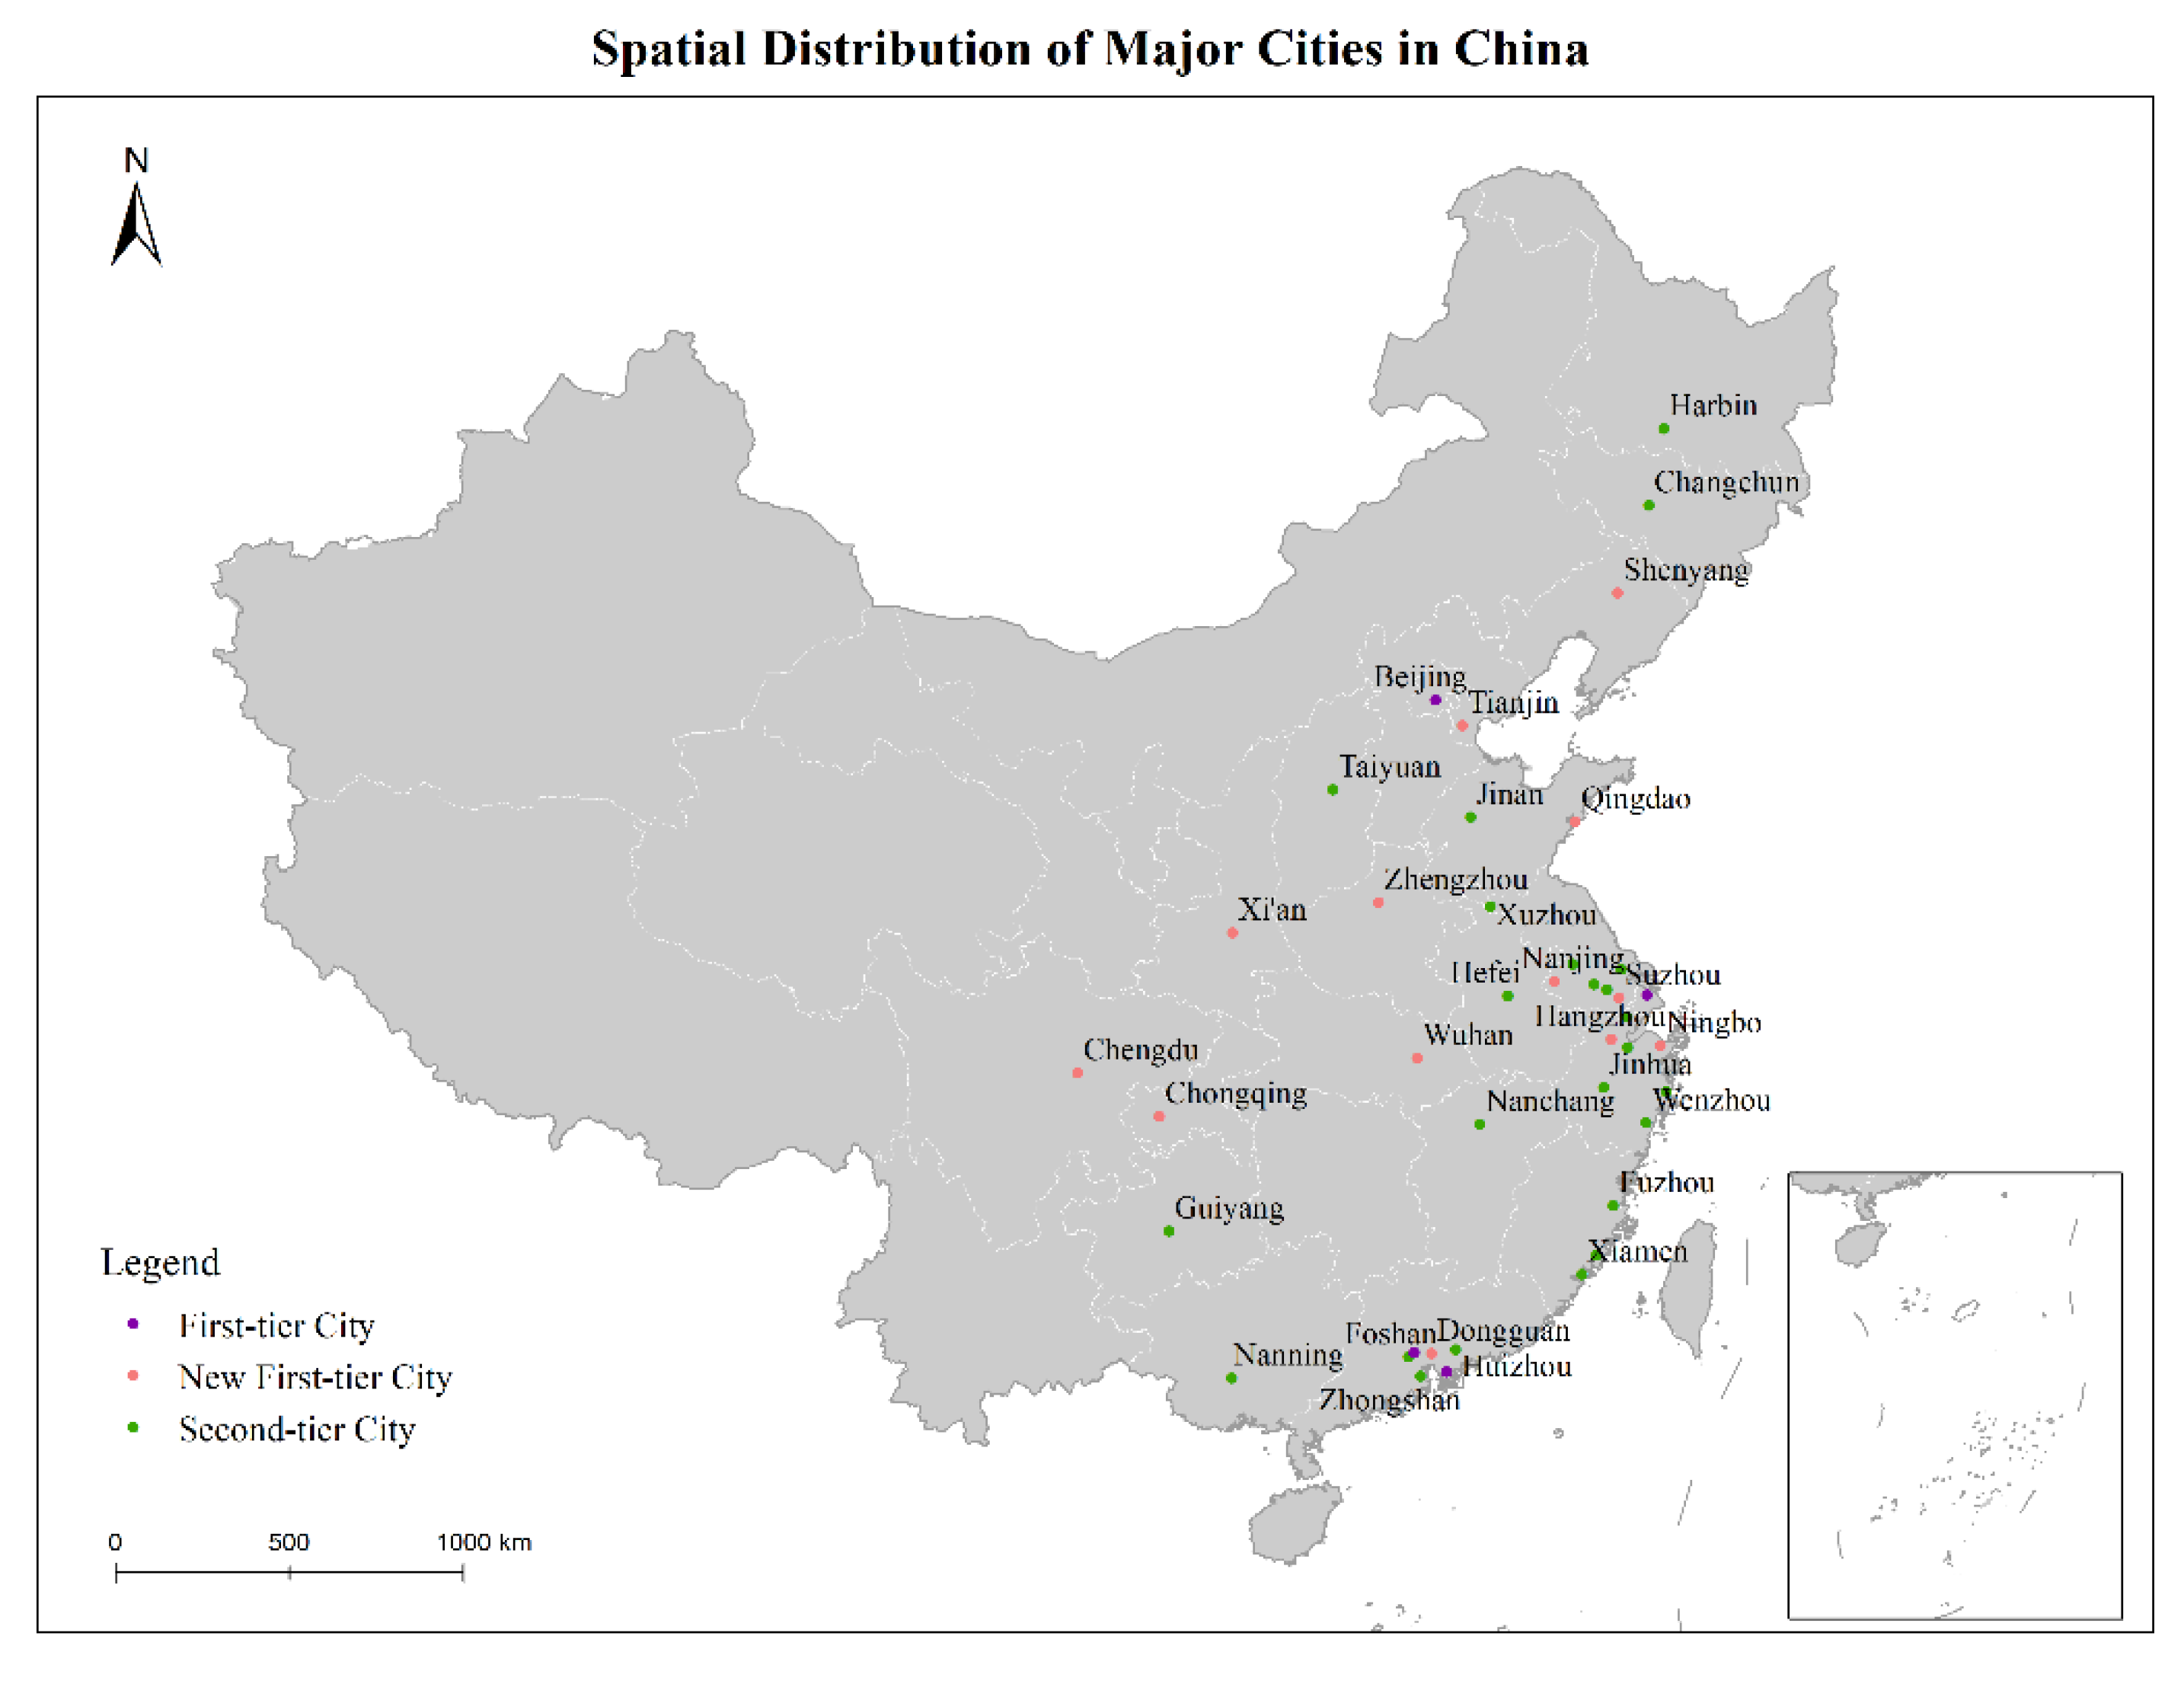
The research area covered China’s major first-tier cities, new first-tier cities, and second-tier cities, including 4 first-tier cities (Beijing, Shanghai, Guangzhou, and Shenzhen), 13 new first-tier cities (Chengdu, Hangzhou, Chongqing, Wuhan, Xi’an, Suzhou, Tianjin, Nanjing, Zhengzhou, Dongguan, Qingdao, Shenyang, and Ningbo), and 24 second-tier cities (Wuxi, Foshan, Hefei, Fuzhou, Xiamen, Harbin, Jinan, Wenzhou, Nanning, Changchun, Quanzhou, Guiyang, Nanchang, Jinhua, Changzhou, Nantong, Jiaxing, Taiyuan, Xuzhou, Huizhou, Zhongshan, Taizhou, Shaoxing, and Yangzhou), for a total of 41 cities.
The study area spanned the primary densely populated areas in China, encompassing first-tier, new first-tier, and second-tier cities with different levels of development. There were various climate types, including dry areas in the north and wet areas in the south. The cities considered in this study had a wide latitude coverage, including the northernmost city, called Harbin (45°45′ N), and Zhongshan (22°52′ N) in the south (Figure 1).
2.2. Data Preprocessing
2.2.1. Collection and Preprocessing of the Traffic Data
The traffic data used in this study were primarily derived from the Baidu Map Smart Transportation Platform (https://jiaotong.baidu.com/, accessed on 23 January 2021). Based on real-time traffic information and a unified algorithm, the platform calculates the traffic congestion index and average speed for major cities in China.
The “traffic congestion index” was used as a measure of urban traffic conditions, which was calculated as the ratio of the actual travel time to the unobstructed travel time. A large traffic congestion index meant high traffic congestion, and vice versa [32,33]. The time coverage of the traffic data was two years (i.e., from 1 January 2018 to 31 December 2019), and the time resolution was one hour. The spatial coverage was the urban-level traffic operation indicators of the 41 major first-tier cities, new first-tier cities, and second-tier cities in China. The data contained several advantages, i.e., long durations, wide spatial coverages, and high temporal resolutions.
In general, traffic conditions exhibit periodic change patterns in time and space and experience change patterns in different periods (e.g., month, week, and day). To eliminate the influence of the periodic changes in traffic conditions of working and non-working days on the results, the traffic data of working days in the 41 cities during 2018–2019 were selected in order to remove the changes in traffic conditions caused by the morning and evening rush hours of the day. The hourly traffic congestion index was averaged throughout the working day, and finally, the daily average of the traffic congestion of a working day was obtained.
2.2.2. Collection and Preprocessing of Rainfall Data
The rainfall data were sourced from NASA’s Global Precipitation Measurement (https://gpm.nasa.gov/data/directory, accessed on 15 January 2021), which adopts satellite observations to gather precipitation information with high spatial resolution and a wide spatial coverage (global coverage). By using the multi-satellite inversion, grid data with high temporal resolution (half-hour precipitation, daily precipitation, and monthly average precipitation) were acquired. In addition, the Global Precipitation Measurement (GPM) data have a high observation accuracy for low precipitation and solid-state precipitation, a strong ability to capture heavy rainfall, and a high accuracy and high temporal and spatial resolution [34].
In this study, the latitude and longitude coordinates of the 41 first-tier and second-tier cities in China were used to obtain the daily precipitation data of the grid point where each city was located. The time coverage of the data was from 1 January 2018 to 31 December 2019. The time resolution was one day, the spatial resolution was 0.1° × 0.1°, and the unit was mm/day.
2.2.3. Collection and Preprocessing of Socioeconomic Data
The socioeconomic data used in this study were derived from the Statistical Communique of the People’s Republic of China on the 2019 National Economic and Social Development [35] issued by the statistical bureaus of the above 41 cities. Population (POP), gross domestic product (GDP), and car ownership data from the report were utilized to measure the level of socioeconomic development of the different cities.
3. Research Methods
3.1. Establishment of the Traffic Vulnerability Evaluation Index
To evaluate the response of the different cities to different rainfall intensities, an urban traffic vulnerability evaluation index in response to rainfall conditions was developed. In this study, we used the daily precipitation and the daily average vehicle speed (traffic congestion index) to establish the traffic vulnerability evaluation index. There are some implications for the evaluation at the daily scale. After precipitation ends, its impact on traffic will still last for a while (dredging of road surface water and evacuation of traffic congestion), and multiple precipitation events can occur in one day. The daily average impact can be assessed by using the daily precipitation and the traffic congestion index. The basic idea of the evaluation index is described below (Figure 2). After performing the rainfall classification, the average value of the traffic congestion index under each precipitation category was calculated. The average value of the traffic congestion index and the rainfall category after the classification statistics were analyzed using regression analysis. The obtained regression coefficient was considered the traffic vulnerability index of the urban traffic affected by rainfall.
3.2. Rainfall Classification and Statistical Analysis
Rainfall refers to the depth of rain falling on a horizontal surface of an area during a specific period. For example, daily rainfall refers to the total amount of rain falling on the horizontal surface of an area in a day in mm/day [36,37].
Within the variation range of the rainfall intensity of each city, the variation range of the rainfall intensity was divided evenly according to the classification interval. Then, the average value of the urban traffic congestion index during each rainfall interval was calculated. In this way, the urban traffic congestion index values of the different cities under different rainfall intervals were obtained.
where N represents the grading number of a city, max represents the maximum daily rainfall of a city from 2018–2019, min represents the minimum daily rainfall of a city from 2018–2019, and interval represents the minimum interval of the grading statistics. To refine and investigate the congestion index of the different rainfall intensities, this study used 1 mm as the minimum interval for classification.
The results of the above classification statistics enabled a comparison (between cities) of the operation of urban traffic in the different cities under the same rainfall intensity. The urban traffic conditions of the same city under the different rainfall intensities were longitudinally compared.
3.3. Ordinary Least Squares (OLS) Regression Analysis
A regression analysis was utilized to analyze the correlation between variables. The ordinary least squares (OLS) method is a linear regression method used to estimate the least squares of unknown parameters in a model. According to the principle of least squares, the OLS determines the parameters of a set of linear functions of explanatory variables so as to achieve the minimum sum of squares of the residuals between the observed dependent variable and the predicted values.
Suppose a set of data, X, is given as follows:
A straight line Equation (3) is obtained by the OLS to fit the points in the data, X, and satisfy the minimum residual sum of squares (RSS) Equation (4). The purpose is to minimize the difference between the true value and the predicted value. It is noted that xi is the independent variable, yi is the dependent variable, and k and ∂ are the parameters that need to be determined using the least square method (also known as the regression coefficients), where k is the slope coefficient and ∂ is the intercept coefficient.
Hypothesis testing was performed on the results of the regression analysis. A value of p < 0.05 was considered statistically significant.
In this vulnerability evaluation index, the slope of the regression coefficient represents the degree of influence of the rainfall intensity on the urban traffic congestion index, i.e., the traffic vulnerability index.
4. Research Results
4.1. Results of the Traffic Vulnerability Evaluation
First, the daily rainfall intensities (1 mm) of working days in the 41 first-tier, new first-tier cities, and second-tier cities in China from 1 January 2018 to 31 December 2019 were classified. The daily averages of the traffic congestion index were counted, and a scatter plot was constructed (Figure 3). The order of the subfigures was arranged according to the tier of the city development (first-tier, new first-tier, and second-tier cities), and each tier was arranged from the north to the south according to the latitude of the city.
For each city, an OLS regression analysis was performed on the result of a hierarchical statistical scatter plot to obtain the k value of the traffic vulnerability index and the p-value of the significance test. Then, the OLS fitting line graph was constructed. The main parameters of OLS regression (slope k, intercept ∂, p-value, and t-value) are summarized in Table A1 in Appendix A, using only the parameters of k and p-value. We also conducted residual normality test QQ plots to evaluate the fit (Figure A1 in Appendix B).
For the subfigures of the cities marked in red in Figure 3, there was a correlation between the traffic congestion index and the rainfall intensity. The urban traffic was affected by precipitation; thus, the traffic vulnerability was relatively high. For the subfigures of the cities marked in black, there was no correlation between the congestion index and the rainfall intensity. Hence, the urban traffic was not affected by rainfall, and thus the traffic vulnerability was low.
The k values of the traffic vulnerability index and the p-values of the significance tests for the 41 first-tier, new first-tier cities, and second-tier cities in China were then calculated (Table 1).
The abovementioned urban traffic vulnerability evaluation results indicate that among China’s first-tier, new first-tier cities, and second-tier cities, a total of 13 cities (i.e., Shanghai, Nanjing, Suzhou, Chongqing, Harbin, Changchun, Jinan, Yangzhou, Nantong, Changzhou, Wenzhou, Xiamen, and Zhongshan) showed significant correlations. In addition, they were significant in the OLS regression analysis (cities marked in red). These results indicate that there was a correlation between the traffic congestion index and the rainfall intensity for these cities. Therefore, urban traffic was significantly affected by rainfall, and the ability to cope with rainfall events was relatively poor. Hence, the urban traffic was relatively fragile for these cities. Moreover, for these cities, a greater value of the traffic vulnerability index, k, meant that the urban traffic congestion index changed faster with an increase in the rainfall intensity, and the traffic was strongly affected by precipitation. For example, Shanghai (a first-tier city) and Chongqing (a new first-tier city) had relatively large traffic vulnerability index k values; hence, both were more vulnerable to urban traffic (compared with Nanjing and Suzhou) under rainfall conditions. Some second-tier cities, such as Harbin, Changchun, and other northeastern cities had relatively large traffic vulnerability indexes, k, and experienced relatively high traffic vulnerabilities compared with other second-tier cities that passed the significance test (e.g., Jinan, Yangzhou, Nantong, Changzhou, Wenzhou, Xiamen, and Zhongshan). In addition, the remaining 28 cities (cities marked in black) showed no correlation between the traffic congestion index and the rainfall intensity for these cities. For these cities, there was no impact of rainfall on urban traffic, and the ability to cope with rainfall events was relatively strong.
4.2. Analysis of the Correlation between Traffic Vulnerability and Socioeconomic Factors
4.2.1. Economic Factor (GDP)
The gross domestic product (GDP), i.e., the market value of all final products produced in a specific region within a certain period, is often used to measure the economic level and social development of a region. By combining the GDP (as an economic measure) with the traffic vulnerability evaluation index, k, this section further investigates whether the level of socioeconomic development has an impact on the urban traffic vulnerability and whether the level of the urban traffic health develops simultaneously with socioeconomic development [38,39].
Depending on the city tier development, all of the 41 cities were classified into first-tier, new first-tier, and second-tier cities. A GDP-vulnerability index scatter diagram was prepared (Figure 4a), and an OLS regression analysis was performed. We also performed residual normality test QQ plots to evaluate the fit (Figure A2). The main parameters of OLS regression (slope k, intercept ∂, p-value, and t-value) are summarized in Table A2; we only use parameters of k and p-value there. The results show that there was a positive correlation between the GDP and the vulnerability index, indicating that GDP development had a low degree of improvement on urban traffic vulnerability. The health of urban traffic did not develop simultaneously with GDP development. Urban traffic vulnerability still requires more in-depth investigations.
Correlation analysis of the GDP-traffic vulnerability index was performed for each tier of cities (Figure 4b–d). The results show that GDP growth produced very small improvements in traffic vulnerability. In addition, there was even a trend of GDP growth and vulnerability enhancement for the first-tier and new first-tier cities; this indicated that the development of the economy had not simultaneously produced healthier urban traffic. There is still an opportunity for improvement in the ability of urban traffic to cope with rainfall and other weather conditions, and the vulnerability of urban traffic requires further improvements. A regression analysis of the second-tier cities did not pass the significance test, and the correlation between the GDP and the traffic vulnerability index was weak.
4.2.2. Population Factor (POP)
The urban population refers to the total number of permanent residents in a city, which is an important indicator to measure the level of urban social development. With the development of urbanization, some large cities and even megacities (i.e., cities with more than ten million urban residents) have emerged in China. By the end of 2019, China’s megacities included Shanghai, Beijing, Guangzhou, Shenzhen, Tianjin, and Chongqing. Due to an increase in the population, this is bound to result in more travelers and a higher travel demand [40,41,42]. Therefore, this section utilizes population as an indicator to measure social development and analyzes the impact of urban population growth on traffic vulnerability. An OLS regression analysis was performed, and the main parameters of OLS regression are summarized in Table A3, using only the parameters of k and p-value. We also conducted residual normality test QQ plots to evaluate the fit (Figure A3).
According to the city tier development, all of the 41 cities were divided into first-tier, new first-tier, and second-tier cities, and a population-vulnerability index scatter diagram was plotted (Figure 5a). According to the scatter diagram, it can be seen that the population sizes of the first-tier (blue dots) and new first-tier (orange dots) cities were much higher than those of the second-tier cities (green dots). Among them, Chongqing had the largest population among the new first-tier cities. Chongqing’s population includes the residents of the primary urban area, remote Wanzhou, Qianjiang, and other areas. The macro trend showed that the vulnerability of urban traffic increased with an increase in population.
The correlations between population and the traffic vulnerability index among the cities of each tier were also analyzed (Figure 5b–d). The results demonstrate that first-tier, new first-tier, and second-tier cities all exhibited a trend in population growth and an enhancement in the urban traffic vulnerability. The following conclusions can be drawn. The traffic vulnerabilities of China’s main first-tier, new first-tier, and second-tier cities are significantly affected by the urban populations. The first-tier cities are megacities with high-density urban populations. The greater the urban population, the greater the travel demand, and the impact of rainfall on the traffic vulnerability is more profound. For the second-tier cities, the population densities were relatively low, and the travel demand was also lower than that of the first-tier cities. However, as the population increased, the traffic vulnerability index also increased. Therefore, controlling the urban population can alleviate the traffic vulnerability of megacities to a certain extent and improve the traffic vulnerability of first-tier and new first-tier cities. Additionally, the construction of transport infrastructure in the second-tier cities is still incomplete, so there is an opportunity for improvement in the capacity of the urban traffic to carry more people.
4.2.3. The Car Ownership Factor
As an indicator to measure the level of social development, car ownership is closely related to the level of economic development level and the population of a city [43,44,45]. According to the Statistical Communique of the People’s Republic of China on the 2019 National Economic and Social Development, there were 30 cities with more than two million vehicles in China in 2019. Among them, 11 cities (i.e., Beijing, Chengdu, Chongqing, Suzhou, Shanghai, Zhengzhou, Shenzhen, Xi’an, Wuhan, Dongguan, and Tianjin) had more than three million vehicles [35].
This section analyzes whether car ownership has an impact on traffic vulnerability. For the 41 first-tier, new first-tier, and second-tier cities, the scatter plots of car ownership and the traffic vulnerability index of each city were plotted, the OLS correlation analysis was performed on the scattered points (Figure 6a), and the main parameters of OLS regression are summarized in Table A4; we also conducted residual normality test QQ plots to evaluate the fit (Figure A4).
The results demonstrate that car ownership was correlated with the degree of urban traffic vulnerability.
An OLS regression analysis was also performed on car ownership and the traffic vulnerability index for first-tier, new first-tier, and second-tier cities (Figure 6b–d). The results indicate that there were no obvious correlations between car ownership and the traffic vulnerability index in all tiers of cities. Therefore, car ownership had little impact on the vulnerability of urban traffic in response to rainy weather. In addition, some urban traffic restrictions had some impact on the results of this study to some extent.
5. Discussion
In this study, we used two-year daily precipitation and hourly traffic data from 41 cities. The amount of data is statistically sufficient. We focused on working days, excluding the influence of holidays and weekends. All of these guarantee the robustness of the research results. We proposed an urban traffic vulnerability evaluation index under rainy weather and combined it with socio-economic factors to understand traffic vulnerability. The study enriches the content of urban physical examinations and provides some theoretical basis for urban health and sustainable development. It is also of great significance when planning the construction of sponge and resilient cities.
There are several research topics that can be explored in the future. First, traffic vulnerability of working days was used for the evaluation. Therefore, future studies could evaluate the traffic vulnerability of weekends and holidays. Furthermore, the vulnerability due to precipitation of urban traffic in morning and evening peak conditions of working days could be evaluated in the future. Second, the evaluation method could be extended to other cities.
6. Conclusions
This study established a set of urban traffic vulnerability evaluation indices to evaluate the traffic vulnerability of 41 cities in China. The results suggest that there were 13 cities (i.e., Shanghai, Nanjing, Suzhou, Chongqing, Harbin, Changchun, Jinan, Yangzhou, Nantong, Changzhou, Wenzhou, Xiamen, and Zhongshan) whose traffic was significantly affected by rainfall, while the traffic of the remaining 28 cities was not.
The impact of these socio-economic factors on urban traffic vulnerability was analyzed as well. The following conclusions were made. First, the GDP had a limited effect on improving the traffic vulnerability. For the first-tier and new first-tier cities, the traffic vulnerability became serious with GDP growth. For the second-tier cities, the traffic vulnerability was less affected by the GDP. Second, the size of the urban population had a significant impact on urban traffic vulnerability. For the first-tier and new first-tier cities, the size of the population had a greater impact on the traffic vulnerability; for the second-tier cities, they can improve the capacity of urban traffic by transport infrastructure construction to carry more people. Third, urban car ownership had little impact on urban traffic vulnerability.
Policy recommendations to improve urban traffic vulnerability in response to rainfall are proposed. First, we need to pursue economic growth and the healthy development of transportation simultaneously and shift construction of transportation infrastructure from large-scale development to structural optimization. In addition, the development of smart and digital transportation modes should be pursued [46]. Second, we should control the population size of megacities. Relocating the population of megacities to the surrounding second-tier cities and increasing the construction of the second-tier cities’ transportation infrastructure could enhance the traffic resilience of China’s megacities and help promote the balanced and coordinated development of a region [47]. For example, in the Yangtze River Delta region of China, the population can be diverted from Shanghai to neighboring places (e.g., Jiaxing, Wuxi, Jinhua, Shaoxing, and Taizhou). In the Pearl River Delta region of China, the population can be diverted from Shenzhen to neighboring cities (e.g., Dongguan, Huizhou, and Foshan).
Author Contributions
Conceptualization, methodology, M.Z., Y.B., Y.W. and Y.X.; software, Y.L.; validation, M.Z. and Y.L.; formal analysis, M.Z.; investigation, M.Z.; resources, Y.B. and Y.W.; data curation, W.S. and C.J.; writing—original draft preparation, M.Z.; writing—review and editing, Y.W., Y.X. and Y.B.; visualization, M.Z.; supervision, Y.B.; project administration, Y.B.; funding acquisition, Y.B. All authors have read and agreed to the published version of the manuscript.
Funding
This work was supported by The National Key Research and Development Program of China (Grant No. 2019YFE0126400).
Institutional Review Board Statement
Not applicable.
Informed Consent Statement
Not applicable.
Data Availability Statement
The data used in this research can be found in the Baidu Map Smart Transportation Platform (https://jiaotong.baidu.com/, accessed on 23 January 2021) and NASA’s Global Precipitation Measurement (https://gpm.nasa.gov/data/directory, accessed on 15 January 2021).
Acknowledgments
The authors would like to thank the editors and anonymous reviewers for their constructive comments and suggestions that greatly improved this manuscript.
Conflicts of Interest
The authors declare no conflict of interest.
Appendix A. Summary of OLS Regression

Table A1.
Summary of OLS regression analysis used in the traffic vulnerability evaluation index.
| City Name | k | p | t | |
|---|---|---|---|---|
| Beijing | 0.0014 | 1.4581 | 0.2780 | 1.1151 |
| Shanghai | 0.0021 | 1.3048 | 0.0027 | 3.1925 |
| Guangzhou | 0.0002 | 1.3753 | 0.6306 | 0.4841 |
| Shenzhen | 0.0004 | 1.2857 | 0.1661 | 1.4107 |
| Shenyang | 0.0005 | 1.3014 | 0.5116 | 0.6658 |
| Tianjin | 0.0002 | 1.3024 | 0.7588 | 0.3109 |
| Qingdao | 0.0003 | 1.2099 | 0.4993 | 0.6856 |
| Zhengzhou | 0.0002 | 1.2558 | 0.7375 | 0.3387 |
| Xi’an | 0.0003 | 1.3069 | 0.7609 | 0.3075 |
| Nanjing | 0.0009 | 1.2751 | 0.0033 | 3.1708 |
| Suzhou | 0.0011 | 1.1300 | 0.0026 | 3.2321 |
| Chengdu | 0.0004 | 1.2803 | 0.1228 | 1.5801 |
| Wuhan | 0.0006 | 1.2880 | 0.1078 | 1.6544 |
| Hangzhou | 0.0005 | 1.3155 | 0.1339 | 1.5265 |
| Ningbo | 0.0000 | 1.1374 | 0.6817 | 0.4132 |
| Chongqing | 0.0017 | 1.3686 | 0.0142 | 2.5761 |
| Dongguan | 0.0002 | 1.2566 | 0.2623 | 1.1352 |
| Harbin | 0.0015 | 1.3694 | 0.0017 | 3.5083 |
| Changchun | 0.0015 | 1.3611 | 0.0120 | 2.6949 |
| Taiyuan | 0.0003 | 1.2471 | 0.7989 | 0.2579 |
| Jinan | 0.0010 | 1.2500 | 0.0347 | 2.2583 |
| Xuzhou | 0.0005 | 1.2617 | 0.2115 | 1.2759 |
| Yangzhou | 0.0006 | 1.1103 | 0.0204 | 2.4371 |
| Nantong | 0.0006 | 1.0944 | 0.0251 | 2.3473 |
| Hefei | 0.0009 | 1.2778 | 0.0590 | 1.9498 |
| Changzhou | 0.0008 | 1.0686 | 0.0035 | 3.1573 |
| Wuxi | 0.0002 | 1.1243 | 0.5085 | 0.6685 |
| Jiaxing | 0.0002 | 1.1002 | 0.7128 | 0.3708 |
| Shaoxing | 0.0003 | 1.1160 | 0.2204 | 1.2444 |
| Jinhua | 0.0004 | 1.0804 | 0.1341 | 1.5282 |
| Nanchang | 0.0005 | 1.2214 | 0.0774 | 1.8100 |
| Taizhou | 0.0001 | 1.1554 | 0.3086 | 1.0307 |
| Wenzhou | 0.0005 | 1.1585 | 0.0341 | 2.1891 |
| Guiyang | 0.0001 | 1.4077 | 0.8110 | 0.2408 |
| Fuzhou | 0.0004 | 1.2907 | 0.4845 | 0.7051 |
| Quanzhou | 0.0007 | 1.2209 | 0.0667 | 1.8851 |
| Xiamen | 0.0009 | 1.2673 | 0.0429 | 2.0946 |
| Huizhou | 0.0002 | 1.2170 | 0.1346 | 1.5236 |
| Foshan | 0.0001 | 1.2998 | 0.6547 | 0.4502 |
| Nanning | 0.0003 | 1.3267 | 0.3509 | 0.9458 |
| Zhongshan | 0.0004 | 1.1960 | 0.0341 | 2.1849 |
k, coefficients of OLS; , intercept of OLS. p, p-value of the significance test; t, t-value of significance test.
Table A2.
Summary of OLS regression analysis between traffic vulnerability index and GDP.
| City Level | k | p | t | |
|---|---|---|---|---|
| first-tier | 1.28 × 10⁻⁷ | −2.95 × 10⁻³ | 0.0214 | 6.7251 |
| new first-tier | 7.43 × 10⁻⁸ | −5.05 × 10⁻⁴ | 0.0036 | 3.6783 |
| second-tier | 1.80 × 10⁻⁸ | 4.19 × 10⁻⁴ | 0.6066 | 0.5225 |
| all city | 2.86 × 10⁻⁸ | 2.57 × 10⁻⁴ | 0.0014 | 3.4527 |
k, coefficients of OLS; , intercept of OLS. p, p-value of the significance test; t, t-value of significance test.
Table A3.
Summary of OLS regression analysis between traffic vulnerability index and POP.
| City Level | k | p | t | |
|---|---|---|---|---|
| first-tier | 1.62 × 10⁻⁶ | −1.97 × 10⁻³ | 0.0328 | 5.3866 |
| new first-tier | 4.49 × 10⁻⁷ | −3.62 × 10⁻⁵ | 0.0121 | 3.0009 |
| second-tier | 8.96 × 10⁻⁷ | −4.95 × 10⁻⁵ | 0.0378 | 2.2102 |
| all city | 4.57 × 10⁻⁷ | 1.42 × 10⁻⁴ | 0.0002 | 4.1637 |
k, coefficients of OLS; , intercept of OLS. p, p-value of the significance test; t, t-value of significance test.
Table A4.
Summary of OLS regression analysis between traffic vulnerability index and car ownership.
| City Level | k | p | t | |
|---|---|---|---|---|
| first-tier | 4.06 × 10⁻⁶ | −6.36 × 10⁻⁴ | 0.3879 | 1.0948 |
| new first-tier | 2.20 × 10⁻⁶ | −2.27 × 10⁻⁴ | 0.1816 | 1.4261 |
| second-tier | 1.04 × 10⁻⁶ | 3.53 × 10⁻⁴ | 0.6071 | 0.5217 |
| all city | 1.44 × 10⁻⁶ | 2.18 × 10⁻⁴ | 0.0327 | 2.2146 |
k, coefficients of OLS; , intercept of OLS..p, p-value of the significance test; t, t-value of significance test.
Appendix B. QQ Plots for OLS Regression
Figure A1.
The QQ plots for OLS regression (traffic vulnerability evaluation index).

Figure A2.
The QQ plots for OLS regression between traffic vulnerability index and GDP.

Figure A3.
The QQ plots for OLS regression between traffic vulnerability index and POP.

Figure A4.
The QQ plots for OLS regression between traffic vulnerability index and car ownership.

References
- National Bureau of Statistics of China. Statistical Communique of the People’s Republic of China on the 2020 National Economic and Social Development. Available online: http://www.stats.gov.cn/tjsj/tjcbw/202103/t20210331_1815847.html (accessed on 31 March 2021).
- Chen, M.; Gong, Y.; Lu, D.; Ye, C. Build a people-oriented urbanization: China’s new-type urbanization dream and Anhui model. Land Use Policy 2019, 80, 1–9. [Google Scholar] [CrossRef]
- Guan, X.; Wei, H.; Lu, S.; Dai, Q.; Su, H. Assessment on the urbanization strategy in China: Achievements, challenges and reflections. Habitat Int. 2018, 71, 97–109. [Google Scholar] [CrossRef]
- Zijlema, W.L.; Klijs, B.; Stolk, R.P.; Rosmalen, J.G.M. (Un)Healthy in the City: Respiratory, Cardiometabolic and Mental Health Associated with Urbanity. PLoS ONE 2015, 10, e143910. [Google Scholar] [CrossRef]
- Yang, J.; Siri, J.G.; Remais, J.V.; Cheng, Q.; Zhang, H.; Chan, K.K.Y.; Sun, Z.; Zhao, Y.; Cong, N.; Li, X.; et al. The Tsinghua-Lancet Commission on Healthy Cities in China: Unlocking the power of cities for a healthy China. Lancet 2018, 391, 2140–2184. [Google Scholar] [CrossRef] [Green Version]
- Hou, B.; Nazroo, J.; Banks, J.; Marshall, A. Are cities good for health? A study of the impacts of planned urbanization in China. Int. J. Epidemiol. 2019, 48, 1083–1090. [Google Scholar] [CrossRef]
- Wu, T.; Perrings, C.; Kinzig, A.; Collins, J.P.; Minteer, B.A.; Daszak, P. Economic growth, urbanization, globalization, and the risks of emerging infectious diseases in China: A review. AMBIO 2017, 46, 18–29. [Google Scholar] [CrossRef]
- Wang, H.; Yu, Y. Increasing health inequality in China: An empirical study with ordinal data. J. Econ. Inequal. 2016, 14, 41–61. [Google Scholar] [CrossRef]
- Wang, H.; Naghavi, M.; Allen, C.; Barber, R.M.; Bhutta, Z.A.; Carter, A.; Casey, D.C.; Charlson, F.J.; Chen, A.Z.; Coates, M.M.; et al. Global, regional, and national life expectancy, all-cause mortality, and cause-specific mortality for 249 causes of death, 1980–2015: A systematic analysis for the Global Burden of Disease Study 2015. Lancet 2016, 388, 1459–1544. [Google Scholar] [CrossRef] [Green Version]
- WHO. Promoting Health in the Urban Context; FADL Publishers: Copenhagen, Denmark, 1988; Available online: https://glocalhealthconsultants.com/wp-content/uploads/2016/03/promoting-health-in-the-urban-context.pdf (accessed on 26 December 2020).
- Gong, P.; Liang, S.; Carlton, E.J.; Jiang, Q.; Wu, J.; Wang, L.; Remais, J.V. Urbanisation and health in China. Lancet 2012, 379, 843–852. [Google Scholar] [CrossRef]
- Yuming, W.; Xinxin, W.; Fangxia, G. The beneficial evaluation of the healthy city construction in China. Iran. J. Public Health 2017, 46, 843. [Google Scholar]
- Central People’s Government of the People’s Republic of China. Central Committee of the Communist Party of China and the state Council Issued Healthy China 2030 Planning Outline. 2016. Available online: http://www.gov.cn/xinwen/2016-10/25/content_5124174.htm (accessed on 12 January 2021).
- Ministry of Housing and Urban-Rural Development of China. Letter of the Ministry of Housing and Urban-Rural Development on Supporting 2020 Urban Physical Examination. Available online: http://www.mohurd.gov.cn/wjfb/202006/t20200618_245945.html (accessed on 15 January 2021).
- Yang, M.; Ma, T.; Sun, C. Evaluating the impact of urban traffic investment on SO2 emissions in China cities. Energy Policy 2018, 113, 20–27. [Google Scholar] [CrossRef]
- Fernández, R.Á.; Caraballo, S.C.; López, F.C. A probabilistic approach for determining the influence of urban traffic management policies on energy consumption and greenhouse gas emissions from a battery electric vehicle. J. Clean. Prod. 2019, 236, 117604. [Google Scholar] [CrossRef]
- Tang, J.; McNabola, A.; Misstear, B. The potential impacts of different traffic management strategies on air pollution and public health for a more sustainable city: A modelling case study from Dublin, Ireland. Sustain. Cities Soc. 2020, 60, 102229. [Google Scholar] [CrossRef]
- Zhang, Z.; Khlystov, A.; Norford, L.K.; Tan, Z.; Balasubramanian, R. Characterization of traffic-related ambient fine particulate matter (PM2. 5) in an Asian city: Environmental and health implications. Atmos. Env. 2017, 161, 132–143. [Google Scholar] [CrossRef]
- Rossi, I.A.; Vienneau, D.; Ragettli, M.S.; Flückiger, B.; Röösli, M. Estimating the health benefits associated with a speed limit reduction to thirty kilometres per hour: A health impact assessment of noise and road traffic crashes for the Swiss city of Lausanne. Environ. Int. 2020, 145, 106126. [Google Scholar] [CrossRef] [PubMed]
- Zheng, S.; Kahn, M.E.; Sun, W.; Luo, D. Incentives for China’s urban mayors to mitigate pollution externalities: The role of the central government and public environmentalism. Reg. Sci. Urban Econ. 2014, 47, 61–71. [Google Scholar] [CrossRef]
- Chang, Y.S.; Lee, Y.J.; Choi, S.S.B. Is there more traffic congestion in larger cities?-Scaling analysis of the 101 largest US urban centers. Transp. Policy 2017, 59, 54–63. [Google Scholar] [CrossRef]
- Zhu, L.; Hu, D. Study on the vehicle routing problem considering congestion and emission factors. Int. J. Prod. Res. 2019, 57, 6115–6129. [Google Scholar] [CrossRef]
- Xing, Y.; Liang, H.; Xu, D. Sustainable Development Evaluation of Urban Traffic System. Procedia Soc. Behav. Sci. 2013, 96, 496–504. [Google Scholar] [CrossRef] [Green Version]
- Yang, J.; Luo, X.; Xiao, Y.; Shen, S.; Su, M.; Bai, Y.; Gong, P. Comparing the Use of Spatially Explicit Indicators and Conventional Indicators in the Evaluation of Healthy Cities: A Case Study in Shenzhen, China. Int. J. Environ. Res. Public Health 2020, 17, 7409. [Google Scholar] [CrossRef]
- He, F.; Yan, X.; Liu, Y.; Ma, L. A traffic congestion assessment method for urban road networks based on speed performance index. Procedia Eng. 2016, 137, 425–433. [Google Scholar] [CrossRef] [Green Version]
- Han, Z.; Sharif, H.O. Investigation of the Relationship between Rainfall and Fatal Crashes in Texas, 1994–2018. Sustainability 2020, 12, 7976. [Google Scholar] [CrossRef]
- Jin, P.; Mangla, S.K.; Song, M. Moving towards a sustainable and innovative city: Internal urban traffic accessibility and high-level innovation based on platform monitoring data. Int. J. Prod. Econ. 2021, 235, 108086. [Google Scholar] [CrossRef]
- Zhang, W.; Li, R.; Shang, P.; Liu, H. Impact Analysis of Rainfall on Traffic Flow Characteristics in Beijing. Int. J. Intell. Transp. Syst. Res. 2019, 17, 150–160. [Google Scholar] [CrossRef]
- Zhang, J.; Song, G.; Gong, D.; Gao, Y.; Yu, L.; Guo, J. Analysis of rainfall effects on road travel speed in Beijing, China. IET Intell. Transp. Syst. 2018, 12, 93–102. [Google Scholar] [CrossRef]
- Hussain, E.; Ahmed, S.I.; Ali, M.S. Modeling the effects of rainfall on vehicular traffic. J. Mod. Transp. 2018, 26, 133–146. [Google Scholar] [CrossRef] [Green Version]
- Chung, Y. Assessment of non-recurrent congestion caused by precipitation using archived weather and traffic flow data. Transp. Policy 2012, 19, 167–173. [Google Scholar] [CrossRef]
- Baidu Map. Report on Urban Traffic in China in 2019. 2020. Available online: http://huiyan.baidu.com/cms/report/2019annualtrafficreport/index.html (accessed on 23 January 2021).
- Baidu Map. Report on Urban Traffic in China in 2018. 2019. Available online: http://huiyan.baidu.com/cms/report/2018annualtrafficreport/index.html (accessed on 23 January 2021).
- Huffman, G.J.; Bolvin, D.T.; Nelkin, E.J. Integrated Multi-satellitE Retrievals for GPM (IMERG) technical documentation. NASA/GSFC Code 2015, 612, 2019. [Google Scholar]
- National Bureau of Statistics of China. Statistical Communique of the People’s Republic of China on the 2019 National Economic and Social Development. Available online: http://www.stats.gov.cn/tjsj/zxfb/202002/t20200228_1728913.html (accessed on 15 January 2021).
- Chen, Y.; Xu, M.; Wang, Z.; Gao, P.; Lai, C. Applicability of two satellite-based precipitation products for assessing rainfall erosivity in China. Sci. Total Environ. 2021, 757, 143975. [Google Scholar] [CrossRef]
- Li, P.; Xu, Z.; Ye, C.; Ren, M.; Chen, H.; Wang, J.; Song, S. Assessment on IMERG V06 Precipitation Products Using Rain Gauge Data in Jinan City, Shandong Province, China. Remote Sens. 2021, 13, 1241. [Google Scholar] [CrossRef]
- Ma, Y.; Xu, R. Remote sensing monitoring and driving force analysis of urban expansion in Guangzhou City, China. Habitat Int. 2010, 34, 228–235. [Google Scholar] [CrossRef]
- Marshall, W.E.; Dumbaugh, E. Revisiting the relationship between traffic congestion and the economy: A longitudinal examination of US metropolitan areas. Transportation 2020, 47, 275–314. [Google Scholar] [CrossRef]
- Chang, Y.S.; Jo, S.J.; Lee, Y.; Lee, Y. Population Density or Populations Size. Which Factor Determines Urban Traffic Congestion? Sustainability 2021, 13, 4280. [Google Scholar] [CrossRef]
- Li, Y.; Xiong, W.; Wang, X. Does polycentric and compact development alleviate urban traffic congestion? A case study of 98 Chinese cities. Cities 2019, 88, 100–111. [Google Scholar] [CrossRef]
- Vencataya, L.; Pudaruth, S.; Dirpal, G.; Narain, V. Assessing the causes & impacts of traffic congestion on the society, economy and individual: A case study as an emerging economy. Stud. Bus. Econ. 2019, 13, 230–242. [Google Scholar] [CrossRef] [Green Version]
- Pucher, J.; Peng, Z.R.; Mittal, N.; Zhu, Y.; Korattyswaroopam, N. Urban transport trends and policies in China and India: Impacts of rapid economic growth. Transp. Rev. 2007, 27, 379–410. [Google Scholar] [CrossRef]
- Rahman, M.M.; Najaf, P.; Fields, M.G.; Thill, J. Traffic congestion and its urban scale factors: Empirical evidence from American urban areas. Int. J. Sustain. Transp. 2021, 1–16. [Google Scholar] [CrossRef]
- Chng, S.; Abraham, C.; White, M.P.; Skippon, S. To drive or not to drive? A qualitative comparison of car ownership and transport experiences in London and Singapore. Transp. Res. Interdiscip. Perspect. 2019, 2, 100030. [Google Scholar] [CrossRef]
- Chang, J.; Kadry, S.N.; Krishnamoorthy, S. Review and synthesis of Big Data analytics and computing for smart sustainable cities. IET Intell. Transp. Syst. 2020, 14, 1363–1370. [Google Scholar] [CrossRef]
- Hu, B.; Zhang, S.; Ding, Y.; Zhang, M.; Dong, X.; Sun, H. Research on the coupling degree of regional taxi demand and social development from the perspective of job–housing travels. Phys. A Stat. Mech. Its Appl. 2021, 564, 125493. [Google Scholar] [CrossRef]
Figure 1.
Distribution map of the study area.

Figure 2.
Flow chart of the construction of the traffic vulnerability evaluation index.

Figure 3.
Statistical scatter plots and the ordinary least squares (OLS) regression analysis plots of the rainfall intensities and traffic congestion indexes of the 41 cities.
Figure 3.
Statistical scatter plots and the ordinary least squares (OLS) regression analysis plots of the rainfall intensities and traffic congestion indexes of the 41 cities.

Figure 4.
Correlation analysis of the gross domestic product (GDP)-traffic vulnerability indexes: (a) all cities GDP-vulnerability index OLS analysis; (b) first-tier cities GDP-vulnerability index OLS analysis; (c) new first-tier cities GDP-vulnerability index OLS analysis; (d) second-tier cities GDP-vulnerability index OLS analysis.


Figure 5.
Correlation analysis of all the city’s population-traffic vulnerability indexes: (a) all cities population (POP)-vulnerability index OLS analysis; (b) first-tier cities POP-vulnerability index OLS analysis; (c) new first-tier cities POP-vulnerability index OLs analysis; (d) first-tier cities POP-vulnerability index OLS analysis.

Figure 6.
Correlation analysis of all the cities car ownership-traffic vulnerability indexes: (a) all cities car ownership -vulnerability index OLS analysis; (b) first-tier cities car ownership-vulnerability index OLS analysis; (c) new first-tier cities car ownership-vulnerability index OLS analysis; (d) second-tier cities car ownership vulnerability Index OLS analysis.


Table 1.
The traffic vulnerability indices (k) of the 41 cities.
| City Name | Traffic Vulnerability Index k | p | City Name | Traffic Vulnerability Index k | p |
|---|---|---|---|---|---|
| Beijing | 0.0014 | 0.2780 | Xuzhou | 0.0005 | 0.2115 |
| Shanghai | 0.0021 | 0.0027 | Yangzhou | 0.0006 | 0.0204 |
| Guangzhou | 0.0002 | 0.6306 | Nantong | 0.0006 | 0.0251 |
| Shenzhen | 0.0004 | 0.1661 | Hefei | 0.0009 | 0.0590 |
| Shenyang | 0.0005 | 0.5116 | Changzhou | 0.0008 | 0.0035 |
| Tianjin | 0.0002 | 0.7588 | Wuxi | 0.0002 | 0.5085 |
| Qingdao | 0.0003 | 0.4993 | Jiaxing | 0.0002 | 0.7128 |
| Zhengzhou | 0.0002 | 0.7375 | Shaoxing | 0.0003 | 0.2204 |
| Xi’an | 0.0003 | 0.7609 | Jinhua | 0.0004 | 0.1341 |
| Nanjing | 0.0009 | 0.0033 | Nanchang | 0.0005 | 0.0774 |
| Suzhou | 0.0011 | 0.0026 | Taizhou | 0.0001 | 0.3086 |
| Chengdu | 0.0004 | 0.1228 | Wenzhou | 0.0005 | 0.0341 |
| Wuhan | 0.0006 | 0.1078 | Guiyang | 0.0001 | 0.8110 |
| Hangzhou | 0.0005 | 0.1339 | Fuzhou | 0.0004 | 0.4845 |
| Ningbo | 0.0000 | 0.6817 | Quanzhou | 0.0007 | 0.0667 |
| Chongqing | 0.0017 | 0.0142 | Xiamen | 0.0009 | 0.0429 |
| Dongguan | 0.0002 | 0.2623 | Huizhou | 0.0002 | 0.1346 |
| Harbin | 0.0015 | 0.0017 | Foshan | 0.0001 | 0.6547 |
| Changchun | 0.0015 | 0.0120 | Nanning | 0.0003 | 0.3509 |
| Taiyuan | 0.0003 | 0.7989 | Zhongshan | 0.0004 | 0.0341 |
| Jinan | 0.0010 | 0.0347 |
The traffic vulnerability indices in the cities passing the significance test are marked in bold.
Publisher’s Note: MDPI stays neutral with regard to jurisdictional claims in published maps and institutional affiliations. |
© 2021 by the authors. Licensee MDPI, Basel, Switzerland. This article is an open access article distributed under the terms and conditions of the Creative Commons Attribution (CC BY) license (https://creativecommons.org/licenses/by/4.0/).
Share and Cite
MDPI and ACS Style
Zhang, M.; Liu, Y.; Sun, W.; Xiao, Y.; Jiang, C.; Wang, Y.; Bai, Y. Impact of Rainfall on Traffic Speed in Major Cities of China. Sustainability 2021, 13, 9074. https://0-doi-org.brum.beds.ac.uk/10.3390/su13169074
AMA Style
Zhang M, Liu Y, Sun W, Xiao Y, Jiang C, Wang Y, Bai Y. Impact of Rainfall on Traffic Speed in Major Cities of China. Sustainability. 2021; 13(16):9074. https://0-doi-org.brum.beds.ac.uk/10.3390/su13169074
Chicago/Turabian StyleZhang, Min, Yufu Liu, Wenqi Sun, Yixiong Xiao, Chang Jiang, Yong Wang, and Yuqi Bai. 2021. "Impact of Rainfall on Traffic Speed in Major Cities of China" Sustainability 13, no. 16: 9074. https://0-doi-org.brum.beds.ac.uk/10.3390/su13169074
Note that from the first issue of 2016, this journal uses article numbers instead of page numbers. See further details here.