
Factors Affecting Drivers to Participate in a Carpooling to Public Transport Service


Centre for Research and Technology Hellas, Hellenic Institute of Transport, 57001 Thessaloniki, Greece
*
Author to whom correspondence should be addressed.
Sustainability 2021, 13(16), 9129; https://0-doi-org.brum.beds.ac.uk/10.3390/su13169129
Submission received: 24 June 2021
/
Revised: 12 August 2021
/
Accepted: 12 August 2021
/
Published: 14 August 2021
(This article belongs to the Special Issue Shared Mobility)
Abstract
:Several studies have focused on understanding travelers’ attitudes and characteristics toward using carpooling services. However, few of these studies have focused the driver’s behavior and carpooling services that are organized to feed public transport. This research investigates the willingness of drivers to accept a carpooling ride, as part of their trip, to/from public transport stations (i.e., rail, tram and metro). Data from the EU project Ride2Rail are used, for which a survey (n = 327) was conducted in EU27 and the UK. Fisher’s exact and chi-square tests are used to explore the relationships between drivers/non-drivers and explanatory variables. A binary logit model is developed to estimate the likelihood of carpooling as a driver to/from a public transport station. The results show that delay, convenience, residence location, security and the number of passengers influence the drivers’ decision toward using their private vehicle in carpooling services. Findings provide concrete recommendations for carpooling drivers regarding the planning of a successful carpooling service. The recommendations to “recruit” the drivers become significant, as the concept of carpooling cannot be realized without them.
1. Introduction
During the last decade, innovative mobility solutions were introduced, including on-demand mobility services and Mobility-as-a-Service (MaaS), which promote mobility solutions based on traveler’s needs. In this direction, innovative forms of mobility have developed and operated mostly in urban areas, including ridesharing, carpooling, bike-sharing and ride-hailing. The design and development of carpooling services have been fueled by the need to promote sustainability and multimodality, and to improve the efficiency of the transport system in urban areas by minimizing negative impacts, including emissions, travelling costs and congestion [1], and increasing passenger vehicle occupancy and public transit ridership. Carpooling services combine the flexibility and speed of private cars with the reduced cost of fixed-line systems [2].
In this study, carpooling refers to a mode of transport in which individual travelers (i.e., driver and passengers) share a vehicle for a trip and split travel costs, such as gas, tolls and parking fees, with others that have similar itineraries and time schedules [3,4]. The drivers are considered independent private entities, and they do not transport people for any kind of profit [4]. This approach is different from most traditional forms of passenger transport, where an authority or an organization owns vehicles and/or employs drivers. Such services, also referred to as ride-hailing services, aim to the financial gain for drivers (e.g., Uber, Lyft and Didi).
Carpoolers may offer a ride as a driver or request transport as a passenger. If the driver and passenger agree on the proposed arrangement, then the driver picks up the passenger at the agreed time and location. Drivers’ service hours focus usually on commuting times. Several surveys have been conducted to study the passenger’s behavior. However, fewer studies have focused on the driver’s behavior [5,6,7].
This study aims to contribute to the literature related to carpooling by investigating factors that affect drivers to accept a carpooling ride, as part of their trip, and transfer passengers to/from public stations. More specifically, the transportation of persons in the drivers’ vehicle is incidental and does not mandate the use of public transport for drivers. The carpooling service aims to organize rides that take passengers to/from the rail/metro/tram station to complete the first/last mile of their journey. Thus, in the remainder of the paper, public transport refers to rail modes, such as rail, suburban rail, metro and tram. The measurement and comparison of these factors will contribute to the development of successful carpooling services that will potentially increase ridership of public transport, thus creating a more sustainable transport system.
In the remainder of this paper, Section 2 provides a summary of literature findings on carpooling passenger and driver factors and highlights literature limitations. The method of the study is presented in Section 3, including the survey, sample and statistical model. The results of the analysis and findings are shown in Section 4. More specifically, Section 4 presents the factors that affect drivers toward participating in carpooling rides to public transport and respective statistics. Section 5 concludes with a discussion of our findings and recommendations for providing a successful carpooling service.
2. Literature Review
The relationship that exists between demographic and behavioral characteristics and carpooling appears to be controversial, according to the findings of the surveyed literature. Carpooling research results on passengers’ characteristics and attributes tend to refer to identical factors, which can be categorized in various ways. For example, the authors of [8] classified carpooling factors as sociodemographic, spatial, temporal, automobile availability and attitudinal, whereas the authors of [9] grouped them into internal or external factors to the commuter. With respect to personal characteristics, the authors of [10] indicated that socioeconomic characteristics do not play a significant role in the choice of carpooling, which agrees with other studies [11].
However, some studies have concluded that sociodemographic factors relate to carpooling. For example, younger and older people tend to be passengers, while middle-aged people tend to be drivers. In terms of marital status, travelers between the ages of 25 and 34 were more likely to make trips (96%) versus non-commute trips (80%) using carpooling services, and they were more likely to be single or married without children [12]. Another factor, for which findings vary in the literature, is the age of travelers. Females, young workers and those who live with others are more likely to carpool [13]. However, the authors of [14] found that female individuals in Switzerland are less attracted to carpooling, possibly due to security concerns.
Psychological barriers and attitudes affect the decision to choose a mode [15,16] and use carpooling services more than sociodemographic factors [17]. Research has shown that enjoying travel with others, environmental considerations [18,19] and socializing [4] significantly affect the choice to use carpooling services [20].
Other important factors for carpooling include security and trust [21]. In addition, flexibility in working schedule and concerns about sustainability have a significant impact on the tendency to use real-time carpooling systems [12]. Research has also shown that information sharing by travelers (i.e., time and place of the ride, and information on interests and preferences), increases the likelihood for a matched ride [22]. Transport cost and travel time have been found to be associated with carpooling, being two of the main reasons for participating in carpooling services [11,23].
Several incentives have been provided to carpooling passengers, including reward programs that may provide money or gift cards for carpooling and access to green zones. Such incentives have shown that carpooling may attract participants from either single-occupancy vehicles and/or public transit [5,24,25].
Among the studies that have focused on carpooling passengers, few have investigated factors for drivers. Practical experiences have shown that carpooling trips are usually prearranged through matching applications, which allow drivers and passengers to find potential rides. Sharing roles, as opposed to drive-only or travel-only, affect the success of carpooling and appear to be the preferred approach by carpoolers. Carpoolers look to acquire both the economic advantages of driving some of the time and the perceived psychological/comfort benefit of being a traveler [26].
Individual workers citing a preference for driving or riding all of the time had less success with carpooling than workers who indicated a preference for shared responsibilities. Respondents with a preference for driving only or riding only were nearly 50% and 53% less likely, respectively, to have carpooled than those willing to share in the responsibilities [8]. A survey of carpoolers in the US found that 60% participated as passengers, while 12% were drivers, and 28% were both passengers and drivers. Drivers indicated departure time flexibility as the primary reason for driving instead of riding [27]. Approximately 33% of the respondents stated that they would rather not offer a ride in the evening (18:00 to 24:00), while more than 52% of ride passengers stated that they would not accept a ride in the evening (18:00 to 24:00) [25].
For drivers, a rider’s profile is an important factor. Riders whose social network profile appears unattractive or incomplete have a lower chance of finding a ride offer. Therefore, it becomes essential for potential ride travelers to have a trustworthy profile, including a picture and education or job details, and contact information on a social network (e.g., LinkedIn, Facebook or Instagram). Similarly, the driver’s profile plays the most significant role in one’s decision to accept an offered ride [12,28]. This challenge has been largely addressed through the development of increasingly sophisticated ride-matching systems. Other studies have concluded that younger and older people tend to be passengers, while middle-aged people tend to be drivers [12]. Finally, drivers appear to avoid sometimes carpooling, as they do not like delegating the driving task to others, which causes anxiety and stress (usually studied as a ‘locus of control’) [9,17].
Finally, two studies have examined the impact of toll increases on carpooling and transit use. The toll discouraged some drivers and passengers not only because of the cost itself, but also because the insertion of money into the social dynamics of offering or accepting a ride made them uncomfortable. A few drivers stopped picking up riders because they worried that collecting a fee would create insurance and liability issues. Tolls did not affect wealthier drivers, because they considered travel time savings in the high-occupancy toll lane more important than a toll [29].
3. Methodology
The purpose of this research is to investigate the factors affecting drivers to use their personal vehicle, as part of their trip, in carpooling services that transport passenger(s) to public transport stations for the first/last mile of their trip, using data from the EU project Ride2Rail [30]. Ride2Rail [30] explores how carpooling services may be used together with public transport. More specifically, it aims to further enhance the notion of carpooling by developing, testing and delivering a suite of as-a-service software components, proposing trips that will be covered partly by public transport modes and partly by private cars (carpooling). Toward this goal, within the framework of Ride2Rail, a survey was conducted to capture the stated behavior and analyze the factors of potential users (i.e., passengers and drivers) for participating in a carpooling service used jointly with public transport.
This study uses part of the survey data and focuses on potential carpooling drivers. The survey results for passengers have been described by the authors of [30]. However, our study provides an extended analysis for carpooling drivers and is enriched by policy recommendations for carpooling providers.
3.1. Data Collection
The questionnaire was conducted by means of a conversational survey. A conversational survey is a tool that presents surveys in a chat-like form, rather than as an “aseptic” questionnaire, to collect quantifiable data. The CONversational SurvEY (Coney) tool that was used herein offers different web applications that cover all stages of survey design and delivery processes, including the survey creation, its administration and the subsequent data analysis [30].
The survey was conducted in all the 27 EU countries and the UK, with individuals in each country asked to answer questions. The survey was addressed to all travelers, including passengers and drivers. However, this paper focuses only on drivers. The first part of the survey was divided into five sections.
- The first section included questions on general and sociodemographic characteristics, such as home country, gender, age, income, educational level and professional status.
- The second section provided the definition of carpooling and three more questions relative to carpooling, such as the participant’s area of residence (i.e., urban, semi-urban or rural), ownership of a smartphone and previous experience with carpooling services. Respondents without previous carpooling experience were forwarded directly to the following section, whereas respondents with previous carpooling experience were first directed to answer four additional questions to rate their last carpooling experience, their trip purpose, with whom they travelled and the modes they selected to use together with carpooling in their last journey (if any).
- The third section concerned the participant’s travel habits by focusing on a usual journey of theirs.
- The fourth section was available only to passengers concerned the utilization of carpooling and public transport (e.g., rail, tram or metro). In this section, the respondents were introduced to the hypothetical scenario. The scenario stated: “For this journey you are carpooling as a passenger and you are using a mobile app to plan your journey. Through the app you are able to find a driver and arrange a carpooling to take you to/from the rail/metro/tram station to complete the first/last-mile of your journey.” A set of questions followed for passengers.
- The fifth section was available only to drivers (i.e., driving license holders and car owners), and it concerned the reasons why potential drivers would accept to use their personal vehicle the presented scenario. The section started with the statement: “Now as a driver let’s imagine you can use your car to provide carpooling services to other travelers. If the mobile application could suggest you carpooling passengers; you would accept a journey if…”. Nine questions followed (Table 1) that represented nine potential factors for drivers. These questions represent factors that were identified in the literature as significant for passengers and drivers, including the number of passengers to travel with, travel companion, incentives (i.e., parking offer), travel factors (i.e., maximum number of pickup points, delay, time and cost of trip) and ride security.
- The conversational survey targeted EU-based travelers. The survey link was sent to the participants using multiple dissemination channels, including social media (i.e., LinkedIn, Facebook, Twitter), emails and professional newsletters. Participants included transport research institutions, ministries, educational institutes and companies.
Table 1 provides a list of questions related to the factors that affect drivers’ use of their personal vehicles to transfer passengers, as part of their trip, to public transport stations.
3.2. Statistics and Modelling
The relationship of the selected factors with drivers’ demographic characteristics was further described using cross-tabulations. Due to the large amount of data available, factors in the remaining section were selected based on statistical tests (chi-square) and high discrepancies between variables (i.e., factor and demographics).
Bivariate statistics were computed to explore the relationships between explanatory variables and individual driver characteristics, as well as between drivers/non-drivers and each explanatory variable. Relations with categorical explanatory variables were explored through statistical tests (independence as null hypothesis), including the chi-square and Fisher’s exact tests (when low frequencies were found in the contingency table), since the variables followed a non-normal distribution.
Beyond the inferential statistics, multivariate modeling was conducted to explore the likely collinearity between the factors and the likelihood of using carpooling as a driver. A binary logit model was built to estimate the likelihood of using carpooling as a driver. The results showed that most of the correlation values were not very significant.
Logit family models comprised the simple binary logit model, nested binary logit model and multinomial logit model. The linear regression estimates the value of the dependent variable based on the values of the predictor variables, and the logistical regression provides information about a “transformation” of the dependent variable, logit(p):
where p is the probability of drivers to accept participating in a carpooling system, and 1 − p is the probability of not accepting. The odds ratio is the ratio of the two probabilities: p/(1 − p). The general regression model for n predictors is:
where p is p (y = 1/x1, x2, …, xn) and represents the probability that the drivers’ decisions would be affected if the predictor variables x1, x2, …, xn are taken into consideration. The probability of accepting to participate in a carpooling system as a driver (pd) based on the binary logit model is represented mathematically by Equation (3), and the probability of not accepting (pn) is estimated by Equation (4).
4. Results
4.1. Carpooling Drivers
In the hypothetical scenario, respondents were asked to answer nine questions to indicate if they would accept to provide carpooling services using their personal vehicle and a mobile application. As noted in Section 3, the carpooling rides would be arranged to drive a passenger to/from the rail/metro/tram station to complete the first/last mile of their journey.
Overall, from the 565 participants in the survey, 327 (58%) responded that they are in possession of a valid driver’s license and that they usually have a car available for their everyday trips. Hereafter, the 327 respondents are referred to as drivers.
First, descriptive statistics were carried out to characterize the drivers’ sample according to demographic variables. Based on data available from the questionnaire, we retained sociodemographic variables such as gender, age, educational level and occupation status as individual variables. Table 2 summarizes the survey demographics and respondents’ transport behavior results.
The majority of the drivers were male, while in terms of age, they were young (35%) and middle-aged (30%). Most of them were highly educated, with 24% holding a bachelor’s degree and 58% holding a Master’s degree or higher. In addition, the vast majority of the respondents were either employed (64%) or students (18%). Respondents lived in an urban area (71%), while 19% and 10% lived in suburban and rural areas, respectively. Almost 99% of the participants mentioned that they owned a smartphone, while 54% of them stated that they have used carpooling at least once in the past. Regarding the type of their journey, 82% of them travel to work, 8% travel for leisure or entertainment reasons and another 8% travel for education. The respondents were from Slovakia (28%), Czech Republic (16%), Finland (12%), Greece (11%), Italy (11%), France, Poland and Belgium (2% per country), the UK and Serbia (1.5% per country), while the remaining 13% were from Cyprus, Germany, Ukraine, Spain, Austria, Belarus, Estonia, Hungary, Lithuania, Portugal and Sweden (1% roughly per country).
As expected, the majority, reaching almost 98%, had a smartphone. When it comes to carpooling services, almost half of the participants in the survey mentioned that they had never enjoyed a carpooling service (46.2%) in the past. As shown in Table 1, the majority of the travelers did not have a past carpooling experience in all well-presented countries in the sample, excluding Belgium, where travelers appeared to be very familiar with carpooling.
To investigate the conditions under which drivers would accept a carpooling journey, nine factors were considered. Table 3 summarizes the factors the description of the factor, the share of respondents per answer and the most popular answer per question (in bold).
First, the participants were asked about the maximum number of passengers that they would accept to share the journey with. Replies were almost equally divided among answers, with “2 passengers” being the most popular answer (39%). Based on driver results some initial key findings include:
- The maximum number of passengers to offer the journey to did not seem to be equally shared among the three options (one, two and three passengers).
- Drivers preferred to travel with friends (30%), family (29%) and coworkers (28%) compared to strangers (13%). Trust was revealed as an important issue through this question.
- Drivers were reluctant to offer carpooling services during the night and almost equally eager services during the rest of the day.
- The two factors related to parking (“Parking offer” and “Lack of parking”) were both rated with five stars by the majority of drivers, showing that the provision of a parking place is important for the drivers. Discounted parking seems to be a good incentive to convince drivers to join a carpooling application.
- The majority of the drivers preferred to check the passenger’s profile using the carpooling application (45%) and Facebook (40%).
- The majority of the drivers preferred to reduce the cost of their journey by EUR 2–3 (41%), while they were ready to accept an overall delay to their journey of 3–5 min (42%). It seems that the cost reduction should be at least EUR 2 to engage more drivers.
- One pick-up/drop-off point was clearly preferred by 64% of drivers, as it was rated five and four stars.
4.2. Statistics and Exploration
The following results show whether drivers’ individual characteristics affect their decision to use their private vehicle in the proposed carpooling service. Overall, each factor presents different correlations with individual characteristics when considering a degree of significance at the 95% (p-values < 0.05).
In terms of demographics, gender was associated with “Parking cost” (p = 0.040) and “Pickup location” (p = 0.025). Age was associated with “Parking cost” (p = 0.046), “Journey cost” (p = 0.005), “Pickup location” (p = 0.016), “Delay” (p = 0.000) and “Trip purpose” (p = 0.000). Education was associated only with “Delay” (p = 0.028) and “Trip purpose” (p = 0.002). The employment status and the location of residence were associated only with “Trip purpose” (p = 0.000 and p = 0.001, respectively). The variable “past carpooling experience” was used as an independent variable to test the relation with factors, and it was found to be statistically significant only with “Trip purpose” (p = 0.007).
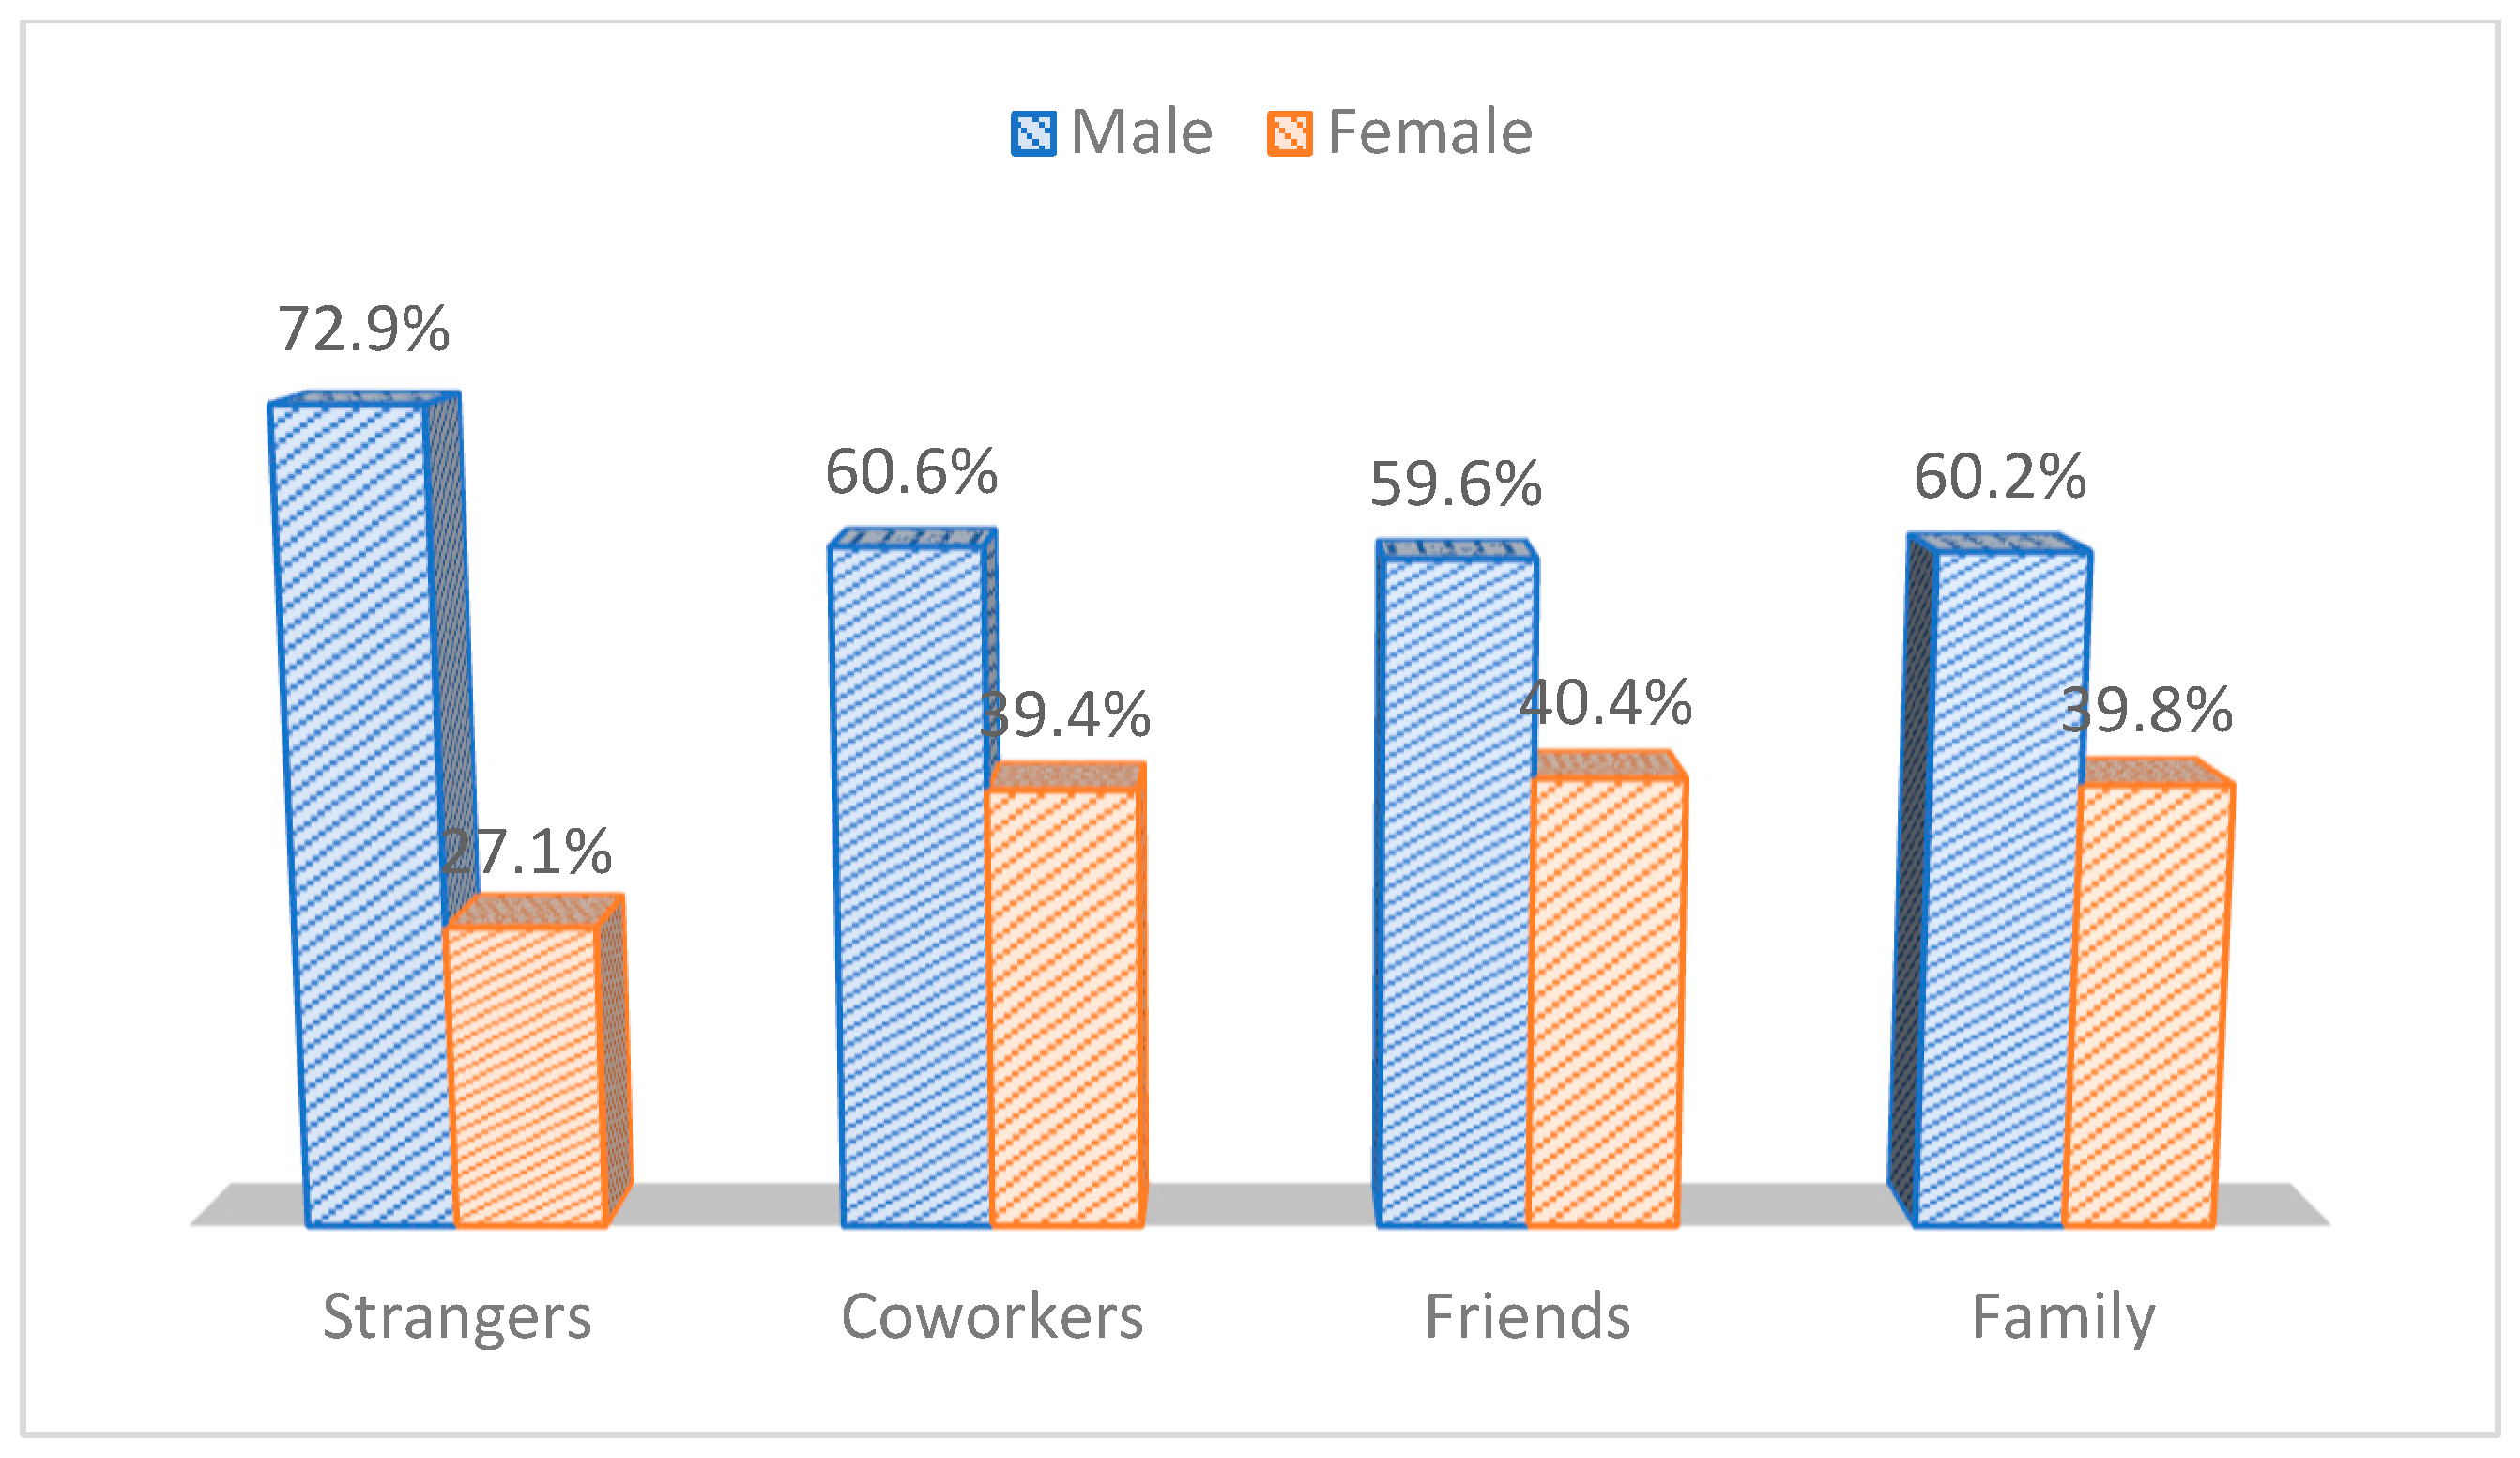
Both male and female respondents preferred to travel with two passengers in their car, but when it comes to one and three passengers, women were more reluctant. Moreover, female drivers prefer to offer a carpooling journey to coworkers, friends or family, while men appear more confident to ride with strangers (73% would offer carpooling services to strangers), as shown in Figure 1. Although females appeared to prefer their travel companion to be someone they know, at the same time, they preferred travelling with two other passengers. This makes sense, as the second «stranger» may act as a safety net for the first one.
Regarding the number of pick-up/drop-off locations (factor: “Convenience”), both male and female drivers were more interested in providing carpooling services that entail only one pickup location. This is explained by the fact that both save time and it may reduce the fear of being in the car with a stranger (even for a while).
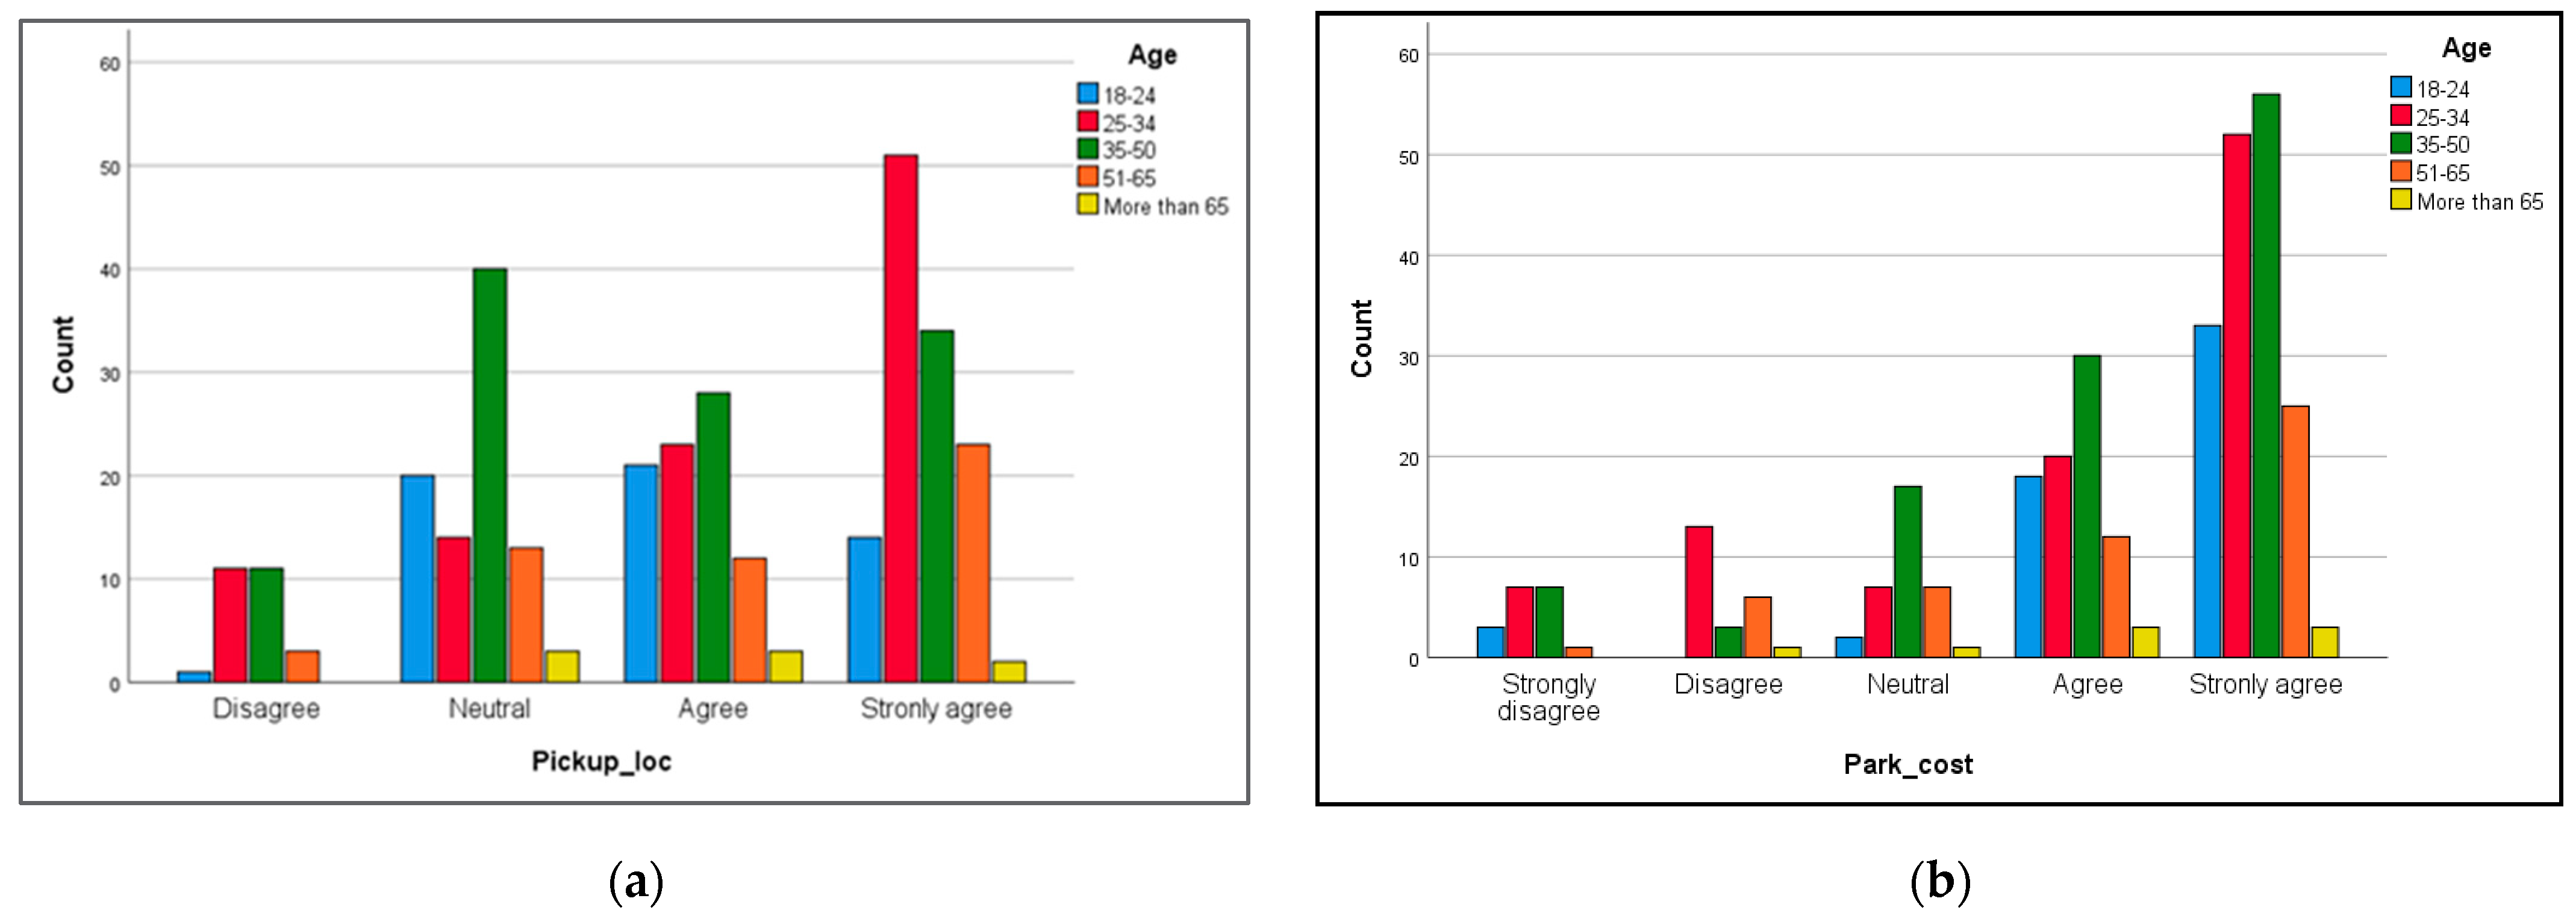
Male drivers were more likely to accept multiple pick-up/drop-off locations. Having only one pick-up/drop-off location for all passengers is important to specific age groups (Figure 2a). The age group of 25–34 strongly expressed that it is important to have only one pickup location. On the other hand, the age group of 35–50, which is the so-called most productive age group, was rather neutral to this question, contrary to what was anticipated. It seems that younger people are more interested in not wasting time compared to middle-aged people. Thus, drivers in the age group of 35–50 are more likely to accept more than one pick-up/drop-off location.
Both male and female drivers would be interested in receiving discounts (or free passes) to reduce their parking costs, in the case that they offer a carpooling service. This is a useful finding, as it could be used as an incentive to urge people to become drivers. Regarding parking costs and the availability of discounted or free spaces, Figure 2b shows that there is a relation to the age distribution. All age groups rated this option highly, with the age group of 35–50 showing the highest interest. Although one would expect that young people would be most interested in reducing their overall cost, middle-aged people, mostly travelling to work, were most interested in free parking spaces, probably because of the frequency that they travel (probably every day).
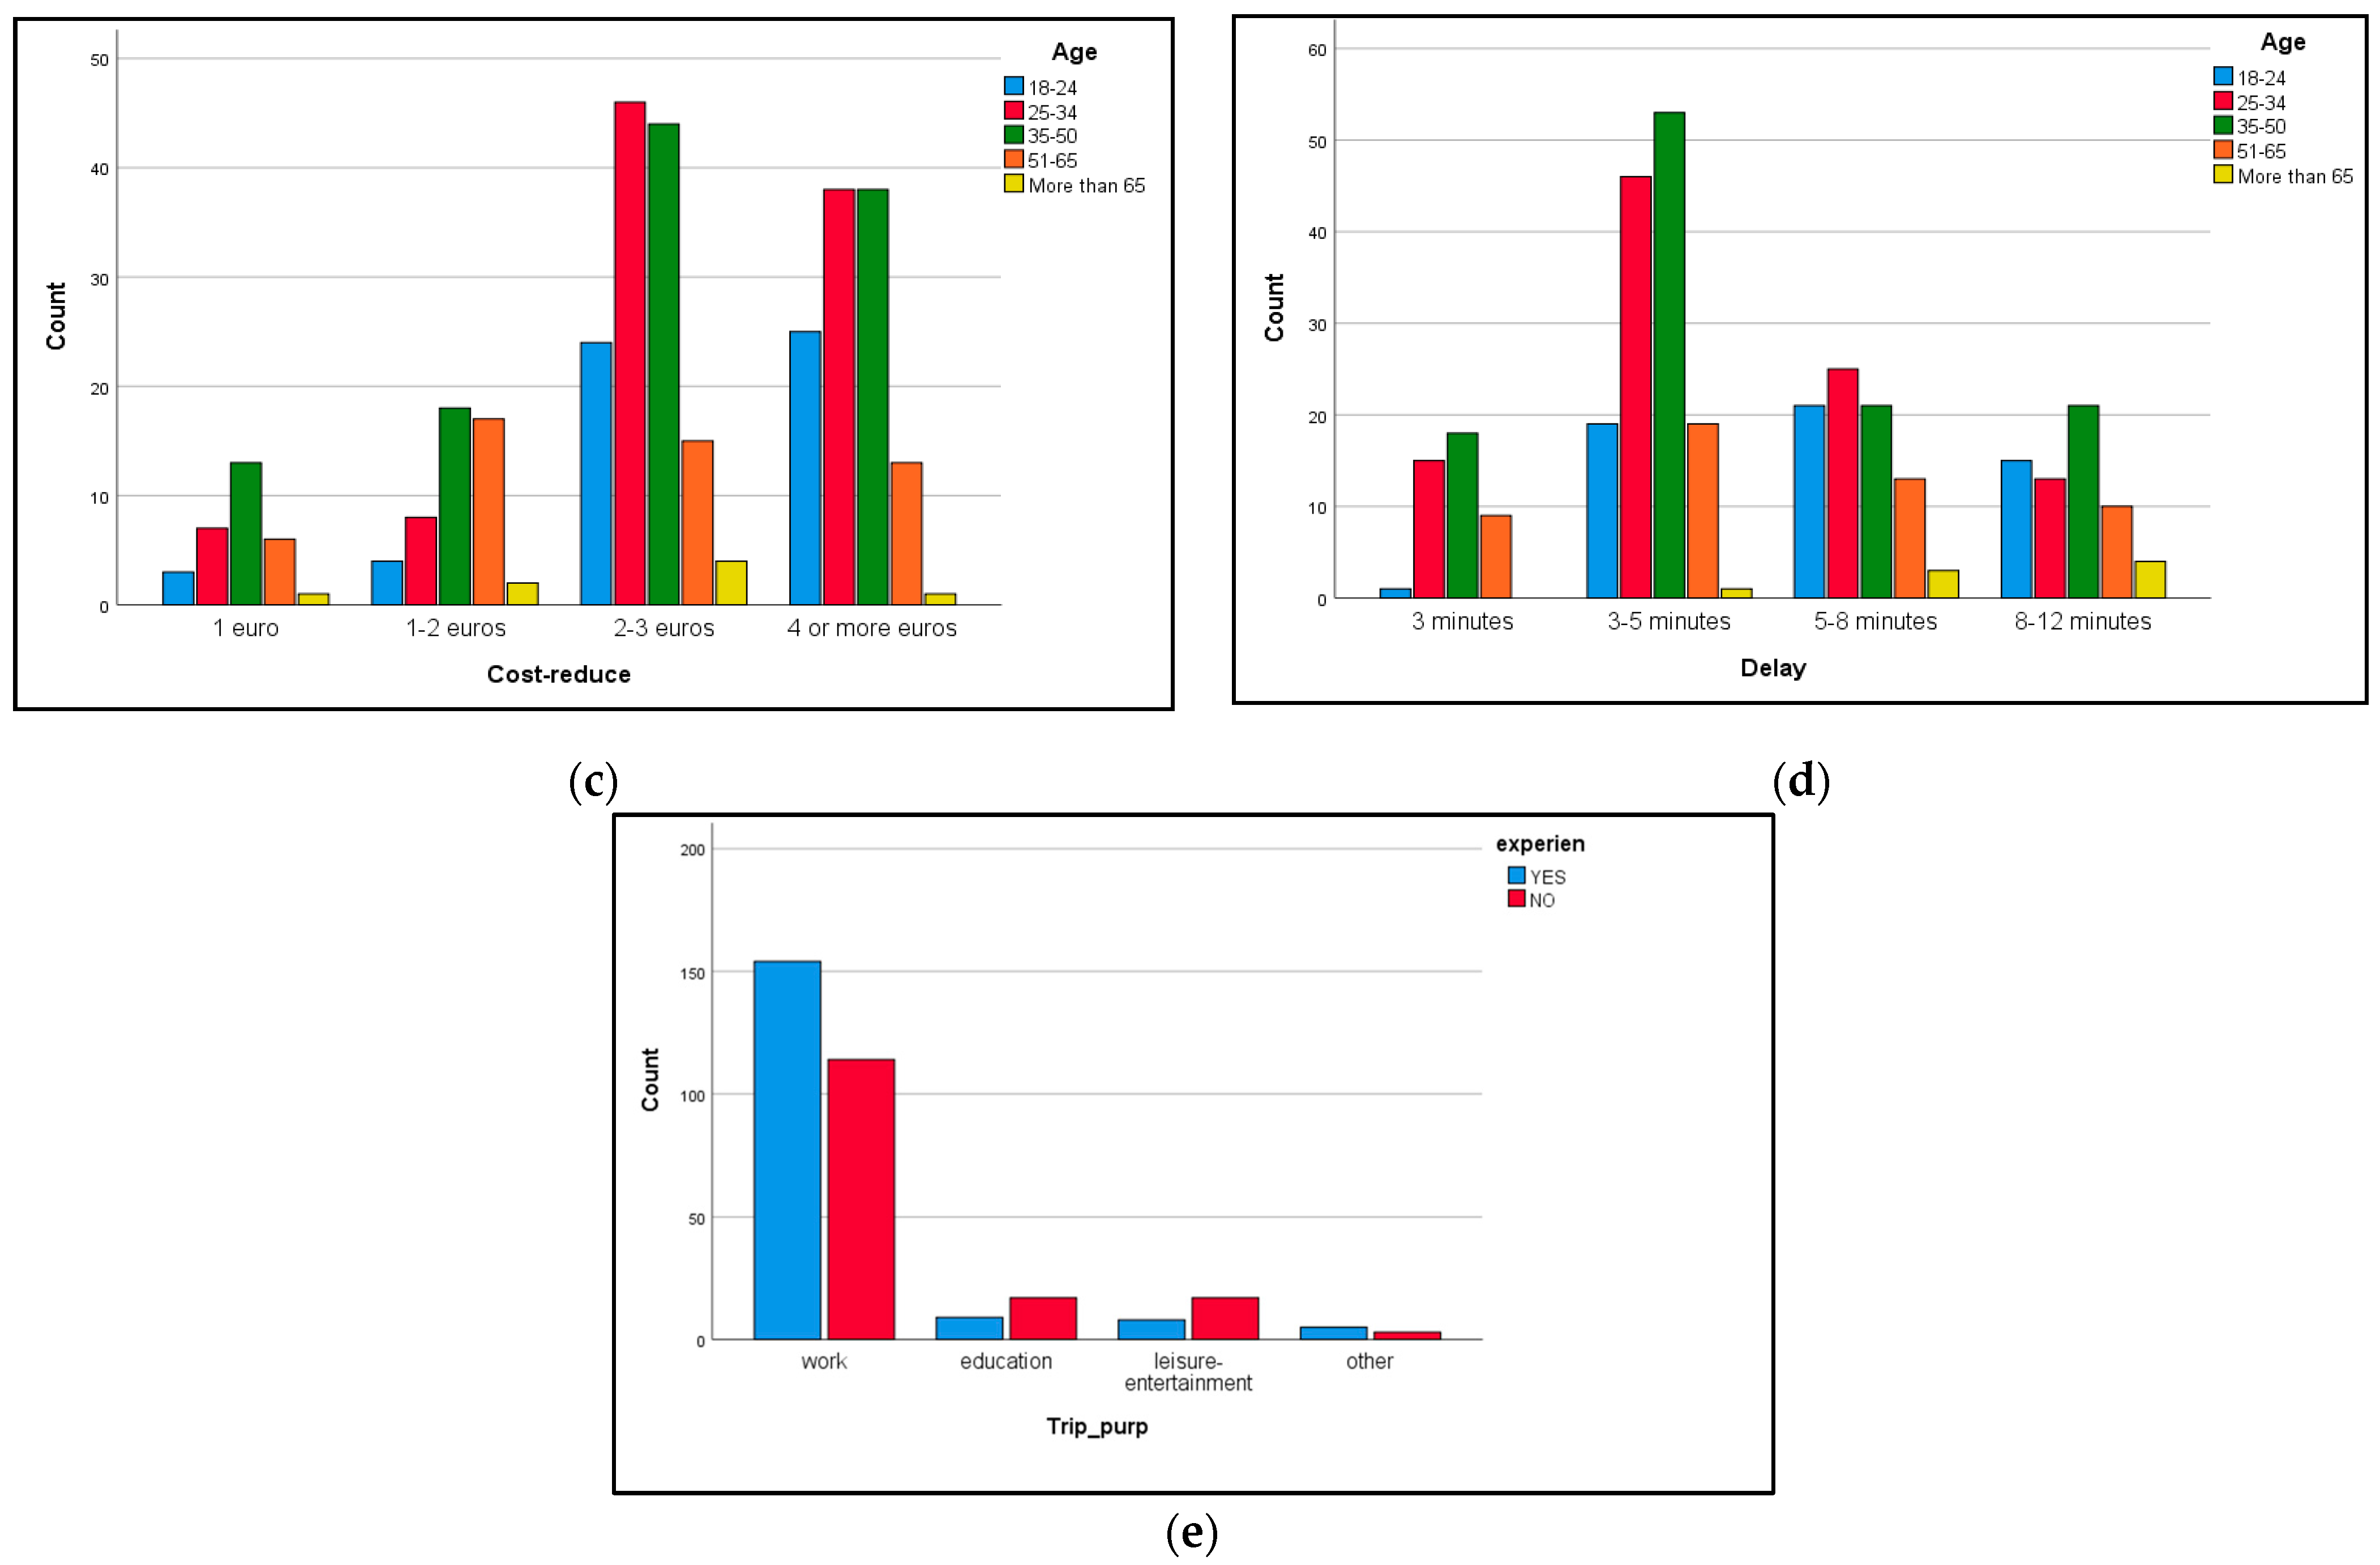
Drivers’ education was found to affect the “Trip purpose.” The vast majority of respondents holding a bachelor’s degree (24%) and a Master’s degree or higher (58%) travelled for work reasons. Similarly, age affected the “Journey cost” factor, as most of the respondents claimed that they would be satisfied with a reduction of EUR 2–3 (Figure 2c). All age groups made the specific choice, apart from the younger age group of 18–24, who would prefer an even higher reduction of EUR 4 or more, which might be explained from the fact that people of this age group usually have limited financial resources. Although higher journey cost reduction was welcome by all travelers, the age groups of 35–65 would more readily accept a smaller cost reduction for carpooling.
Following the same rationale, age appeared to affect the “Delay” factor. Young (18–25) and older (65+) drivers were more eager to accept a higher increase of their overall travel time, as they usually do not have a tight schedule, especially in the case they are travelling to or from leisure activities (Figure 2d). The majority (47%) of middle-aged people (25–50) accepted an increased travel time of up to 3–5 min. Compared to respondents without past experience, those with past experience were more likely to have used carpooling for work trips (Figure 2e). In addition, “well-educated” (holding a Bachelor’ degree, a Master’s degree or higher) respondents were more likely to accept a higher time delay.
4.3. Statistical Modelling
A binary logistic regression analysis was applied to predict the participation of drivers in a carpooling system that take a passenger to/from the rail/metro/tram station to complete the first/last mile of their journey. The predicted values were “No” (0) and “Yes” (1). All variables found to be significant were tested in the model. Table 4 summarizes the variables used in the final model.
A summary of estimations using the binary logit model for carpooling to public transport is presented in Table 5. The analysis was performed using the IBM SPSS statistics 25 software. All variables presented in the table had significant parameter estimates (p < 0.05).
Based on the full logistic regression model, the predicted values of the dependent variables show that 231 cases were correctly predicted (51 cases were observed to be 0 and correctly predicted to be 0; 180 cases were observed to be 1 and correctly predicted to be 1), and 96 cases were not correctly predicted (75 cases were observed to be 0 but predicted to be 1; 21 cases were observed to be 1 but predicted to be 0). The overall percentage for right predictions is 70.6%.
The Sig. less than 0.05 represents the significant contribution of the variable in the model prediction. Thus, Security, Delay, Residence, Convenience and Passenger Number are significant variables. The odds ratio is used to interpret the prediction of probability of an event occurring based on one unit change in an independent variable when all other independent variables are kept constant. In other words, the odds ratio is the exponentiation of the coefficients. The models’ coefficients showed that “Delay,” “Convenience,” “Residence,” “Security,” and “Passenger no.” influenced the driver decision toward using their private vehicle in carpooling services with public transport. The results show that:
- A positive coefficient of “Delay” (Number of minutes I would accept to add to my journey) demonstrates that drivers who would accept a longer delay are more likely to use carpooling services to public transport. Most of them would accept a maximum delay of 3–5 min. The overall amount of delay that they would add to their journey is a determining factor that may persuades these drivers to participate in carpooling services. Drivers who would accept a delay of 6 or more minutes are 2.035-times more likely to use carpooling services than drivers who would accept a maximum delay of 5 min or less. Therefore, a carpooling system should attempt to minimize delay to attract more drivers and increase the use of the carpooling service.
- Similarly, the factor “Convenience” (If I could use only one pick-up/drop-off location for all passengers) appeared to be significant. Drivers who answered with four and five stars (i.e., agree and strongly agree) are 2.210-times more likely to join carpooling services than drivers who answered with three or less stars (i.e., strongly disagree, disagree and neutral). Therefore, carpooling is more popular when planning for the minimum number pick-up/drop-off locations for passengers.
- Regarding the location of residence, drivers that answered suburban and rural in the question (Do you live in an urban or a rural/semi-urban area?) are 0.530-times more likely to join carpooling than drivers that answered urban. Therefore, carpooling services with public transport services tend to be more popular among drivers who live in suburban and rural areas, and such services should be initially deployed in these areas.
- For the factor “Security” (ability to check the passengers’ profile), the positive coefficient (1.147) in the question “I could be able to check the passenger’s profile in carpooling application” shows that drivers would prefer to use the carpooling application that they registered with to review the passenger’s profile. Having a carpooling application to check the passengers’ profile is strongly associated (odds ratio = 1.672) with carpooling services.
- The factor “Passenger number” was also found to be significant in the model, showing that drivers who prefer to travel with two or three passengers are 2.175-times more likely to use carpooling services than those that who prefer to travel with one passenger, probably due to security reasons. Therefore, carpooling matching algorithms should be developed to arrange rides with at least two passengers.
5. Discussion and Conclusions
Travelers around Europe prefer to use private cars, as a driver rather than as a passenger. Considering the outburst of the COVID-19 pandemic since the beginning of 2020, this tendency has been further stressed, as the use of public transport has become less convenient due to measures that enforce reduced vehicle capacities and the higher risk (as compared to personal vehicles) of getting infected.
This study contributes to a better understanding of the factors affecting drivers’ participation in a carpooling service used to provide access and egress to public transport. Statistical tools were used for the analysis of the data collected, such as descriptive statistics to characterize the sample and subsamples, and bivariate statistics to explore the relationships between individual variables and categorical variables. In addition, relations with the categorical variables were explored. A binary logit model was also developed for the drivers’ willingness to accept a carpooling ride, as part of their trip, to transport people to/from public transport stations. Based on the model outcome, the factors with a significant effect are security, delay, residence, convenience and passenger number. This model contributes to carpooling research, since drivers are usually omitted from similar research efforts, and transportation involving both carpooling and public transport is not approached. Using the estimated probabilities for joining such a carpooling service, providers of these services may attempt to adjust corresponding carpooling parameters in their system to study any potential changes or focus on these parameters to conduct a local study. In this way, a successful carpooling service is likely to be developed to feed public transport networks and enhance the efficiency of the whole network.
This section uses the identified factors to provide concrete recommendations for drivers regarding the planning of a successful carpooling service. The recommendations to be made to “recruit” the drivers are probably equally important, as without them, the whole concept of carpooling cannot be realized. Table 6 summarizes the most important findings of the survey for potential drivers.
Reviewing the recommendations in Table 6, to the authors knowledge, no carpooling services provide the ability to check the passengers’ government ID through the application. Only Poparide [31], to ensure safety, requires verified profiles (email, name, phone number and verified credit card or bank account). The driver’s license is also checked, and both drivers and passengers receive ratings, so future travelers may decide with whom to travel with. As for the second recommendation, no carpooling service provides the ability for drivers to declare the time range during which they provide services in advance. Although the majority of carpooling services use a mobile application, this is not the case for interurban carpooling services (i.e., Ride joy [32] and Autostrade carpooling [33]). In addition, no carpooling was found to guarantee a minimum delay for drivers or a single dropoff/pickup point. Some carpooling platforms (i.e., TwoGo [34] and BlaBlaLines operated by BlablaCar [35]) use an intelligent technology to analyze rides from all users to find the best fit for each user. This intelligent technlogy even factors in real-time traffic data to calculate precise routes and arrival times.
To further increase the sense of safety, Avacar carpooling, which stopped operating in 2013, provided women with the option to travel only with other women as co-passengers or even drivers. Several incentives are used to promote carpooling, such as toll cost reduction, High Occupancy Vehicle (HOV) lanes in the US and free or discounted parking access in public or private areas. For example, Autostrade [33] carpooling with at least four passengers pays a toll of EUR 0.50, instead of EUR 1.70, from Monday to Friday. In addition, GoCarma [36] uses Bluetooth to automatically detect if there are at least two passengers in the car so as to qualify for an HOV toll discount. Finally, a collaboration scheme or joint schedules of public transport routes and carpooling were not identified.
Security is an important factor in our study, since drivers would like to be able to check the passengers’ profiles when accepting a ride. This issue has also been highlighted by other authors [12,21,28], who have mentioned that a passenger’s profile is an important factor for drivers. Our study suggests that security may be improved using technological advances, such as providing the ability to check the potential passengers’ ID and/or social media through the application, will likely increase the users’ sense of security.
Two additional factors that may be integrated in an advanced algorithm are the provision of services entailing only one pick-up and drop-off point, and limiting the trip delay to no more than 3–5 min. Providing a carpooling service that may control the maximum delay and number of pickups is positively associated with carpooling to/from public transport stations. Trip cost and travel time factors have been found to relate to carpooling and are the main reasons for participating in such services [11,23]. Drivers not willing to withstand a delay of 6 or more minutes are less likely to participate in carpooling. Designed algorithms for carpooling applications should consider these results to enhance their users’ experience.
Similarly, the number of passenger that each carpooler prefers should be also incorporated in algorithms to optimize carpooling rides. The matching mechanisms for most of the platforms are destination-based. Drivers, who offer a ride, insert the place of departure and arrival, and wait for those looking for the ride to that destination or a place along the way. The traveler consults the list of trips already entered to find the one that best meets their needs (departure, arrival, time, crew members, etc.). Carpooling platforms do not use a sophisticated algorithm with multiple criteria to find the perfect ride match, opposed to ride-hailing platforms that incorporate more travel and user criteria [37].
The study also revealed that incentives to drivers, such as parking offers at the station, do contribute toward participating in carpooling services. Our results are in opposition to other studies that have demonstrated that incentives play a significant role [5,24,25,38]. The provision of carpooling services has the potential to increase vehicle occupancy while improving the environment in large metropolitan areas and enhancing social life.
The location of residence showed that drivers in non-urban areas are positively related to carpooling. Providers and planners should consider these results to target their audience, at least when starting a carpooling service, to increase carpooling demand. A lack of public transport is usually observed in non-densely populated areas, such as the suburbs. City suburbs should be targeted to promote and expand carpooling services for travelers’ first/last trip mile. Large companies and university campuses are also located in suburban areas and provide potential cases for testing and implementing carpooling services.
On the other hand, several constraints have been found to restrain passengers from using carpooling services, including security [21], driver experience and increased trip cost. The authors of [39] concluded that freedom and personal factors are also constraining factors for carpooling. However, the factors identified in this study may be overcome by providing appropriate policies and technology tools.
The existing literature on carpooling passengers presents inconsistent results for behavioral factors, whereas drivers’ behavior and carpooling as part of multimodal trips are not addressed. To this end, this study initiated research to close these gaps. However, the study has certain limitations. The survey conducted in the EU may not reflect the real carpooling market, since not all countries are equally represented in the sample. The present study focused on drivers participating in carpooling rides to public transport and did not include carpooling passengers and impacts. Whereas both travelers and drivers are equally significant to the design of a successful carpooling service, the present study recognizes that (a) research for passengers willing to participate in a carpooling program that offers services to/from public transport should be studied separately, to focus on their behavioral aspects, and (b) studies on the impacts of sharing mobility services, such as carpooling, are challenging, since tools to perform exhaustive lifecycle assessments are limited. In this study, sociodemographic factors were not found to be significant, which may be attributed to our sample. However, the authors of [10] showed that sociodemographic factors are not important when carpooling.
Considering these limitations, our study aimed to (a) investigate drivers’ willingness to accept a ride, as part of their trip, to/from public transport stations, and (b) understand findings and provide recommendations for developing a successful carpooling system. The results from this study can be used by carpooling providers, transportation planners, public transport providers and policymakers to develop more effective and customized ways to address carpooling challenges. These factors could assist and guide service providers when planning a carpooling service and facilitate decisions regarding which parameters should be customized, what type of travelers should be targeted or what incentives should be provided for a successful carpooling service. Public authorities should attempt to collaborate with new travel options and provide integrated mobility packages customized to cover travelers’ needs. Failure to achieve collaborations and compete new mobility solutions may result to ridership decreases and reduced public transport services. Furthermore, the development of a mobile application that enables journey planning and a one-stop shop to buy a ticket for the whole trip (i.e., rail and carpooling) will further improve the travelers’ experience.
Future work may provide a taxonomy of carpooling factors to explore potential patterns, engage a larger sample and focus on specific countries to draw conclusions per location. A cross-check between results may be important to identify differences for providing customized recommendations. In addition, the relationship between carpooling participation, travelers with and without carpooling experience, and trip purpose may reveal additional behavioral attitudes for improving audience targeting.
Author Contributions
Conceptualization, L.M. and A.K.; methodology, L.M.; validation, L.M. and A.K.; formal analysis, L.M. and A.K.; investigation, L.M., G.A. and A.K.; resources, L.M.; writing—original draft preparation, L.M. and A.K.; writing—review and editing, L.M., A.K.; supervision, G.A. All authors have read and agreed to the published version of the manuscript.
Funding
This research was funded by the European Union’s Horizon 2020 research and innovation programme under grant agreement No. 881825.
Institutional Review Board Statement
Not applicable.
Informed Consent Statement
Not applicable.
Data Availability Statement
Not applicable.
Acknowledgments
The views expressed in this paper are purely those of the author and do not, under any circumstances, represent those of the Shift2Rail Joint Undertaking. None of the funders played any role in the conduct of this review, in the interpretation of its outputs, in the writing of this report or the decision to submit this article for publication.
Conflicts of Interest
The authors declare no conflict of interest.
References
- Garling, T.; Steg, L. Threats from Car Traffic to the Quality of Urban Life: Problems, Causes, and Solution; Emerald Group Publishing Limited: Solihull, UK, 2007. [Google Scholar]
- Nikitas, A.; Kougias, I.; Alyavina, E.; Njoya Tchouamou, E. How can autonomous and connected vehicles, electromobility, BRT, hyperloop, shared use mobility and Mobility-as-a-Service shape transport futures for the context of smart cities? Urban Sci. 2017, 1, 36. [Google Scholar] [CrossRef] [Green Version]
- Furuhata, M.; Dessouky, M.; Ordóñezc, F.; Brunet, M.E.; Wang, X.; Koeniga, S. Ridesharing: The state-of-the-art and future directions. Transp. Res. Part B Methodol. 2013, 57, 28–46. [Google Scholar] [CrossRef]
- Gargiulo, E.; Giannantonio, R.; Guercio, E.; Borean, C.; Zenezini, G. Dynamic ride sharing service: Are users ready to adopt it? Procedia Manuf. 2015, 3, 777–778. [Google Scholar] [CrossRef] [Green Version]
- Olsson, L.E.; Maier, R.; Friman, M. Why do they ride with others? Meta-analysis of factors influencing travelers to carpool. Sustainability 2019, 11, 2414. [Google Scholar]
- Wang, Y.; Gu, J.; Wang, S.; Wang, J. Understanding consumers’ willingness to use ride-sharing services: The roles of perceived value and perceived risk. Transp. Res. Part C Emerg. Technol. 2019, 105, 504–519. [Google Scholar] [CrossRef]
- Wang, Z.; Chen, X.; Chen, X. Ridesplitting is shaping young people’s travel behavior: Evidence from comparative survey via ride-sourcing platform. Transp. Res. Part D Transp. Environ. 2019, 75, 57–71. [Google Scholar] [CrossRef]
- Buliung, R.N.; Soltys, K.; Bui, R.; Habel, C.; Lanyon, R. Catching a ride on the information superhighway: Toward an understanding of internet-based carpool formation and use. Transportation 2010, 37, 849–873. [Google Scholar] [CrossRef]
- Neoh, J.G.; Chipulu, M.; Marshall, A. What encourages people to carpool? An evaluation of factors with meta-analysis. Transportation 2017, 44, 423–447. [Google Scholar]
- Kaufman, S. Why people (don’t) carpool and change for the better: A social capital framework for investigating environmental behaviour. In Proceedings of the 2nd National Conference of Sustainable Campuses, RMIT, Melbourne, Australia, 2002. [Google Scholar]
- Bulteau, J.; Feuillet, T.; Dantan, S. Carpooling and carsharing for commuting in the Paris region: A comprehensive exploration of the individual and contextual correlates of their uses. Travel Behav. Soc. 2019, 16, 77–87. [Google Scholar] [CrossRef]
- Tahmasseby, S.; Kattan, L.; Barbour, B. Propensity to participate in a peer-to-peer social-network-based carpooling system. J. Adv. Transp. 2016, 50, 240–254. [Google Scholar] [CrossRef]
- Lee, B.; Aultman-Hall, L.; Coogan, M.; Adler, T. Rideshare mode potential in non-metropolitan areas of the northeastern United States. J. Transp. Land Use 2016, 9, 111–126. [Google Scholar] [CrossRef] [Green Version]
- Ciari, F.; Axhausen, K. Choosing carpooling or car sharing as a mode Swiss stated choice experiments. In Proceedings of the Transportation Research Board, 91st Annual Meeting, Washington, DC, USA, 22–26 January 2012. [Google Scholar]
- Lanzini, P.; Khan, S.A. Shedding light on the psychological and behavioral determinants of travel mode choice: A meta-analysis. Transp. Res. Part F Traffic Psychol. Behav. 2017, 48, 13–27. [Google Scholar] [CrossRef]
- Gardner, B.; Abraham, C. Psychological correlates of car use: A meta-analysis. Transp. Res. Part F Traffic Psychol. Behav. 2008, 11, 300–311. [Google Scholar] [CrossRef]
- Vanoutrive, T.; Van Vijver, E.; Van Malderen, L.; Jourquin, B.; Thomas, I.; Verhetsel, A.; Witlox, F. What determines carpooling to workplaces in Belgium: Location, organisation, or promotion? J. Transp. Geogr. 2017, 22, 77–86. [Google Scholar] [CrossRef] [Green Version]
- Delhomme, P.; Gheorghiu, A. Comparing French carpoolers and non-carpoolers: Which factors contribute the most to carpooling? Transp. Res. Part D Transp. Environ. 2016, 42, 1–15. [Google Scholar] [CrossRef]
- Gheorghiu, A.; Delhomme, P. For which types of trips do French drivers carpool? Motivations underlying carpooling for different types of trips. Transp. Res. Part A Policy 2018, 113, 460–475. [Google Scholar]
- Li, J.; Embry, P.; Mattingly, S.; Sadabadi, K.F.; Rasmidatta, I.; Burris, M.W. Who chooses to carpool and why? Examination of Texas carpoolers. Transp. Res. Rec. J. Transp. Res. Board 2007, 2021, 110–117. [Google Scholar] [CrossRef] [Green Version]
- Hartwig, S.; Buchmann, M. Empty Seats Traveling: Next-Generation Ridesharing and Its Potential to Mitigate Traffic and Emission Problems in the 21st Century; Nokia Research Center: Helsinki, Finland, 2006. [Google Scholar]
- Monchambert, G. Why do (or don’t) people carpool for long distance trips? A discrete choice experiment in France. Transp. Res. Part A Policy Pract. 2017, 132, 911–931. [Google Scholar] [CrossRef]
- Chan, N.; Shaheen, S.A. Ridesharing in North America: Past, present, and future. Transp. Rev. 2012, 32, 93–112. [Google Scholar] [CrossRef]
- Shaheen, S.; Cohen, A. Shared ride services in North America: Definitions, impacts, and the future of pooling. Transp. Rev. 2019, 39, 427–442. [Google Scholar] [CrossRef]
- Correia, G.; Silva, J.A.; Viegas, J.M. Using latent attitudinal variables estimated through a structural equations model for understanding carpooling propensity. Transp. Plan. Technol. 2013, 36, 499–519. [Google Scholar] [CrossRef]
- Levin, I. Measuring tradeoffs in carpool driving arrangement preferences. Transportation 1982, 11, 71–85. [Google Scholar] [CrossRef]
- Oliphant, M. The Native Slugs of Northern Virginia: A Profile of Slugging in the Washington DC. Region. Master of Sciences in Urban and Regional Planning, Urban Affairs and Planning, Virginia Tech. 2008. Available online: www.toolsofchange.com/userfiles/Slugging_Report_Oliphant(2).pdf (accessed on 25 July 2021).
- Tavory, S.S.; Trop, T.; Shiftan, Y. Self-organizes ridesharing: Multiperspective annotated review. Int. J. Sustain. Transp. 2019, 14, 270–279. [Google Scholar] [CrossRef]
- National Academies of Sciences. Ridesharing as a Complement to Transit; The National Academies Press, Engineering, and Medicine: Washington, DC, USA, 2012. [Google Scholar] [CrossRef]
- Mitropoulos, L.; Kortsari, A. Recommendations and Criteria for a Successful Ride Sharing in the IP4 Ecosystem, Deliverable 2.5, Ride2Rail European Union’s Horizon 2020 Research and Innovation Programme. 2020. Available online: https://ride2rail.eu/ (accessed on 29 July 2021).
- Poparide. Available online: https://www.poparide.com (accessed on 29 July 2021).
- Roadsharing. Available online: http://www.roadsharing.com (accessed on 29 July 2021).
- Auto Strade Carpooling. Available online: http://www.autostradecarpooling.it (accessed on 29 July 2021).
- TwoGo. Available online: https://www.twogo.com/en (accessed on 29 July 2021).
- BlablaCar. Available online: https://www.blablacar.com (accessed on 11 August 2021).
- GoCarma. Available online: https://www.gocarma.com (accessed on 31 July 2021).
- Hansen, E.G.; Gomm, M.L.; Bullinger, A.C.; Moslein, K.M. A community–based toolkit for designing ride–sharing services: The case of a virtual network of ride access points in Germany. Int. J. Innov. Sustain. Dev. 2010, 5, 88–99. [Google Scholar] [CrossRef]
- Dorinson, D.; Gay, D.; Minett, P.P.; Shaheen, S. Flexible Carpooling: Exploratory Study; Institute of Transportation Studies UC Davis: Berkeley, CA, USA, 2009. [Google Scholar]
- Javid, A.M.; Mehmood, T.; Asif, A.H.; Vaince, A.U.; Raza, M. Travelers’ attitudes toward carpooling in Lahore: Motives and constraints. J. Mod. Transp. 2017, 25, 268–278. [Google Scholar] [CrossRef] [Green Version]
Figure 1.
Travel companion preferences by gender.

Figure 2.
Drivers’ age and (a) convenience, (b) parking cost, (c) journey cost, and (d) delay, and (e) drivers’ trip purpose and carpooling experience. Adapted from Mitropoulos and Kortsari (2020).
Figure 2.
Drivers’ age and (a) convenience, (b) parking cost, (c) journey cost, and (d) delay, and (e) drivers’ trip purpose and carpooling experience. Adapted from Mitropoulos and Kortsari (2020).


Table 1.
Drivers’ factors.
| Question | Factor | Answer Format |
|---|---|---|
| Max number of passengers I could share the journey with | Passenger number | Single choice |
| Travel preference in terms with whom I would rather travel | Travel companion | Multiple response |
| Time of the day to offer the journey | Daytime | Multiple response |
| I could get a free or discounted parking at my destination | Parking offer | 1–5-star rating * |
| There is a shortage of parking for my car at my destination | Lack of parking | 1–5-star rating |
| Ability to check the passengers’ profile | Security | Multiple response (max. 2) |
| Amount by which I could reduce my journey’s cost | Journey cost | Single choice |
| I could use only one pick up/drop off location for all passengers | Convenience | 1–5-star rating |
| Number of minutes I would accept to add to my journey | Delay | Single choice |
(*): Note: Respondents rank their feedback on a 5-point scale from 1 to 5, with 1 star and 5 stars referring to the lowest and highest rating, respectively.
Table 2.
Demographics and transport behavior results (n = 327).
| Variable | Measure | Frequency | Percent |
|---|---|---|---|
| Gender | Male | 195 | 59.6 |
| Female | 129 | 39.4 | |
| Other | 2 | 0.6 | |
| Not say | 1 | 0.3 | |
| Age | Less than 18 | 56 | 17.1 |
| 18–24 | 99 | 30.3 | |
| 25–34 | 113 | 34.6 | |
| 35–50 | 51 | 15.6 | |
| 51–65 | 8 | 2.4 | |
| More than 65 | 56 | 17.1 | |
| Education | Basic education | 1 | 0.3 |
| Higher education | 51 | 15.6 | |
| Bachelor’s degree | 79 | 24.2 | |
| Master’s degree or higher | 191 | 58.4 | |
| Prefer not to say | 5 | 1.5 | |
| Occupation | Employed full time (40-more hours/week) | 208 | 63.6 |
| Employed part time (max 39 h/week) | 15 | 4.6 | |
| Unemployed and looking for a job | 3 | 0.9 | |
| Unemployed and not looking for a job | 4 | 1.2 | |
| Student | 62 | 19.0 | |
| Self-employed | 26 | 8.0 | |
| Unable to work | 3 | 0.9 | |
| Prefer not to say | 6 | 1.8 | |
| Smartphone | Yes | 323 | 98.8 |
| No | 4 | 1.2 | |
| Residence | urban | 231 | 70.6 |
| suburban | 64 | 19.6 | |
| rural | 32 | 9.8 | |
| Past carpooling experience | Yes | 176 | 53.8 |
| No | 151 | 46.2 | |
| Journey purpose | work | 268 | 82.0 |
| education | 26 | 8.0 | |
| leisure-entertainment | 25 | 7.6 | |
| other | 8 | 2.4 | |
| Journey * | Alone | 130 | 13.1 |
| With family members | 279 | 28.0 | |
| With coworkers | 299 | 30.1 | |
| With friends | 287 | 28.8 |
Note (*): Question “I could share it with…” is a multiple response question (max all that apply).
Table 3.
Distribution of responds per factor.
| Factor | Results |
|---|---|
| Passenger number | 1 Passenger: 31% 2 Passengers: 39% 3 Passengers: 30% |
| Travel companion | Strangers: 13% Co-workers: 28% Friends: 30% Family: 29% |
| Daytime | Morning: 36% Afternoon: 32% Evening: 22% Night: 10% |
| Parking offer | 1 star: 5.5% 2 stars: 7% 3 stars: 10.4% 4 stars: 25.4% 5 stars: 51.7% |
| Lack of parking | 1 star: 17.7% 2 stars: 11.6% 3 stars: 22.9% 4 stars: 18% 5 stars: 29.7% |
| Security | Carpooling app: 45% Facebook: 40% Governmental ID: 15% |
| Journey cost | EUR 1: 9.2% EUR 1–2: 15% EUR 2–3: 40.7% EUR 4 or more: 35.2% |
| Convenience | 1 star: 0 2 stars: 8% 3 stars: 27.5% 4 stars: 26.6% 5 stars: 37.9% |
| Delay | 3 min: 13.1% 3–5 min: 42.2% 5–8 min: 25.4% 8–12 min: 19.3% |
Table 4.
Variable description in the model.
| Variable | Description | Fishers’s Exact Test (p-Value) for Carpooling Drivers/Non Drivers |
|---|---|---|
| Security | Dummy: not using an app (0); using an app (1) | 0.000 |
| Delay | Dummy: 0–5 min (0); 6 and more (1) | 0.001 |
| Residence | Dummy: rural and suburban (0); urban (1) | 0.034 |
| Convenience | Dummy: Strongly disagree, disagree, neutral (0); agree, strongly agree (1) | 0.049 * |
| Passenger no. | Dummy: 1 passenger (0); 2 and 3 passengers (1) | 0.000 |
Note (*): Chi-test.
Table 5.
Logistic regression analysis results.
| B | S.E. | Sig. | Odds Ratio | 95% C.I. | ||
|---|---|---|---|---|---|---|
| Lower | Upper | |||||
| Security | 1.147 | 0.385 | 0.003 | 3.150 | 1.672 | 5.932 |
| Delay | 0.710 | 0.254 | 0.005 | 2.035 | 1.339 | 3.092 |
| Residence | −0.636 | 0.266 | 0.017 | 0.530 | 0.342 | 0.820 |
| Convenience | 0.793 | 0.260 | 0.002 | 2.210 | 1.442 | 3.388 |
| Passenger no. | 0.777 | 0.271 | 0.004 | 2.175 | 1.392 | 3.399 |
| Constant | −1.675 | 0.453 | 0.000 | 0.187 | ||
| Summary of statistics | ||||||
| -2LL | 392.525 | |||||
| Model chi-square | 43.437 | |||||
| Cox and Snell’s R2 | 0.124 | |||||
| Nagelkerke value | 0.169 | |||||
Table 6.
Driver carpooling recommendations.
| Findings | Recommendations | |
|---|---|---|
| 1 | Trust is revealed as an important issue-drivers prefer to travel with friends (30%), family (29%) and coworkers (28%). | Provide the ability to check the potential passengers’ ID through the application and other means, such as Facebook and other social media profiles and/or governmental ID. |
| 2 | Drivers are reluctant to offer carpooling services during the night, and almost equally eager during the rest of the day. | Drivers should be able to state if they are willing to provide services during night time; if not, no penalty of any kind should be imposed. |
| 3 | Drivers would prefer to check the passenger’s profile by using the carpooling application and Facebook. Having a carpooling application to check the passengers’ profile is strongly associated with carpooling services. | The provided service should be available through a smartphone application. |
| 4 | Expected reduction of travel costs: EUR 2–3. | The provided services should prove in some way that the specific type of travel will ensure the reduction of cost by at least EUR 2–3 compared to the alternative mobility option. Monetization of external costs such as time could be considered to achieve this objective. |
| 5 | Accepted increase in travel time: 3–5 min. | Trip time for carpooling drivers should not be increased more than 3–5 min. Young and older drivers accept higher time increases. |
| 6 | One pick-up/drop-off point is preferred. | Provision of services entailing only one pick-up and drop off point. |
| 7 | Preferred number of passengers is 2. | The same trip should be provided to no more than 2 passengers at the same time, so the maximum number of passengers in the car is 3 including the driver. In the case of a female driver, a special care should be provided to arrange rides optimally with 2 passengers. |
| 8 | Reception of parking discounts or free passes “could do the trick”, especially for middle-aged people. | The application should provide various financial incentives to increase the number of people eager to provide carpooling services. Such incentives include booking of parking spots, parking discounts and/or free passes in parking lots. |
| 9 | Young and older drivers could accept a higher increase in travel time more easily. | The overall ride time should not be more than 15 min. So provided services should be designed and scheduled to minimize in-vehicle time. |
| 10 | Carpooling services with public transport services are more popular to drivers that live in non-urban areas. | Provide alignment of carpooling services with PT schedules. |
Publisher’s Note: MDPI stays neutral with regard to jurisdictional claims in published maps and institutional affiliations. |
© 2021 by the authors. Licensee MDPI, Basel, Switzerland. This article is an open access article distributed under the terms and conditions of the Creative Commons Attribution (CC BY) license (https://creativecommons.org/licenses/by/4.0/).
Share and Cite
MDPI and ACS Style
Mitropoulos, L.; Kortsari, A.; Ayfantopoulou, G. Factors Affecting Drivers to Participate in a Carpooling to Public Transport Service. Sustainability 2021, 13, 9129. https://0-doi-org.brum.beds.ac.uk/10.3390/su13169129
AMA Style
Mitropoulos L, Kortsari A, Ayfantopoulou G. Factors Affecting Drivers to Participate in a Carpooling to Public Transport Service. Sustainability. 2021; 13(16):9129. https://0-doi-org.brum.beds.ac.uk/10.3390/su13169129
Chicago/Turabian StyleMitropoulos, Lambros, Annie Kortsari, and Georgia Ayfantopoulou. 2021. "Factors Affecting Drivers to Participate in a Carpooling to Public Transport Service" Sustainability 13, no. 16: 9129. https://0-doi-org.brum.beds.ac.uk/10.3390/su13169129
Note that from the first issue of 2016, this journal uses article numbers instead of page numbers. See further details here.