
NBS Impact Evaluation with GREENPASS Methodology Shown by the Case Study ‘Fischbeker Höfe’ in Hamburg/Germany

 ,
,
Abstract
:1. Introduction
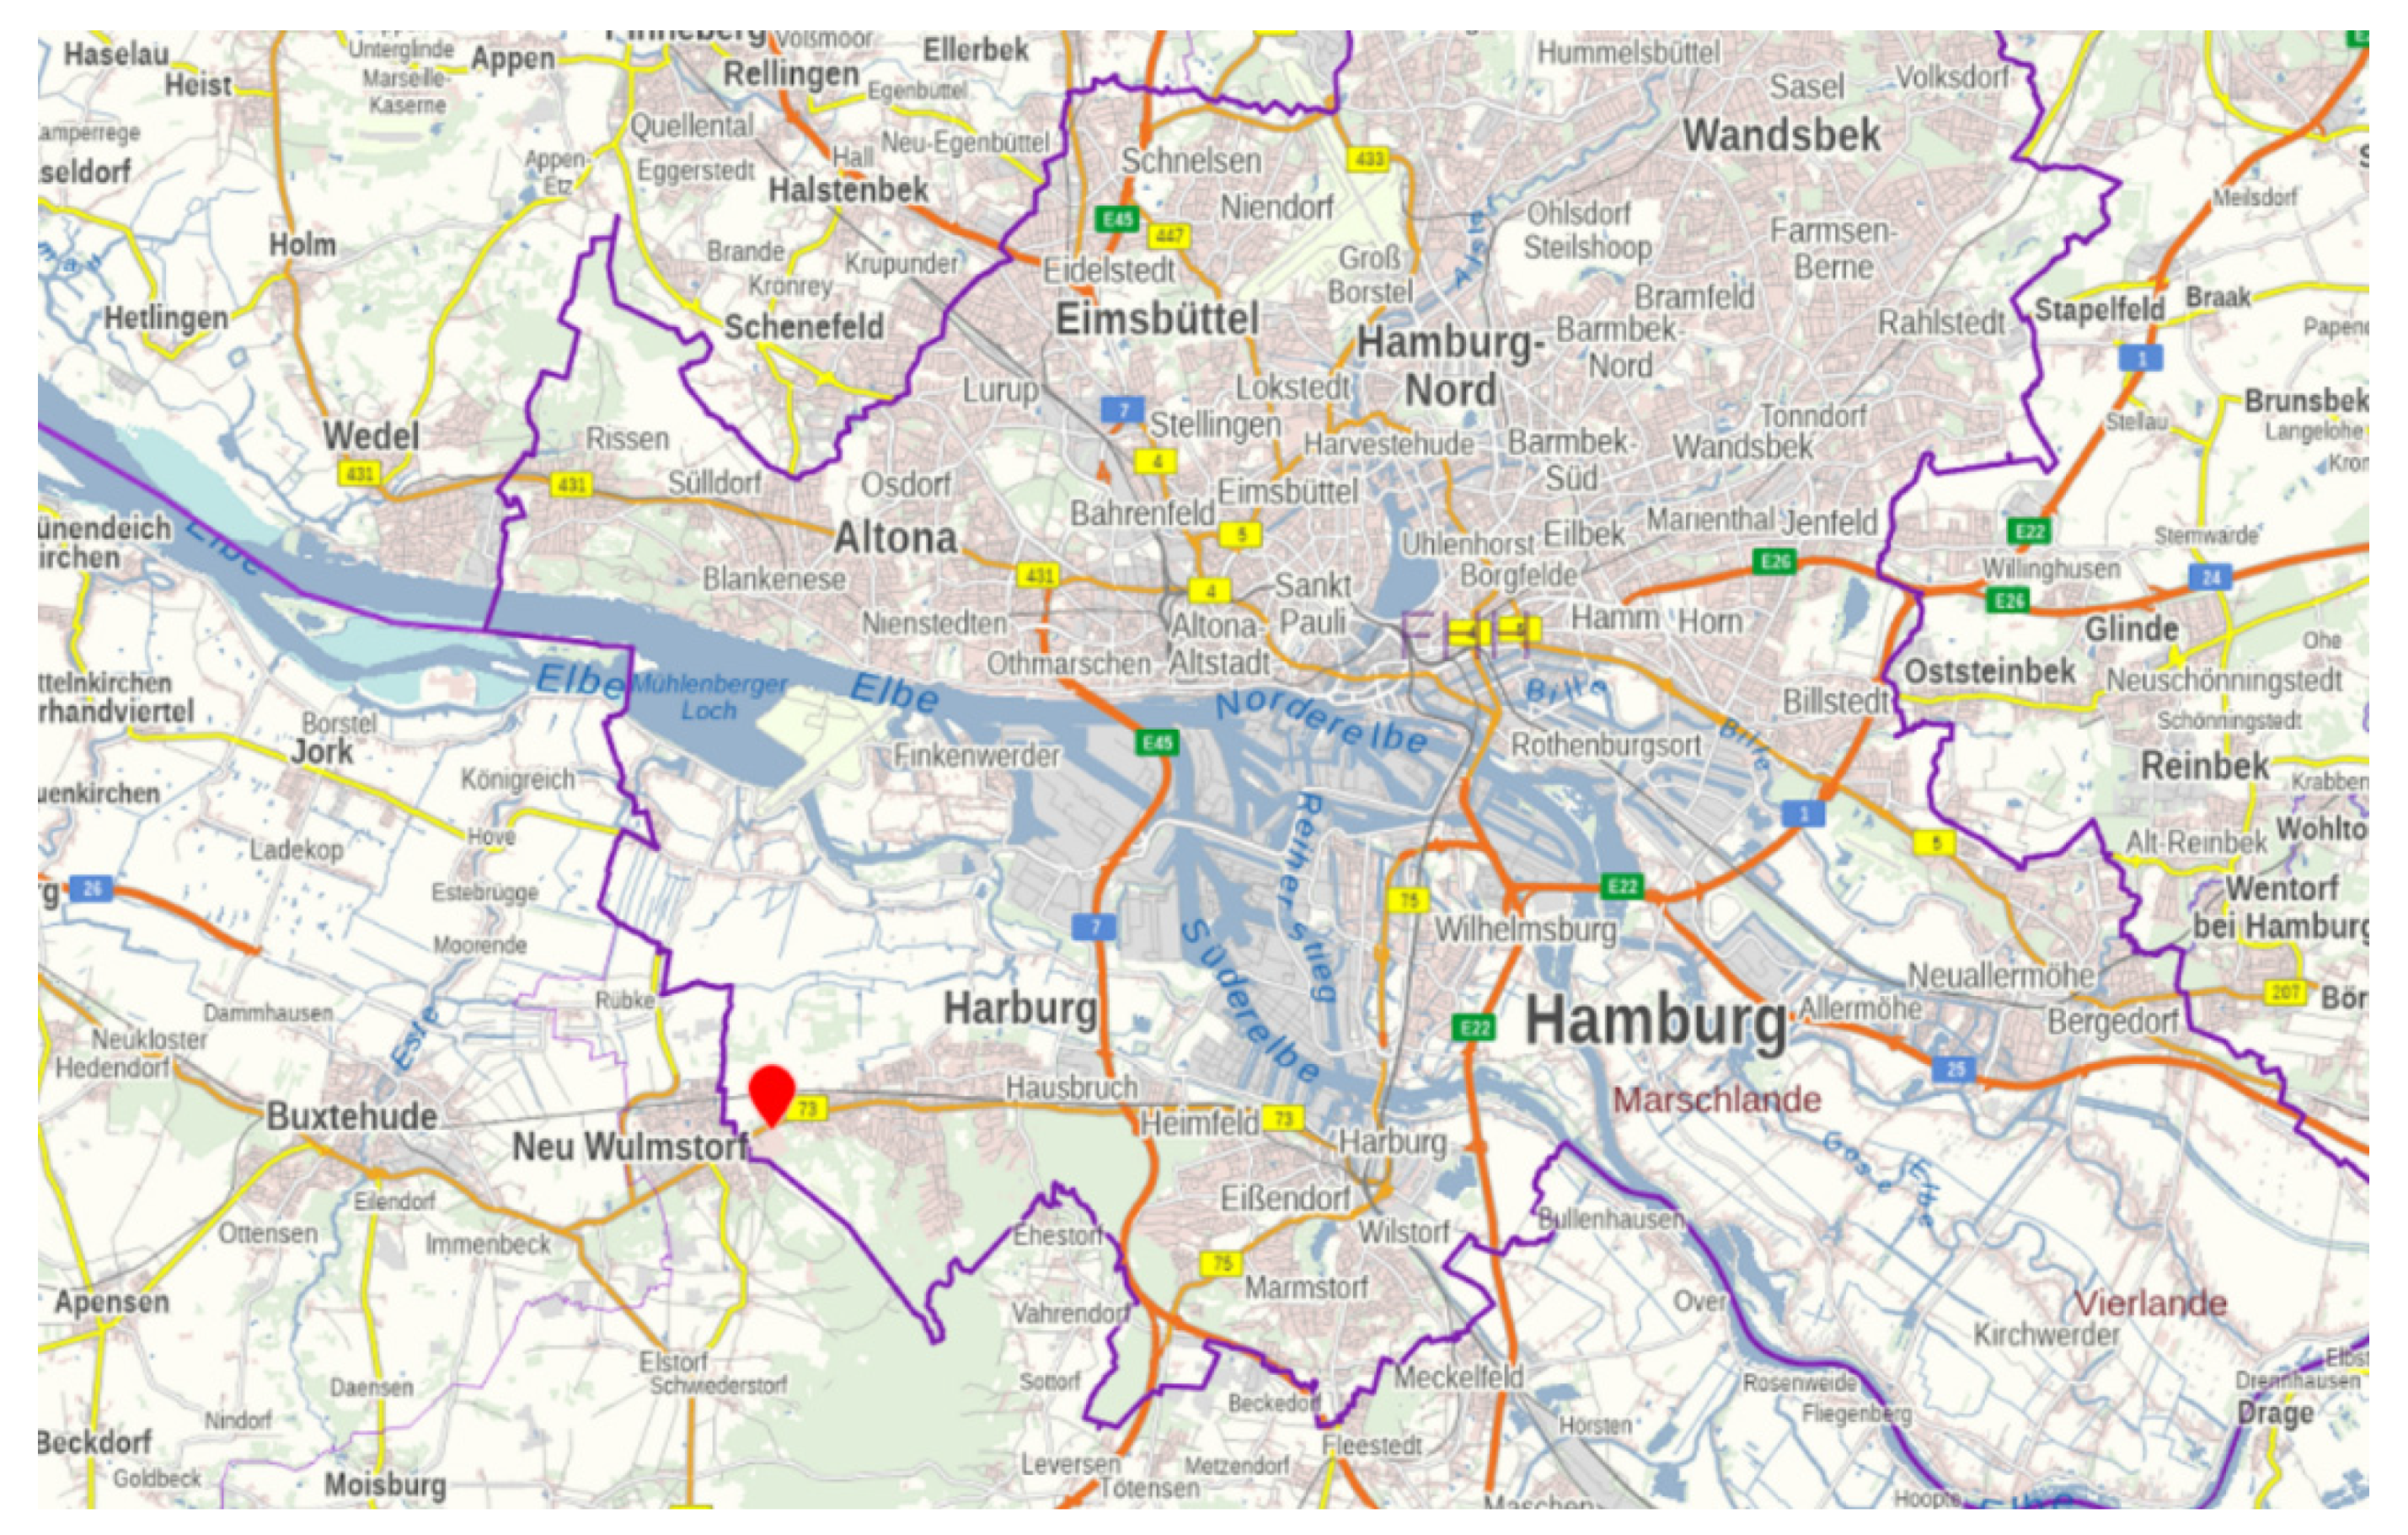
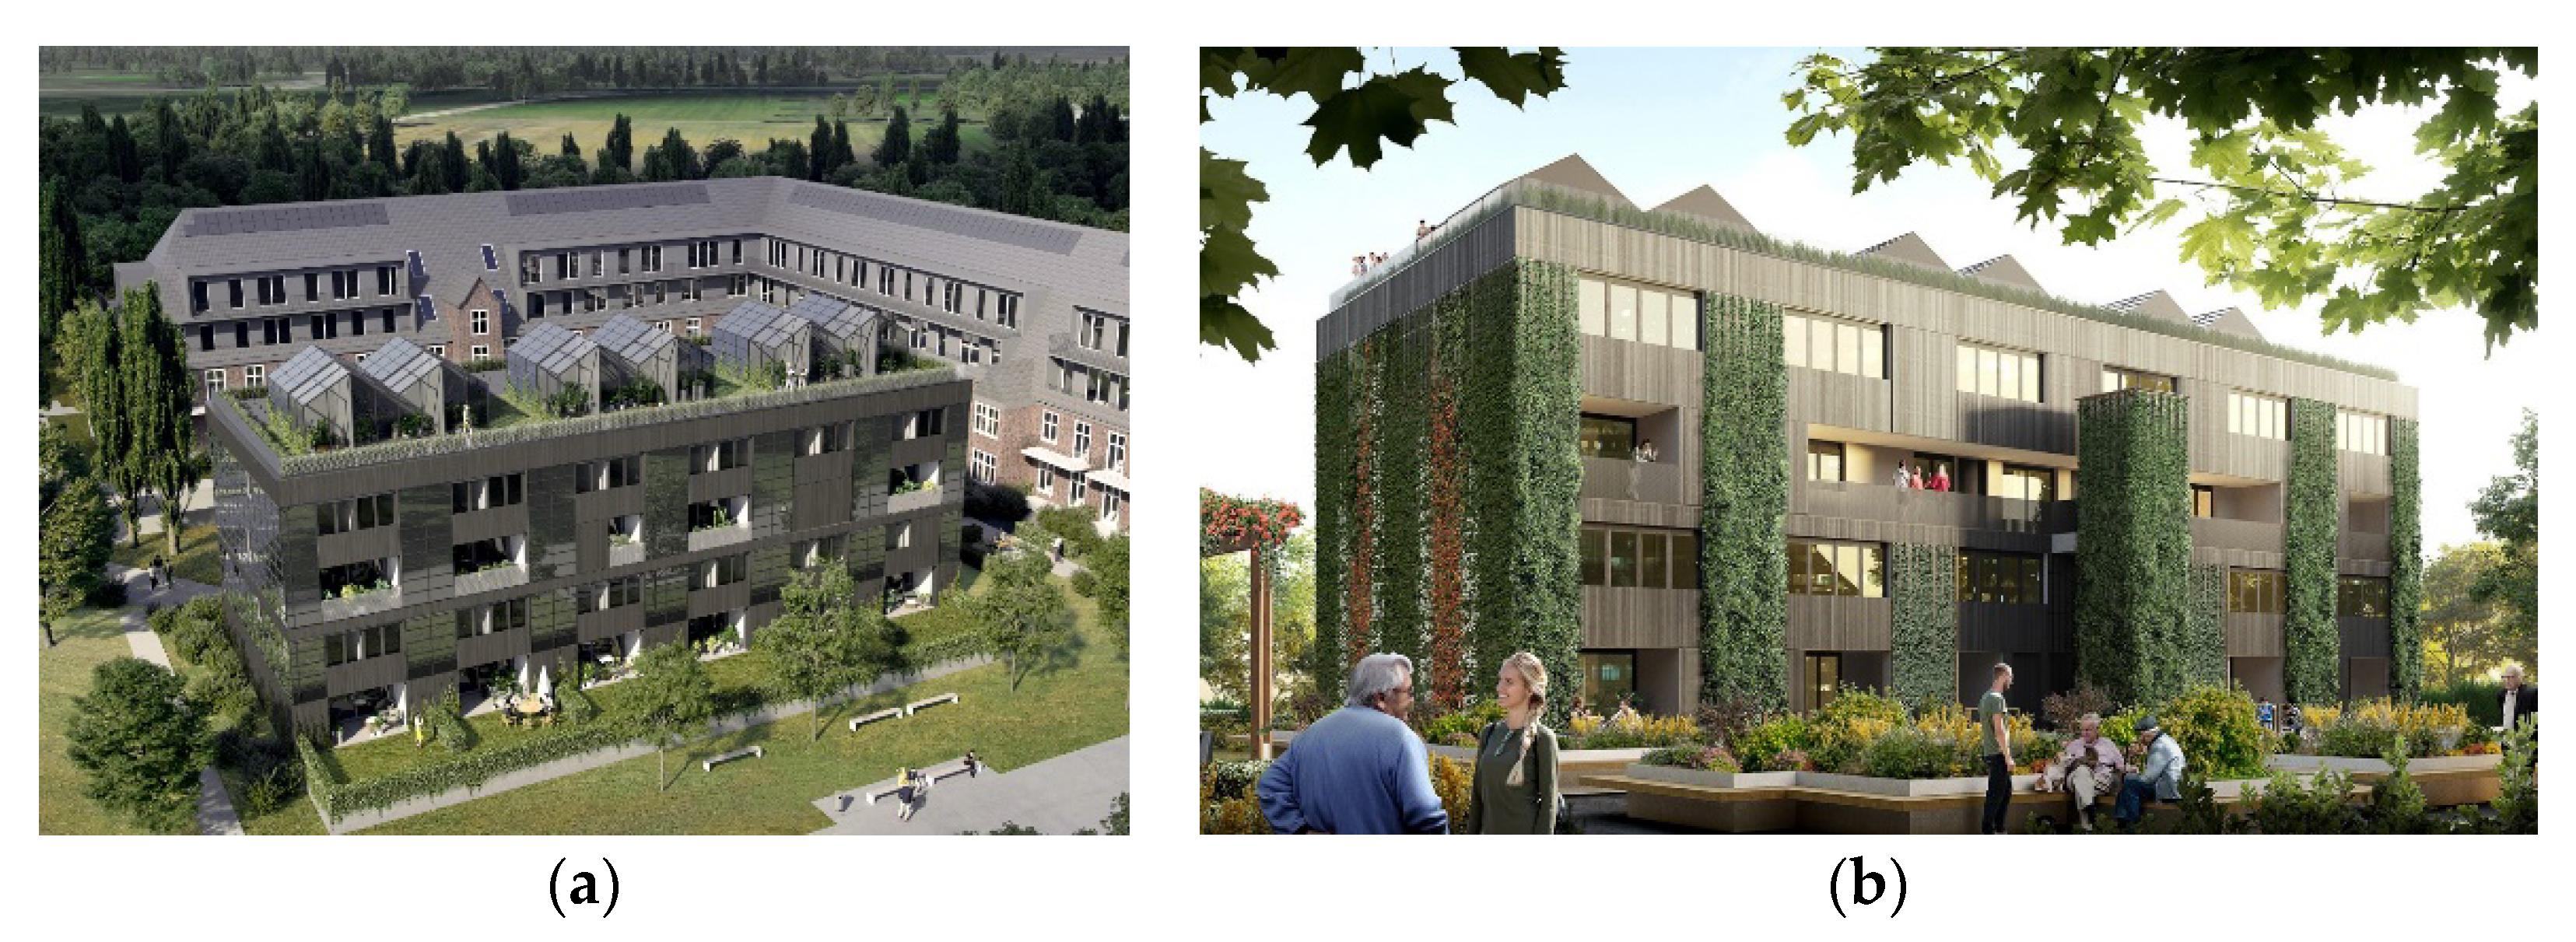
CLEVER-Cities Case Study ‘Green Roof and Façade’
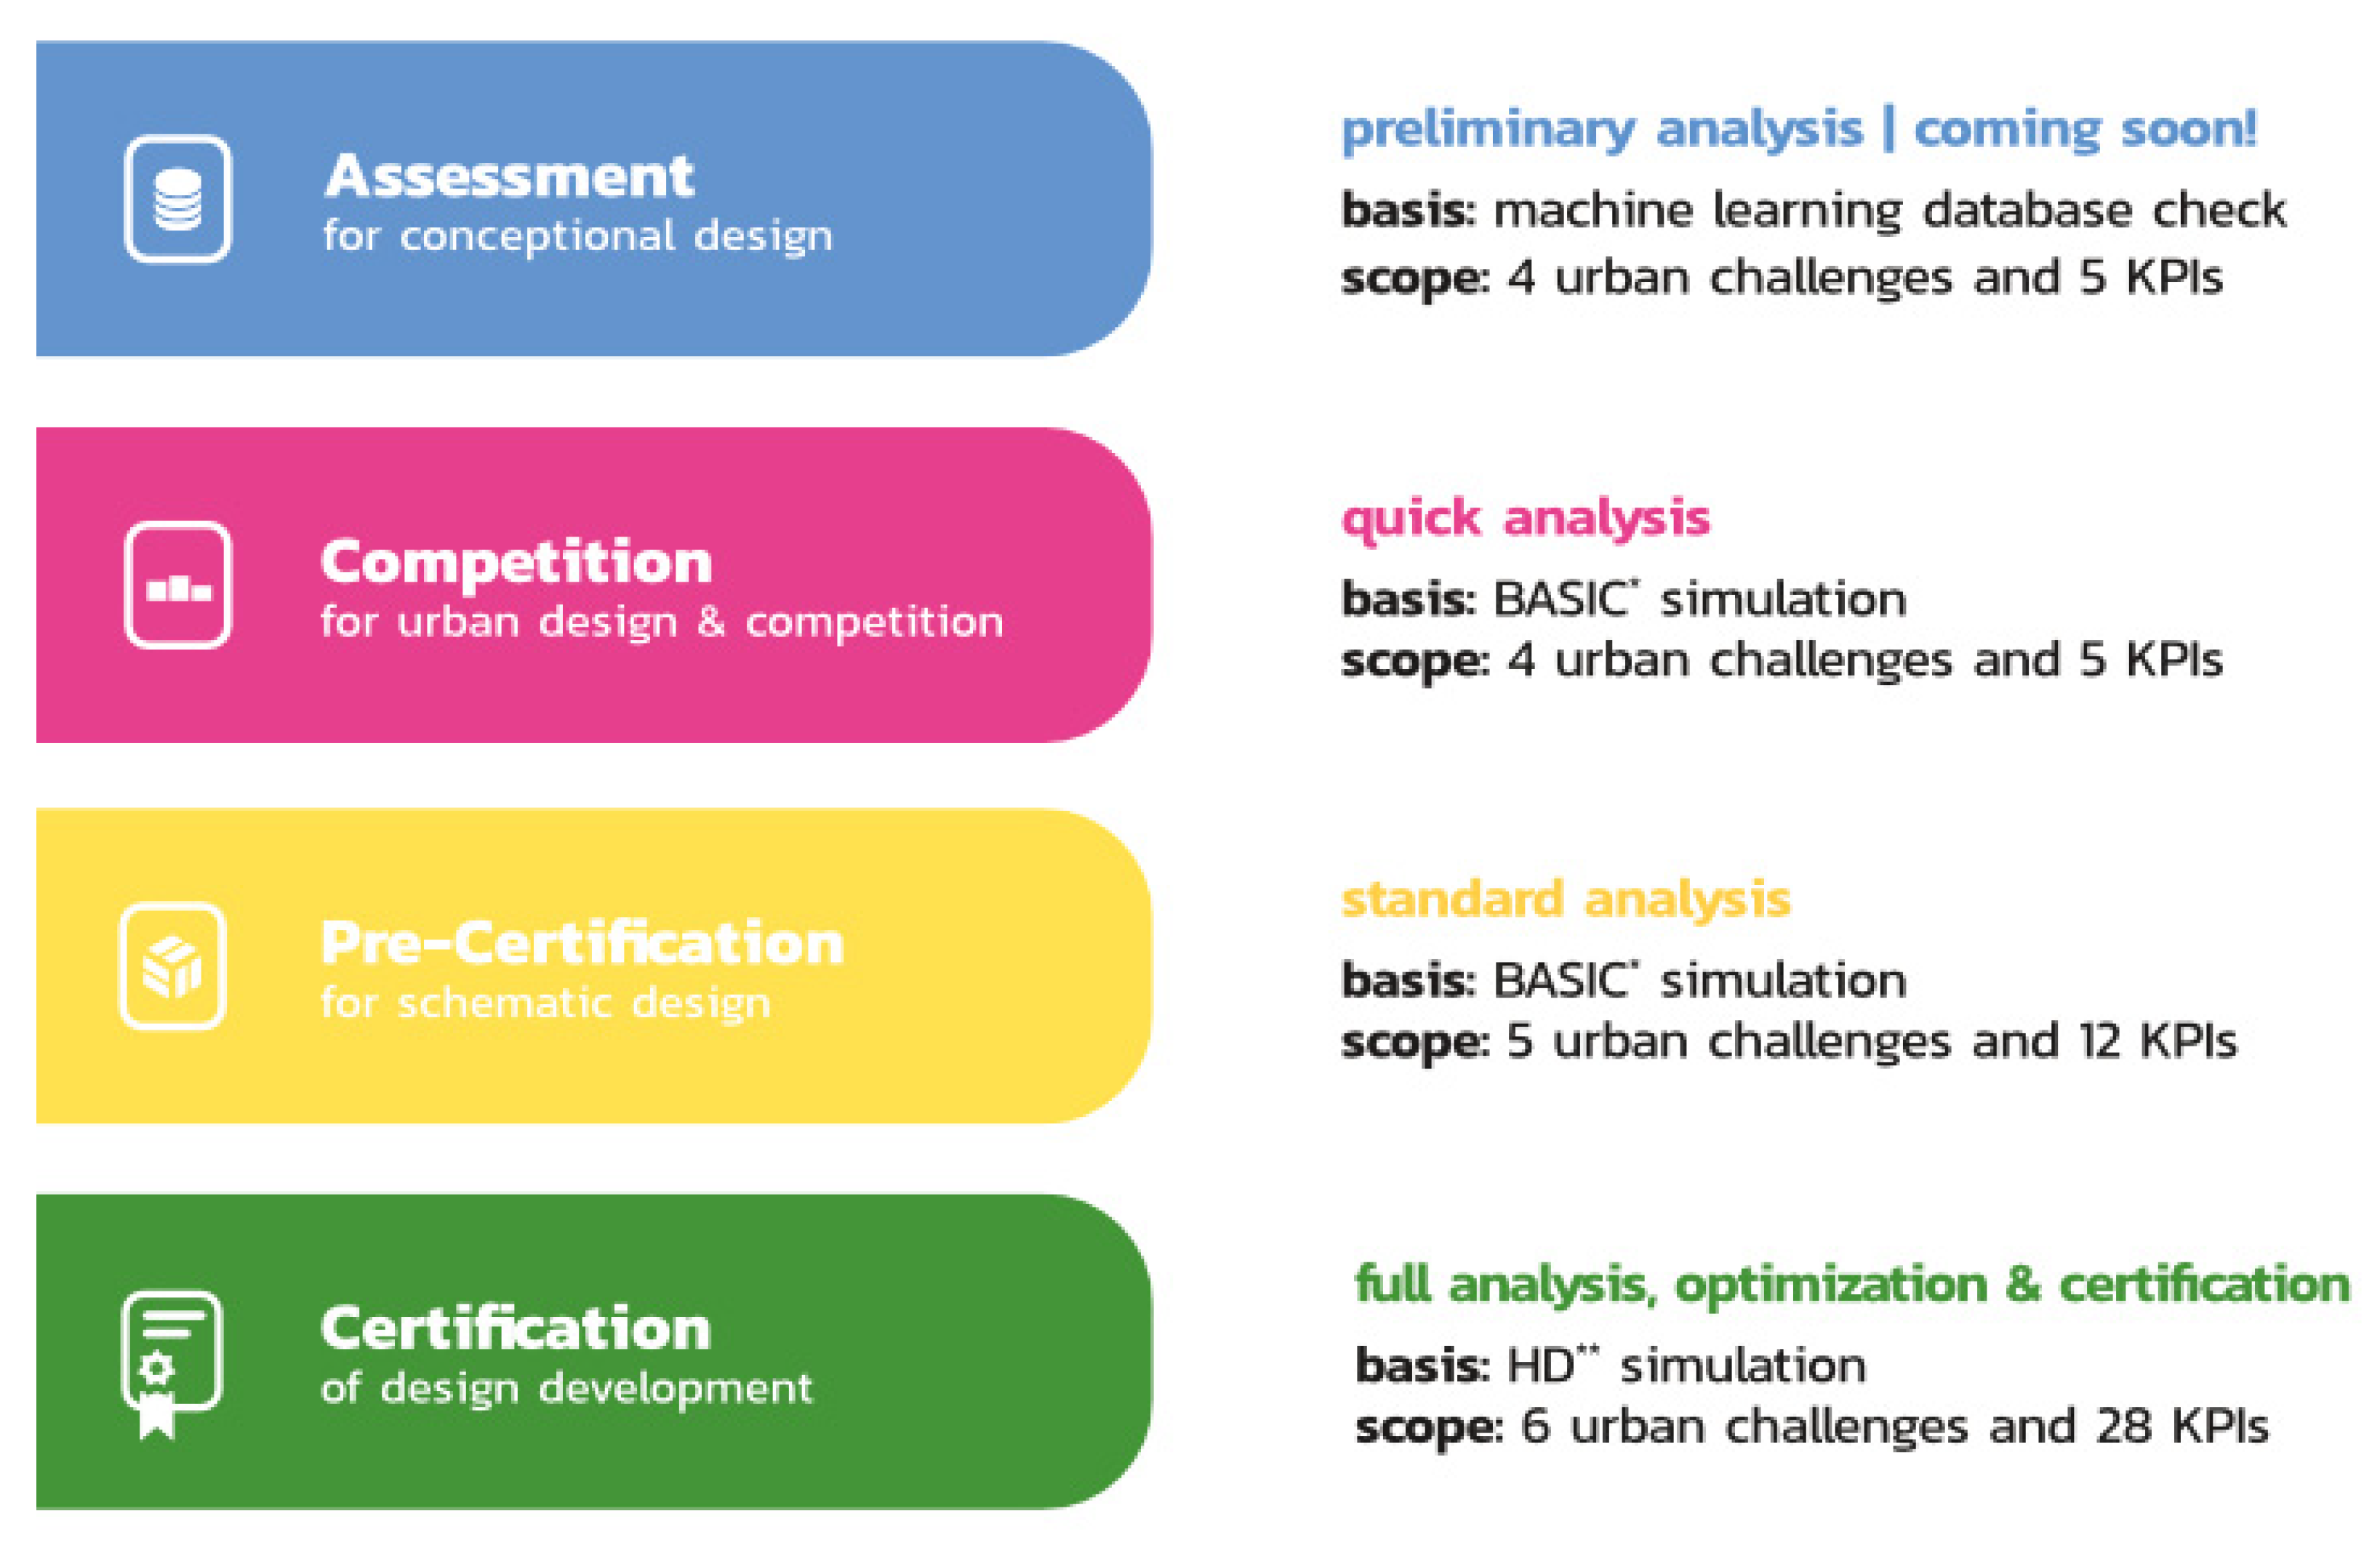
2. Greenpass NBS Impact Evaluation Methodology
2.1. Greenpass Key Components
- Software
- Expert Systems
- Evaluation System
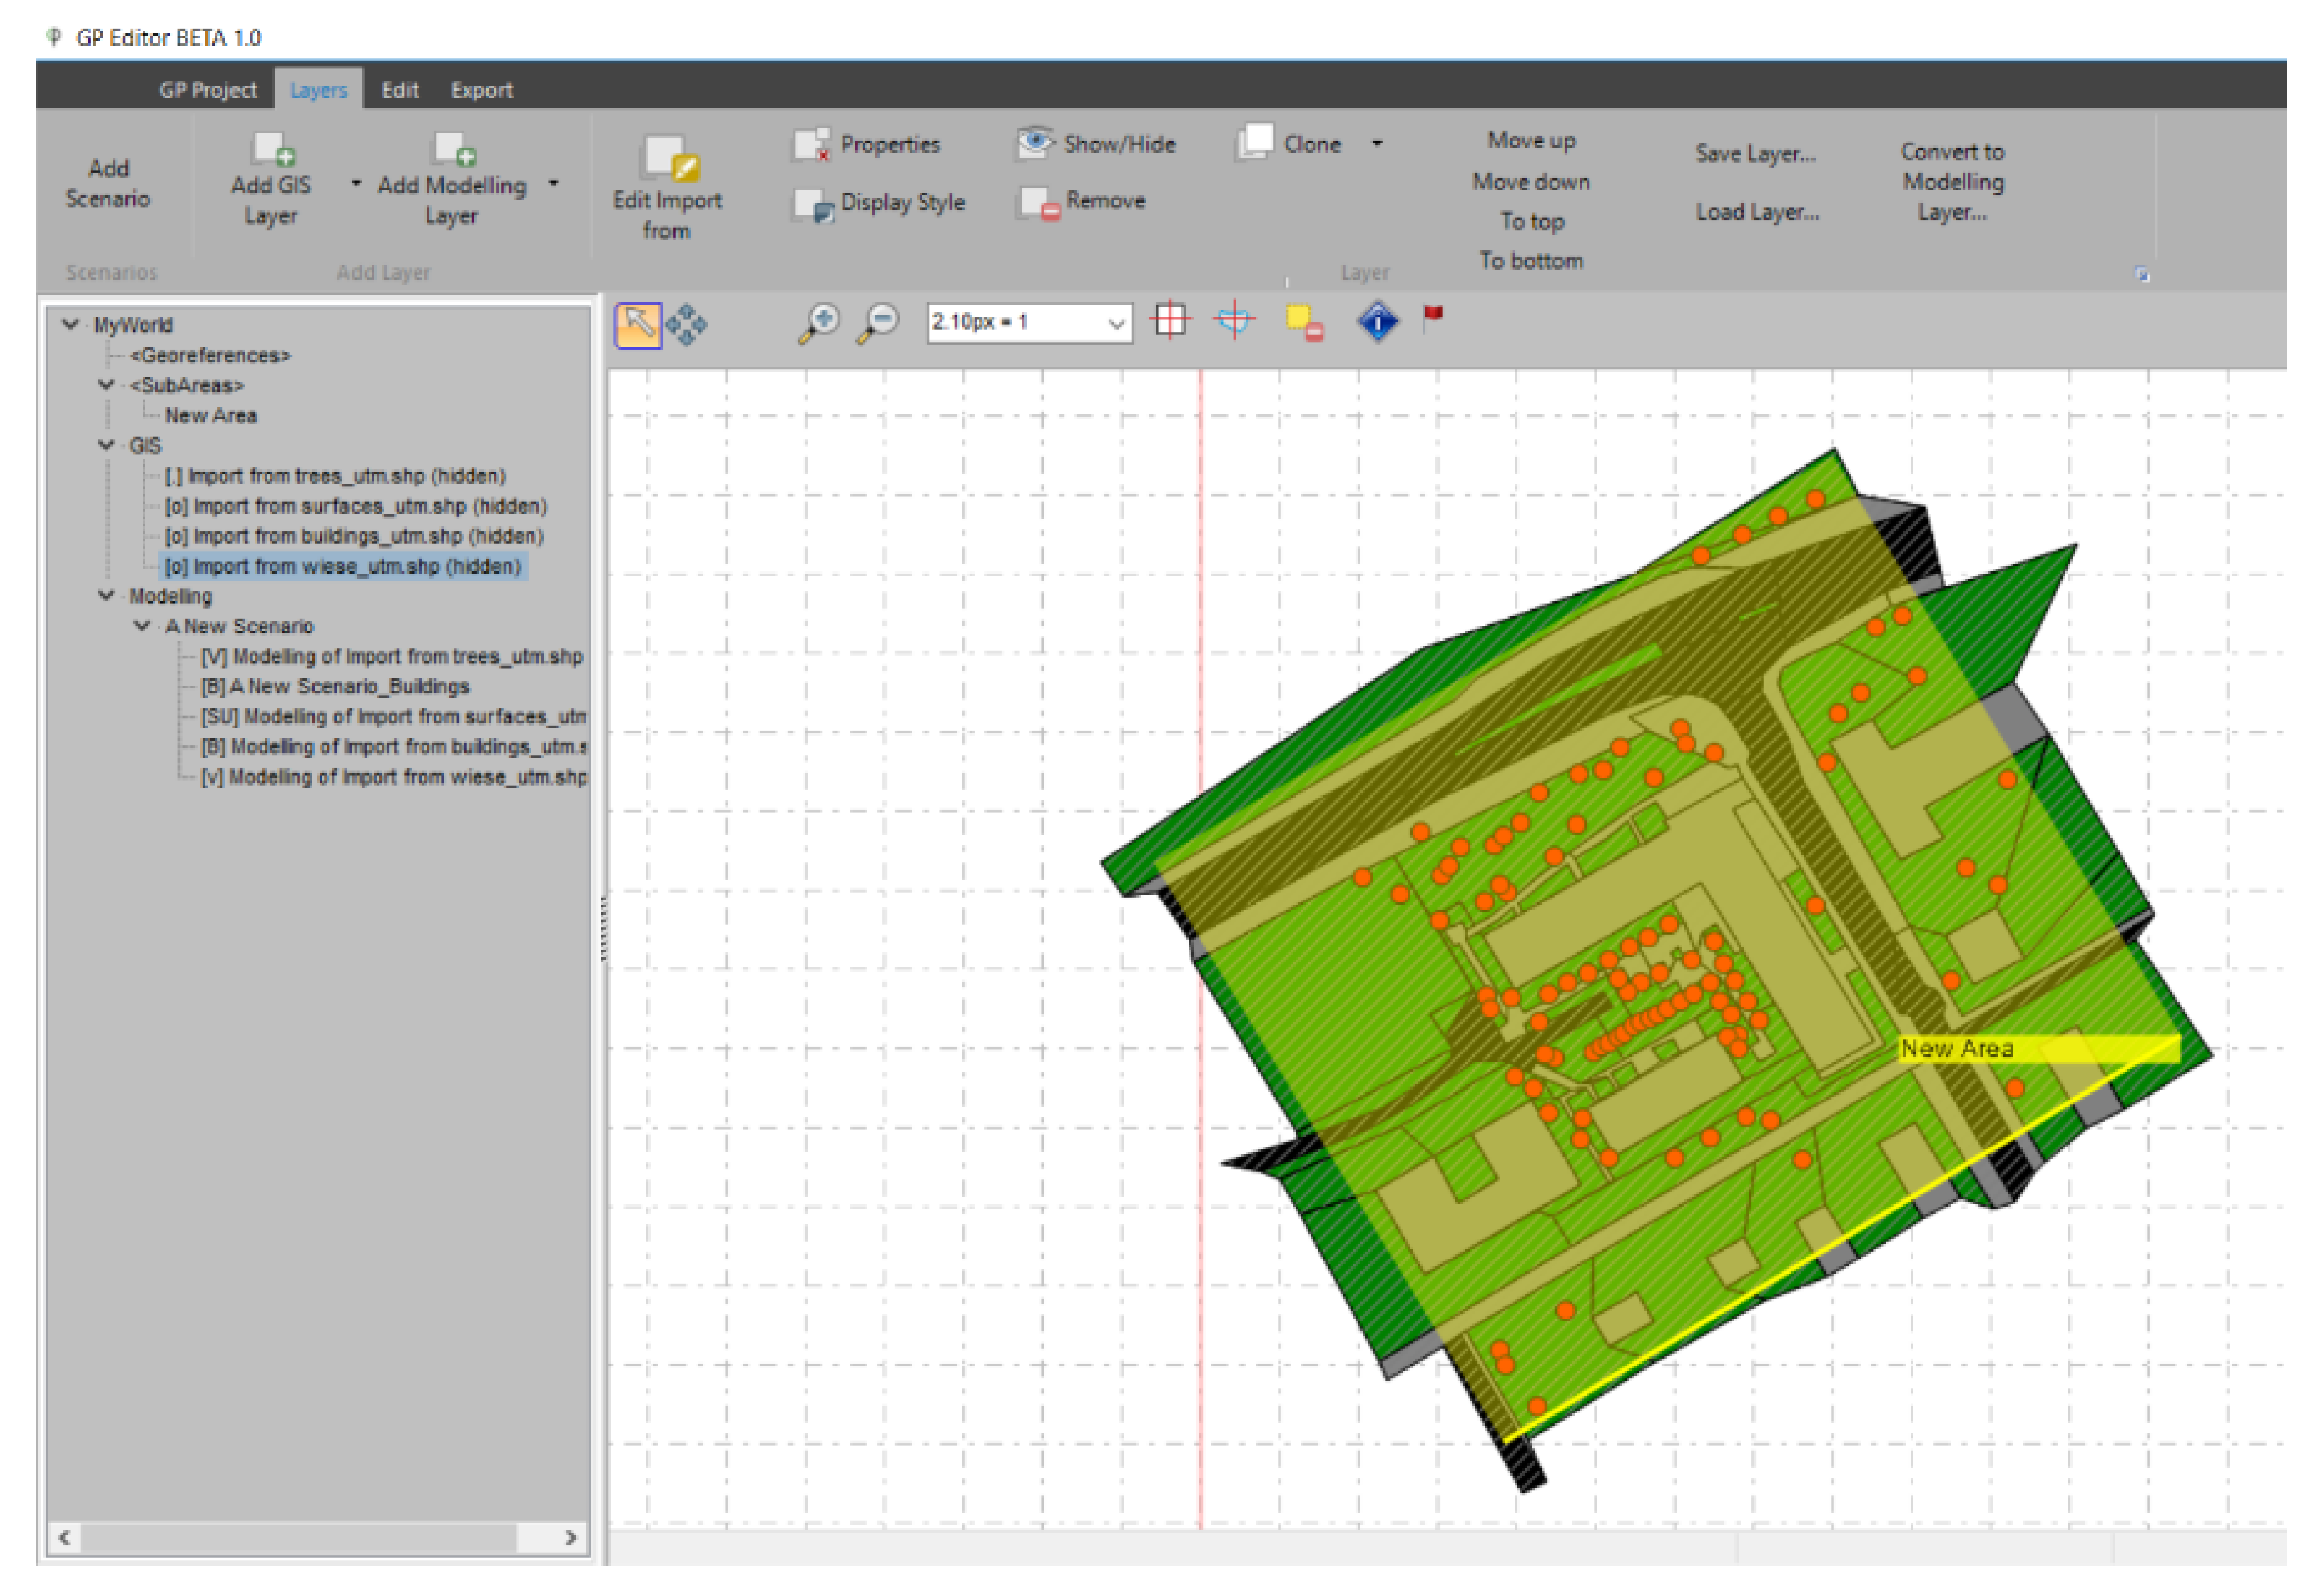
2.2. Software—Greenpass Editor
2.3. Microclimate and Wind Expert Simulation Systems
2.4. Greenpass Evaluation System
- Thermal Load Score (TLS)
- Thermal Comfort Score (TCS)
- Thermal Storage Score (TSS)
- Run-off Score (ROS)
- Carbon Sequestration Score (CSS)
- Thermal Performance (PET)
- Radiation (RAD)
- Albedo (ALB)
- Shading Area Factor (SAF)
- Leaf Area (LAR)
- Evapotranspiration (EVA)
- Wind Resistance (WRS)
2.5. Thermal Comfort Score

| No. | Component | Explanation |
|---|---|---|
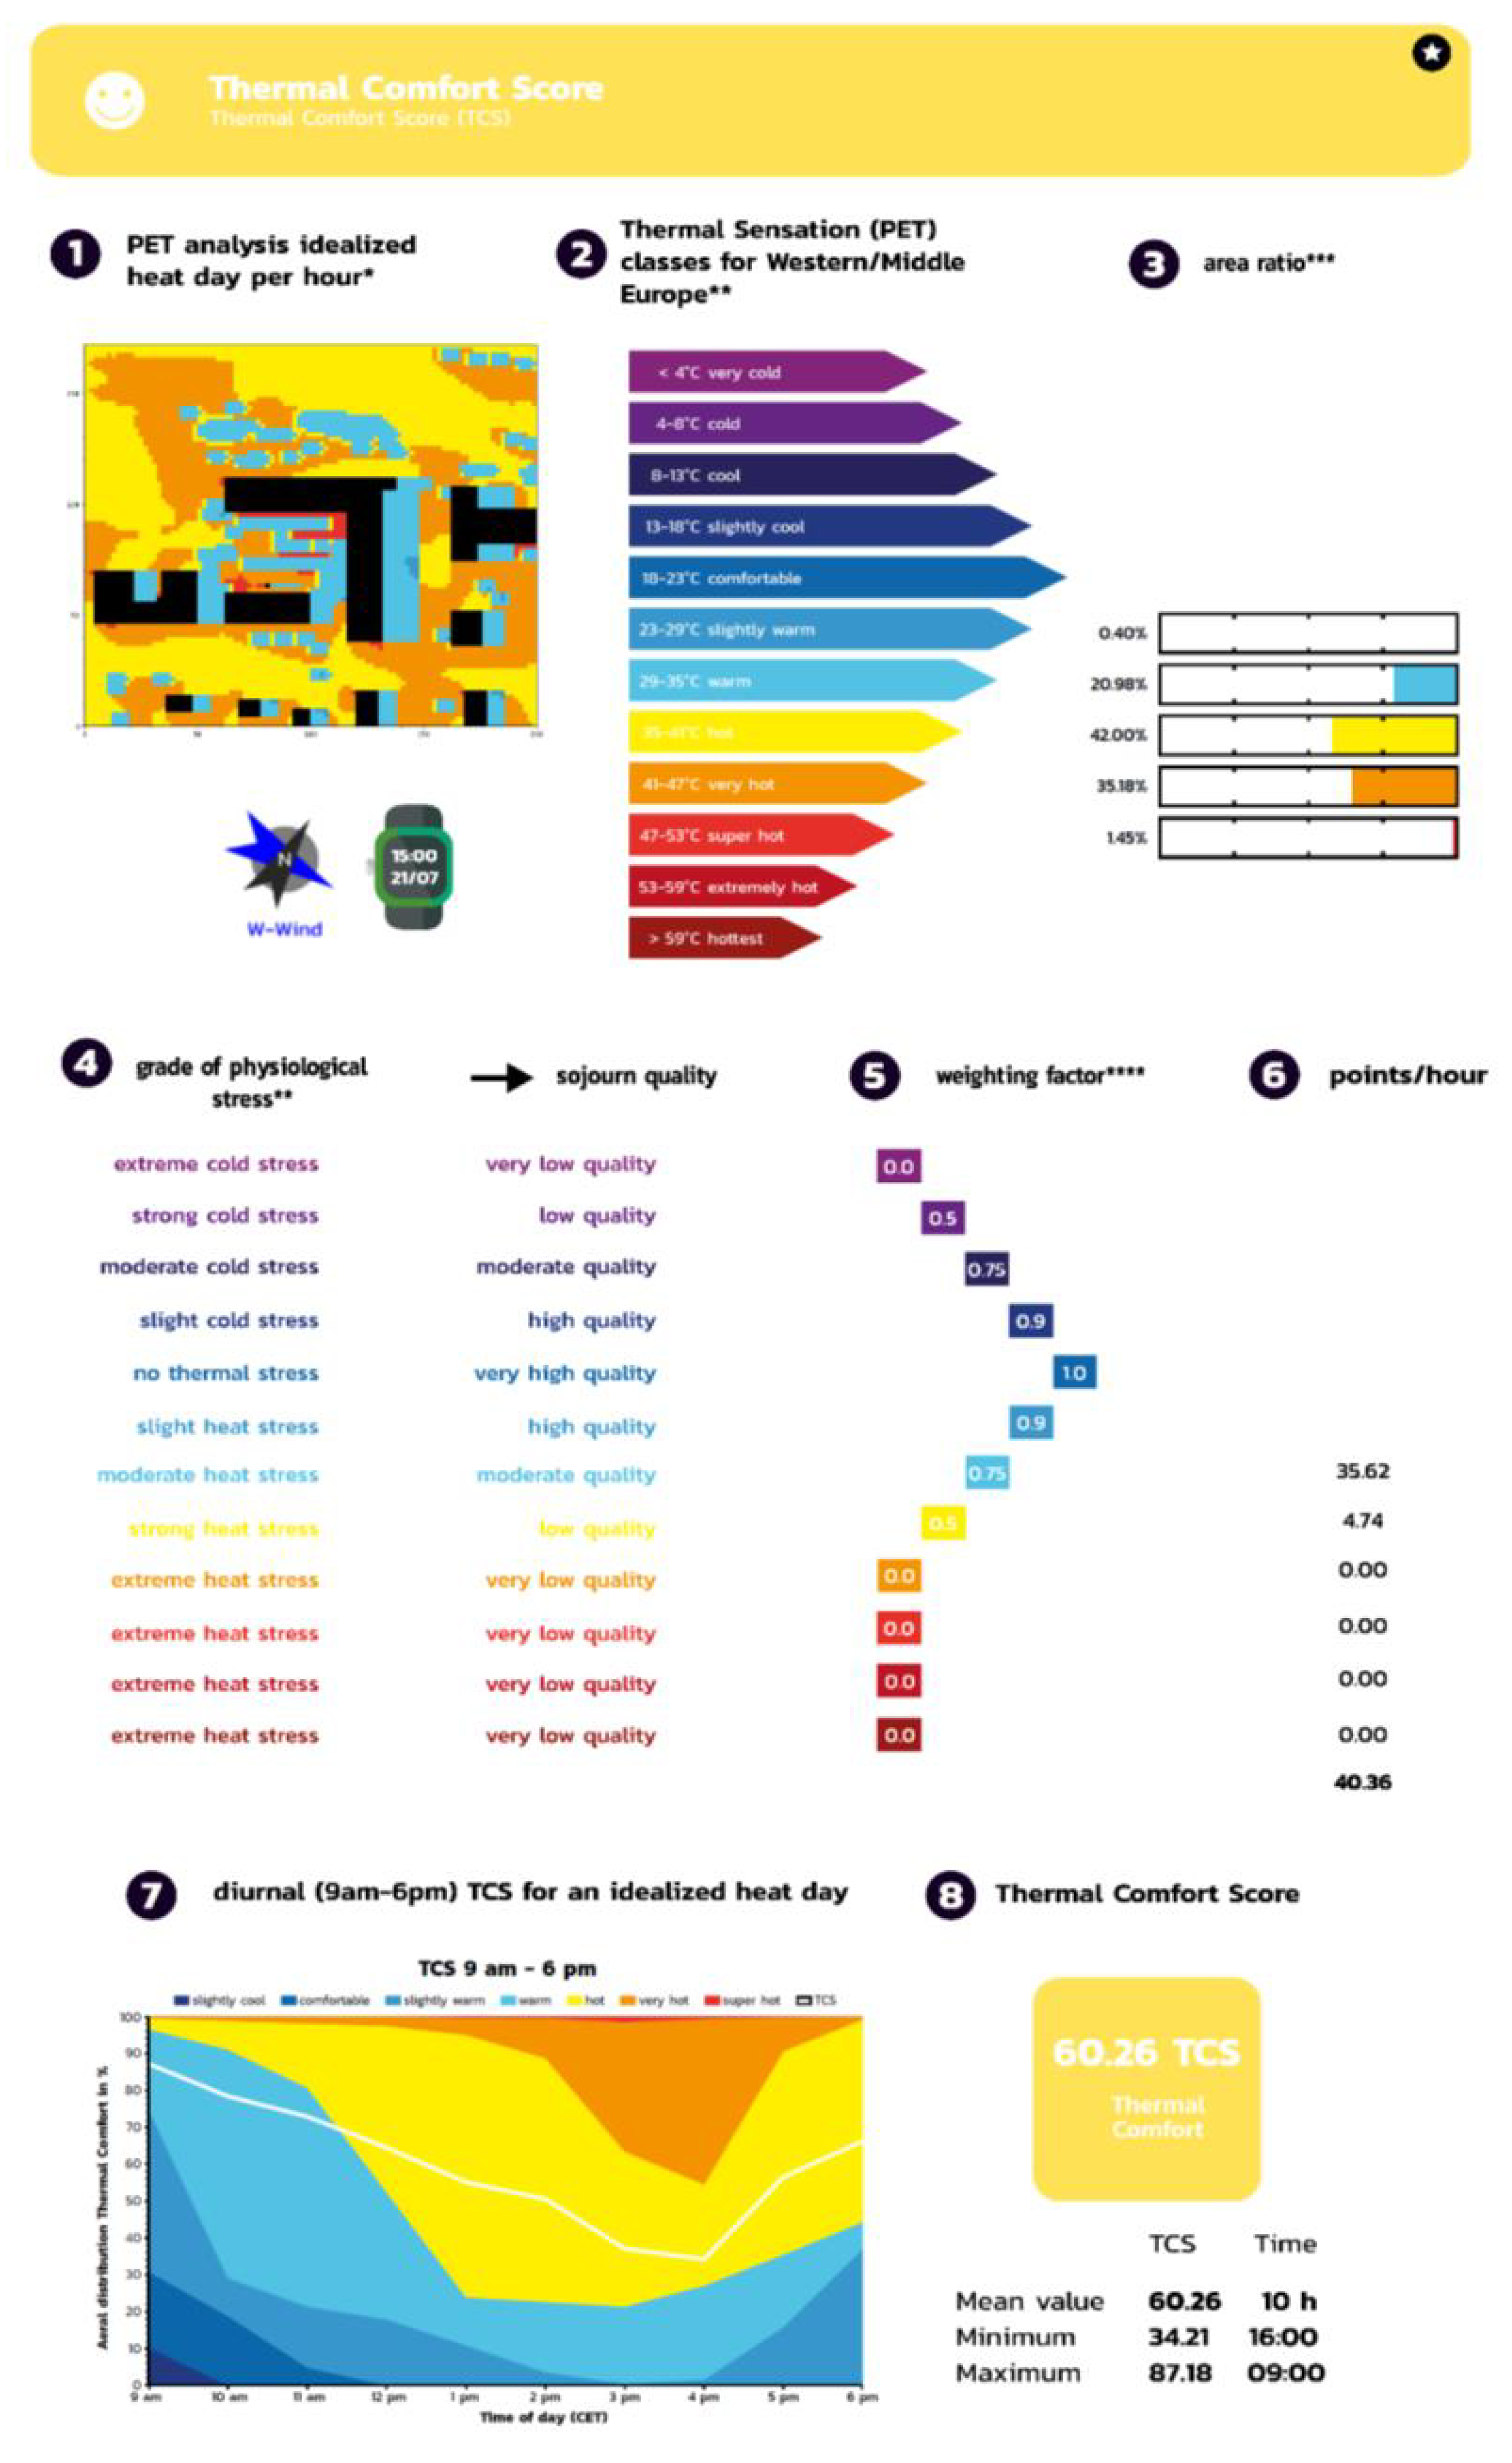
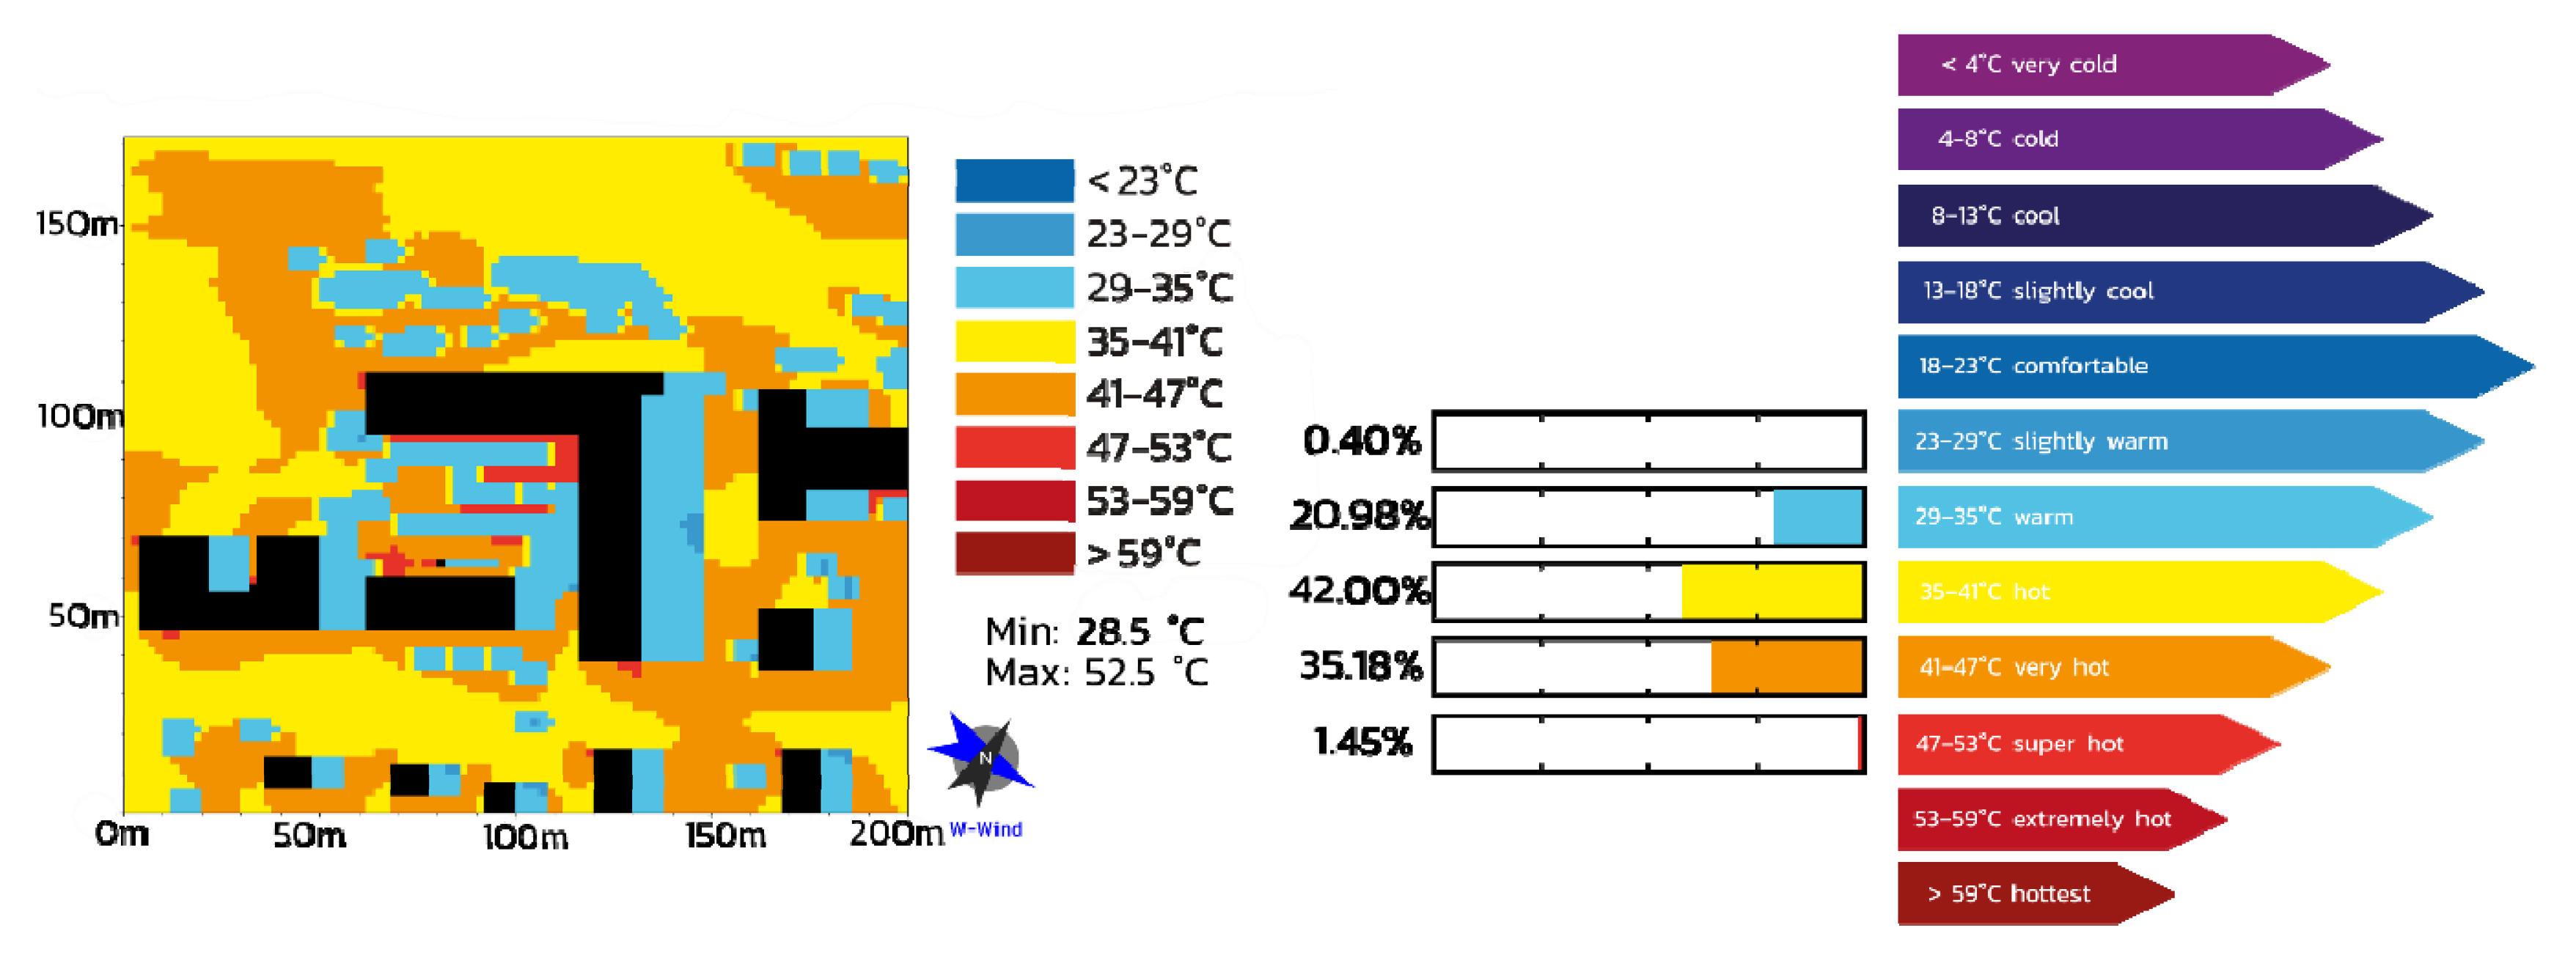
| 1 | PET Analysis | An analysis of the physiological equivalent temperature (PET) coming from expert simulation results (e.g., ENVI_met), in form of a heat map, serves as base for the TCS calculation. The heat maps are colored with a standardized color set and legend classes and are linked to the perception classes. |
| 2 | Thermal sensation classes | The TCS is based on thermal sensation classes linked to the bio-human thermal index PET, selected for the respective climate zones and cultural behavior expressing the thermal perception and sensitivity of human beings in terms of thermo-physiological stress. As shown in Figure 7 the sensation classes for Western/Middle Europe were applied within the project frame [28]. |
| 3 | Area ratio | In a next step, the relative ratio of the particular human sensation classes, occurring in the heat map result of the project area, is split and shows the appearance of areas with thermo-physiological stress within the project area at the observation time. |
| 4 | Sojourn quality | The sojourn quality is related to the quality of open space and strongly linked to human sensation classes and areas with thermo-physiological stress. The qualities vary from ‘very high quality’, ‘high quality’, ‘moderate quality’, ‘low quality’ to ‘very low quality’. A ‘comfortable’ thermal sensitivity induces no thermal stress and thus following featuring a very high sojourn quality, while ‘slightly warm’ creates a slight heat stress leading to a high sojourn quality in open space. ‘Warm’ areas generate a moderate heat stress and a moderate sojourn quality, ‘hot’ areas induce a strong heat stress with a low sojourn quality. From ‘Very Hot’ upward it creates extreme heat stress with a very low sojourn quality. The same principle is applied for the thermal sensation classes below ‘comfortable’ regarding cold stress (see Figure 7). |
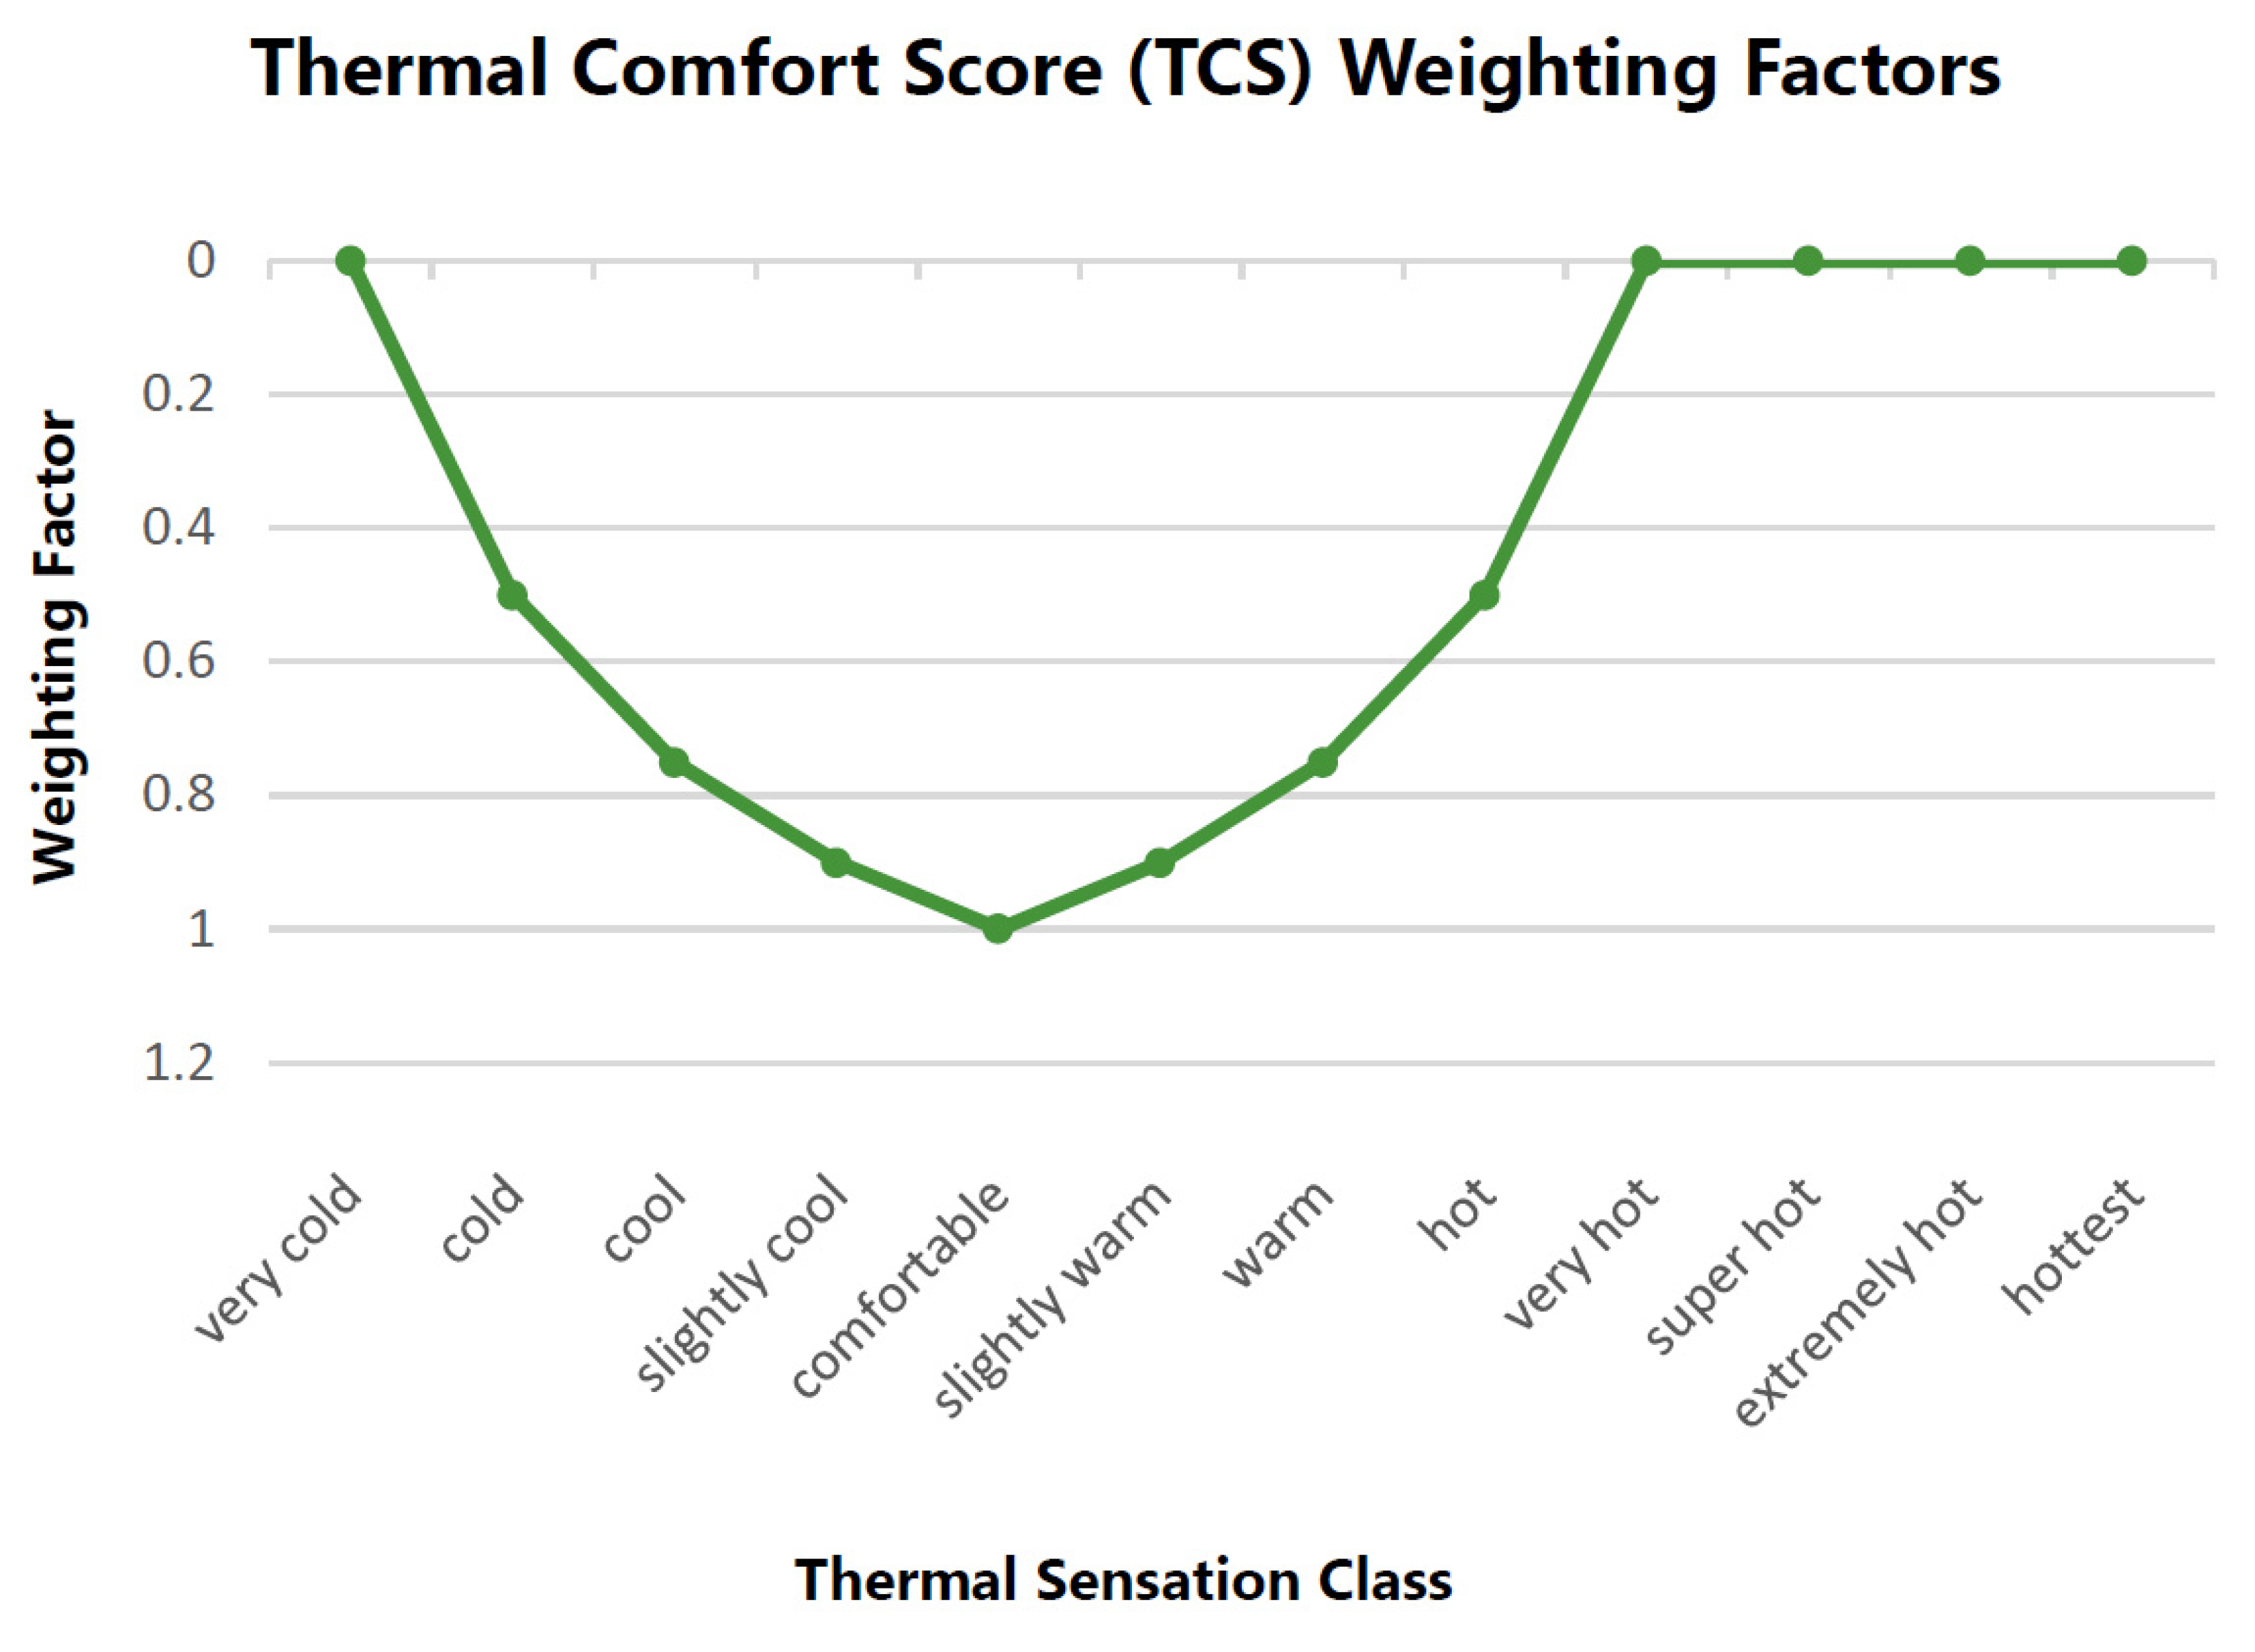
| 5 | Weighting factor | The weighting factors are based on the grade of thermo-physiological stress and the linked sojourn quality classes. According to the Predicted Mean Vote grading system and the principle of Index Indicators, the weighting factors have been defined, counting ‘comfortable’ with no thermal stress and a very high sojourn quality as the upper index base (1) and ‘very hot’ (and above) and ‘very cold’ with extreme heat and cold stress and related very low sojourn quality as lower index base (0). For the thermal sensation classes in between, a gradation linked to the grade of physiological stress and sojourn quality has been defined (0.5 | 0.75 | 0.9) in accordance to the Predicted Percentage of Dissatisfied model methodology [29] (see Figure 7 and Figure 8). |
| 6 | Points | The TCS expresses total points, calculated by the occurring area ratio of thermal sensation classes in the project area with the respective weighting factor for the classes and summing up in points at the particular observation time. |
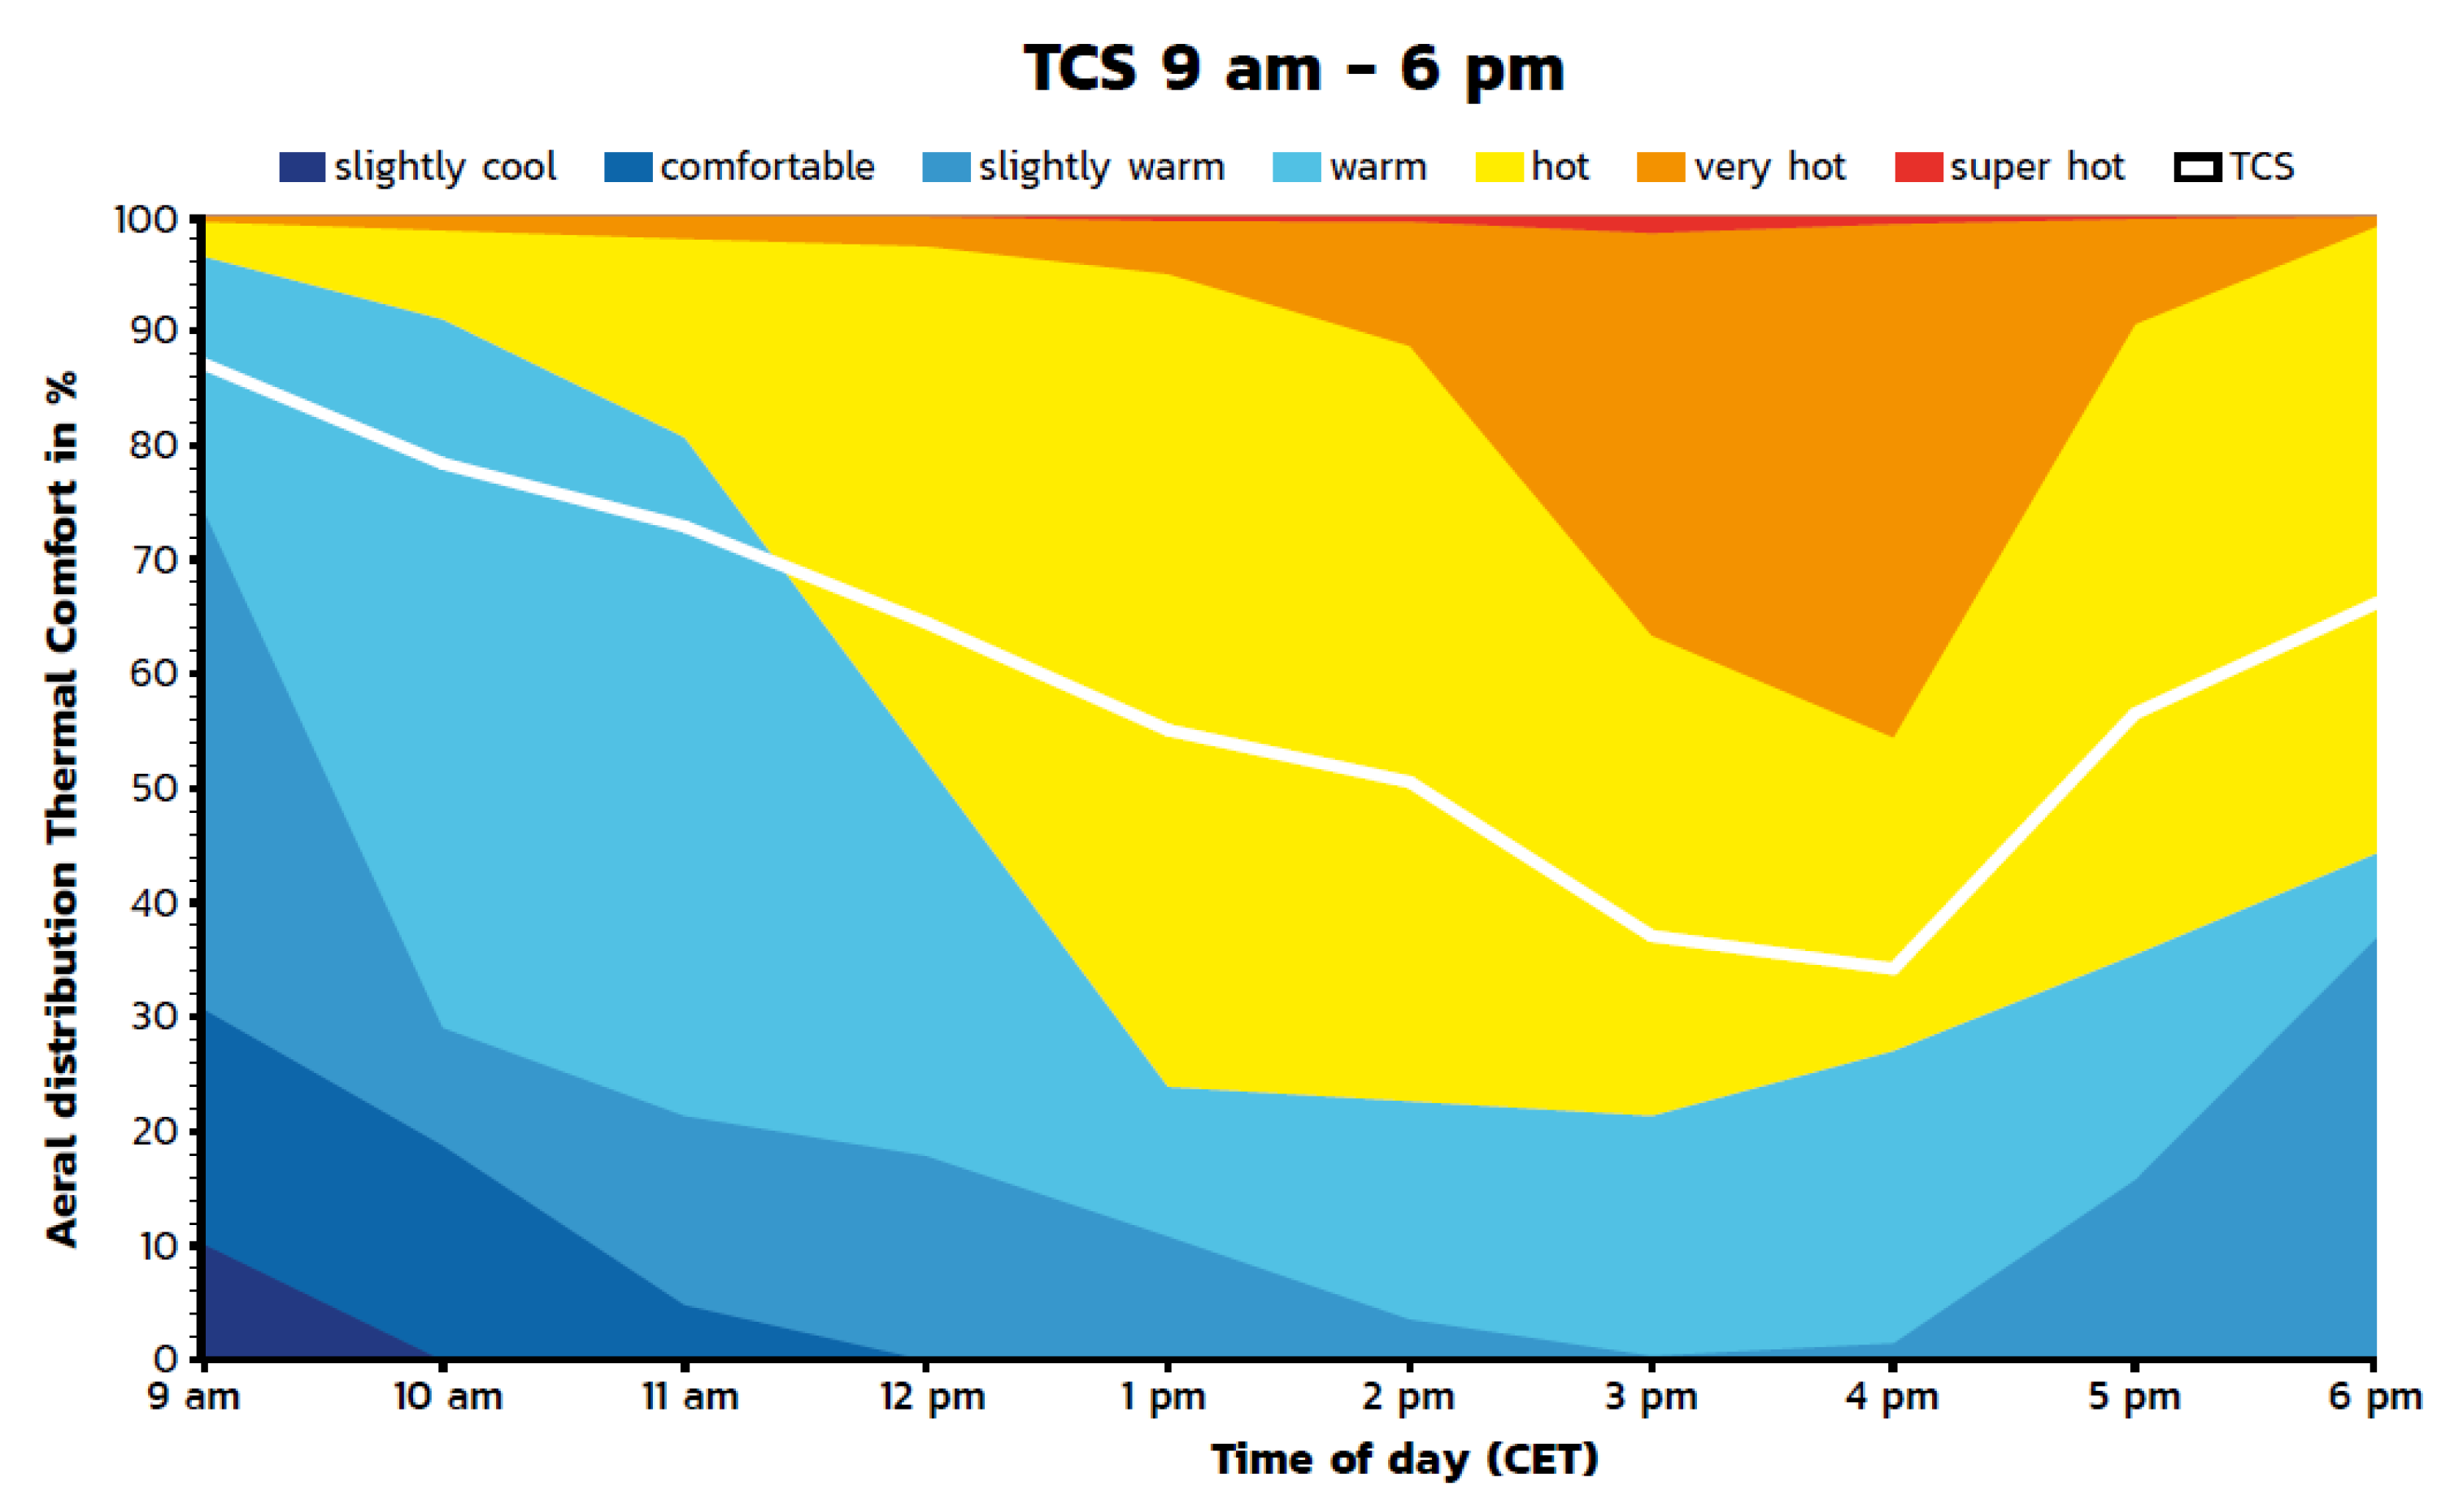
| 7 | Diurnal TCS | In the next step, the described components and steps (1–6) are applied for a diurnal time span from 9 a.m. to 6 p.m. (10 h) and visually expressed in an intuitive graph and in line with the same color set from step 1 and 2, showing the thermal comfort distribution of the project area for human beings during the course of the day. |
| 8 | Thermal Comfort Score | The TCS is finally expressed in a mean value of the diurnal TCS values as well as the minimum and maximum value with their respective time points, showing the ratio of areas with thermo-physiological stress across the day. |
2.6. Evaluation of ‘Fischbeker Höfe’
2.6.1. Selected Expert Simulation Systems
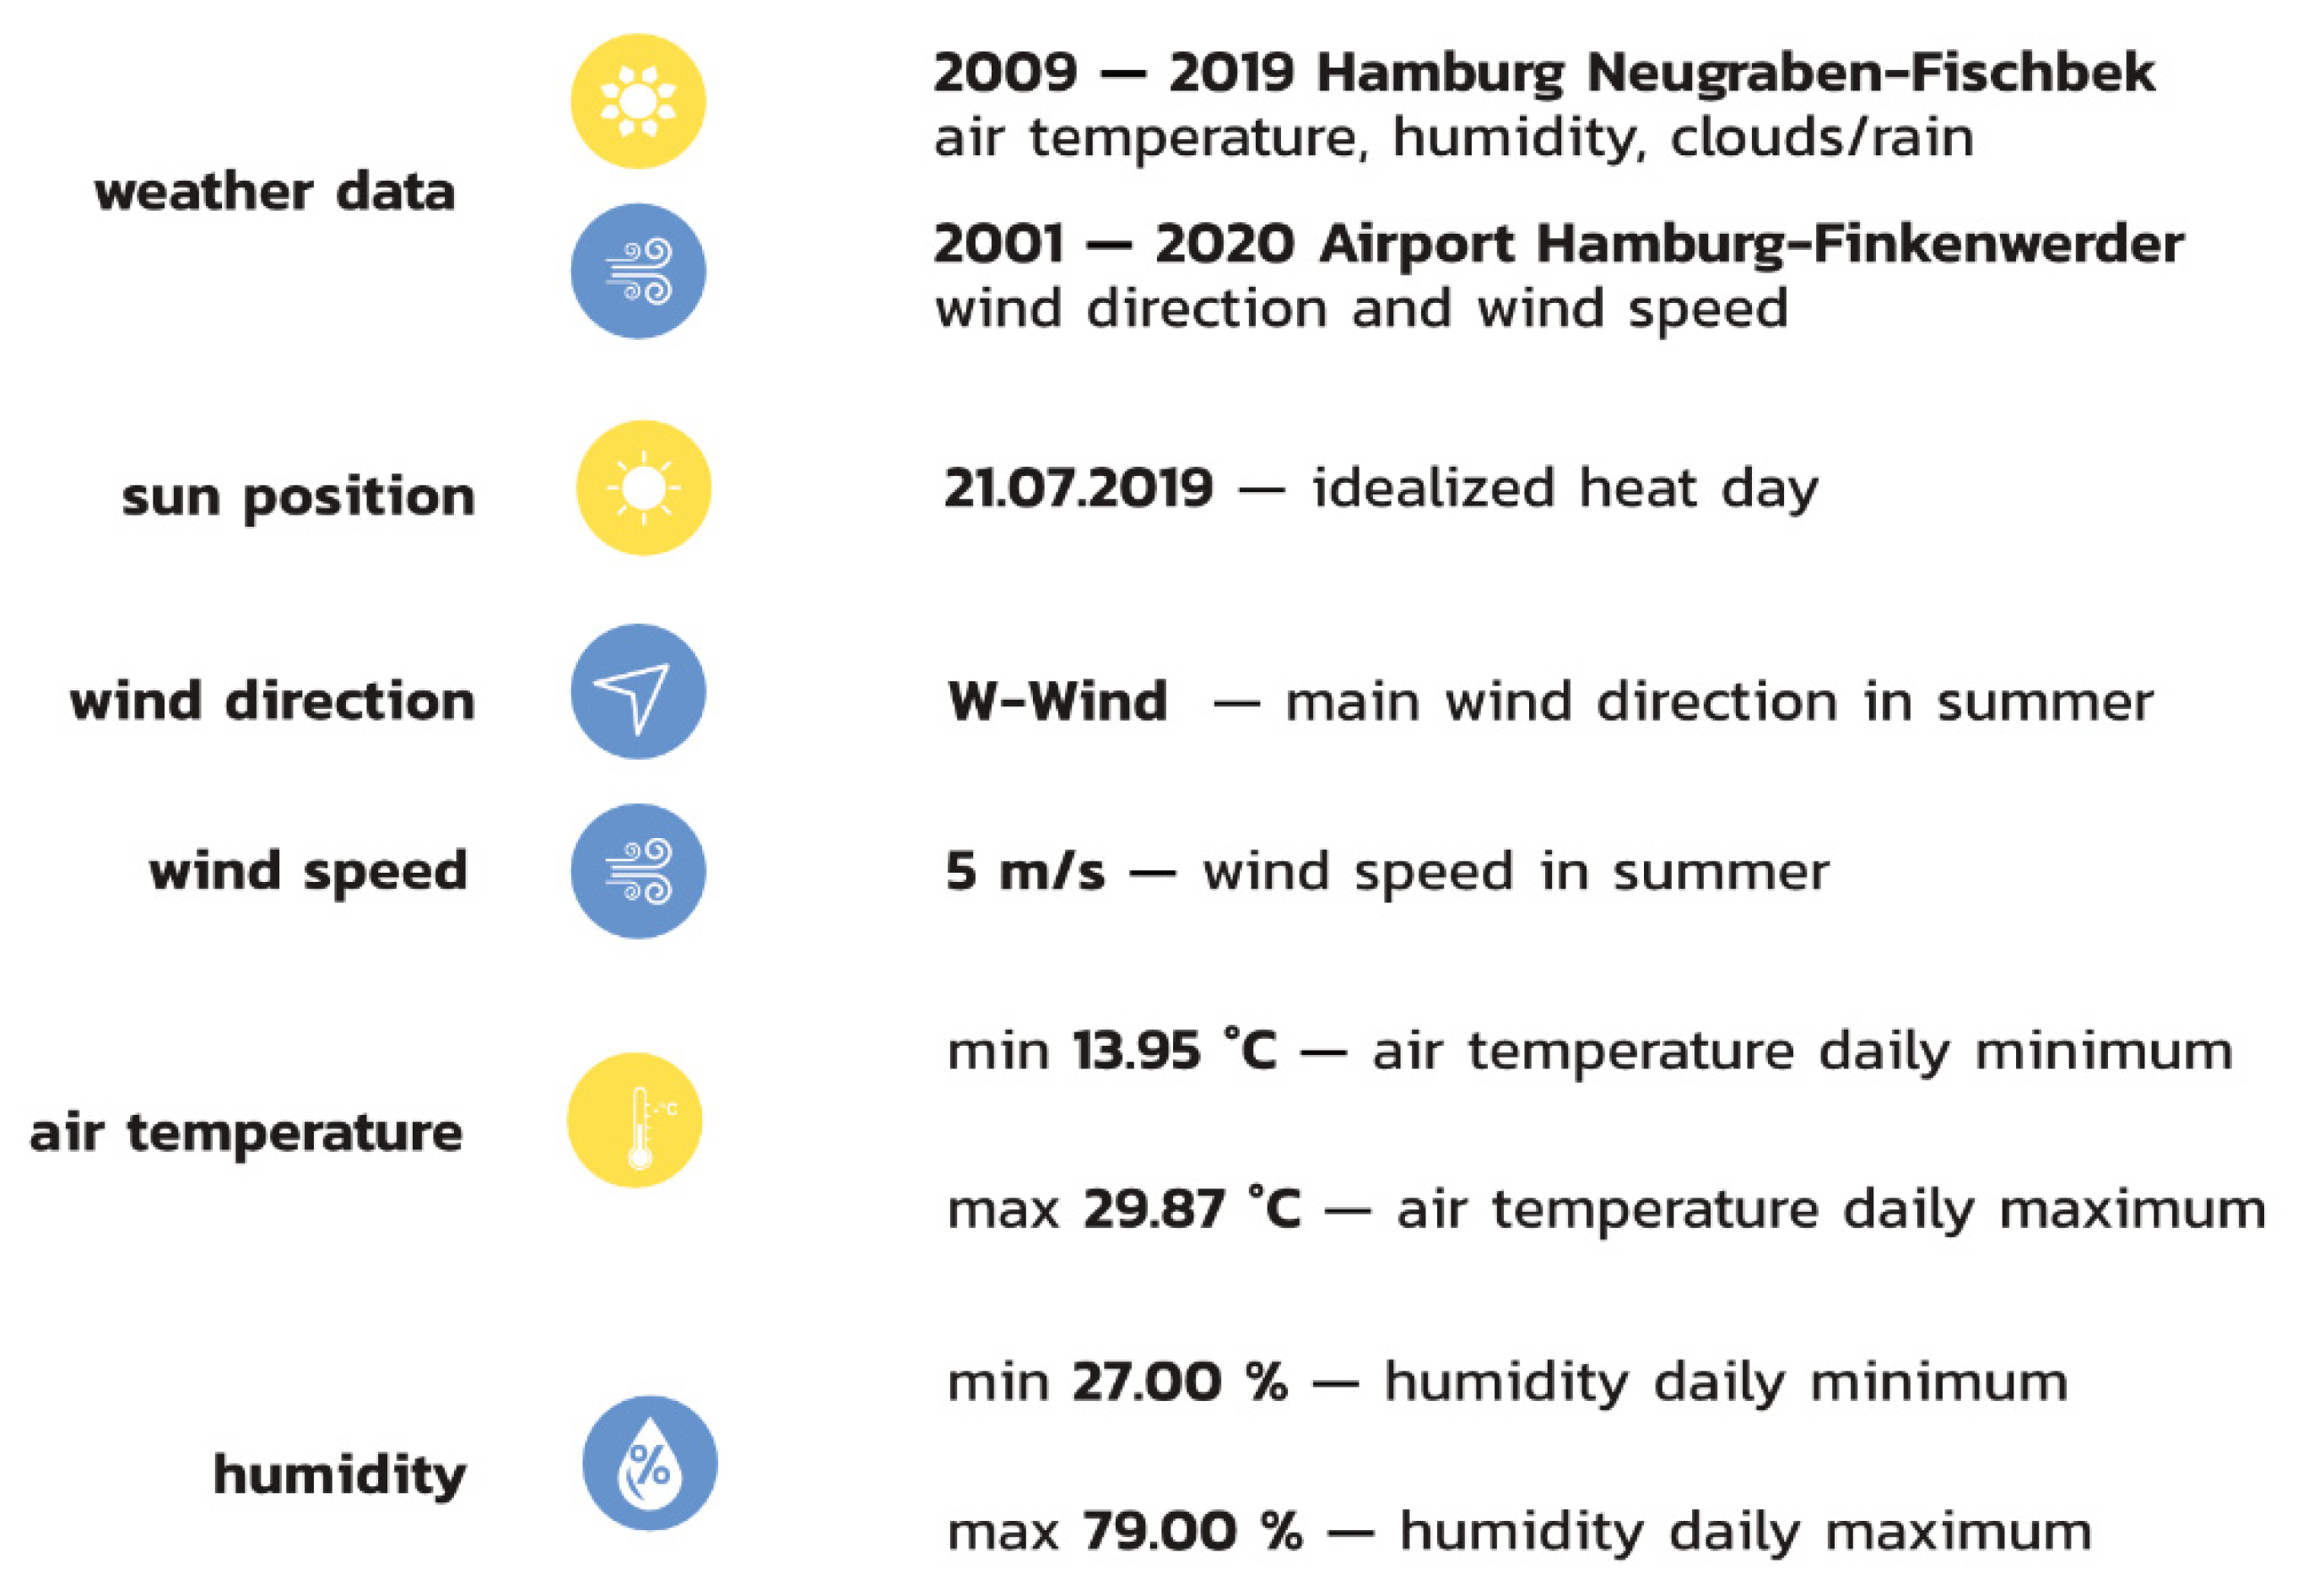
2.6.2. Input Drivers
3. Results Green4Cities GmbH
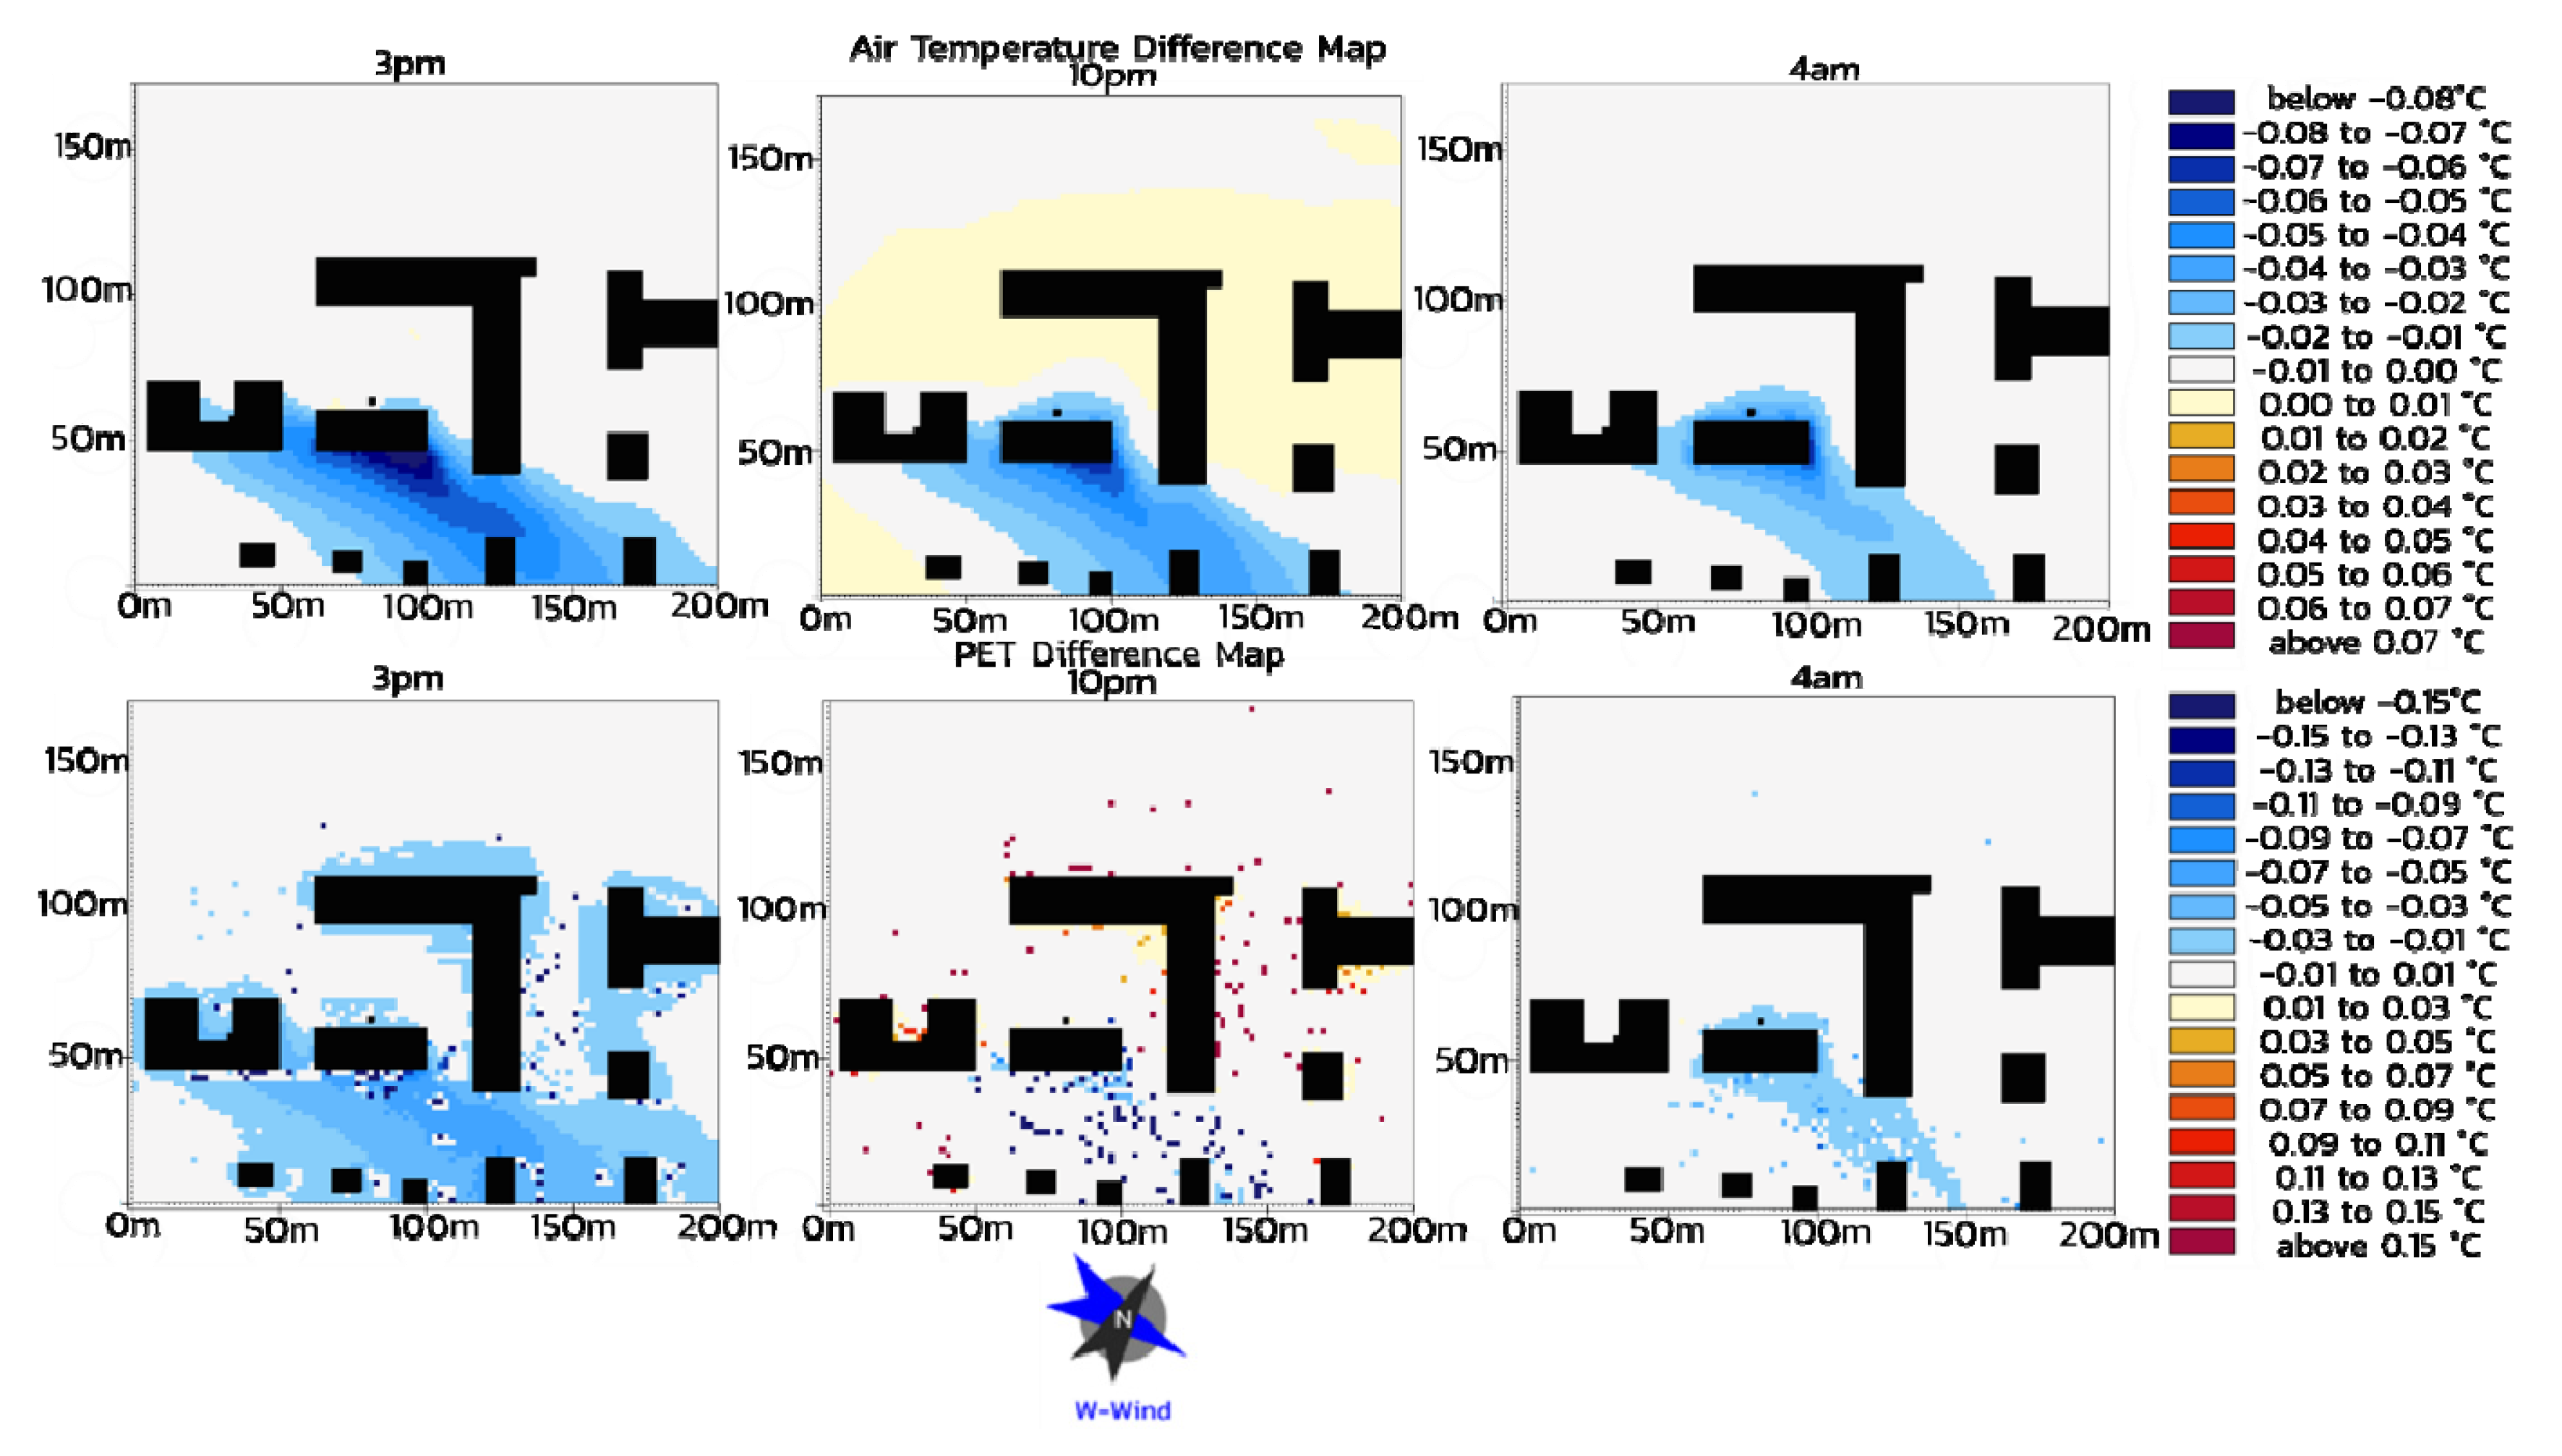
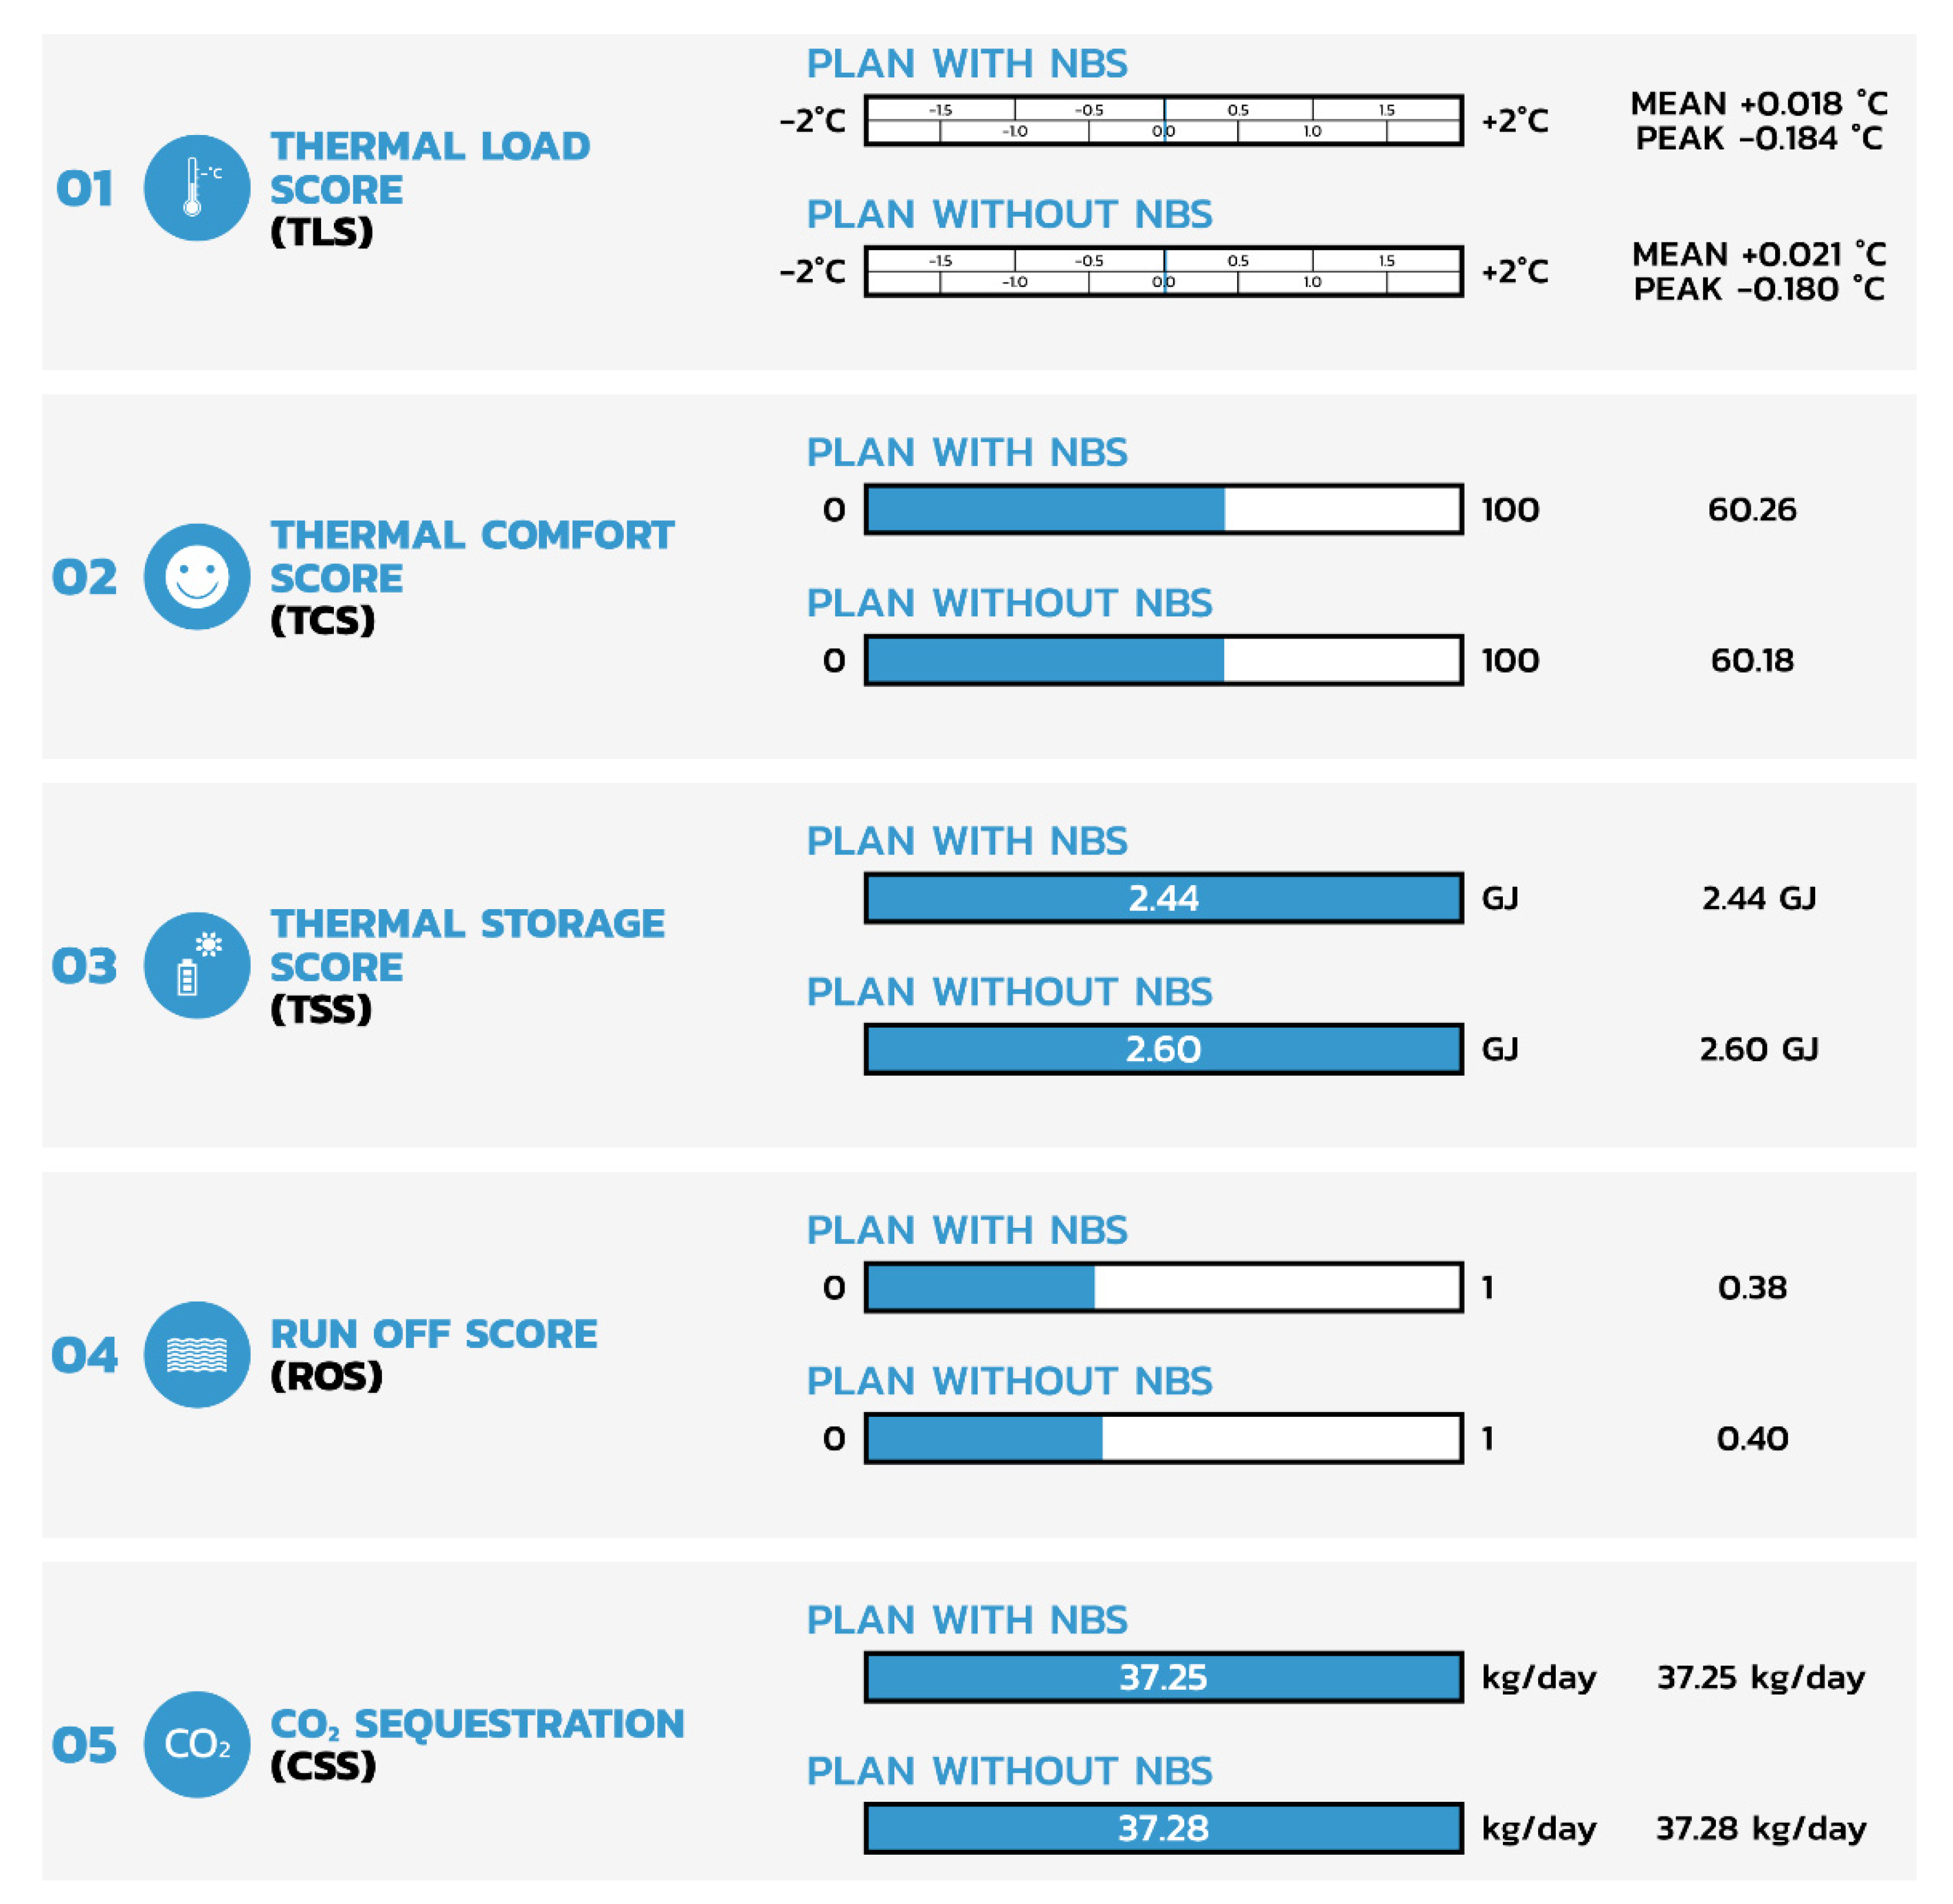
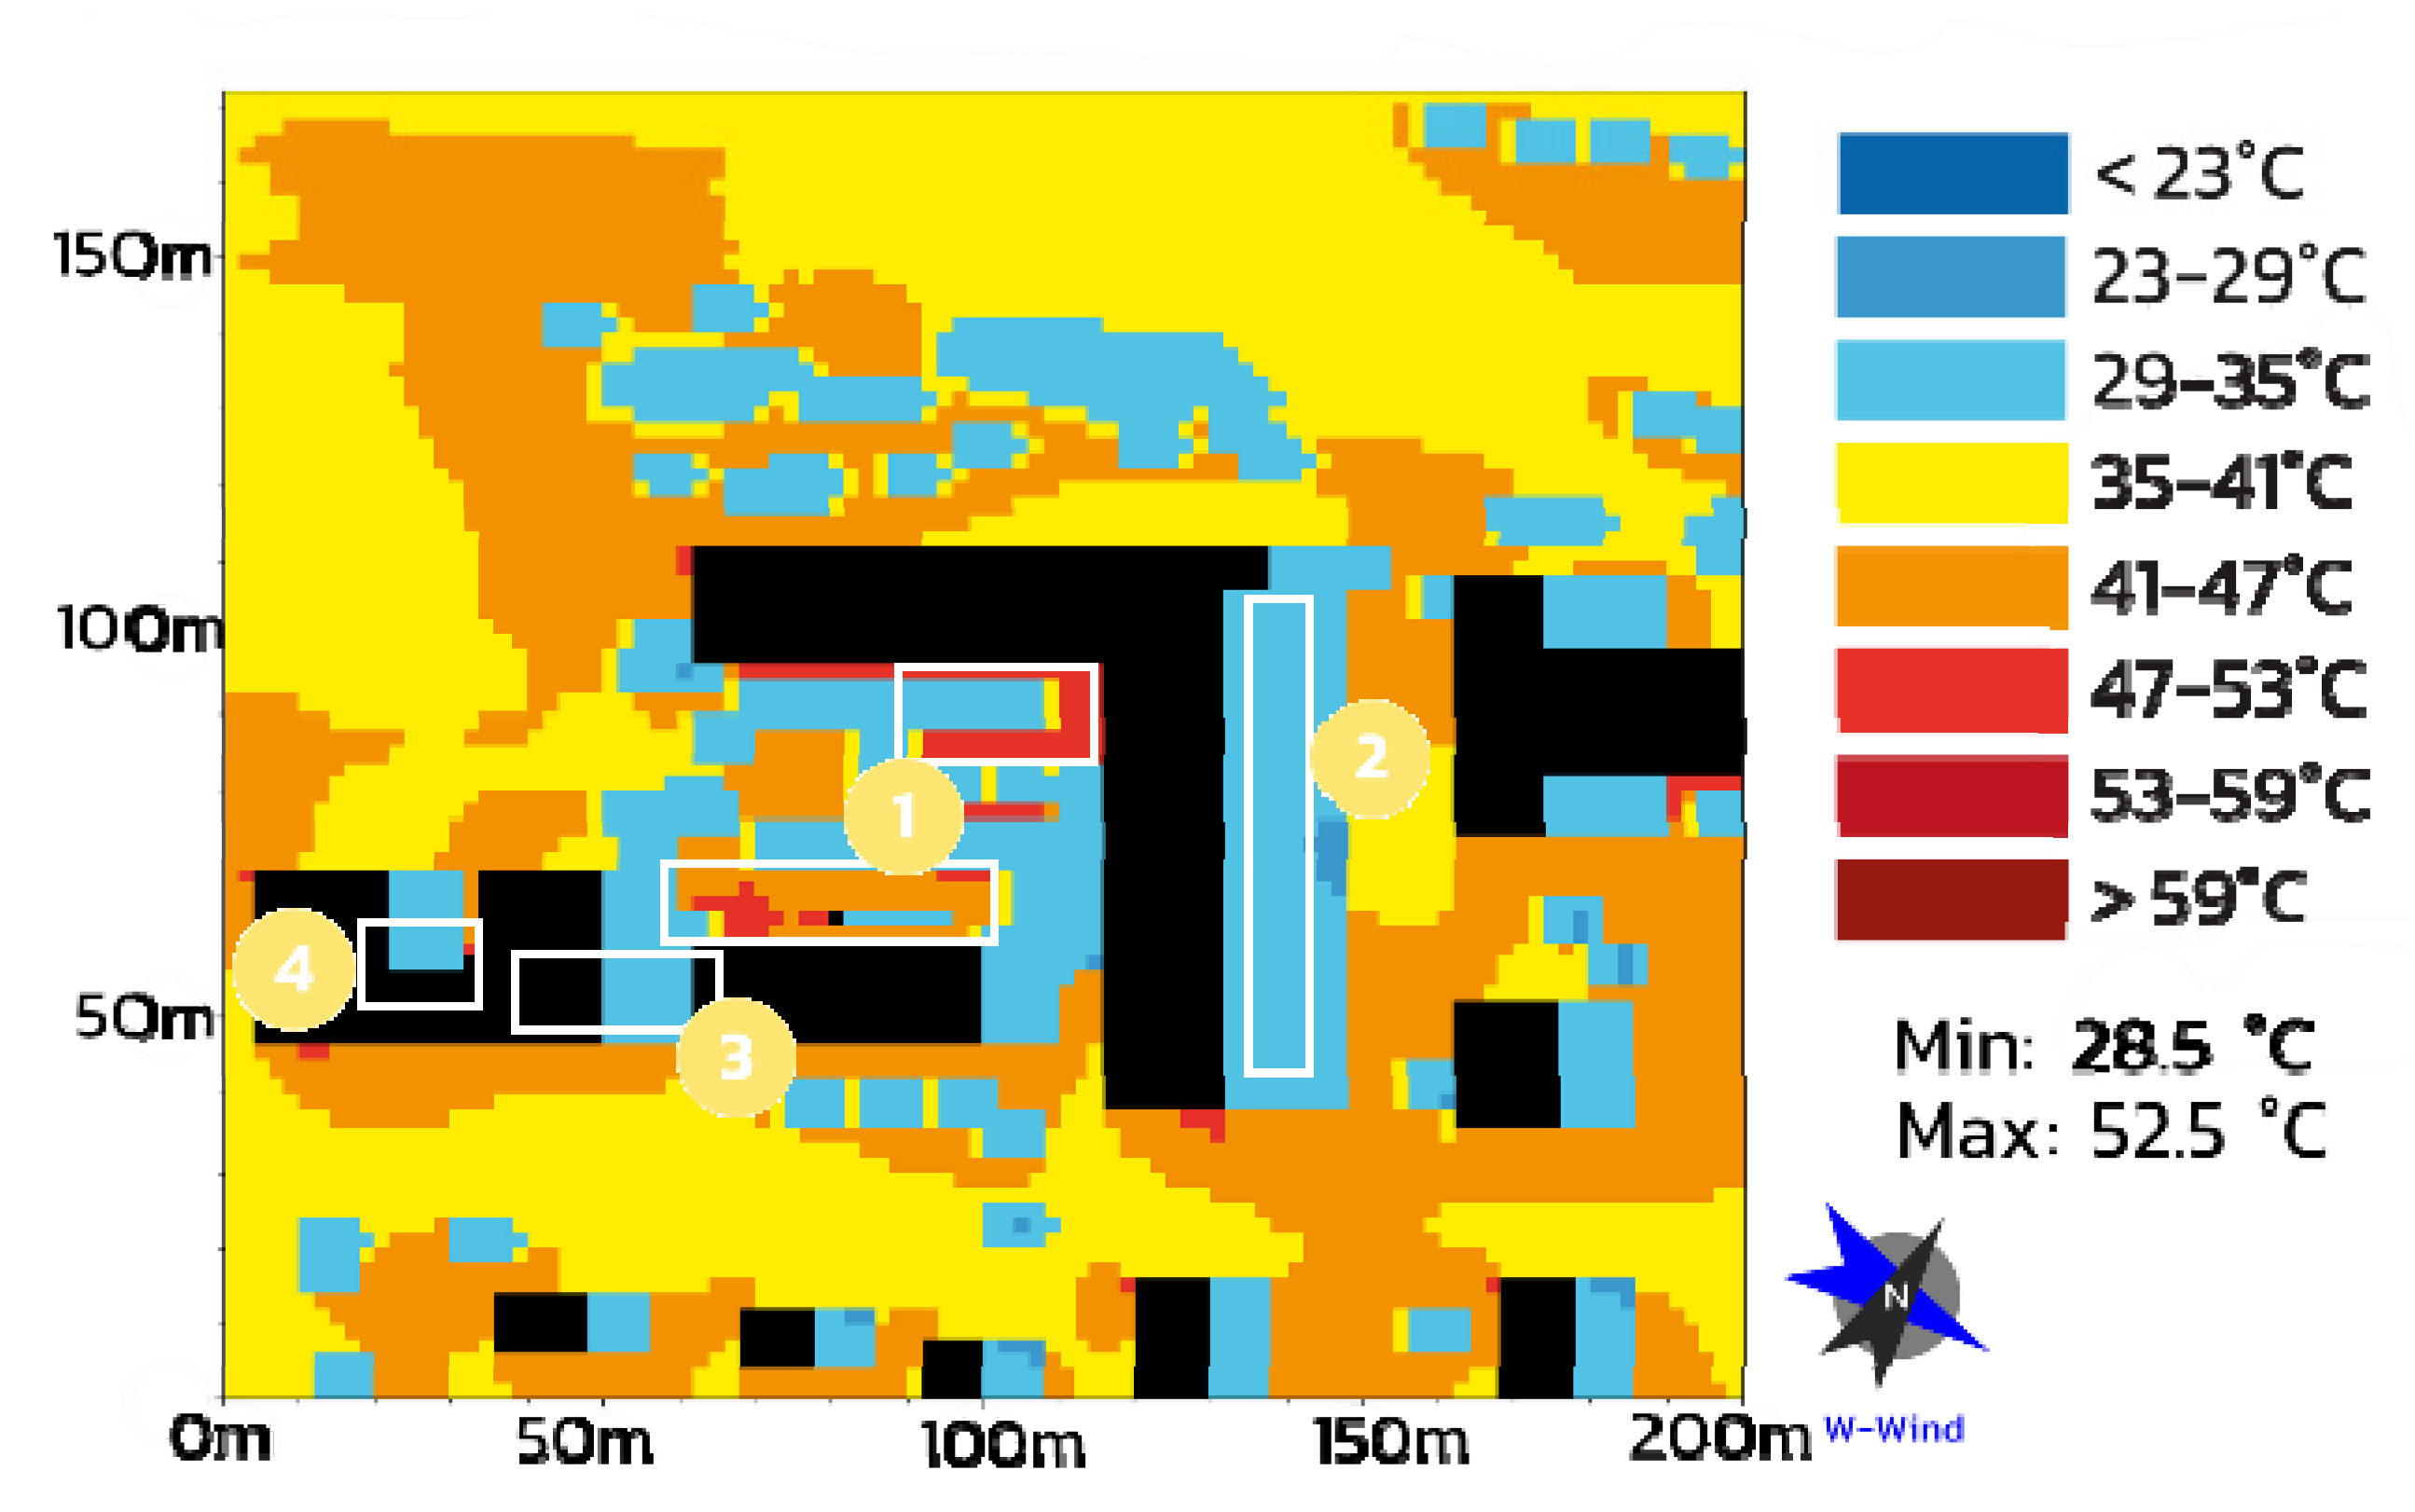
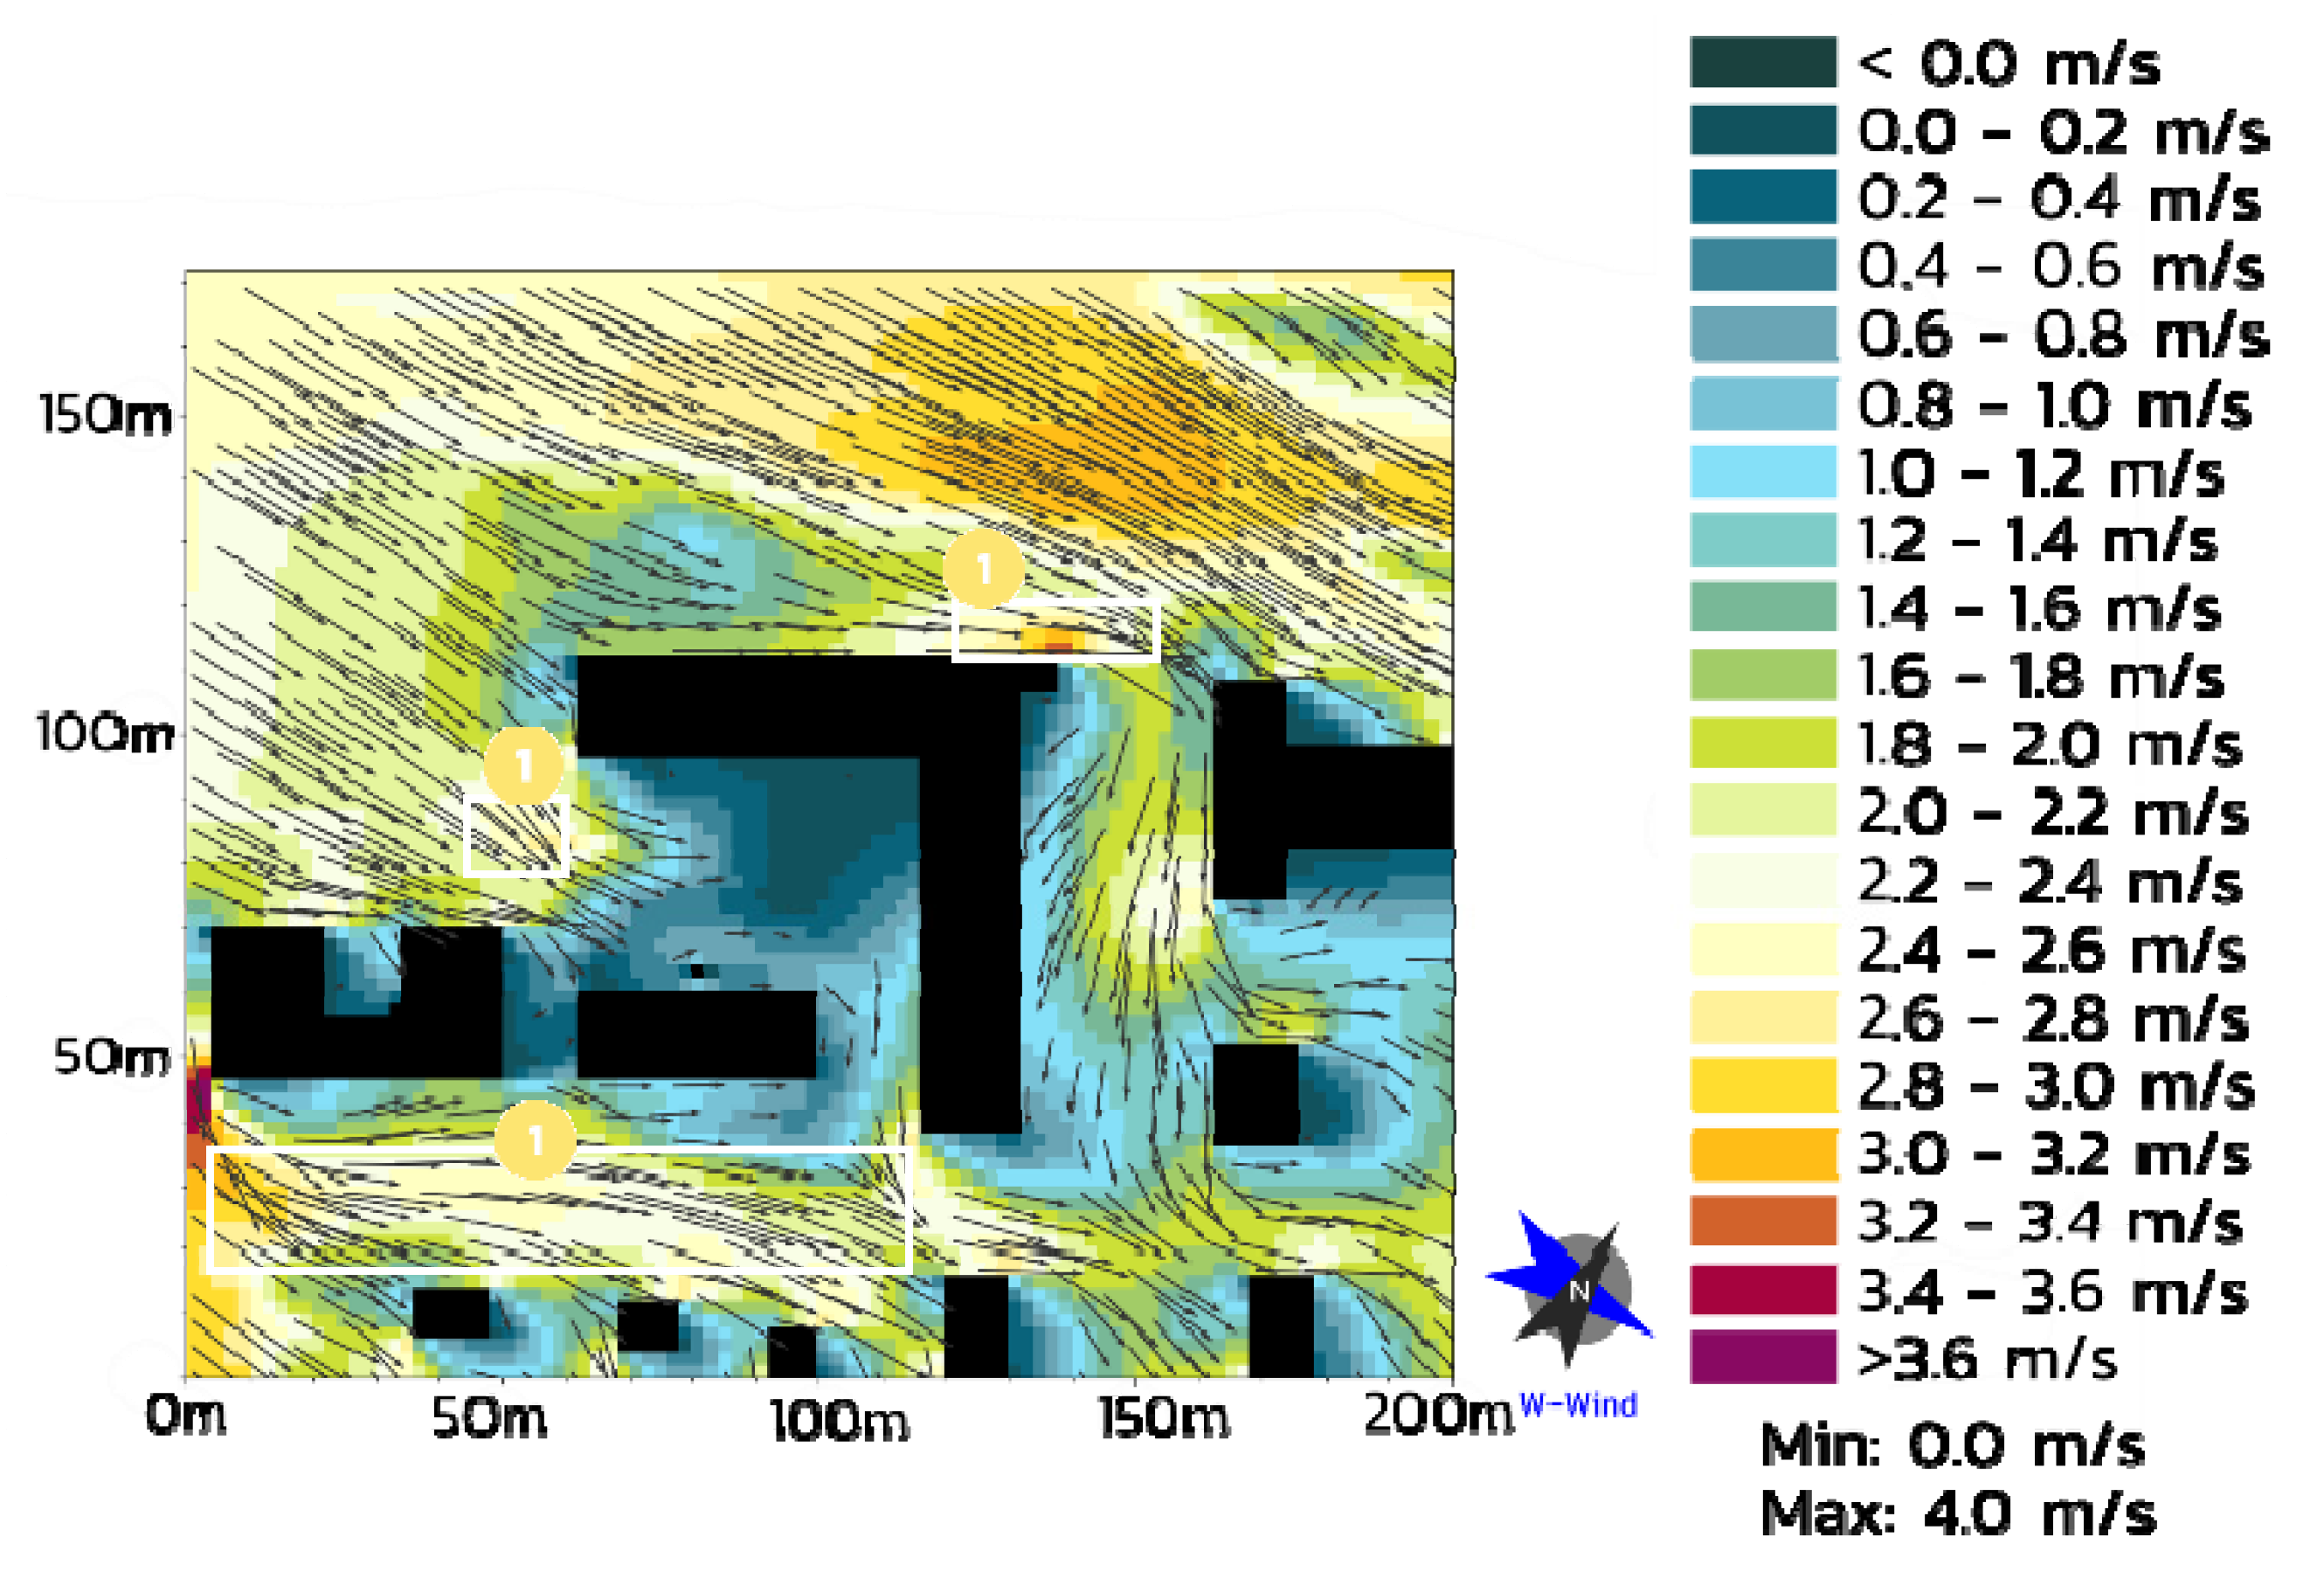
3.1. Climate-Resilience Analysis—Planning without NBS/with NBS
3.2. Thermal Comfort Score (TCS)
3.3. Thermal Load Score (TLS)
3.4. Thermal Storage Score (TSS)
3.5. Run-Off Score (ROS)
3.6. Carbon Sequestration Score (CSS)
3.7. Climate-Optimized design
4. Discussion and Conclusions
Author Contributions
Funding
Institutional Review Board Statement
Informed Consent Statement
Data Availability Statement
Conflicts of Interest
References
- IEA. Global Energy Review 2020; IEA: Paris, France, 2020; Available online: https://www.iea.org/reports/global-energy-review-2020 (accessed on 13 July 2021).
- IPCC. Intergovernmental Panel on Climate Change: Global Warming of 1.5 °C. An IPCC Special Report on the Impacts of Global Warming of 1.5 °C above Pre-Industrial Levels and Related Global Greenhouse Gas Emission Pathways, in the Context of Strengthening the Global Response to the Threat of Climate Change, Sustainable Development, and Efforts to Eradicate Poverty. Printed October 2018 by the IPCC, Switzerland. Electronic Copies of this Summary for Policymakers are Available from the IPCC Website. ISBN 978–92–9169–151–7. Available online: www.ipcc.ch (accessed on 13 July 2021).
- Liu, B.; Lian, Z.; Brown, R.D. Effect of Landscape Microclimates on Thermal Comfort and Physiological Wellbeing. Sustainability 2019, 11, 5387. [Google Scholar] [CrossRef] [Green Version]
- Santamouris, M. Cooling the cities–A review of reflective and green roof mitigation technologies to fight heat island and improve comfort in urban environments. Sol. Energy 2014, 103, 682–703. [Google Scholar] [CrossRef]
- Bruse, M. ENVI-met Documentation; Universität Mainz: Mainz, Germany, 2004; Available online: http://www.envi-met.net/documents/papers/overview30.pdf (accessed on 12 July 2021).
- Simon, H. Modeling Urban Microclimate-Development, Implementation and Evaluation of New and Improved Calculation Methods for the Urban Microclimate Model ENVI-met; Universität Mainz: Mainz, Germany, 2016. [Google Scholar]
- Graham, J.; Berardi, U.; Turnbull, G.; McKaye, R. Microclimate Analysis as a Design Driver of Architecture. Climate 2020, 8, 72. [Google Scholar] [CrossRef]
- Skodra, J.; Zorita, S.; Garcia Perez, I.; Moebus, S. Co-creating nature-based solutions for healthy and sustainable cities: Urban public health approach. Eur. J. Public Health 2020, 30, ckaa165.234. [Google Scholar] [CrossRef]
- WHO Regional Office for Europe. Urban Green Spaces and Health; WHO: Copenhagen, Denmark, 2016. [Google Scholar]
- Aram, F.; Higueras García, E.; Solgi, E.; Mansournia, S. Urban green space cooling effect in cities. Heliyon 2019, 5, e01339. [Google Scholar] [CrossRef] [PubMed] [Green Version]
- Ghaffarianhoseini, A.; Berardi, U.; Ghaffarianhoseini, A.; Al-Obaidi, K. Analyzing the thermal comfort conditions of outdoor spaces in a university campus in Kuala Lumpur, Malaysia. Sci. Total Environ. 2019, 666, 1327–1345. [Google Scholar] [CrossRef] [PubMed] [Green Version]
- Salcedo Rahola, B.; van Oppen, P.; Mulder, K. Heat in the City: An Inventory of Knowledge and Knowledge Deficiencies Regarding Heat Stress in Dutch CITIES and Options for Its Mitigation; TU Delft: Delft, The Netherlands, 2009; ISBN 978-90-8815-008-1. [Google Scholar]
- Lai, D.; Liu, W.; Gan, T.; Liu, K.; Chen, Q. A review of mitigating strategies to improve the thermal environment and thermal comfort in urban outdoor spaces. Sci. Total. Environ. 2019, 661, 337–353. [Google Scholar] [CrossRef] [PubMed]
- Wendling, L.; Dumitru, A. Evaluating the Impact of Nature-based Solutions: A Handbook for Practitioners. European Commission. Directorate-General for Research and Innovation Directorate C—Healthy Planet. Unit C3—Climate and Planetary Boundaries; European Union: Luxembourg, 2021; ISBN 978-92-76-22961-2. [Google Scholar] [CrossRef]
- Grimmond, C.S.B.; Roth, M.; Oke, T.R.; Au, Y.C.; Best, M.; Betts, R.; Carmichael, G.; Cleugh, H.; Dabberdt, W.; Emmanuel, R.; et al. Climate and More Sustainable Cities: Climate Information for Improved Planning and Management of Cities (Producers/Capabilities Perspective). Procedia Environ. Sci. 2010, 1, 247–274. [Google Scholar] [CrossRef] [Green Version]
- Scharf, B.; Kraus, F. Green4cities-Development of an Evaluation Tool for Green Infrastructure and Their Positive Effects Derived for Cities Worldwide; ERA-SME: Vienna, Austria, 2015. [Google Scholar]
- Kraus, F. The GREENPASS® Methodology; Pan European Network–Government 23 Publication: Vienna, Austria, October 2017. [Google Scholar]
- Kraus, F.; Scharf, B. Management of urban climate adaptation with NBS and GREENPASS®. EGU Gen. Assem. 2019, 21, EGU2019-16221-1. [Google Scholar]
- Kraus, F.; Scharf, B. Climate-resilient urban planning and architecture with GREENPASS illustrated by the case study ‘FLAIR in the City’ in Vienna. In IOP Conference Series: Earth and Environmental Science; IOP Publishing: Graz, Austria, 2019; Volume 323, p. 012087. [Google Scholar]
- Scharf, B.; Kraus, F. Green Roofs and Greenpass. Buildings 2019, 9, 205. [Google Scholar] [CrossRef] [Green Version]
- Arlati, A.; Rödl, A.; Kanjaria-Christian, S.; Knieling, J. Stakeholder Participation in the Planning and Design of Nature-Based Solutions. Insights from CLEVER Cities Project in Hamburg. Sustainability 2021, 13, 2572. [Google Scholar] [CrossRef]
- Heinlein, K.; Hilka, M.; Hilka, M. Verordnung über die Honorare für Architekten- und Ingenieurleistungen. HHH GbR. Available online: https://www.hoai.de/hoai/volltext/hoai-2021/ (accessed on 17 May 2021).
- Scharf, B. Coole Städte Planen–Mit der Greenpass-Methode. In Neue Landschaft; Patzer Verlag: Hannover, Germany; Berlin, Germany, 2018; ISSN 0548-2836. [Google Scholar]
- Kraus, F.; Scharf, B. IT-gesteuerte Natur in der dichten Stadt. In Neue Landschaft; Patzer Verlag: Hannover, Germany; Berlin, Germany, 2020; ISSN 0548-2836. [Google Scholar]
- Greenpass References. Available online: https://greenpass.io/references/ (accessed on 15 July 2021).
- Kraus, F.; Scharf, B. Greenpass Modelling Editor: GP.Me; Vienna Business Agency: Vienna, Austria, 2016. [Google Scholar]
- Höppe, P. The physiological equivalent temperature–A universal index for the biometeorological assessment of the thermal environment. Int. J. Biometeorol. 1999, 43, 71–75. [Google Scholar] [CrossRef] [PubMed]
- Matzarakis, A.; Mayer, H. Another Kind of Environmental Stress: Thermal Stress. WHO Colloborating Centre for Air Quality Management and Air Pollution Control. Newsletters 1996, 18, 7–10. [Google Scholar]
- Cheung, T.; Schiavon, S.; Parkinson, T.; Li, P.; Brager, G. Analysis of the accuracy on PMV–PPD model using the ASHRAE Global Thermal Comfort Database II. Build. Environ. 2019, 153, 205–217. [Google Scholar] [CrossRef] [Green Version]
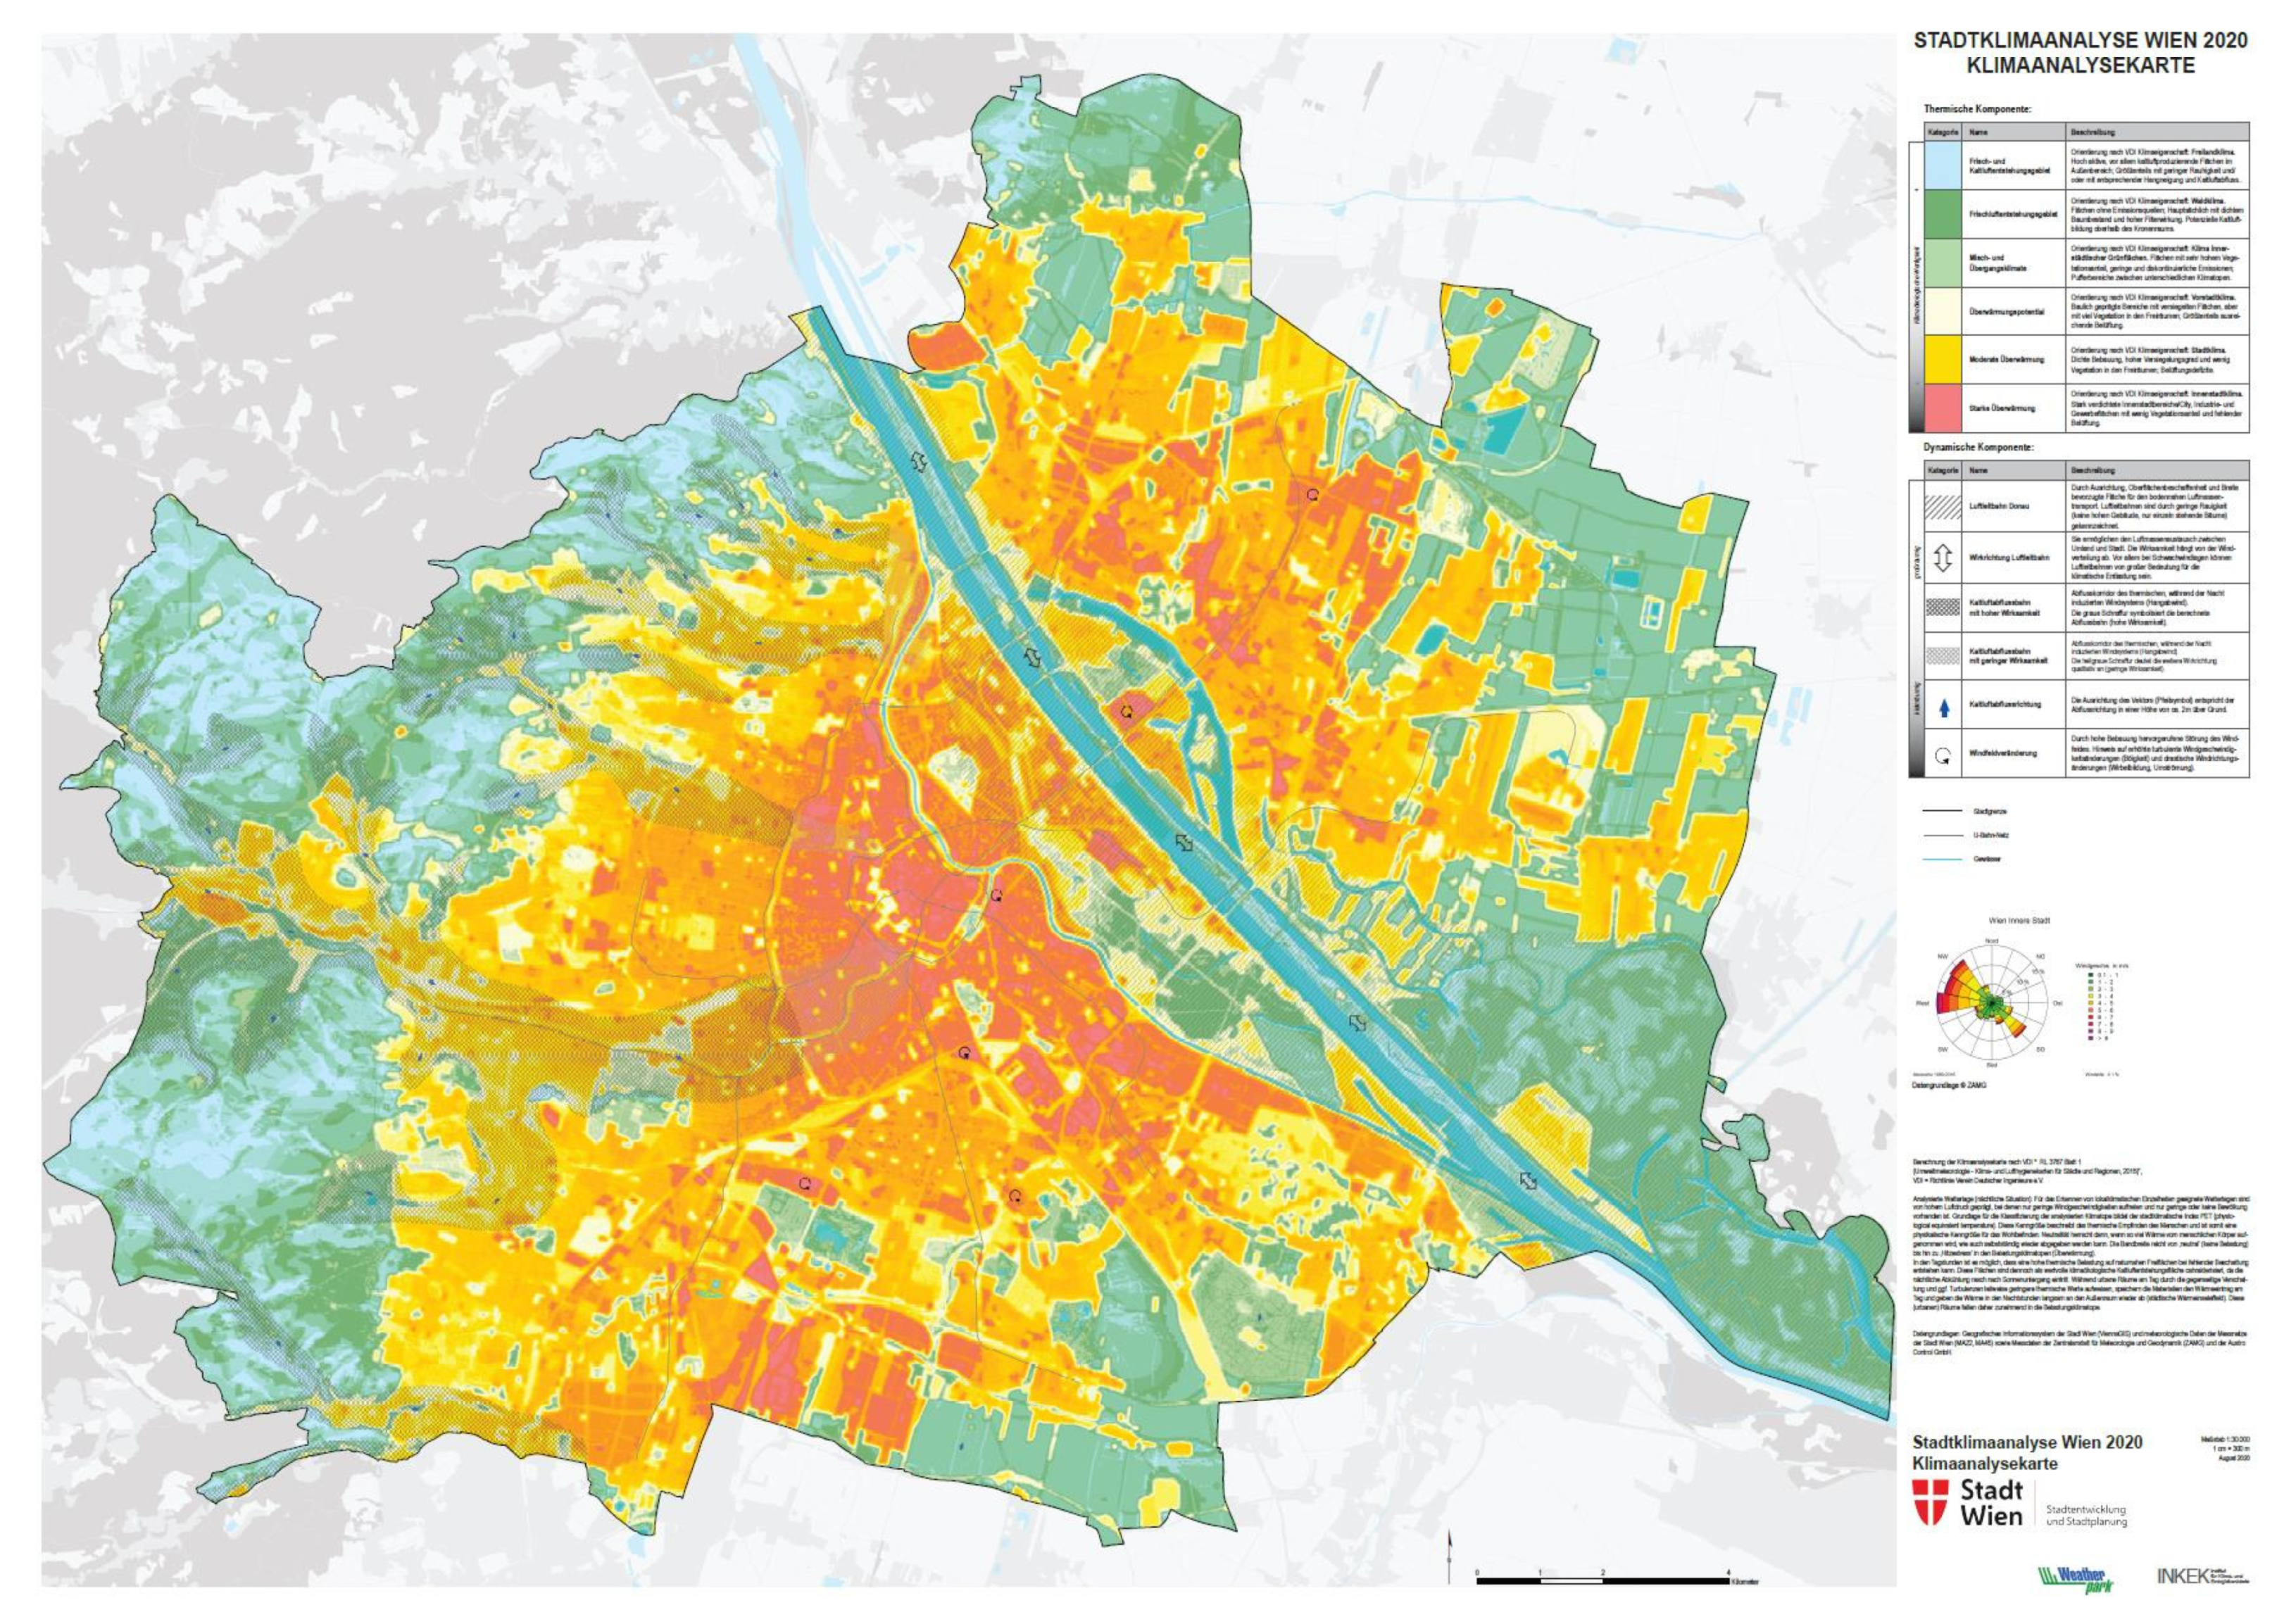
- Stadt Wien. Stadtklimaanalyse Wien 2020 Klimaanalysekarte. Available online: https://www.wien.gv.at/stadtentwicklung/grundlagen/stadtforschung/pdf/stadtklimaanalyse-karte.pdf (accessed on 12 July 2021).
- Oswald, S.; Hollosi, B.; Z’uvela-Aloise, M.; See, L.; Guggenberger, S.; Hafner, W.; Prokop, G.; Storch, A.; Schieder, W. Using urban climate modelling and improved land use classifications to support climate change adaptation in urban environments: A case study for the city of Klagenfurt, Austria. Urban. Clim. 2019, 31, 100582. [Google Scholar] [CrossRef]
- Reinwald, F.; Ring, Z.; Kraus, F.; Kainz, A.; Tötzer, T.; Damyanovic, D. Green Resilient City-A framework to integrate the Green and OpenSpace Factor and climate simulations into everyday planning to support a green and climate-sensitive landscape and urban development. In IOP Conference Series: Earth and Environmental Science; IOP Publishing: Graz, Austria, 2019; Volume 323. [Google Scholar]


| GREENPASS Project List Summary | |||||
|---|---|---|---|---|---|
| Total Projects | 108 | Projects can be processed by several sub-projects | |||
| Total Sub-Projects | 130 | Projects below are an abstract of public communicated projects | |||
| Countries | 10 | ||||
| Countries | No. of Projects | No. of Sub-Projects | Size (ha) | More Information | |
| Austria | 70 | 90 | |||
| IKEA Westbahnhof Vienna | 0.4 | https://greenpass.io/2021/06/25/ikea-westbahnhof-wien/ (accessed on 3 July 2021) | |||
| Biotope City Vienna | 6.8 | https://greenpass.io/2021/03/09/biotope-city/ (accessed on 3 July 2021) | |||
| MAHI 10–18 Vienna | 0.8 | https://workdrive.greenpass.io/external/QCWWu4HQwJ-lTZKpT (accessed on 3 July 2021) | |||
| aspern Seestadt Vienna | 24.0 | https://neuelandschaft.de/artikel/it-gesteuerte-natur-in-der-dichten-stadt-12892.html (accessed on 3 July 2021) | |||
| Oberes Hausfeld Vienna | 20.0 | - | |||
| An der Schanze Vienna | 10.5 | https://www.iba-wien.at/en/projekte/projekt-detail/project/urban-wilderness-event-corridor-greenpass (accessed on 3 July 2021) | |||
| Belgium | 2 | 2 | |||
| Playhouse Elief Antwerp | 0.1 | https://0-www-mdpi-com.brum.beds.ac.uk/2075-5309/9/9/205/htm (accessed on 3 July 2021) | |||
| Hibernia Antwerp | 0.1 | https://www.antwerpen.be/info/5f1ac11b2888ff1d7f5d31c4/spelen-en-groen-combineren-dankzij-eenhorizontale-en-verticale-puzzel (accessed on 3 July 2021) | |||
| Czech Republic | 4 | 4 | |||
| Brno Rakovecka | 1.9 | https://9d16c711-fa4a-4b74-9624-2fc4da78e12d.filesusr.com/ugd/43f56c_7e405a02865945288dec9e269733146c.pdf (accessed on 3 July 2021) | |||
| Opava City | 1.5 | https://27d02548-2c2d-4fc8-bd95-f1d6041f7d4f.filesusr.com/ugd/c546d5_7c211db6cd864c3c9da473465cd12c27.pdf (accessed on 3 July 2021) | |||
| České Budějovice | 0.5 | https://greenpass.io/wp-content/uploads/2021/03/2020-03-16_CZ-2020-CB-PreCert-CZ-final.pdf (accessed on 3 July 2021) | |||
| Germany | 10 | 10 | |||
| KUHLIO Frankfurt | 0.5 | https://bautecfokus.at/a/vorreiter-sre-erhaelt-erstes-greenpass-zertifikat-deutschlands (accessed on 3 July 2021) | |||
| TZR Bochum | 0.8 | https://m.facebook.com/enablinglivablecities/posts/1868707086612511 (accessed on 3 July 2021) | |||
| Willy-Brandt-Platz Krefeld | 1.1 | https://krefeld.meine-stadt-transparent.de/file/16040/ (accessed on 3 July 2021) | |||
| Italy | 8 | 9 | |||
| Segrate Milano Due | 16.0 | http://www.ibpsa.org/proceedings/BS2019/BS2019_211002.pdf (accessed on 3 July 2021) | |||
| CityLife Milano | 4.0 | https://greenpass.io/wp-content/uploads/2020/12/GREENPASS%C2%AE-Reference-Book_v2.2_low.pdf (accessed on 3 July 2021) | |||
| Piazza Loreto Milano | 4.0 | - | |||
| Netherlands | 2 | 2 | |||
| Hamerkwartier Amsterdam | 11.0 | - | |||
| Beatrixkwartier Den Haag | 21.2 | https://issuu.com/urbanboost/docs/oteam_eerste_hulp_bij_gebiedsontwikkeling_finaleve/s/12137330 (accessed on 3 July 2021) | |||
| Slovakia | 4 | 4 | |||
| Zvolen | 1.0 | - | |||
| Corvus Malacky | 1.0 | - | |||
| Switzerland | 4 | 4 | |||
| Poststrasse Uster | 0.6 | - | |||
| Prime-Tower Zürich | 2.7 | - | |||
| England | 3 | 4 | |||
| Thamsmead Southmere London | 6.3 | https://clevercities.eu/london/ (accessed on 3 July 2021) | |||
| Thamsmead Parkview London | 22.0 | https://www.london.gov.uk/what-we-do/environment/parks-green-spaces-and-biodiversity/clever-cities-thamesmead (accessed on 3 July 2021) | |||
| Woburn Court Croydon, London | 1.0 | - | |||
| USA | 1 | 1 | |||
| Campbell Court—City of Roanoke | 0.9 | - | |||
| For more information please visit: | www.greenpass.io/references www.greenpass.io/blog/ | ||||
Publisher’s Note: MDPI stays neutral with regard to jurisdictional claims in published maps and institutional affiliations. |
© 2021 by the authors. Licensee MDPI, Basel, Switzerland. This article is an open access article distributed under the terms and conditions of the Creative Commons Attribution (CC BY) license (https://creativecommons.org/licenses/by/4.0/).
Share and Cite
Scharf, B.; Kogler, M.; Kraus, F.; Garcia Perez, I.; Gutierrez Garcia, L. NBS Impact Evaluation with GREENPASS Methodology Shown by the Case Study ‘Fischbeker Höfe’ in Hamburg/Germany. Sustainability 2021, 13, 9167. https://0-doi-org.brum.beds.ac.uk/10.3390/su13169167
Scharf B, Kogler M, Kraus F, Garcia Perez I, Gutierrez Garcia L. NBS Impact Evaluation with GREENPASS Methodology Shown by the Case Study ‘Fischbeker Höfe’ in Hamburg/Germany. Sustainability. 2021; 13(16):9167. https://0-doi-org.brum.beds.ac.uk/10.3390/su13169167
Chicago/Turabian StyleScharf, Bernhard, Martha Kogler, Florian Kraus, Igone Garcia Perez, and Laura Gutierrez Garcia. 2021. "NBS Impact Evaluation with GREENPASS Methodology Shown by the Case Study ‘Fischbeker Höfe’ in Hamburg/Germany" Sustainability 13, no. 16: 9167. https://0-doi-org.brum.beds.ac.uk/10.3390/su13169167