Article

Synthesis, Characterization, and Synergistic Effects of Modified Biochar in Combination with α-Fe2O3 NPs on Biogas Production from Red Algae Pterocladia capillacea

1
Marine Pollution Lab, National Institute of Oceanography and Fisheries (NIOF), Alexandria 21556, Egypt
2
Advanced Technology and New Materials Research Institute, City for Scientific Research and Technological Applications, Alexandria 21934, Egypt
3
Department of Chemical Engineering, Faculty of Engineering, Minia University, Minia 61519, Egypt
4
Department of Agriculture and Environmental Sciences, Bari University, 70121 Bari, Italy
*
Author to whom correspondence should be addressed.
Sustainability 2021, 13(16), 9275; https://0-doi-org.brum.beds.ac.uk/10.3390/su13169275
Submission received: 13 July 2021 / Revised: 14 August 2021 / Accepted: 16 August 2021 / Published: 18 August 2021
(This article belongs to the Topic Actions for Bioenergy and Biofuels: A Sustainable Shift)

Abstract

:
This study is the first work that evaluated the effectiveness of unmodified (SD) and modified biochar with ammonium hydroxide (SD-NH2) derived from sawdust waste biomass as an additive for biogas production from red algae Pterocladia capillacea either individually or in combination with hematite α-Fe2O3 NPs. Brunauer, Emmett, and Teller, Fourier transform infrared, thermal gravimetric analysis, X-ray diffraction, transmission electron microscopy, Raman, and a particle size analyzer were used to characterize the generated biochars and the synthesized α-Fe2O3. Fourier transform infrared (FTIR) measurements confirmed the formation of amino groups on the modified biochar surface. The kinetic research demonstrated that both the modified Gompertz and logistic function models fit the experimental data satisfactorily except for 150 SD-NH2 alone or in combination with α-Fe2O3 at a concentration of 10 mg/L. The data suggested that adding unmodified biochar at doses of 50 and 100 mg significantly increased biogas yield compared to untreated algae. The maximum biogas generation (219 mL/g VS) was obtained when 100 mg of unmodified biochar was mixed with 10 mg of α-Fe2O3 in the inoculum.

1. Introduction

In the recent decades, renewable energy has gained significance largely because of the sources from which it comes [1,2]. Waste-to-energy technologies help process or dispose of less waste while also generating electricity, encouraging the move away from fossil fuels [1,2]. Biomass resources represent an opportunity for sustainable development in bio-based industries, which encompass sectors as diverse as agriculture, food, bio-based chemicals, bio-energy, bio-based textiles, and forestry [3]. In general, initial studies on biomass for energy production have shown that it is a competitive fuel vs. fossil fuels and has a dry matter calorific value of around 17–21 MJ/kg [4]. Biogas may be created from a wide range of sources, as long as they contain organic material. Among these sources are seaweeds, municipal sewage, manure, agricultural waste, and waste dumps [5,6]. The gas composition may vary depending on the source, but methane will always be the significant component [6]. Numerous studies have been conducted to optimize the anaerobic digestion (AD) performance and energy efficiency of biogas-producing technologies to meet global demand for a stable and clean energy source. For example, Europe was striving to achieve one-fifth of renewable energy by 2020 by improving the energy efficiency of existing systems [1]. Given the nature of organic waste, various strategies for increasing the digestibility of these waste materials have been identified, including co-digestion, pre-treatments, and the use of carbonaceous additives to stimulate microbial activity and reduce the inhibitory concentration of certain by-products [2,3,4,5,6]. El Nemr et al. [7] mentioned that P. capillacea is a common marine biomaterial in the Mediterranean, where a considerable amount is habituated on rocks on the coast and in shallow water each year, and it possesses impressive metal adsorption properties. Hassaan et al. [8] also stated that P. capillacea is a marine red alga in which the chlorophyll pigment phycoerythrin obscures the chlorophyll. They are invariably multicellular and range from tiny to moderate size, with a hollow frond with a cartilaginous texture.
Among the approaches mentioned above, carbonaceous additives are the most practicable for commercial application, particularly in landfills, due to their simplicity and lack of infrastructure modification [5,9,10]. Carbonaceous additions have been demonstrated to be helpful due to their good effect on biogas generation, widespread availability, and inexpensive application [10]. For example, activated carbon (AC) can be synthesized at a low cost by steam activating char, a by-product of woody biomass gasification [11]. Nowadays, AC has been successfully used as an additive in AD to boost the process efficiency in wastewater treatment plants [12,13]. Among the several technologies used to improve biogas, AC has been identified as one of the most economically viable [13]. Biochar is a carbon-rich substance that is formed when biomass is thermally decomposed in the absence of oxygen [14]. It is created in a variety of ways, including pyrolysis (300–700 °C; N2; atmospheric pressure) and hydrothermal carbonization (170–250 °C; water above saturated pressure) [14]. The amount of energy required to produce biochar varies according to the type of biomass used. Around 160 MJ would be required for an efficient pyrolysis process using the wood biomass employed in this investigation [15,16].
Recent studies have demonstrated that including biochar into the AD of food waste improved the biogas output [17,18,19]. Sunyoto et al. [18] noticed a 41.6% increase in CH4 synthesis when they added pine sawdust biochar (generated at 650 °C) to AD of aqueous carbohydrate food waste prepared from white bread. The addition of 8.3 g/L biochar to food waste resulted in a higher methane yield (from 55 to 78%), whereas 33.3 g/L biochar resulted in the lowest output. The biochar, it is claimed, increases the surface area available for colonization by the AD’s microbial flora and functions as an adsorbent for chemicals such as limonene and ammonia [20] that would otherwise hinder the AD’s performance. Wang et al. [19] heated vermicompost-based biochar to 500 °C and reported that the biochar worked as a buffer and boosted CH4 generation due to the inclusion of 15–20% (w/w) biochar. Meyer-Kohlstock et al. [17] reported that addition of holm oak residue biochar (produced at 650 °C) to municipal biowaste increased the CH4 production per kilogram of organic dry matter (ODM) of 5% (257–272 NL/kgODM) with a biochar content of 5% (w/w) and 3% (252–267 NL/kgODM) with a biochar content of 10% (w/w).
Iron nanoparticles can be utilized as an electron donor to convert carbon dioxide (CO2) to CH4 [21], alter the type of hydrolysis fermentation, and increase the acetic acid content [22,23,24,25]. Similarly, Farghali et al. [26] observed that adding 20 and 100 mg/L Fe2O3 NPs increased biogas and CH4 generation by 9 and 105%, respectively, compared to using only cattle dung. Additionally, the addition of 20 and 100 mg/L Fe2O3 NPs resulted in a 53.02 and 57.93% reduction in H2S, respectively. Hassanein et al. [27] discovered that supplementing poultry litter with 100 mg/L Fe NPs (30.0 to 80.9 nm) and 15 mg/L Fe3O4 NPs (94.3 to 400 nm) increased CH4 production by 29.1 and 27.5%, respectively, as compared to poultry litter alone. Additionally, Yu et al. [28] discovered that adding 10 g/L of Fe NPs (5–100 nm) enhances CH4 output from sludge by 46.1%. While Su et al. [29] discovered that 0.10 wt % of Fe NPs (20 nm) boosts CH4 and biogas production from sludge by 9.1 and 30.4%, respectively; this concentration of Fe NPs also significantly reduces H2S production by 98%.
Rasapoora et al. [4] studied the effects of biochar and activated carbon on biogas generation and the results showed that by using 20 g/L biochar, a significant increase occurred in the rate of AD for all types of biochar, as confirmed by the thermogravimetric results. The physical properties of the additives, including electrical conductivity and surface area, were found to influence only the rate of AD process and not the biogas production yield [4]. Biochar showed more promising biogas generation results than activated carbon due to its ability to adsorb ammonia nitrogen [4]. Wambugu et al. [5] studied the role of biochar in anaerobic digestion-based biorefinery for food waste, and the results showed that the biogas volume produced by the treatments with the brewery residue hydrochar and treated waste wood pyrochar was lower than the amount of biogas produced by the control with only food waste. These study results indicate that the type of biochar and trace elements concentration in biochar plays a key role in determining the effectiveness of the biochar in enhancing biogas production from food waste.
Biochar modification can enhance the properties associated with the porosity and functional groups and has been identified as an effective way to improve adsorption capacity [30]. The functional groups and surface charge of biochar mainly influence the immobilization of heavy metals, which also depend upon environmental conditions and the type of metals studied for remediation [31]. Recent research has been conducted to determine the role of trace elements and unmodified biochar in the AD of food waste in anaerobic systems, respectively. However, this research did not examine the impact of biochar in conjunction with iron oxide nanoparticles in AD. Additionally, the role of biochar in the continuing AD process has not been reported. Thus, this work aimed to: (i) synthesize, characterize, and modify biochar; (ii) determine the potential of various forms of biochar to increase biogas production, and (iii) determine the influence of biochar in combination with α-Fe2O3 on biogas production. To the authors’ knowledge, this is the first study to examine the influence of modified biochar by ammonification on the production of biogas from algae, both singly and in combination with Fe2O3 NPs.

2. Materials and Methods

2.1. Collection of Red Algae P. capillacea

Red alga P. capillacea was obtained from the Mediterranean coast near Alexandria, gently cleaned with water to eliminate contaminants, and washed multiple times with distilled water and dried in an oven. P. capillacea was dried, processed, crushed to a particle size of approximately 0.5 mm, and stored until usage. According to the literature [32,33], the dry matter has been calculated. By ashing the ground dried samples overnight in a muffle furnace at 550 °C, the ash content was measured. Carbon and nitrogen content was determined from energy dispersive X-ray analysis.

2.2. Preparation of Unmodified and Modified Sawdust Raw Materials

The precursors used for the preparation of biochar was sawdust collected from an Egyptian local wood carpentry workshop. It was rinsed numerous times using tap water. Clean sawdust was dried in an oven at 105 °C and then ground and crushed. The crushed sawdust was cooked in a refluxed system for 2 h using a Soxhlet containing 250 g in a 1000 mL solution of 50% H2SO4 (99.999%), then filtered and washed with distilled water until the wash solution became neutral, followed by washing with ethanol. The final result of biochar was dried at 70 °C and then weighed. Modified SD (SD-NH2) was prepared by boiling the sawdust (25 g) for 2 h in a refluxed system utilizing a Soxhlet in a 100 mL solution of 25% NH4OH (25%), followed by filtration and washing with distilled water and ethanol. The final charcoal product was dried in an oven set to 70 °C [34,35]. H2SO4 and NH4OH were obtained from Aldrich Chemicals, Milwaukee, WI, USA.

2.3. Characterization and Measurement

The following techniques were used to characterize the samples of α-Fe2O3 NPs and biochar: Fourier transform infrared (FTIR) spectroscopy (platinum ATR) model V-100 VERTEX70, Germany, in the wavenumber range (400–4000 cm−1) with resolution values of (4 cm−1) and 16 scan, X-ray diffractograms (XRD) using a Bruker Meas Srv (D2-208219)/D2-2082019 diffractometer operating at 30 kV, 10 mA with a Cu tube (λ = 1.54), with a 2θ range of (5–80) for biochar and from (15–80) for α-Fe2O3. Individually, the prepared green nanostructure α-Fe2O3 was characterized using Raman (the sample was exposed to this beam for 1 s at a power of 10 mW and an aperture of 25 1000 mm; three distinct points were measured, and displacement occurred between 100 and 1400 cm−1). Transmission electron microscope (TEM) (JEOL, Model JSM 6360LA, Tokyo, Japan), and PSA (the Malvern Mastersizer 3000 is a compact optical system that uses laser diffraction to measure particle size distribution) were used. Thermal analyses of biochar were conducted using SDT650-Simultaneous Thermal Analyzer equipment in the temperature range of room temperature to 900 °C, with a ramping temperature of 5 °C per minute.

2.4. Inoculum and Substrates Preparation

Cow excrement was collected from a slaughterhouse in Alexandria, Egypt, sealed in a plastic bag, and stored in a plastic box container until the next day. The cow excrement was diluted 1:1 (w/v) with water.

2.5. Biogas Tests

Laboratory tests were conducted on reactors in similar digesters of cylindrical syringes [36,37,38]. The syringes were reversed directly onto the reactor lid [39]. A plastic syringe was used to sample the fuel equipped with a three-way valve and re-injected into the waste. In all tests, 100 mL glass syringes were applied. As feedstock, 1.5 g of milled P. capillacea (dried weight) was used. In each syringe, 20 g (wet weight) of each manure or activated sludge was applied to the untreated and treated P. capillacea. For 10 min, the working volume was flushed with N2. For each anaerobic degradation set-up, three replicates were performed. Until no apparent methane was produced, the inoculum was pre-incubated for three days. At 37 °C with continuous shaking at 150 rpm, the digesters were incubated. Table 1 offers an overview of the substrates used in batch experiments to estimate the P. capillacea biogas yield.

2.6. Green Synthesis of α-Fe2O3 Nanoparticles

Twenty grams of dried P. capillacea was added to 1.5 L of water and cooked on a hot plate for 20 min at 80 °C. Filtration and storage of the extract solution at 4 °C were performed. Five grams of Fe(NO3)3.9H2O was dissolved in 30 mL P. capillacea extract and then diluted to 50 mL with distilled water in a beaker. After adding a 6M NaOH solution dropwise to the stirring mixture at room temperature, the product was washed with water and dried at 80 °C for 2 h before being calcified at 450 °C for 2 h [36,40,41].

2.7. Kinetics Study and Statistical Analysis

Numerous researchers have used the nonlinear regression models, and the modified Gompertz and logistic function models. Equations (1) and (2) were applied to determine the cumulative biogas production [42,43,44]. In order to compare the accuracy of the studied models, (R2) was calculated using Excel 2010 methods and Origin 2020b.
M   = Pb × exp { exp [ Rm . e Pb   ( λ t ) + 1 ] }
M   =   Pb / ( ( 1 +   exp   { 4 . Rm . ( λ     t ) ) / pb   + 2 )

3. Results

3.1. Chemical Compositions of P. capillacea

As shown in Table 2, the VS content of the investigated P. capillacea is 83.99%. Table 2 shows a C/N ratio of about 5.89%. The majority of the literature recommends a working C/N ratio of between 20 and 30, with a maximum of 25, for anaerobic bacterial growth in the AD system [45], which is still significantly higher than the measured value for P. capillacea.

3.2. Characterization of Green α-Fe2O3 NPs

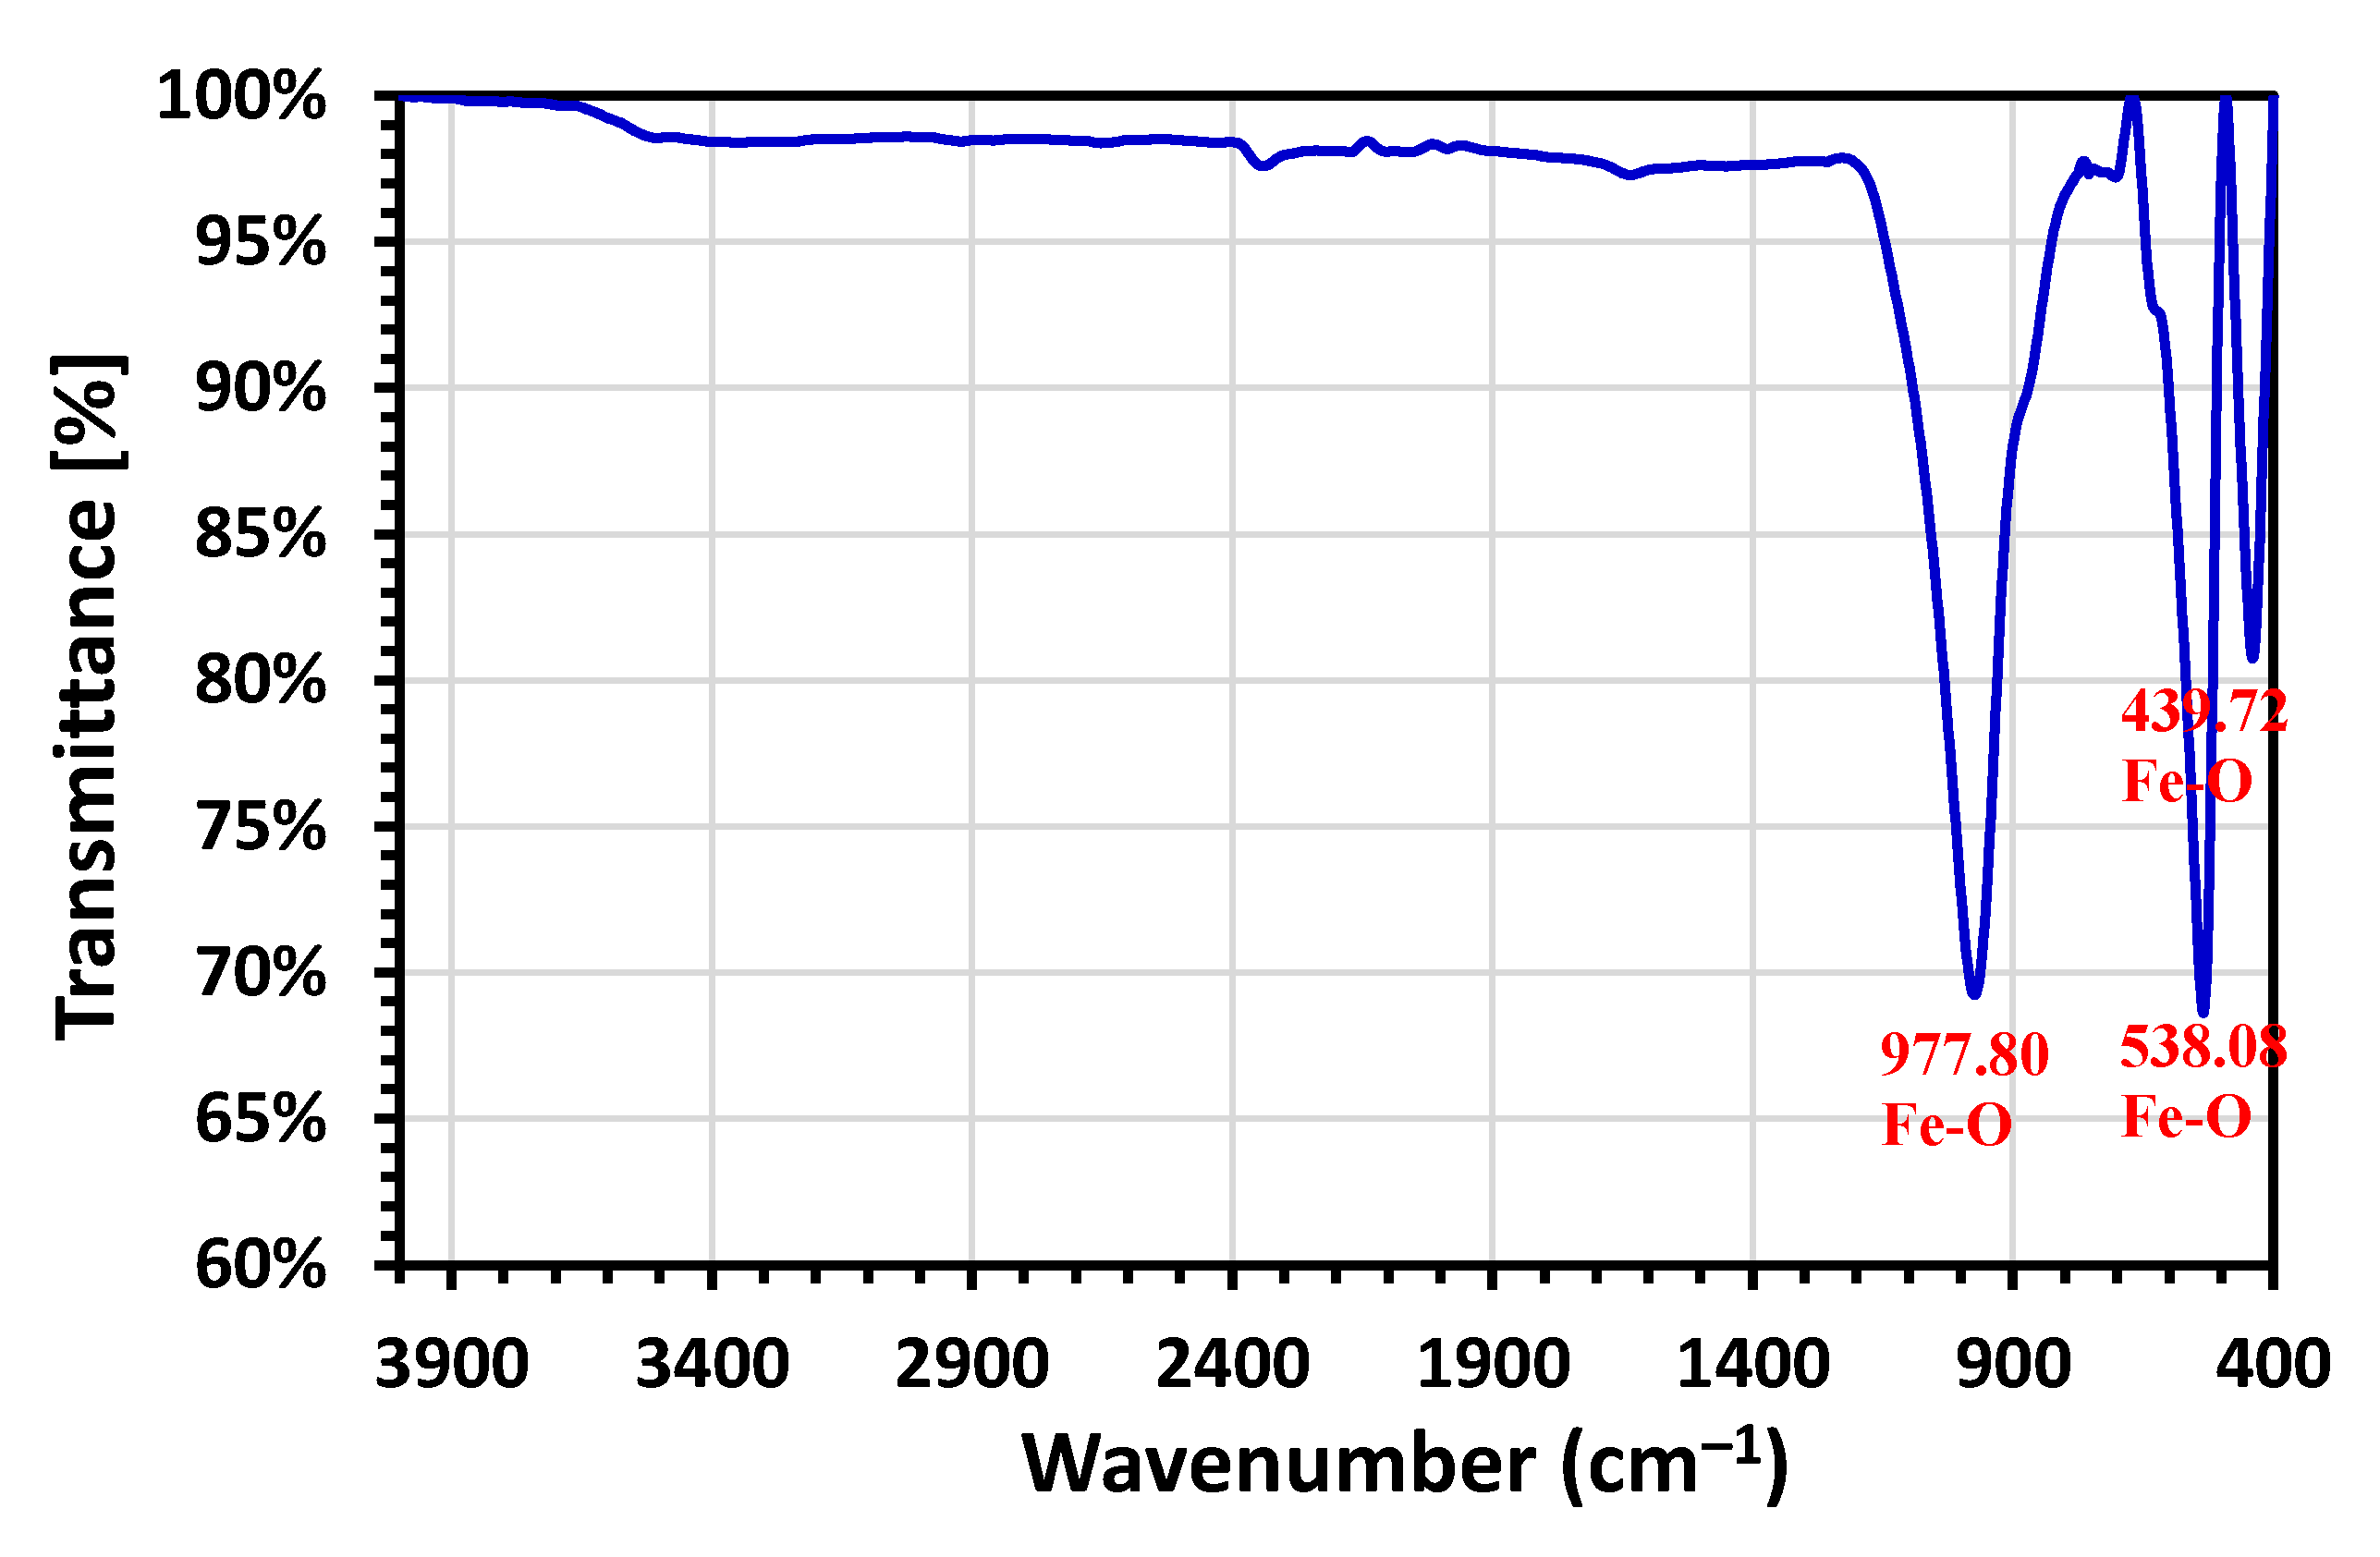
3.2.1. Fourier Transform Infrared Spectrum (FTIR)

The FTIR spectrum of hematite nanoparticles depicted in Figure 1 demonstrates a series of absorption bands ranging from 400 to 900 cm−1. The Fe–O vibrational bands of α-Fe2O3 are roughly 627, 580, and 485 cm−1 in this region [46,47,48,49,50]. The vibrational band at 977 cm−1 is due to longitudinal absorptions, but the bands at 538 and 439 cm−1 are due to the transverse absorption of a hematite structure. These bands are seen in Figure 1’s FTIR spectrum [51,52]. The FTIR spectrum of the α-Fe2O3 sample exhibits no additional vibrational bands due to the hydration and organic phase used as a capping agent being completely removed after 600 °C calcination.

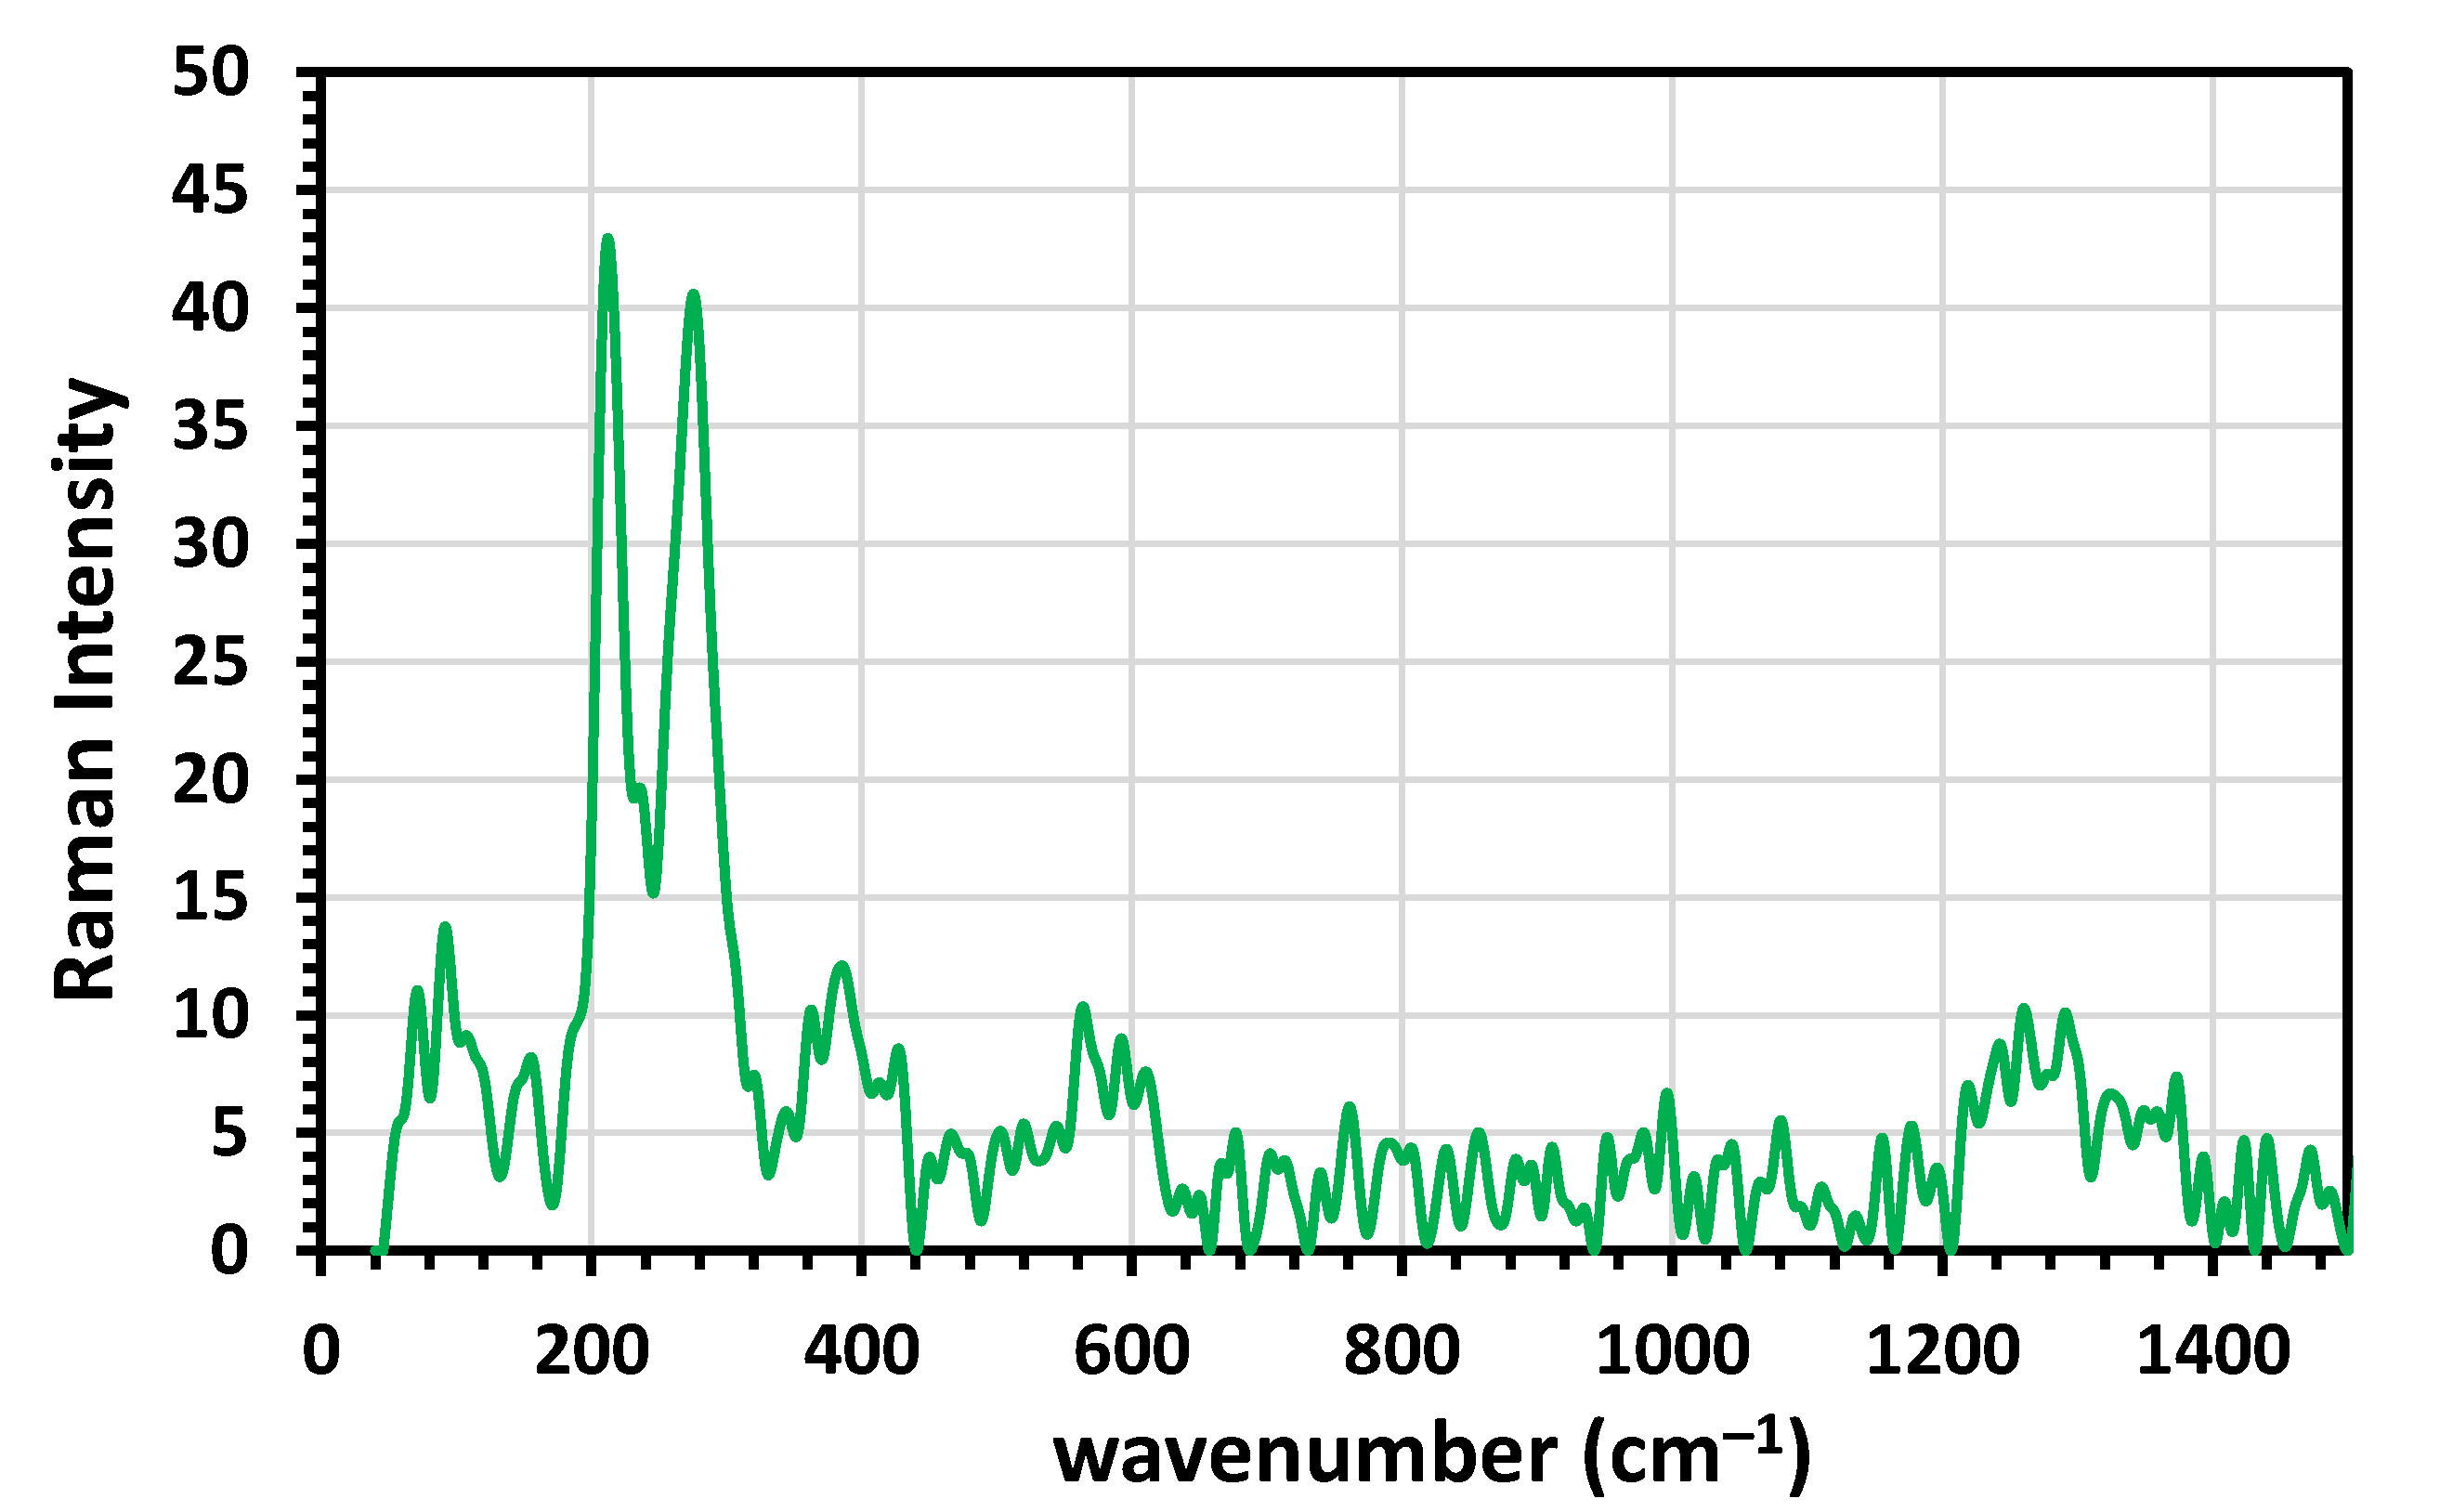
3.2.2. Raman Spectroscopy

The Raman spectrum of hematite α-Fe2O3 is depicted in Figure 2. It is devoid of peaks associated with maghemite or magnetite. The A1g modes are associated with the 214 and 567 cm−1 peaks [53]. The remaining four peaks at 278, 390, 430, and 616 cm−1 are assigned to the Eg modes [53]. This indicates that heating the initial Fe to 600 °C for four hours will completely convert it to hematite. The data obtained from the FTIR was confirmed by the results obtained from the Raman analysis which proved the formation of the hematite as reported in literature [46,47,48,49,50,51,52,53].

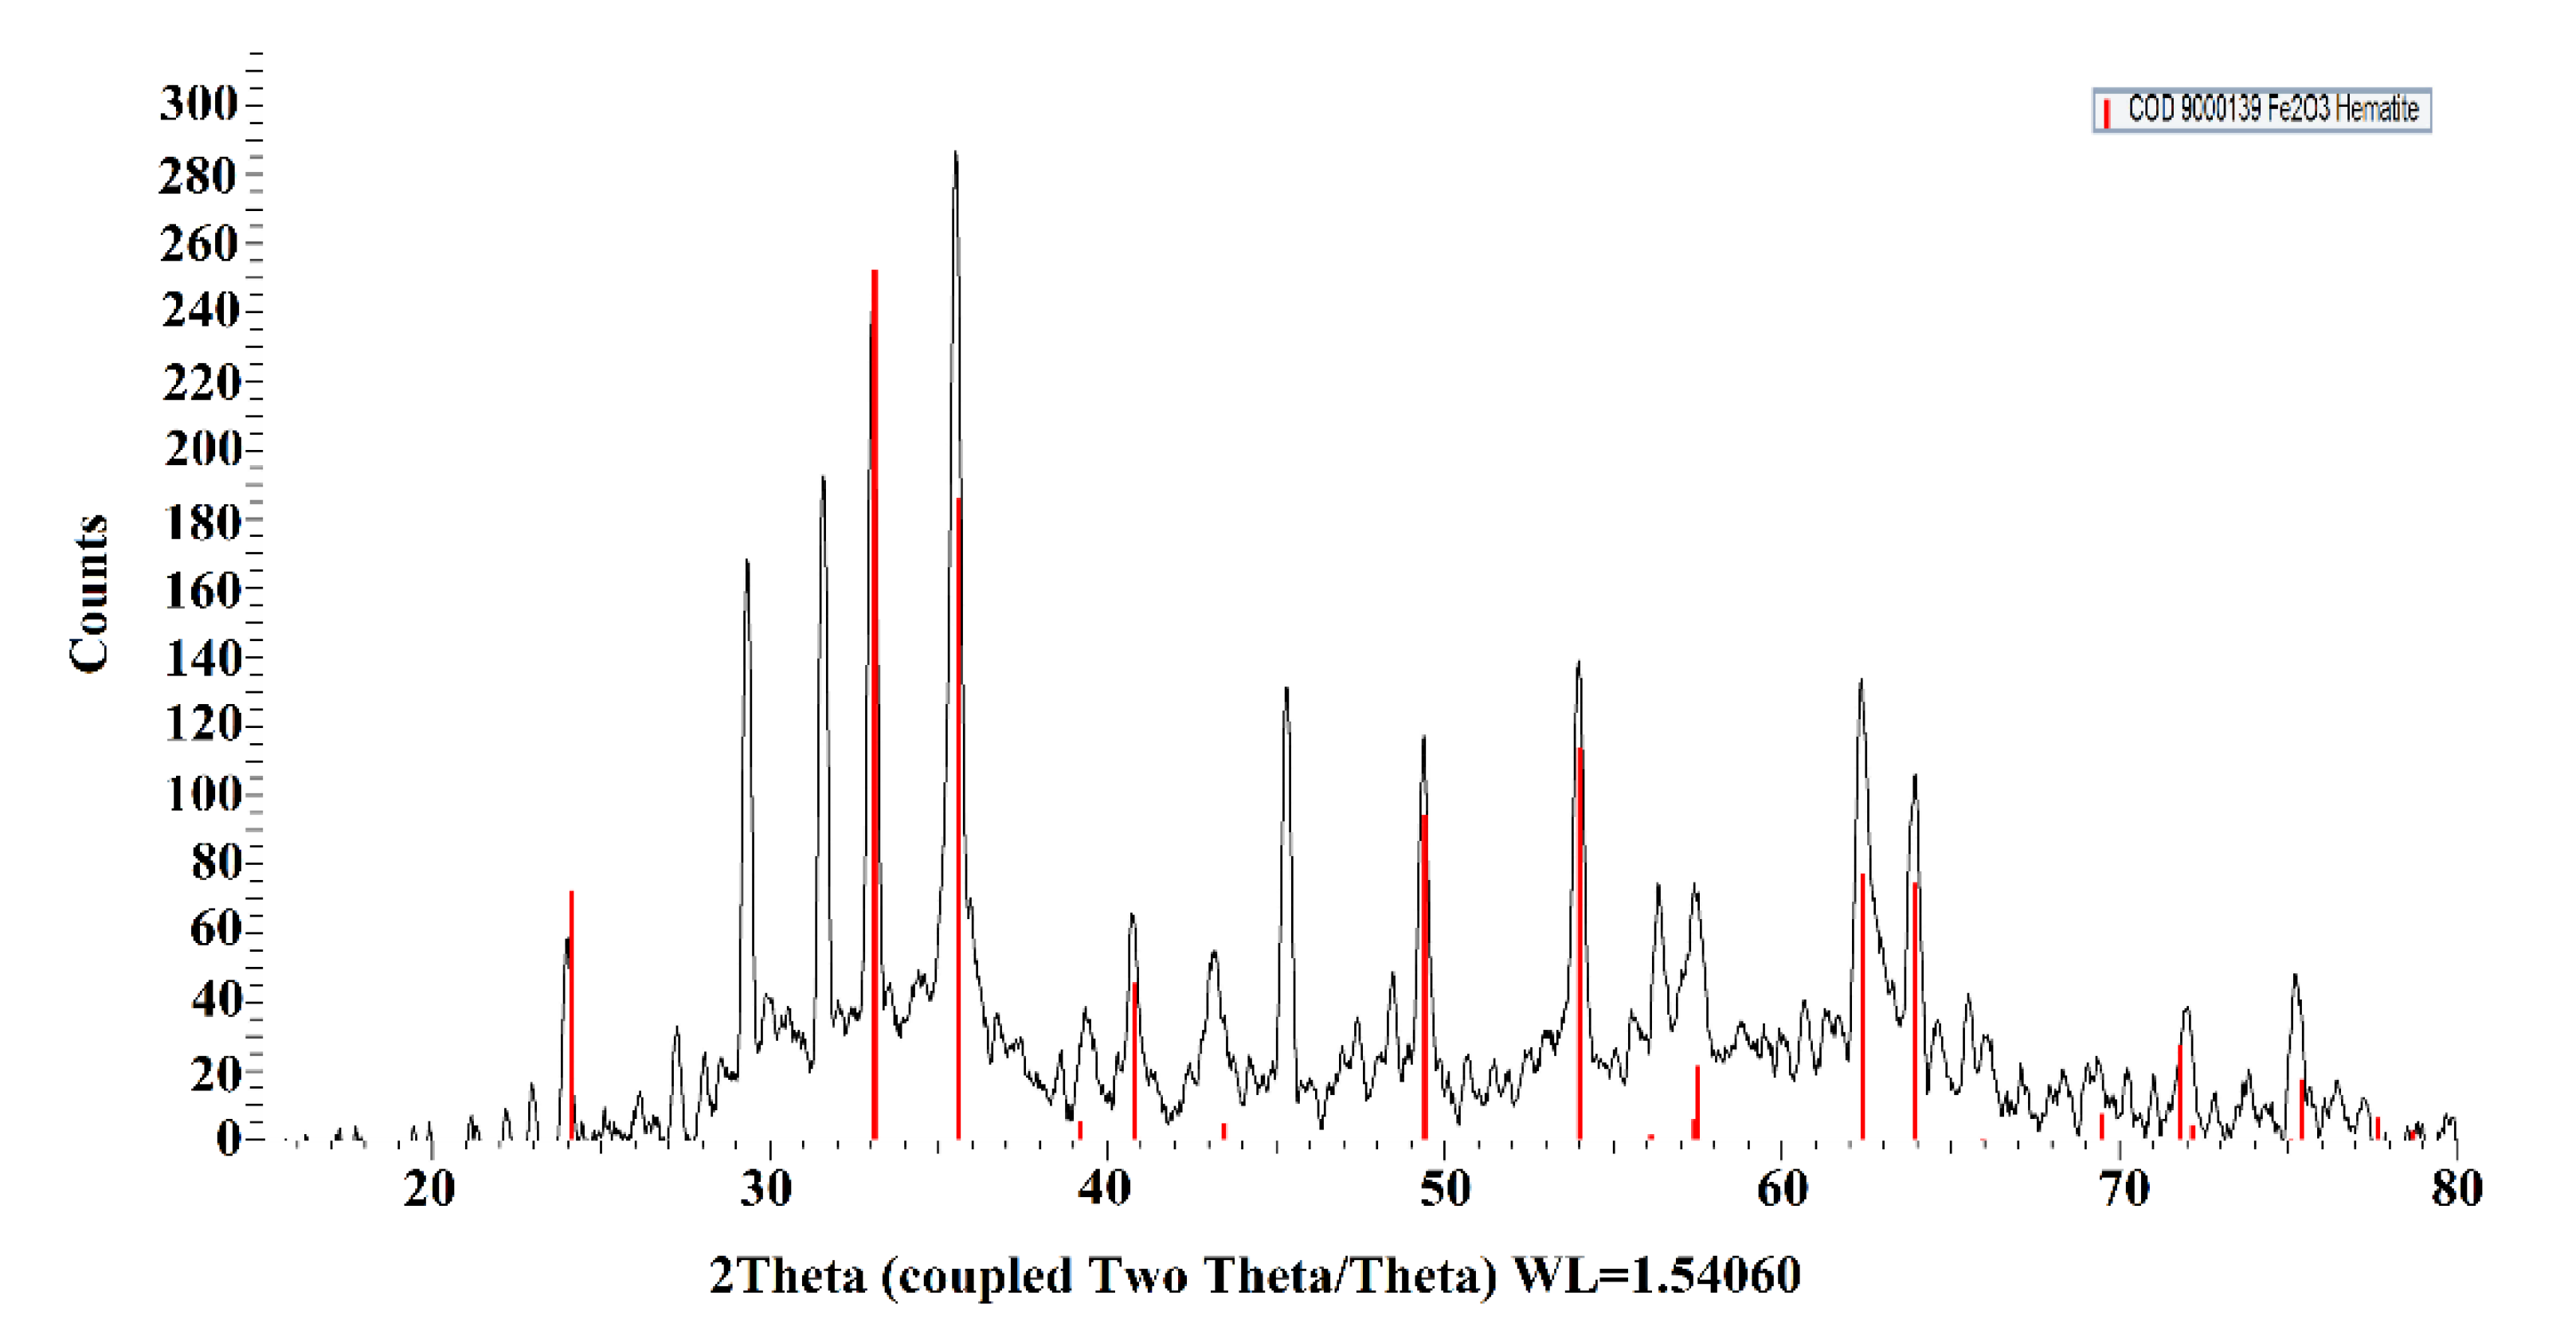
3.2.3. X-ray Diffraction (XRD)

XRD was used to characterize the crystalline structure of the produced α-Fe2O3 nanoparticles. As illustrated in Figure 3, diffraction patterns correspond to the crystallographic planes (012), (104), (110), (113), (024), (116), (018), (214), and (300) of rhombohedral phase α-Fe2O3, were assigned for 2theta of 24.106, 33.149, 35,577, 40.888, 49.446, 54.119, 56.517, 62.252, and 64.013, respectively, based on the standard COD card (No. 9,000,139) α-Fe2O3 hematite, which confirms the synthesis of α-Fe2O3 nanoparticles. This demonstrates that α-Fe2O3 hematite nanoparticles may be synthesized using such a simple and environmentally friendly method.

3.2.4. Transmission Electron Microscopy (TEM)

The TEM micrograph (Figure 4) revealed that the particles were oval and pyramid-shaped, suggesting that they are self-assembled into a large spindle with pores via electrostatic and/or van der Waals forces and aggregated as a result of algal extract solvating and capping the nanoparticles [54]. The particle diameters range from 5.6 to 16.8 nm.

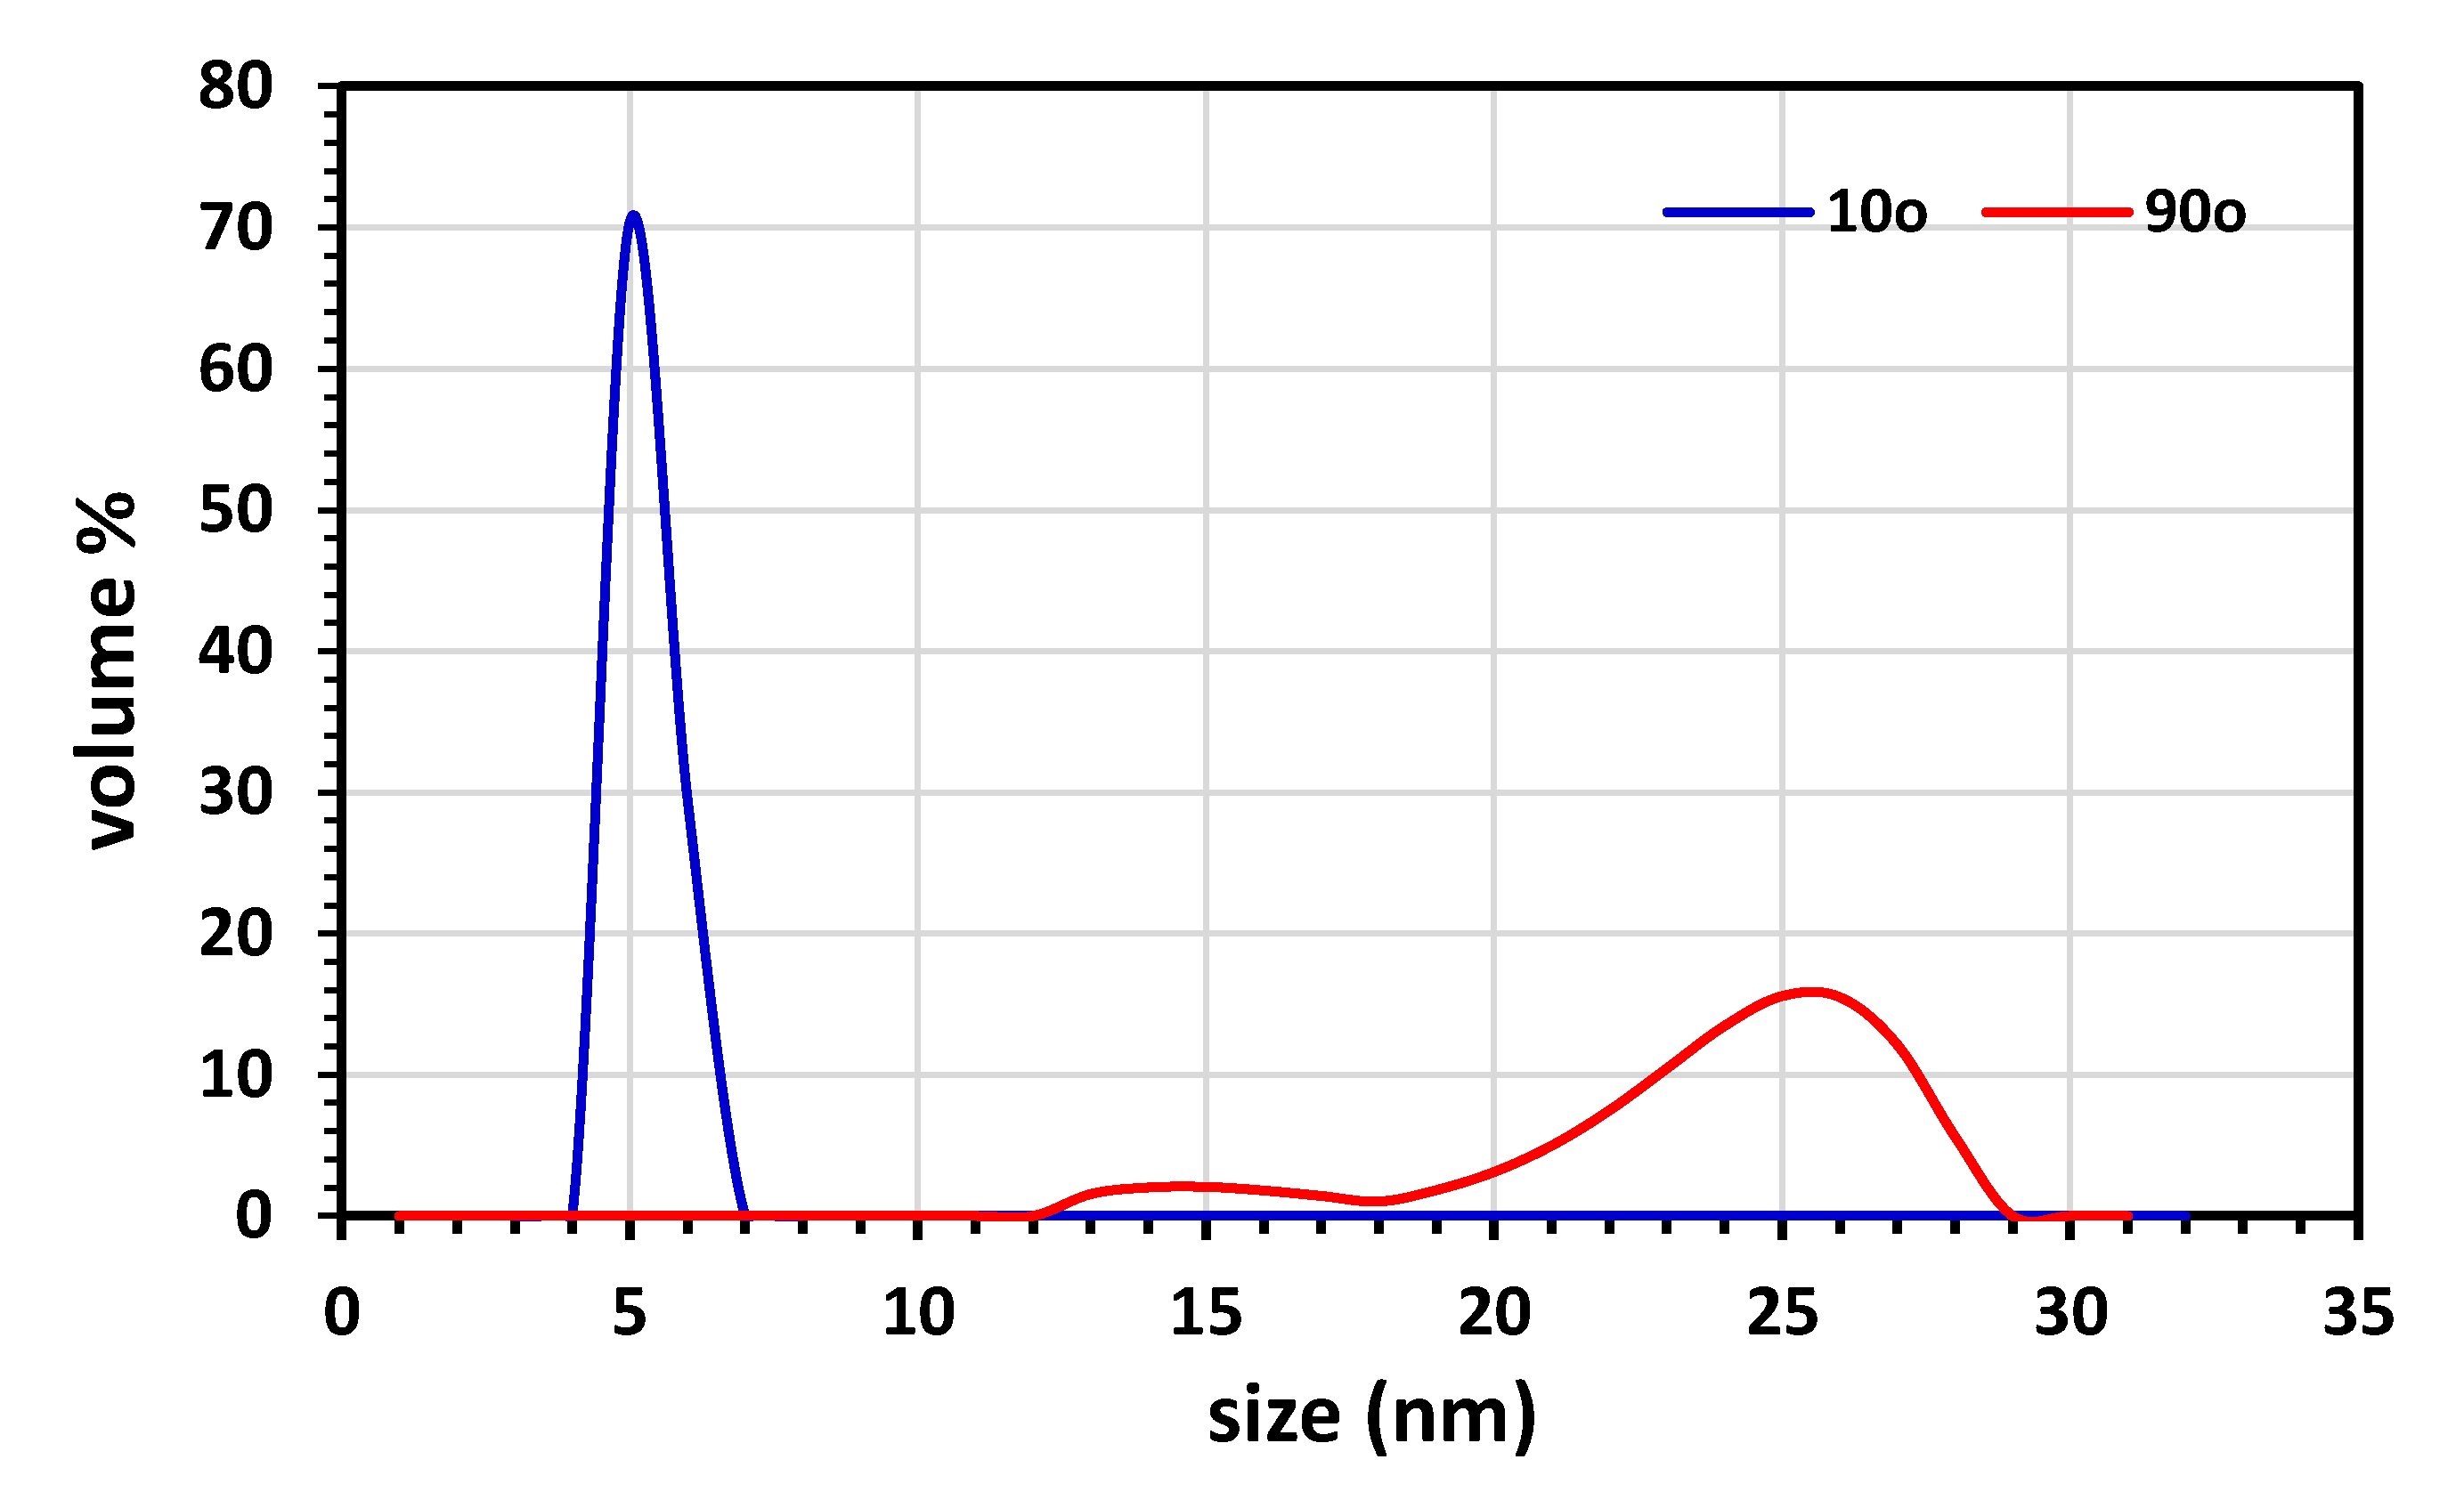
3.2.5. Particle Size Analyzer (PSA) and BET Analysis of the Surface Area

The size distribution is shown in Figure 5 and is defined by PSA for α-Fe2O3 NPs, as a result of detecting α-Fe2O3 hematite in two ranges of size. The range from 6 to 8 nm using a 10° test angle has small size particles and another range of particle sizes around 122 to 691 nm using a 90° test angle; the results indicate the widest size distribution of the α-Fe2O3 nanoparticles. In addition, the dominant sizes of the hematite were about 421 nm. The BET analysis (Table 3) of green α-Fe2O3 shows that the surface area and average pore size of the synthesized magnetite (α-Fe2O3) nanoparticles were 29.29 m2/g and 11.92 nm, respectively.

3.3. Characterization of Biochar

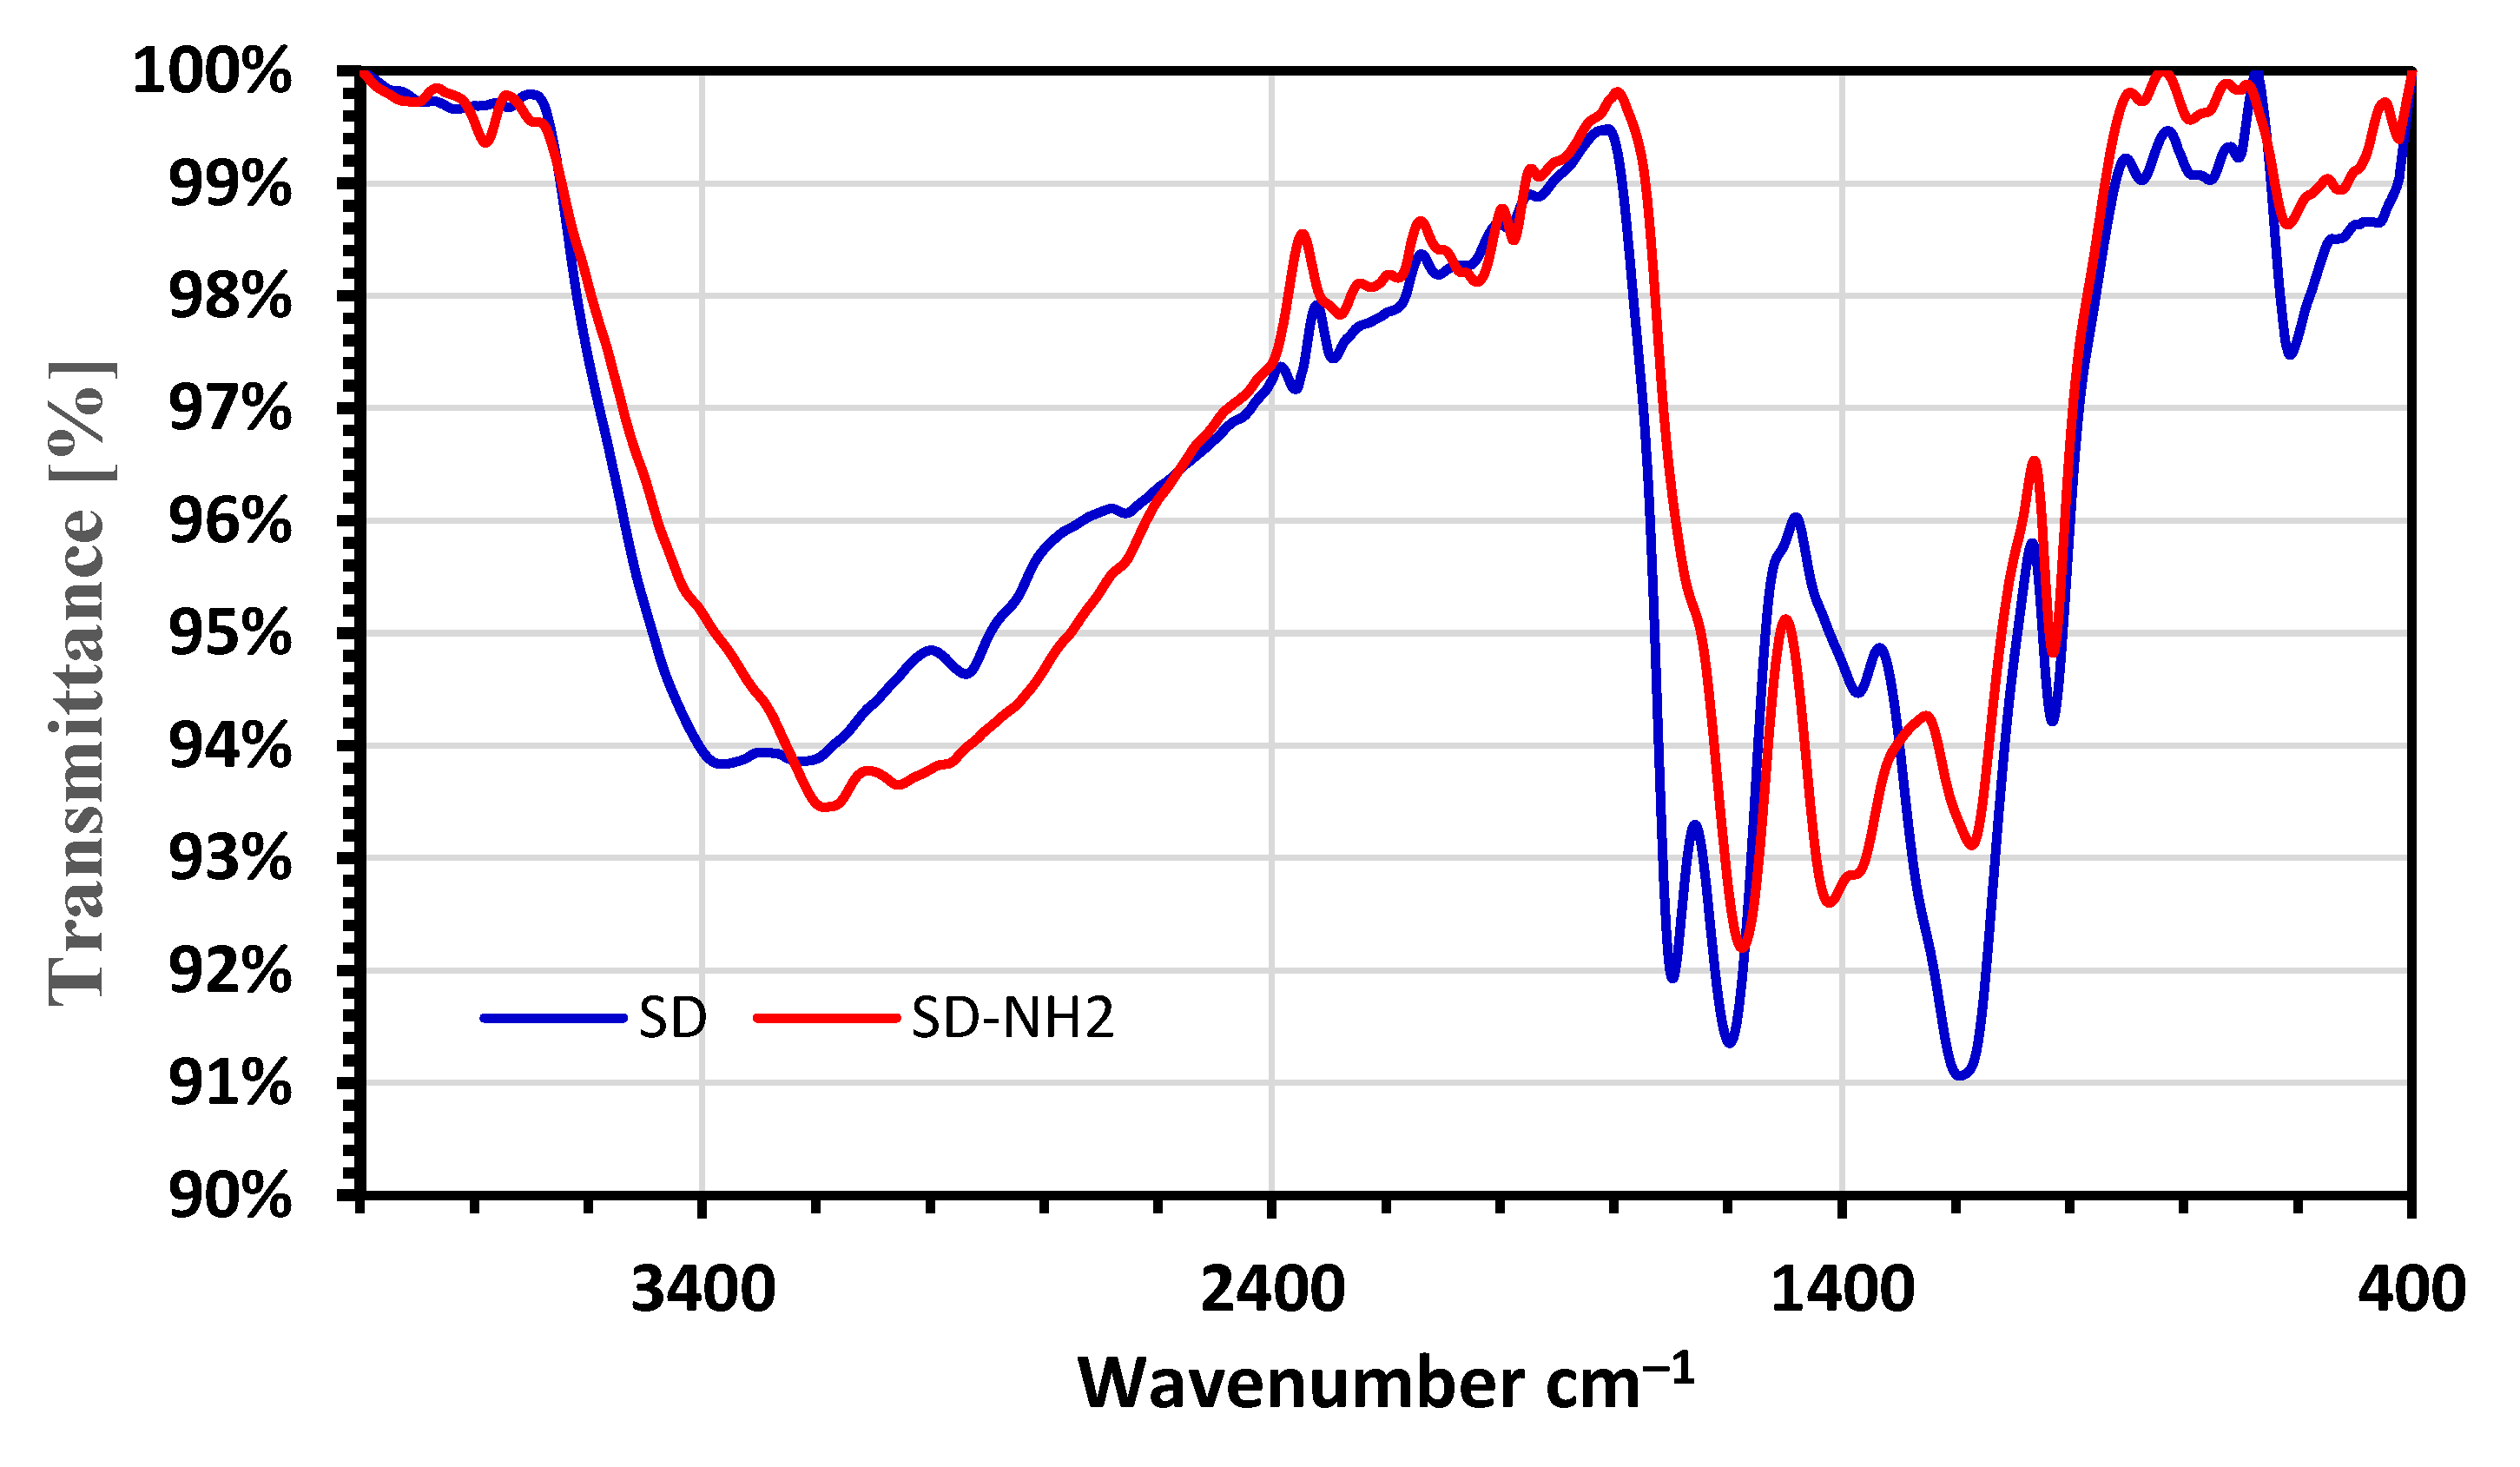
3.3.1. Fourier Transform Infrared Spectra (FTIR)

The FTIR spectrum (Figure 6) was used to qualitatively analyze the chemical structures of biochar modified with H2SO4 and NH4OH. Both samples’ FTIR spectra exhibit some similarities. The band between 3388 and 3203 cm–1 corresponds to the –OH and –NH in SD and SD-NH2 biochars, respectively [16,55]. C–H stretching can be attributed to the adsorption peak at 2921 cm–1. The significant adsorption peak at 1701 cm–1 can be attributed to the carboxyl group’s C=O stretching, which was absent in SD and completely absent in SD-NH2 biochars [16,55]. In both SD and SD-NH2 biochars, the band 1581 cm–1 corresponds to the C=O stretching vibration. In SD and SD-NH2 biochars, the peak at 1209–1176 cm–1 represents a rise in C–O–C, while at (1029–1033, 784–792, 615–626) cm–1 represents a Si–O–Si stretching.

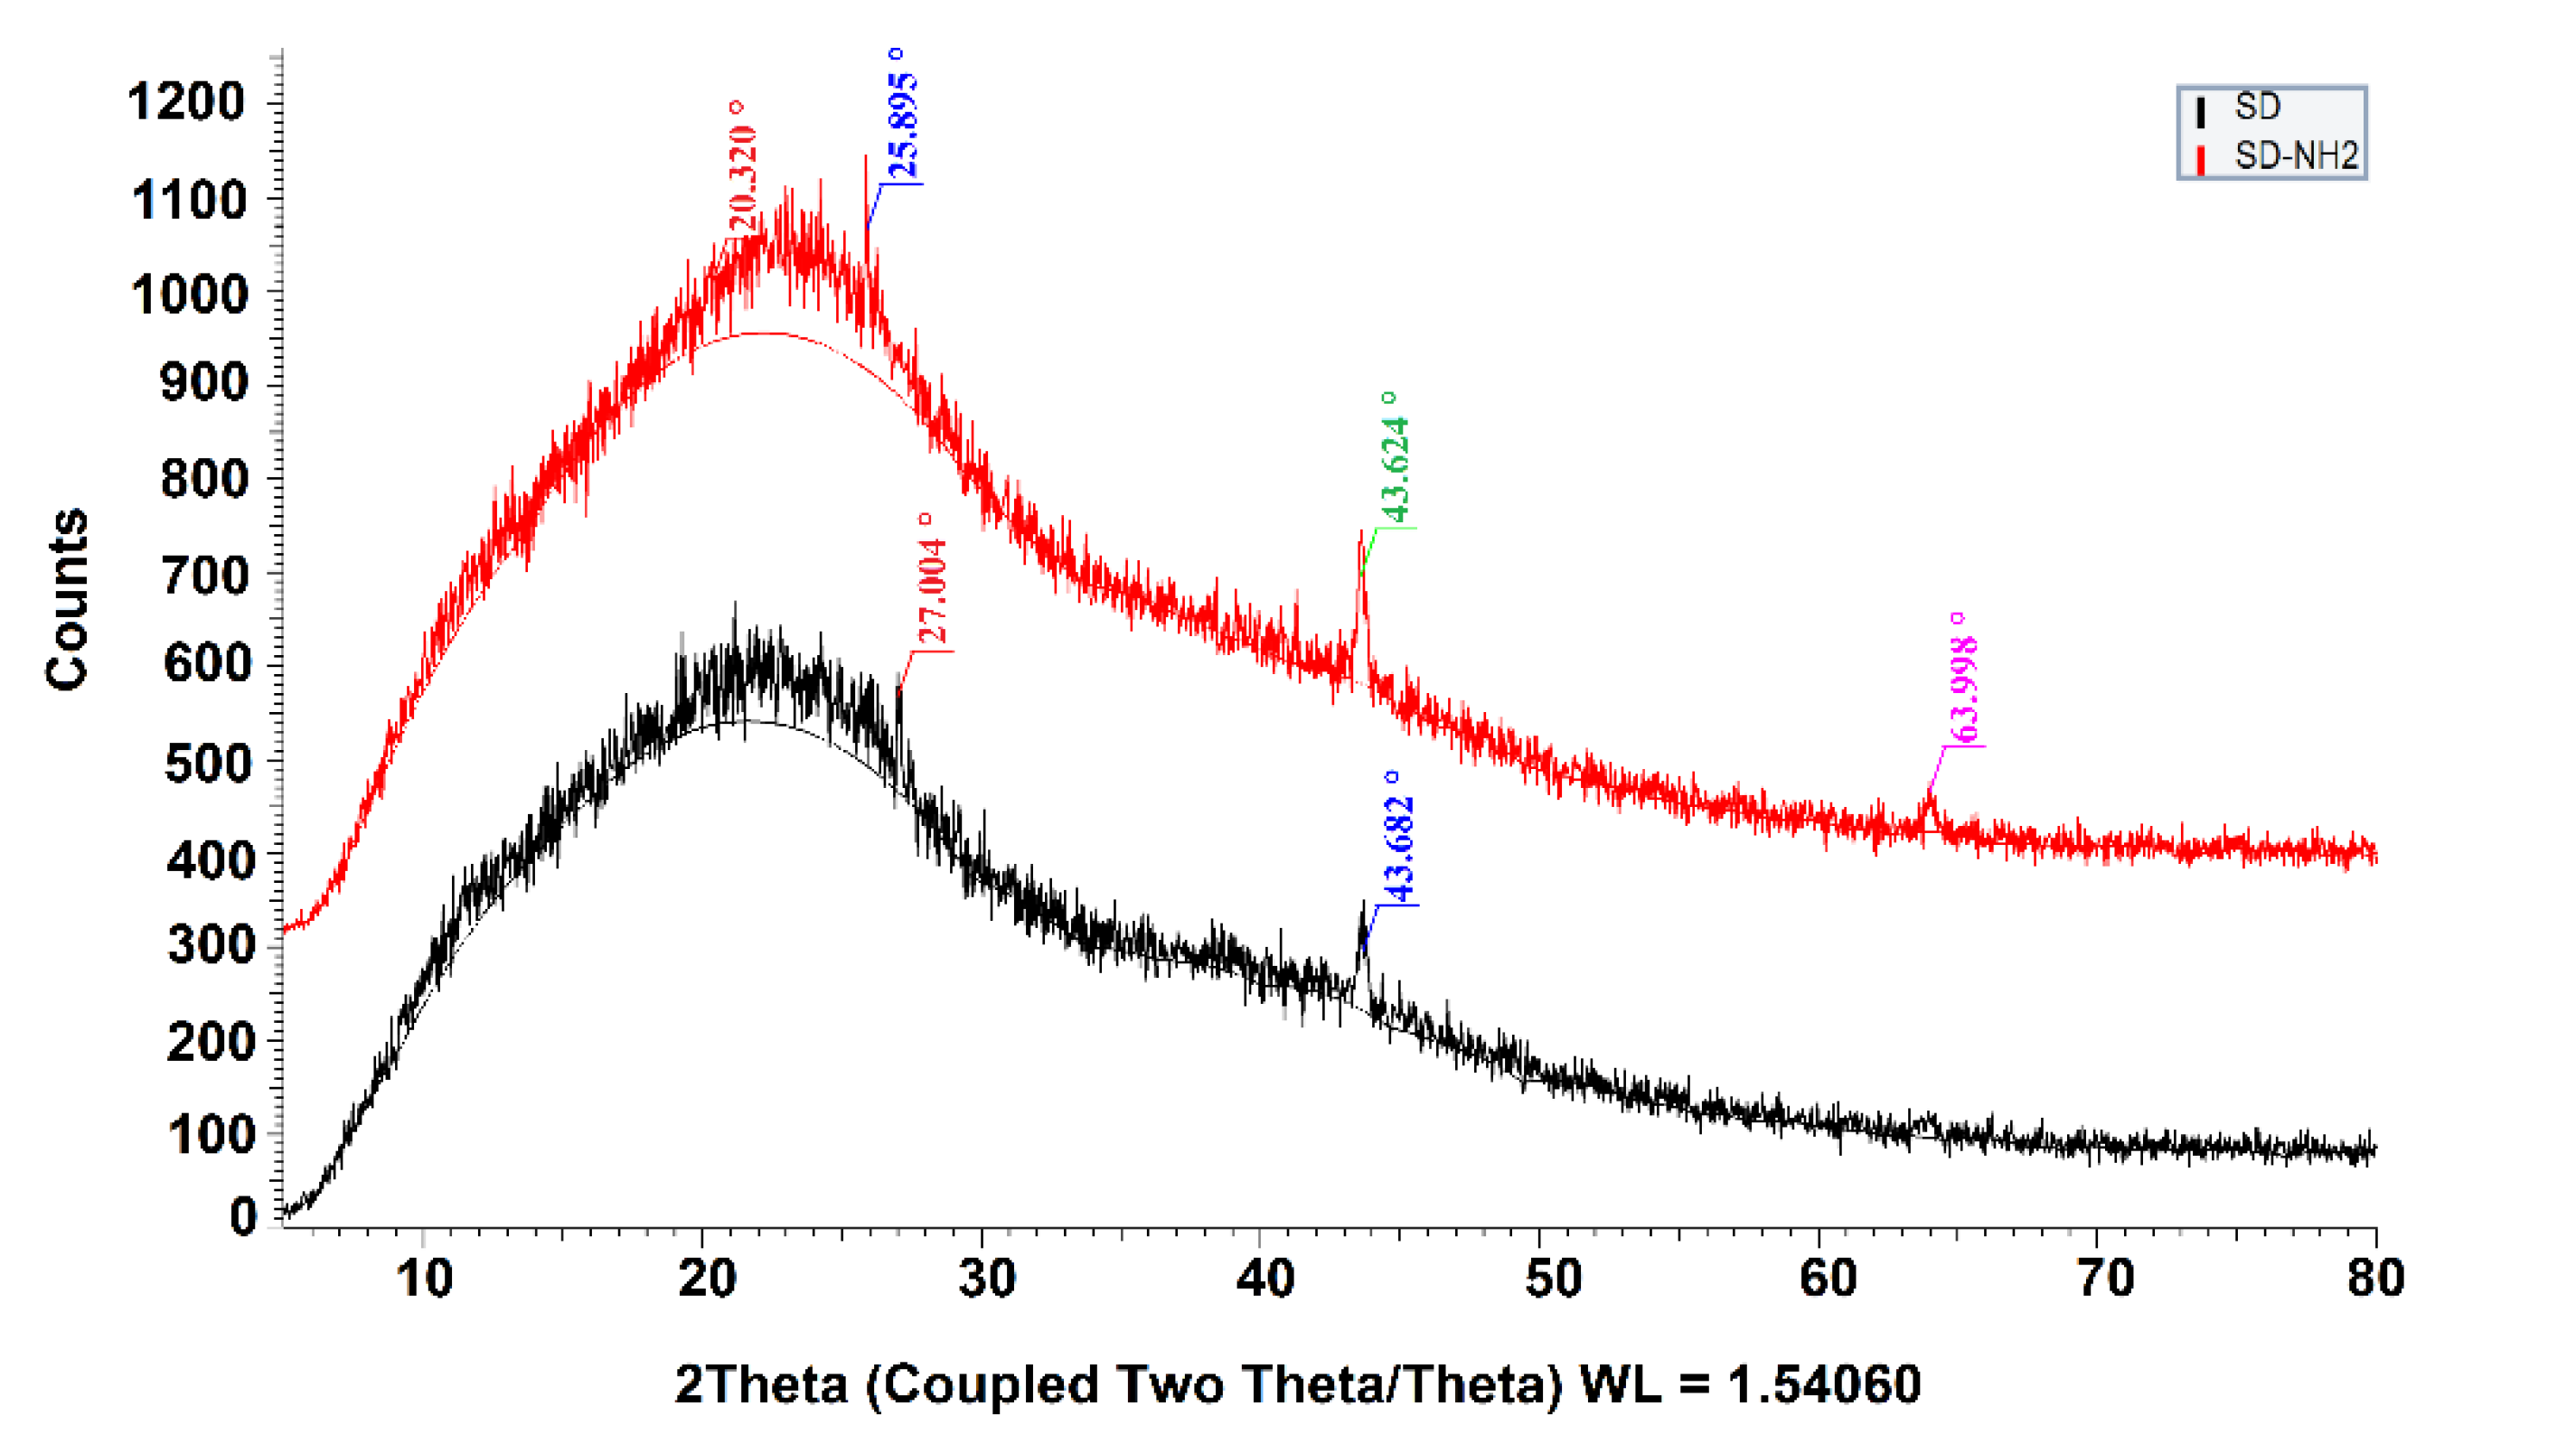
3.3.2. X-ray Diffraction (XRD)

Figure 7 shows the XRD of the SD and SD-NH2 biochar. The broad peak in the region of 2θ = 10–30 is indexed as C (002) diffraction peak indicating an amorphous carbon structure with randomly oriented aromatic sheets. There are sharp peaks around 2θ = 27 and 43.65. In the case of SD-NH2, sharp peaks around 2θ = 25.8, 43.6, and 63.9 correspond to the miscellaneous inorganic components mainly constituted of quartz and albite, within the structure of SD, which indicated that the original feedstocks were rich in Si, which can be manifested by the Si-O-Si stretching band from FTIR spectra [55].

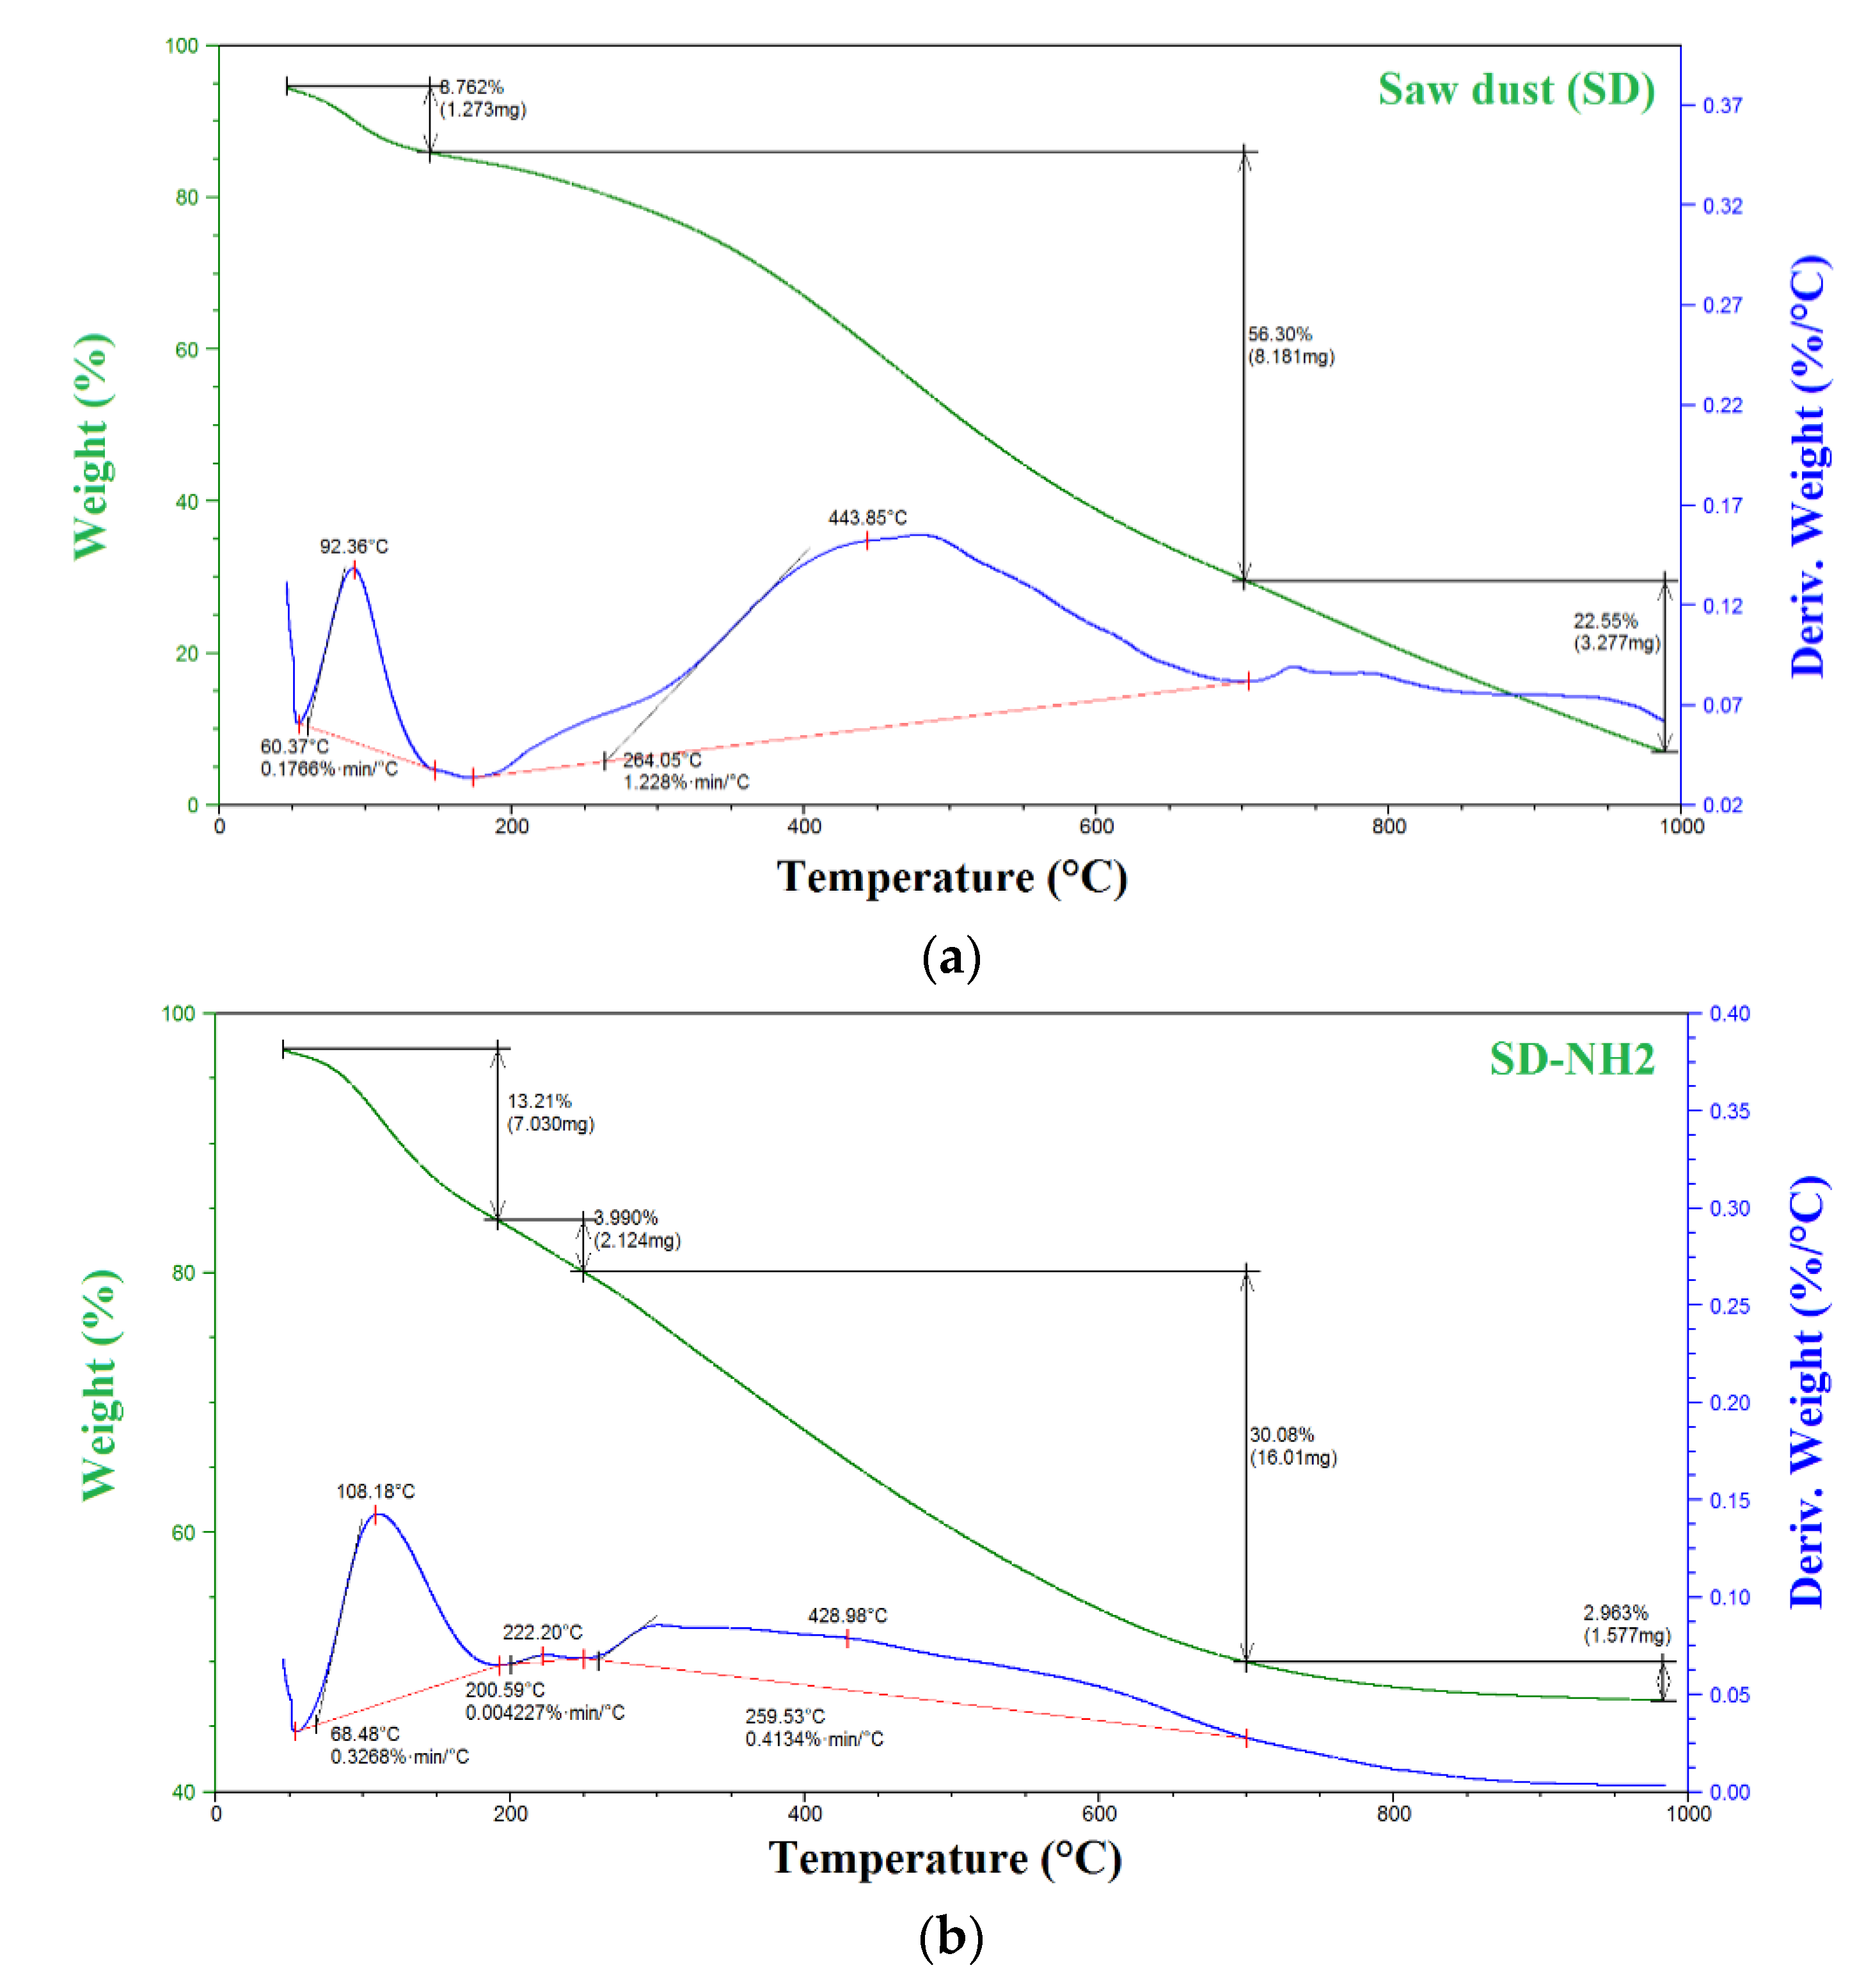
3.3.3. Thermal Analysis (TGA)

The decomposition of sawdust biochar occurs in three steps, whereas the SD-NH2 biochars decompose in two steps, as illustrated in Figure 8. The first step occurred between 50 and 150 °C as a result of the loss of surface-bound water and moisture present in the sample, resulting in a weight loss of 6.7, 13.21, and 6.7%, respectively, for SD and SD-NH2 [7,34,35]. The second phase results in a 56.30% weight loss at 150–350 °C and a 3.9% weight loss at 150–275 °C for SD and SD-NH2. The third phase results in a 22.55% weight loss at 350–1000 °C and a 30.03% weight loss at 275–1000 °C, for SD and SD-NH2, respectively [7,34,35]. The weight retained by SD-NH2 biochars and the percentages of 2.96% obtained, as well as the DTA curves, indicate that the SD-NH2 biochar amine-modified sample exhibits more stability than the SD biochar [7,34,35]. This enhances the susceptibility to consume SD during anaerobic digestion, which explains why the cumulative amount of biogas produced was greater when SD biochar was used rather than SD-NH2 biochars.

3.3.4. BET Analysis of the Surface Area

The parameters of SD and SD-NH2 biochars, including their BET-specific surface area, total pore volume, and mean pore diameter, are reported in Table 4. Interestingly, the modification enhanced the surface area of SD (2.913) and SD-NH2 (3.19) biochars.

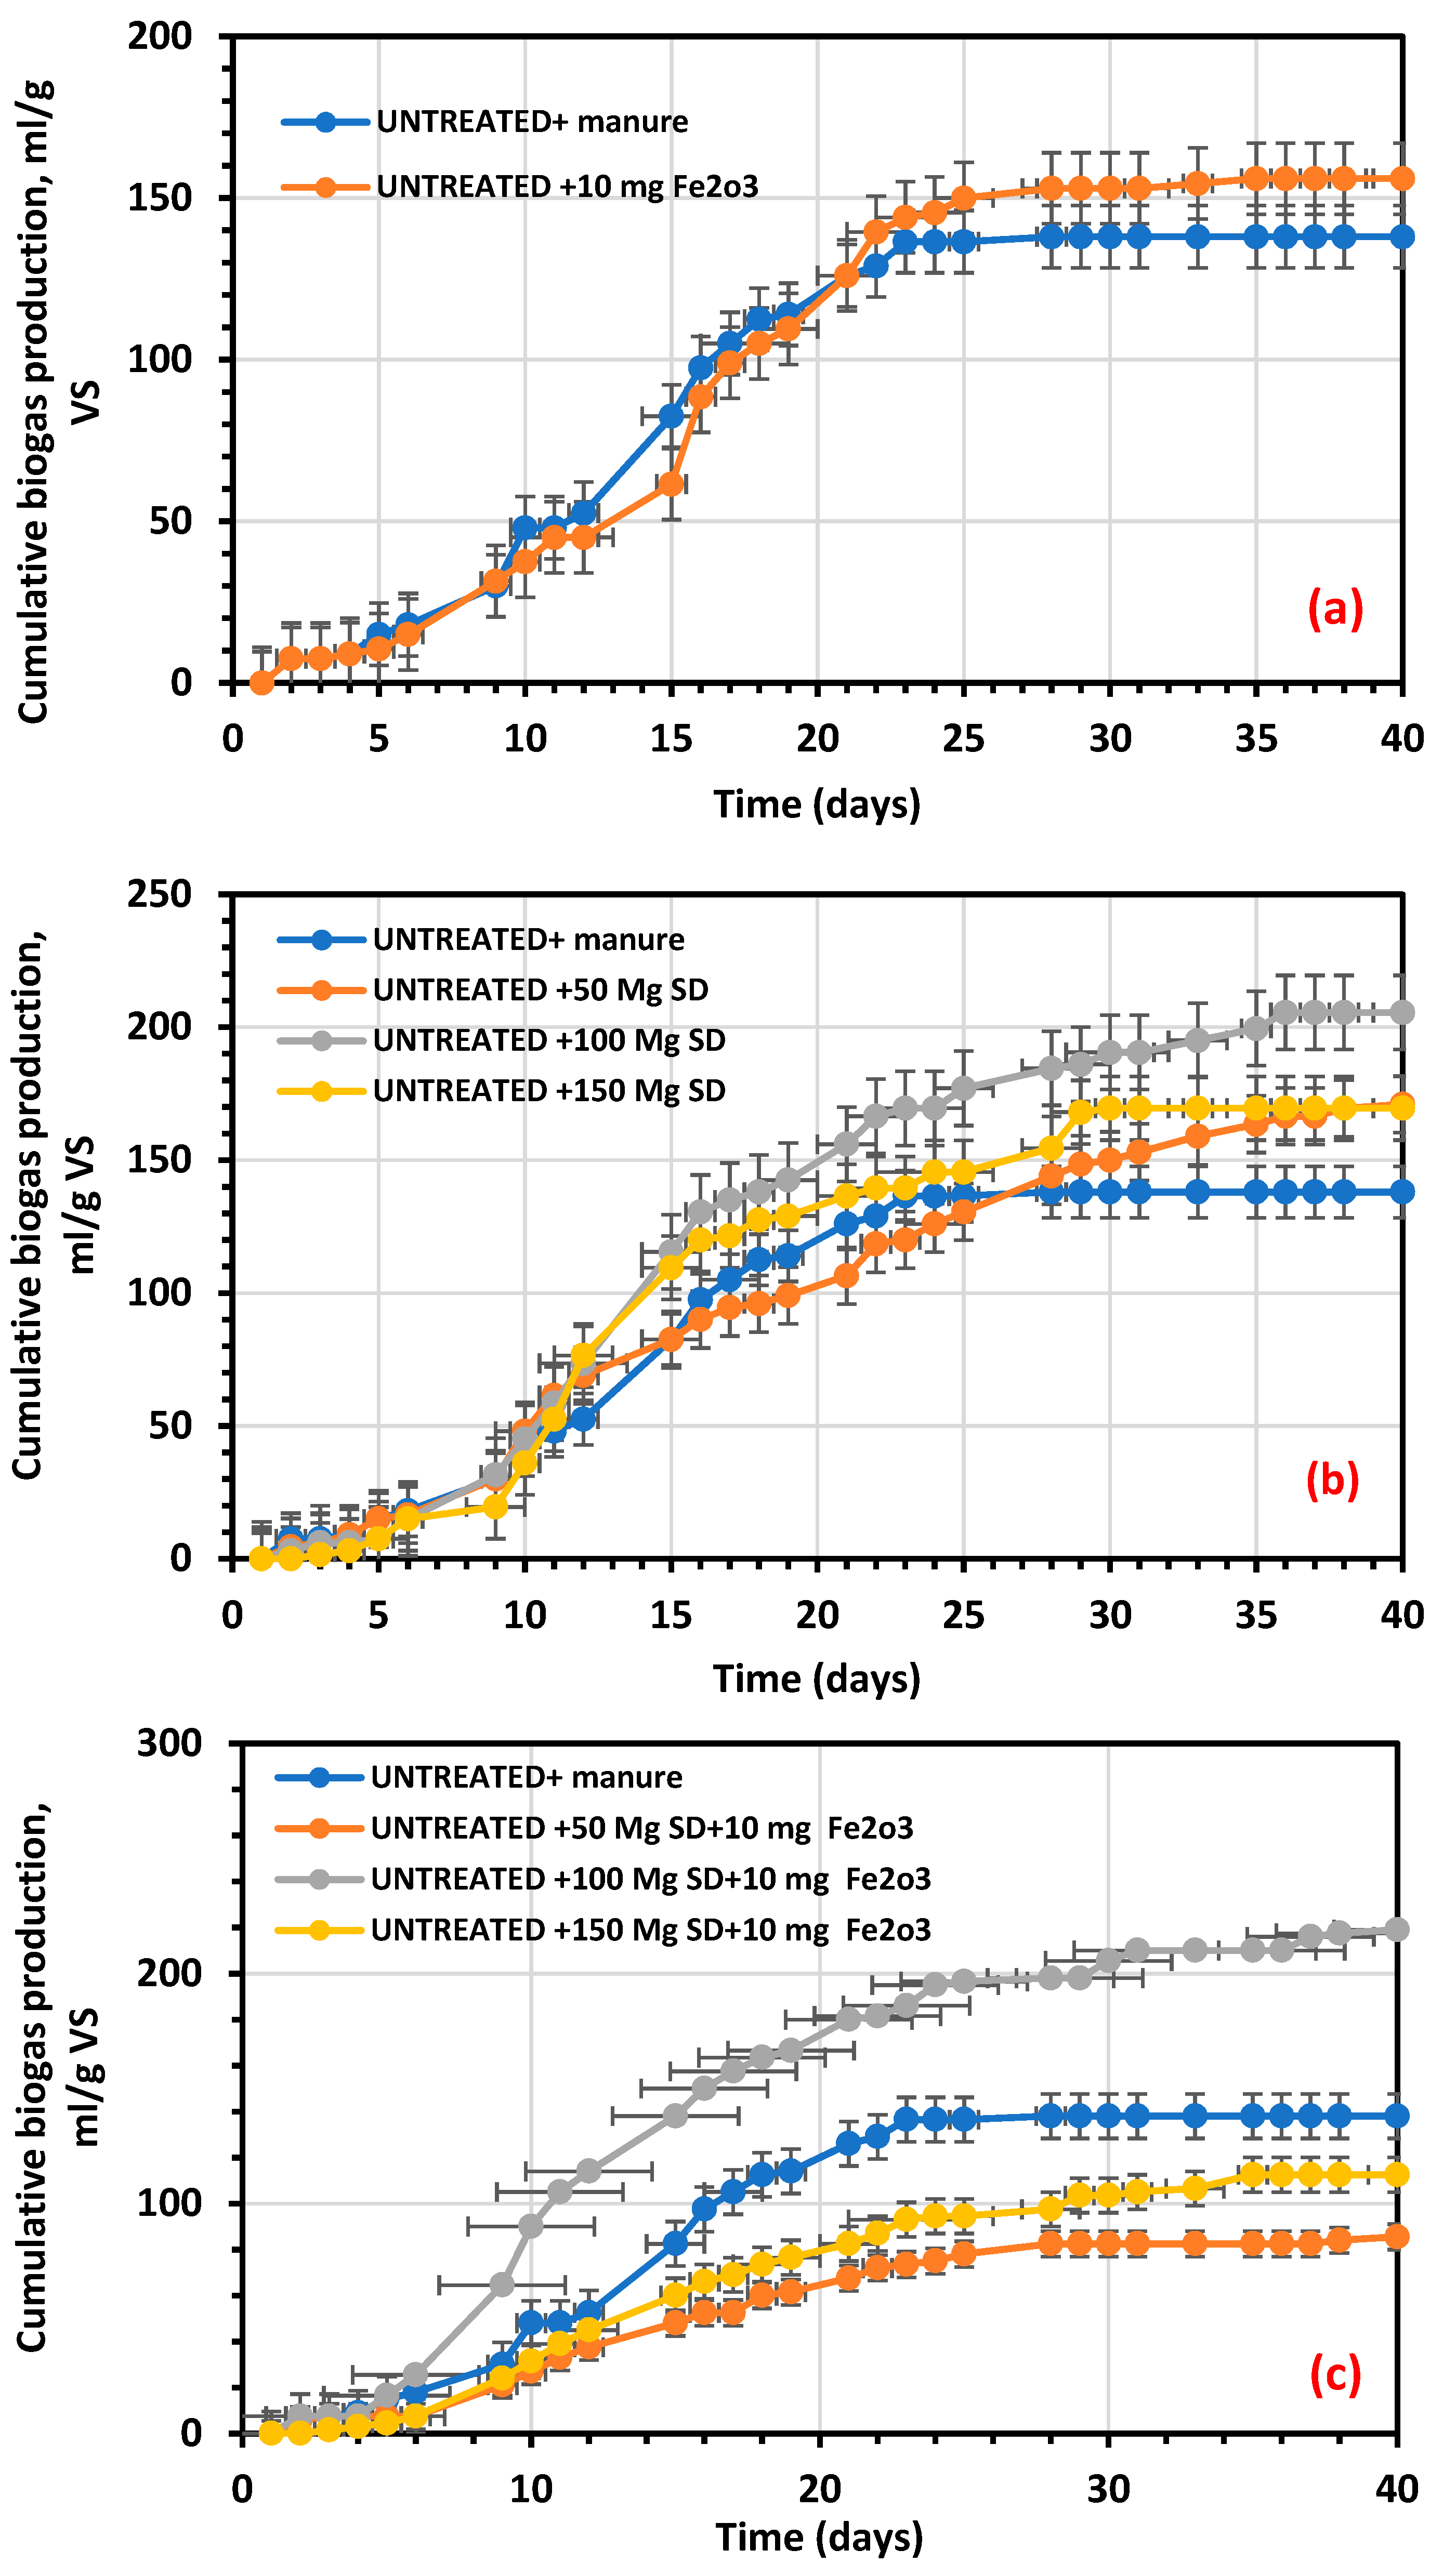
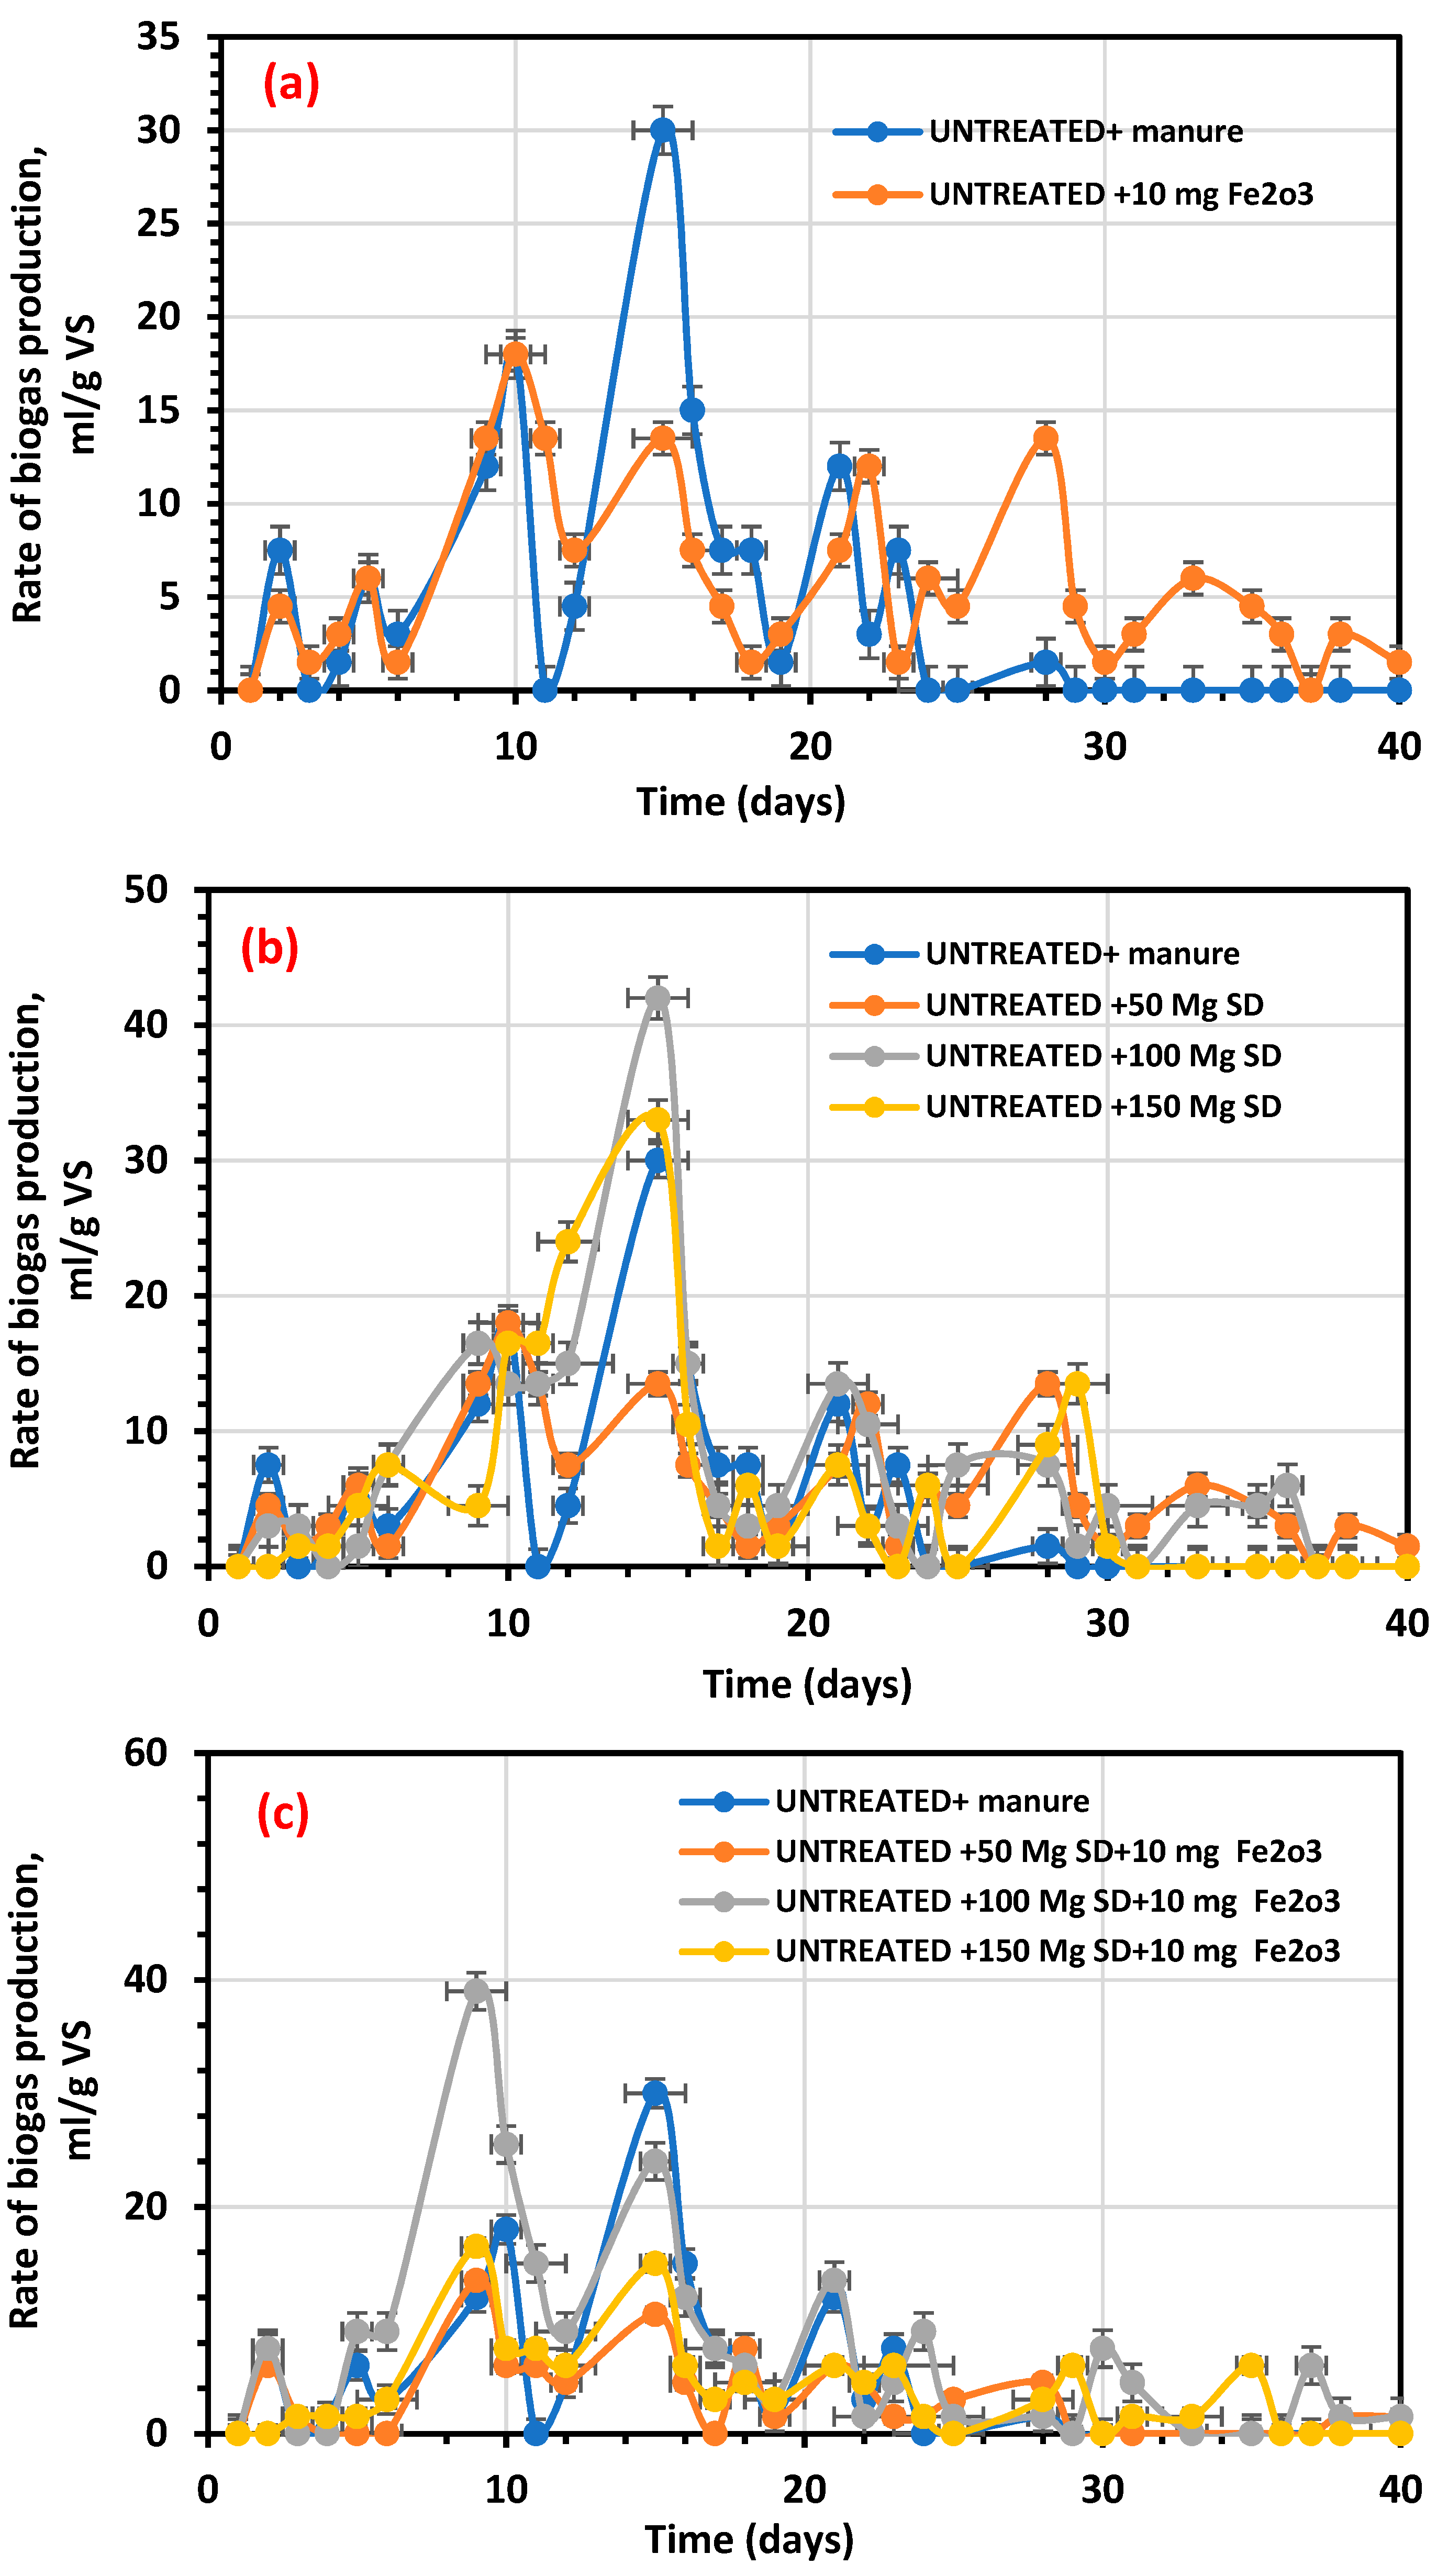
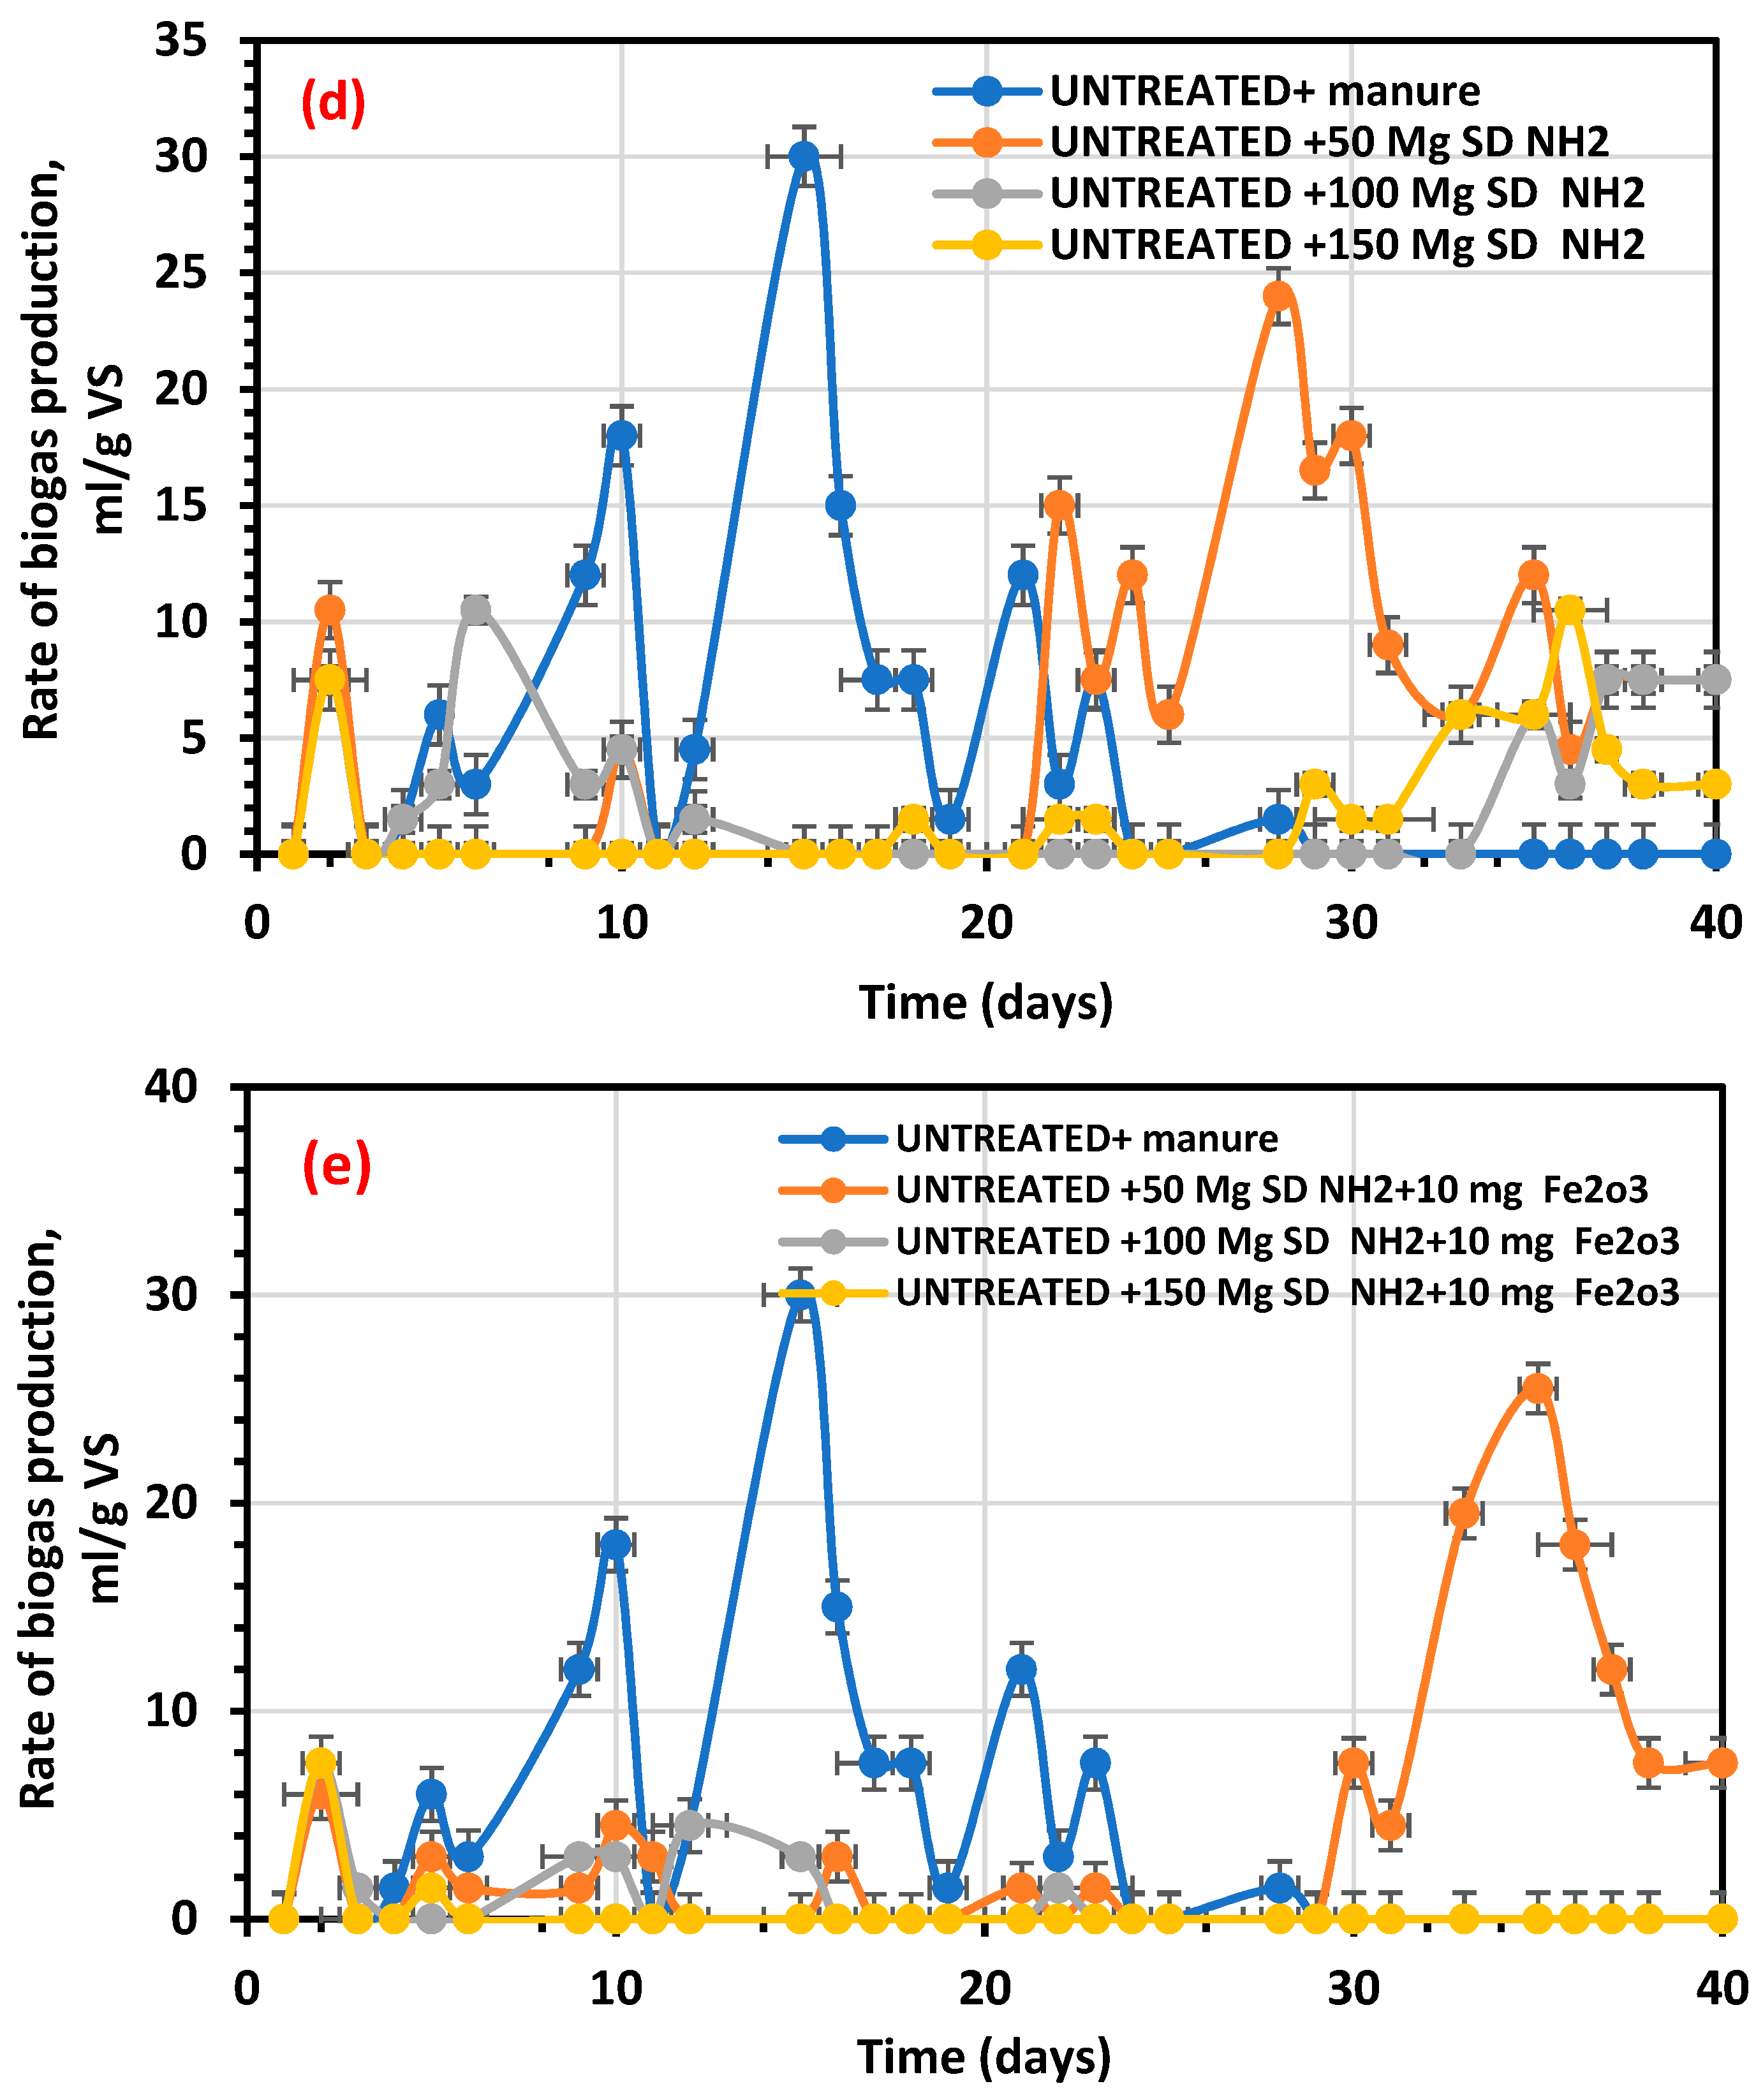
3.4. Impact of Pretreatment on Anaerobic Digestion by Batch
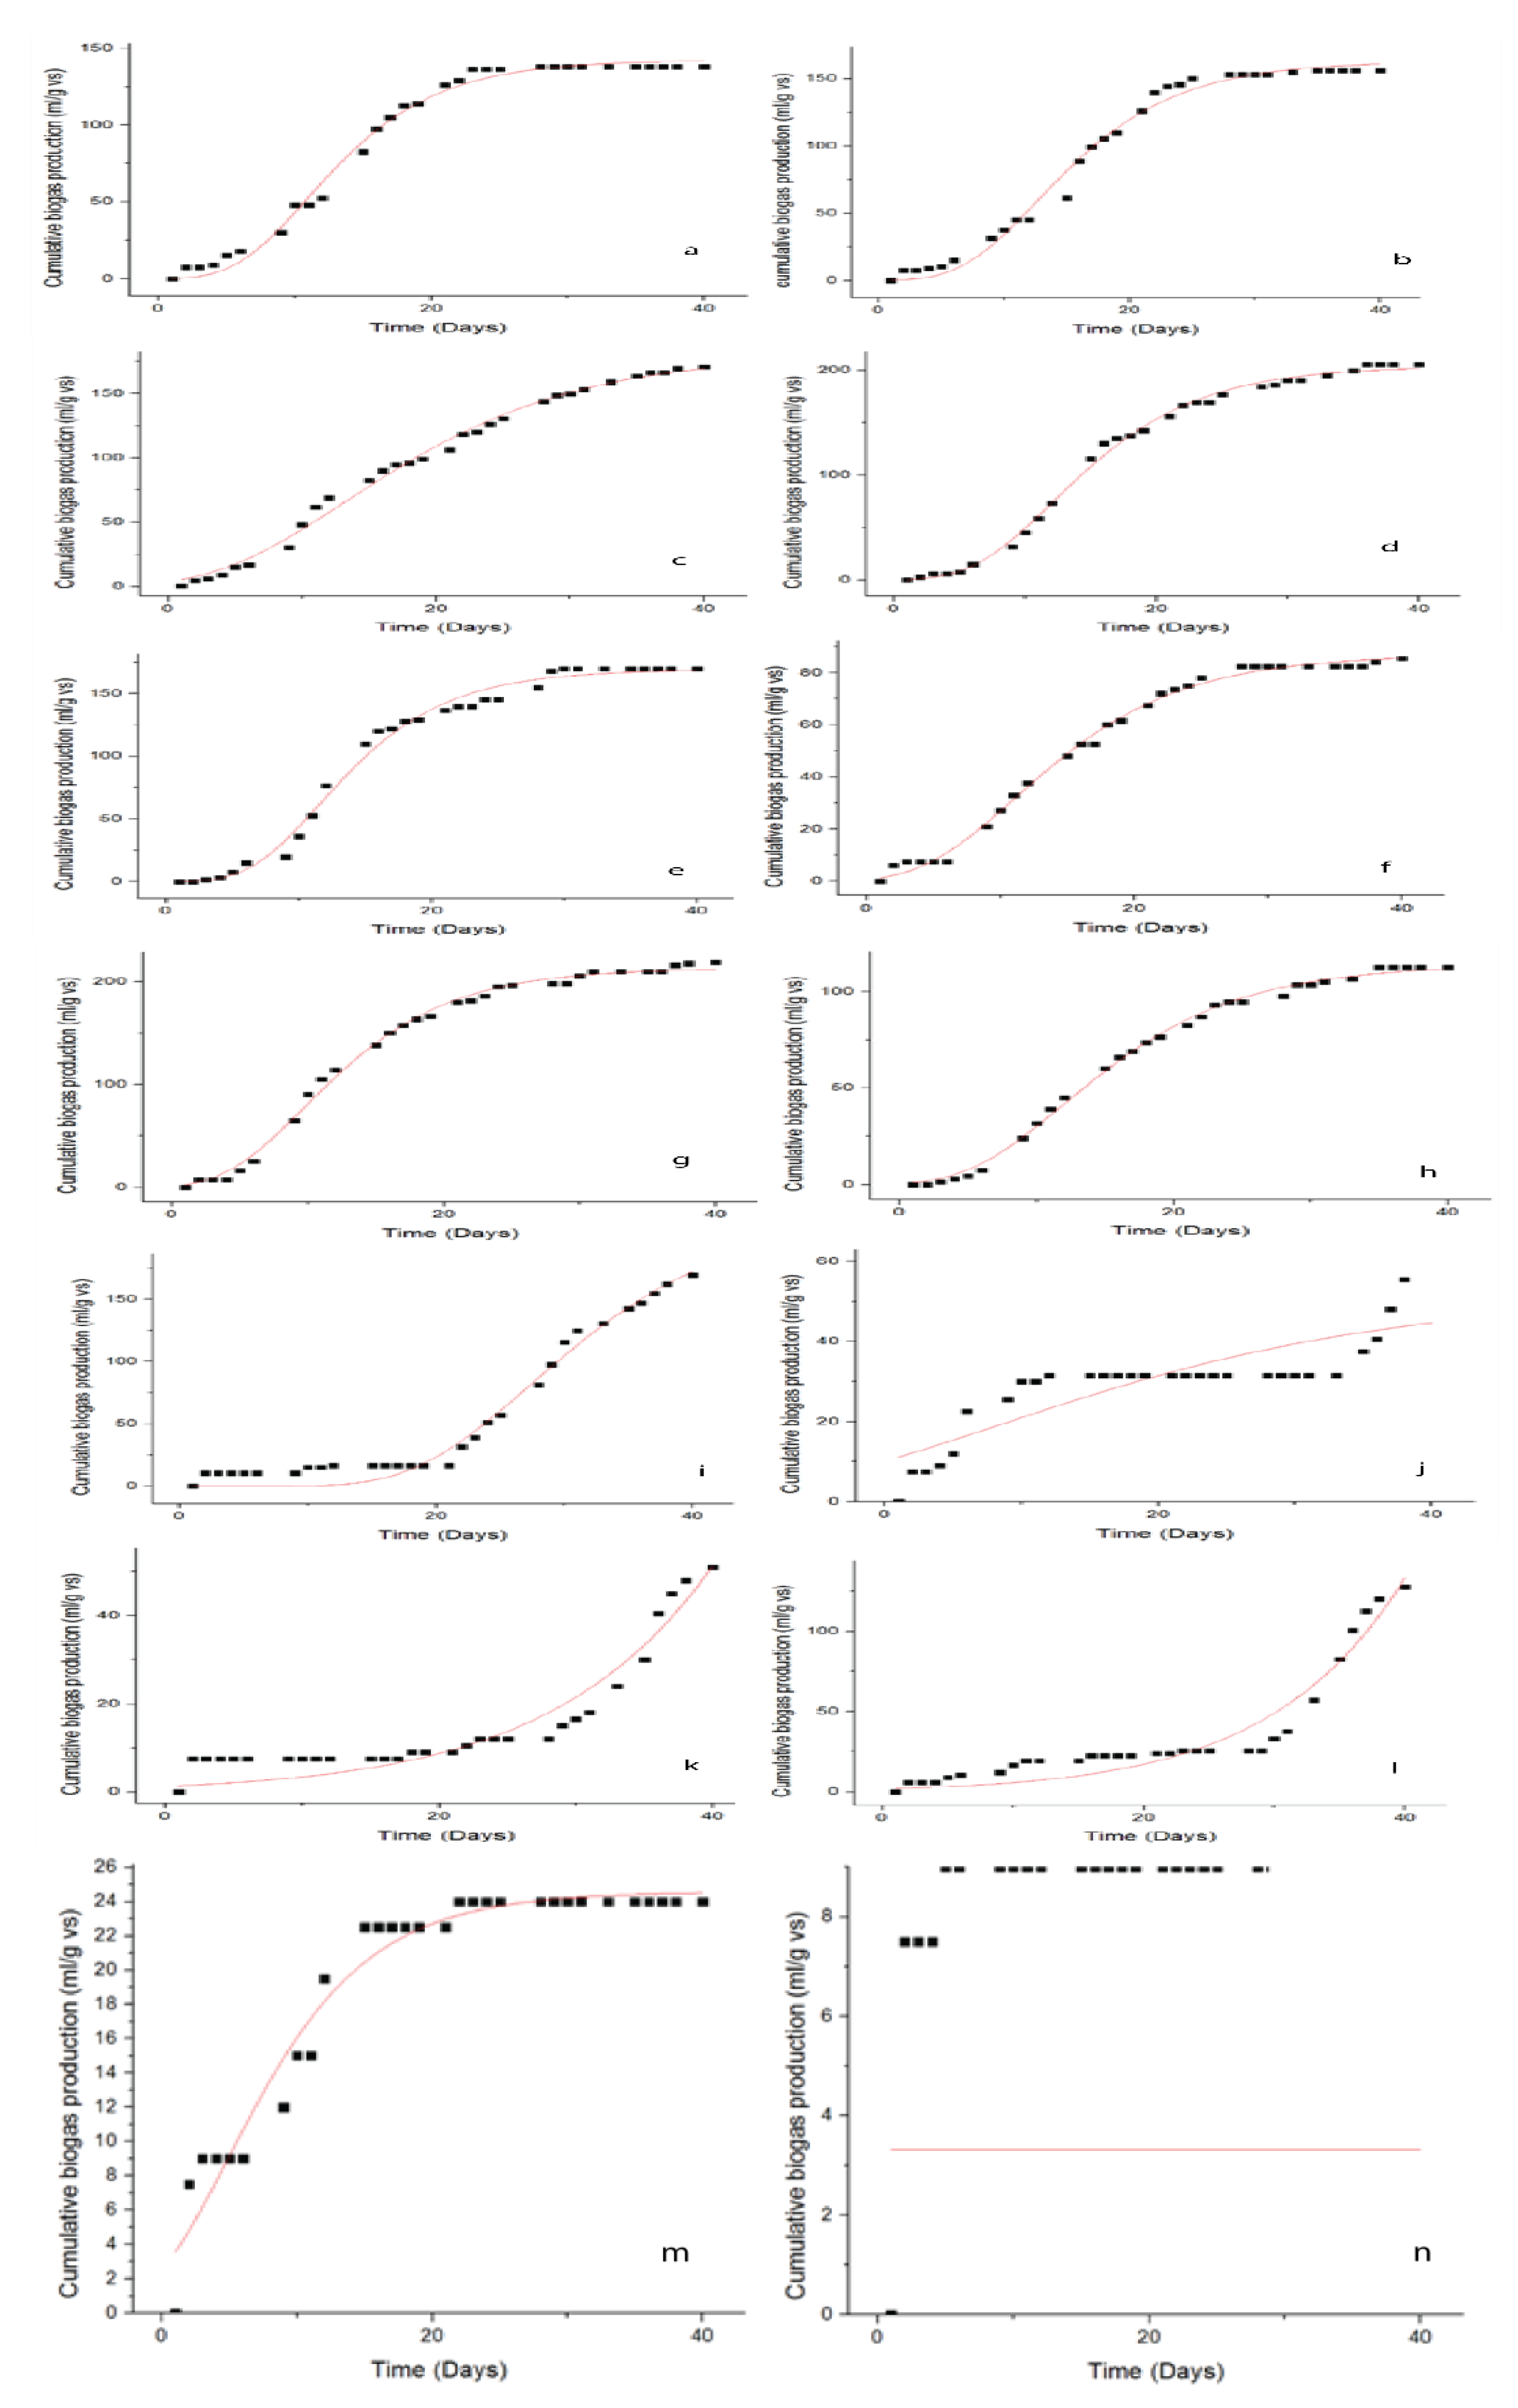
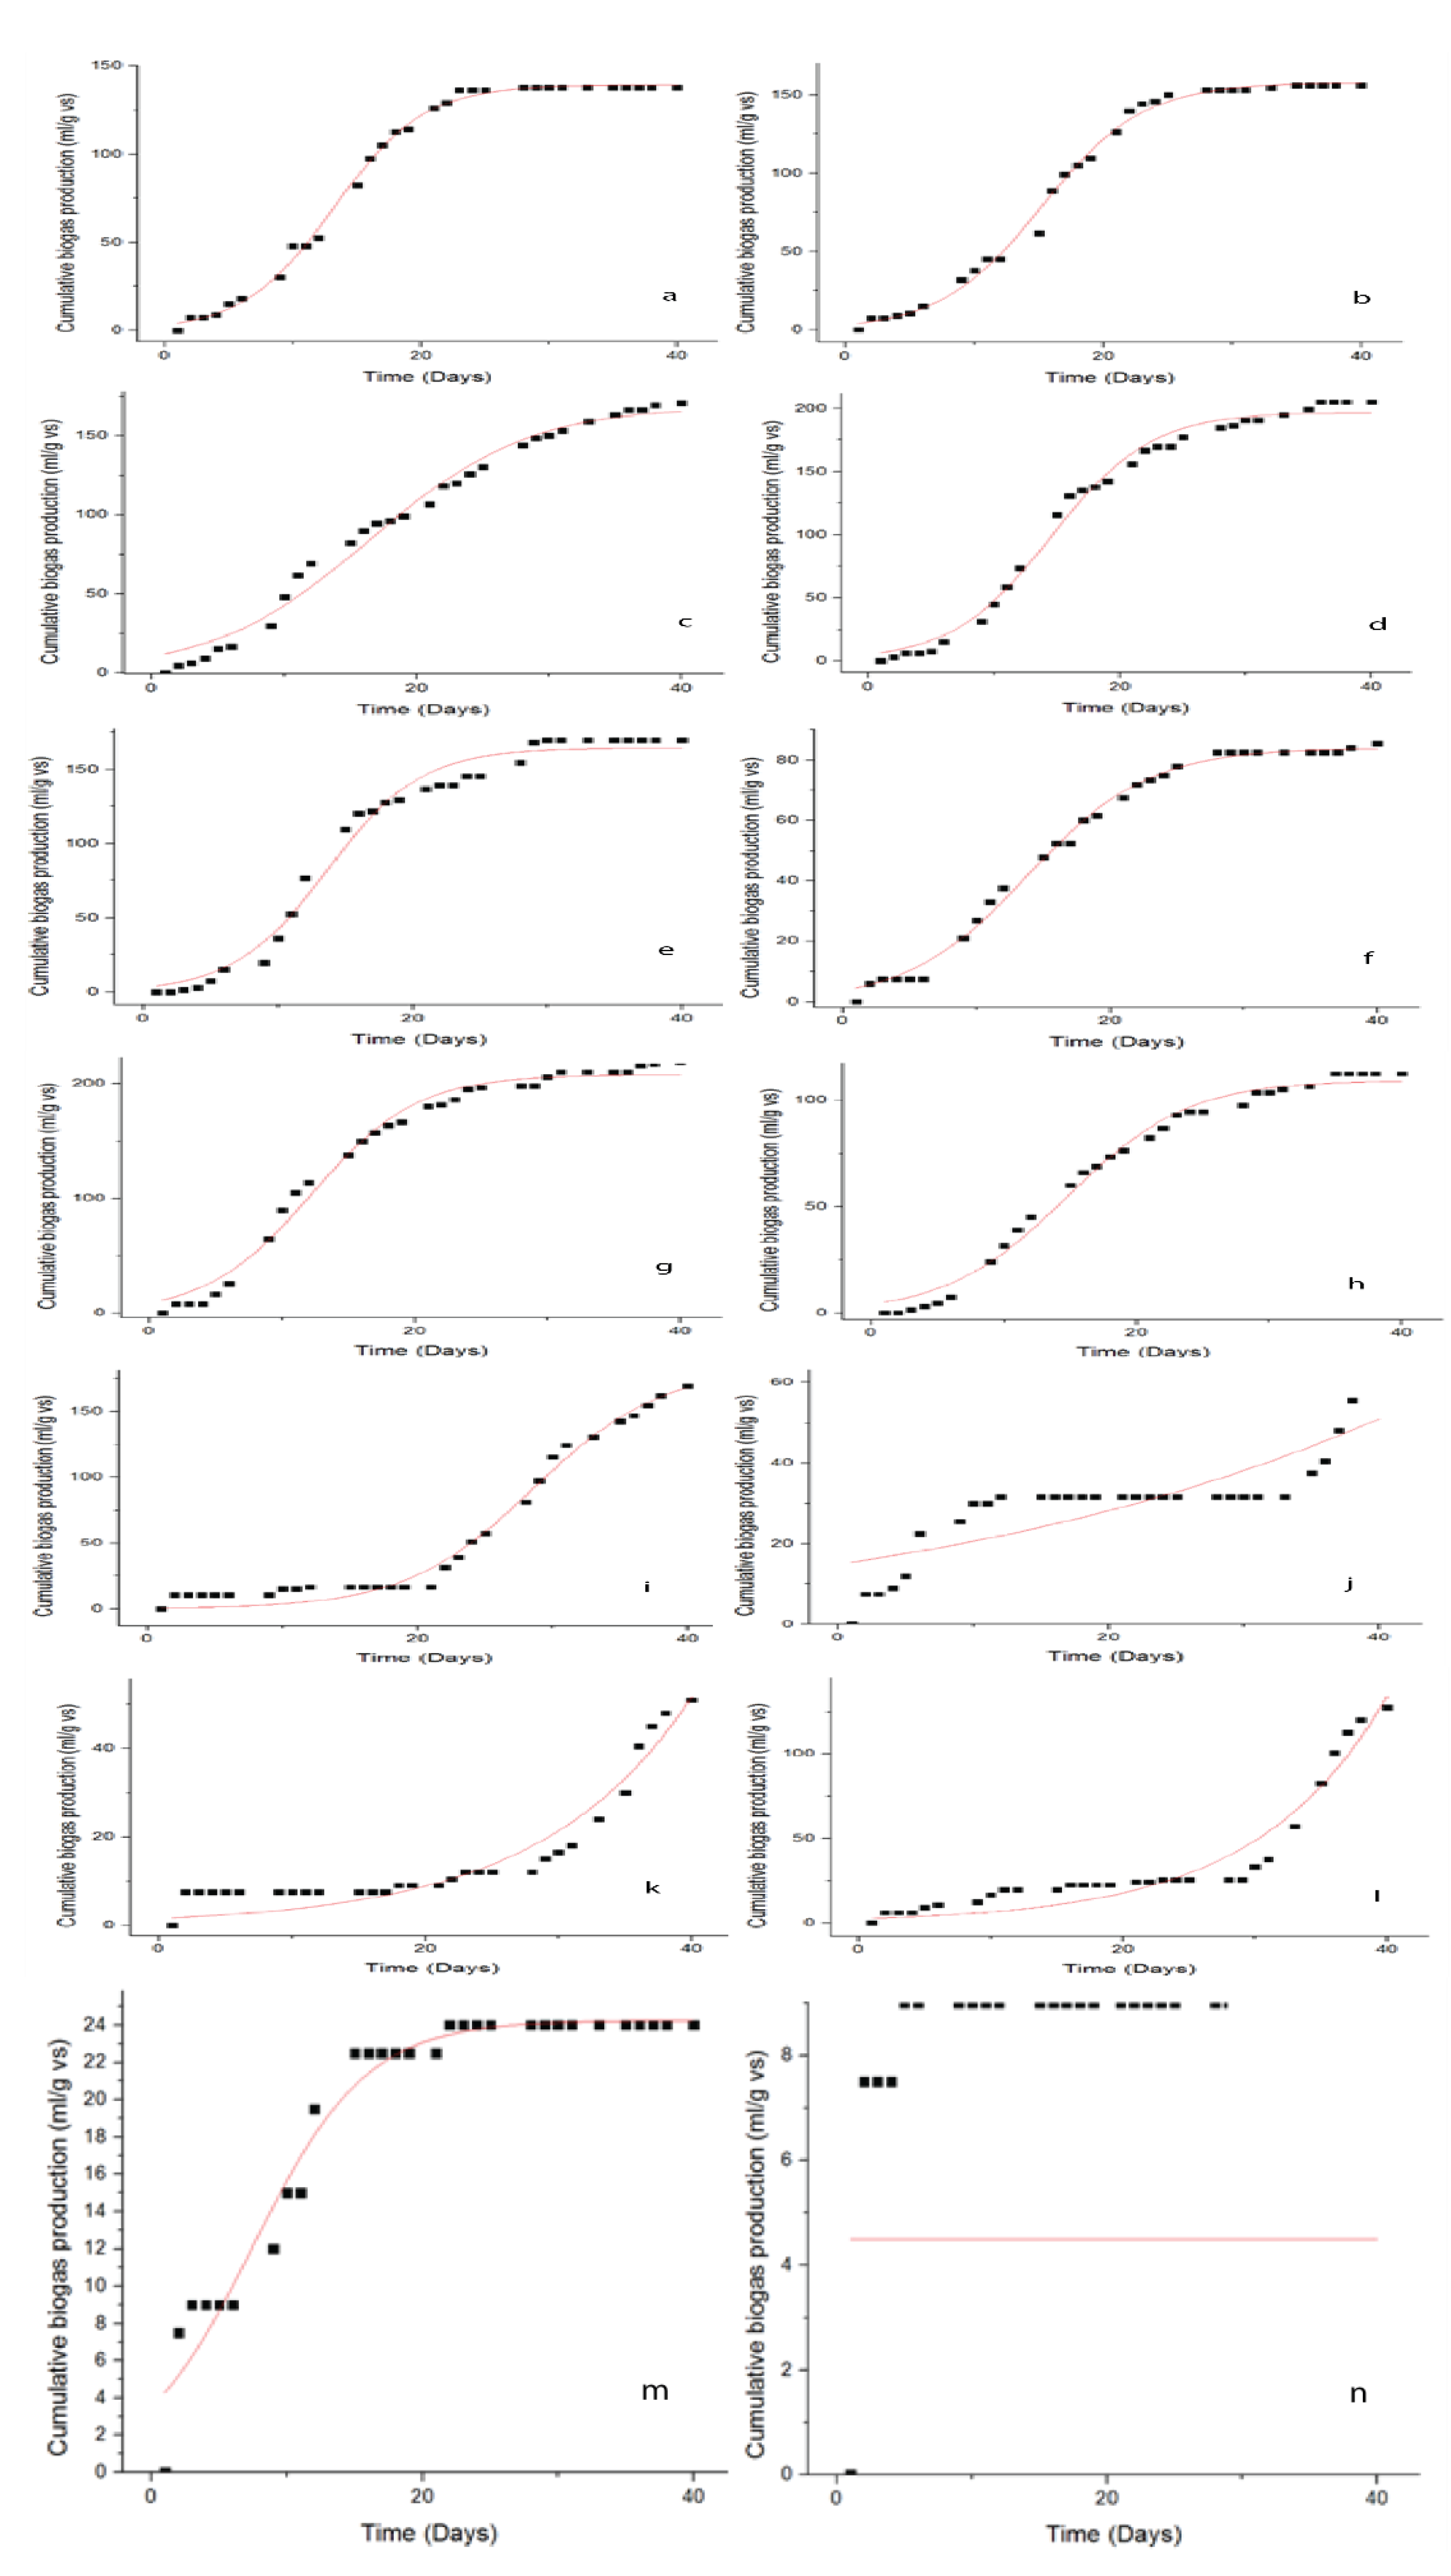
For 40 days, the experimental results of biogas output yields were collected and are shown in Figure 9. When the treated P. capillacea was treated with an SD dose (100, 50 mg/L), the average biogas production yield was marginally increased compared to the biogas production yield without biochar treatment, as shown in Figure 9.
A major positive effect on the production of biogas (p < 0.05) was achieved when P. capillacea was treated with 100 mg SD combined with 10 mg α-Fe2O3. The dosage of 100 mg SD combined with 10 mg α-Fe2O3 produces higher biogas yield with 219 mL/g VS for P. capillacea combined with manure. It is also worth mentioning that when P. capillacea was treated with unmodified SD with different dosages of 50, 100, and 150 mg/L, the biogas was increased more than the control sample, which produces a higher biogas yield with 171, 205, and 169.5 mL/g VS, respectively. It is also clear that modified SD-NH2 with all higher dosages, except 100 and 150 mg/L, has inhibitory effects on the biogas production.
Biogas output tests have been completed when, as seen in Figure 10, the regular production of biogas is <1% of the total production of most of the tests conducted. It is clear that the biogas output of P. capillacea treated with 50 mg/L of SD-NH2 is around 169.5 mL/g VS, which is equal to the biogas yield formed by 100 mg/L dosage of unmodified biochar and is higher than the biogas produced from the untreated algae (control), which yields 138 mL/g VS. This may indicate that the little dosages of SD-NH2 may have no detrimental effect on methane yield of biogas production and the addition effect of biochar in biogas is dosage dependent.
Due to the possibility of ammonia accumulation during anaerobic digestion of food waste, its use in industrial biogas facilities is restricted. Sheng et al. [56] investigated the effect of ammonia and nitrate on biogas production from food waste via anaerobic digestion. They discovered that lower ammonia concentrations (1.544 g L−1) had no detrimental effect on methane yield, whereas higher TAN concentrations (>3.78 g L−1) resulted in severe inhibition of methanogenesis. These findings corroborate our findings that greater doses of SD-NH2 restrict the formation of biogas from P. capillacea. This inhibitory effect became worse and gave more inhibitory effect when the P. capillacea was treated with SD-NH2 with a combination with α-Fe2O3 with a dosage of 10 mg/L and the biogas yield was 127, 24, and 9 mL/g VS. The reason for this inhibitory effect may be explained by the releasing of more nitrogen which will be converted into ammonia in the digester according to the following equation:
Fe2O3 (s) + 2 NH3 (aq) → 2 Fe (s) + N2 (g) + 3 H2O
The release of N2 can alter the C/N ratio, and changes in the C/N ratio can change the pH of a slurry [57]. Increased carbon content results in increased carbon dioxide creation and a lower pH value. In contrast, increased nitrogen content results in increased ammonia gas production, which may raise the pH to the detriment of microorganisms [57].
The addition of 10 mg/L α-Fe2O3 resulted in a 12% increase in biogas production over control (138 mL/g VS), which is consistent with the results obtained by Abdelwahab et al. [58], who stated that the addition of 15, 30, and 60 mg/L Fe NPs increases specific biogas production startup by 124.7, 85.1, and 40.3%, respectively. The addition of SD in combination with 10 mg/L α-Fe2O3 increased biogas generation by 40% compared to the control and by 29% compared to the individual SD treatment. These findings are consistent with those of Abdelsalam et al. [59], who discovered that adding 5, 10, and 15 mg/L Fe NPs (20 nm) increases biogas production startup by 250.7, 270.3, and 264.5%, respectively, as compared to using only cattle dung. This discrepancy in results, however, could be explained by the size and concentration of Fe NPs. The size, concentration, and type of NPs have a significant effect in biogas production [38,59]. In our study, the TEM analysis showed α-Fe2O3 NPs in the range of 5–16 nm, which is near the range studied by Abdelsalam [59] (20 nm), which may confirm that the small size of α-Fe2O3 NPs may have a good impact on methanogenesis bacteria. Cumulative specific biogas production results demonstrated a substantial increase (p < 0.05) in cumulative biogas production when α-Fe2O3 NPs and unmodified SD were added to control manure alone, as seen in Figure 9. In this study, the highest biogas yield of 219 mL/g VS was still lower than the results obtained by Hassaan et al. [12], who studied ozonation pretreatment’s effect on the biogas production from Ulva lactuca with biogas yield around 499 mL/g VS with higher ozonation time (30 min), but it is still higher than the biogas yield attained by Hassaan et al. [12] when using ozonation time (10 min).
This work can be a good addition to support the circularity of resources due to it having a significant effect on the circular bioeconomy by using red algae P. capillacea as a source of biomass and also to synthesize green α-F2O3. Another way of using biomass to enhance the bioeconomy is by using the SD waste to synthesize biochar and that will lead to reducing pressure on the environment, and to the creating of new green industries and jobs and boosting economic growth.

3.5. Kinetic Study

The data of the gas production kinetic study have been summarized in Table 5 and Table 6. It is reported that the Gompertz and logistic feature models matched well the experimental findings, except for 150 SD-NH2 individually or in combination with α-Fe2O3 with a dosage of 10 mg/L. For the logistic feature model and the modified Gompertz model, Rm of 14.53 and 12.16 mL/g VS, respectively, of biogas production when algae was treated with unmodified SD were observed [42,60]. The modified Gompertz and logistic models’ functional received λ values of 0.1 and 0.29 days, respectively. Our work’s value is extremely low compared to previously published values [38,61], for both modified Gompertz and logistic function models. The model’s reliability was tested by plotting the calculated values for biogas production against the observed values (Figure 11 and Figure 12). Table 5 and Table 6 additionally include statistical indicators (R2) to help visualize the kinetics study. According to Nguyen et al. [42], the higher R2 values (0.999 and 0.994) for modified Gompertz and logistic feature models, respectively, indicated a more appropriate kinetic model. Both models in our analysis have a superior R2 of 0.997, which is near the same values attained by [12,38].

4. Conclusions

This study is the first work that studies the impact of nanoparticles with biochar on biogas production from seaweeds. The biomass of the red algae P. capillacea was pretreated with two different types of biochar either individually or combined with α-Fe2O3 for enhancing biogas production in this work. As a result, the unmodified biochar SD with all different dosages increased the biogas ability of the studied red algae P. capillacea compared to untreated P. capillacea. On the other hand, the modified biochar SD-NH2 has an inhibitory effect on biogas production for higher dosages (100 and 150 mg/L). TEM, Raman, FTIR, PSA, and XRD confirmed the synthesis of α-Fe2O3 NPs. When P. capillacea pretreated with α-Fe2O3 alone and combined with 100 mg/L SD, the biogas increased by 12 and 40%, respectively. The updated Gompertz model and the logistic function model (R2 = 0.997) were appropriate models to match the calculated biogas production and could be used more reasonably to characterize the kinetics of the AD phase. Moreover, from our results and literature, the type of biochar, trace elements concentration in biochar, and the modification method play a key role in determining the effectiveness of the biochar in enhancing biogas production. The compatibility of the P. capillacea bioprocess, the emission of biogas, techno-economic analysis, and compositional analysis of the used seaweeds should also be studied in a future study. On the basis of our data, the bio-energy is one of the major renewable energy types that demands substantial financial investment. In order to meet the challenge, the Egyptian government should make a significant contribution to the construction of more biogas and biomethane production plants in the coming years.

Author Contributions

M.A.H. conceived the research, carried out the experimental and theoretical work, and drafted the report. A.E.N. conceived the research, supervised and assisted with the study, as well as writing the manuscript. The unmodified and modified biochars were prepared by Eng. M.A.E.-N., M.R.E. assisted with the manuscript’s writing and performed some analysis. S.R. assisted with writing and work discussion. A.P. was in charge of supervising research and assisting with theoretical work and publication. All authors have read and agreed to the published version of the manuscript.

Funding

This research received no external funding.

Conflicts of Interest

The authors declare no conflict of interest.

Abbreviations

ADAnaerobic digestion
NPsNanoparticles
Fe2O3 NPsHematite nanoparticles
SDSawdust
SD+NH2Modified sawdust with NH4OH
FTIRFourier transform infrared
XRDX-ray diffractograms
TEMTransmission electron microscopy
EDXEnergy dispersive X-ray spectroscopy
BETBrunauer–Emmett–Teller
TGAThermo gravimetric analysis
TSTotal solids
RmThe maximum biogas production rate
VSVolatile solids
λ The lag phase time (days)

References

  1. Baena-Moreno, F.M.; Malico, I.; Marques, I.P. Promoting Sustainability: Wastewater Treatment Plants as a Source of Biomethane in Regions Far from a High-Pressure Grid. A Real Portuguese Case Study. Sustainability 2021, 13, 8933. [Google Scholar] [CrossRef]
  2. D’Adamo, I.; Falcone, P.M.; Huisingh, D.; Morone, P. A circular economy model based on biomethane: What are the opportunities for the municipality of Rome and beyond? Renew. Energy 2021, 163, 1660–1672. [Google Scholar] [CrossRef]
  3. D’Adamo, I.; Falcone, P.M.; Morone, P. A new socio-economic indicator to measure the performance of bioeconomy sectors in Europe. Ecol. Econ. 2020, 176, 106724. [Google Scholar] [CrossRef]
  4. Pedišius, N.; Praspaliauskas, M.; Pedišius, J.; Dzenajavičienė, E.F. Analysis of Wood Chip Characteristics for Energy Production in Lithuania. Energies 2021, 14, 3931. [Google Scholar] [CrossRef]
  5. Romero-Güiza, M.; Vila, J.; Mata-Alvarez, J.; Chimenos, J.; Astals, S. The role of additives on anaerobic digestion: A review. Renew. Sustain. Energy Rev. 2016, 58, 1486–1499. [Google Scholar] [CrossRef]
  6. Wambugu, C.W.; Rene, E.R.; van de Vossenberg, J.; Dupont, C.; van Hullebusch, E.D. Role of biochar in anaerobic digestion based biorefinery for food waste. Front. Energy Res. 2019, 7, 14. [Google Scholar] [CrossRef] [Green Version]
  7. El Nemr, A.; El Sikaily, A.; Khaled, A.; Abdelwahab, O. Removal of toxic chromium from aqueous solution, wastewater and saline water by marine red alga Pterocladia capillacea and its activated carbon. Arab. J. Chem. 2015, 8, 105–117. [Google Scholar] [CrossRef] [Green Version]
  8. Hassaan, M.A.; Hosny, S.; ElKatory, M.R.; Ali, R.M.; Rangreez, T.A.; El Nemr, A. Dual action of both green and chemically synthesized zinc oxide nanoparticles: Antibacterial activity and removal of Congo red dye. Desalin. Water Treat. 2021, 218, 423–435. [Google Scholar] [CrossRef]
  9. Ali, R.M.; Hassaan, M.A.; Elkatory, M.R. Towards Potential Removal of Malachite Green from Wastewater: Adsorption Process Optimization and Prediction. In Materials Science Forum; Trans. Tech. Publications Ltd.: Stafa-Zurich, Switzerland, 2020; Volume 1008, pp. 213–221. [Google Scholar]
  10. Zhang, L.; Zhang, J.; Loh, K.-C. Activated carbon enhanced anaerobic digestion of food waste-Laboratory-scale and Pilot-scale operation. Waste Manag. 2018, 75, 270–279. [Google Scholar] [CrossRef]
  11. Maneerung, T.; Liew, J.; Dai, Y.; Kawi, S.; Chong, C.; Wang, C.-H. Activated carbon derived from carbon residue from biomass gasification and its application for dye adsorption: Kinetics, isotherms and thermodynamic studies. Bioresour. Technol. 2016, 200, 350–359. [Google Scholar] [CrossRef]
  12. Hassaan, M.A.; El Nemr, A.; Elkatory, M.R.; Eleryan, A.; Ragab, S.; El Sikaily, A.; Pantaleo, A. Enhancement of Biogas Production from Macroalgae Ulva latuca via Ozonation Pretreatment. Energies 2021, 14, 1703. [Google Scholar] [CrossRef]
  13. Skouteris, G.; Saroj, D.; Melidis, P.; Hai, F.I.; Ouki, S. The effect of activated carbon addition on membrane bioreactor processes for wastewater treatment and reclamation—A critical review. Bioresour. Technol. 2015, 185, 399–410. [Google Scholar] [CrossRef] [Green Version]
  14. Aguilera, P.; Ortiz, F.G. Techno-economic assessment of biogas plant upgrading by adsorption of hydrogen sulfide on treated sewage–sludge. Energy Convers. Manag. 2016, 126, 411–420. [Google Scholar] [CrossRef]
  15. Cha, J.S.; Park, S.H.; Jung, S.-C.; Ryu, C.; Jeon, J.-K.; Shin, M.-C. Production and utilization of biochar: A review. J. Ind. Eng. Chem. 2016, 40, 1–15. [Google Scholar] [CrossRef]
  16. Man, Y.; Wang, B.; Wang, J.; Slaný, M.; Yan, H.; Li, P.; El-Naggar, A.; Shaheen, S.M.; Rinklebe, J.; Feng, X. Use of biochar to reduce mercury accumulation in Oryza sativa L: A trial for sustainable management of historically polluted farmlands. Environ. Int. 2021, 153, 106527. [Google Scholar] [CrossRef]
  17. Meyer-Kohlstock, D.; Haupt, T.; Heldt, E.; Heldt, N.; Kraft, E. Biochar as additive in biogas-production from bio-waste. Energies 2016, 9, 247. [Google Scholar] [CrossRef]
  18. Sunyoto, N.M.S.; Zhu, M.; Zhang, Z.; Zhang, D. Effect of biochar addition on hydrogen and methane production in two-phase anaerobic digestion of aqueous carbohydrates food waste. Bioresour. Technol. 2016, 219, 29–36. [Google Scholar] [CrossRef]
  19. Wang, D.; Ai, J.; Shen, F.; Yang, G.; Zhang, Y.; Deng, S.; Zhang, J.; Zeng, Y.; Song, C. Improving anaerobic digestion of easy-acidification substrates by promoting buffering capacity using biochar derived from vermicompost. Bioresour. Technol. 2017, 227, 286–296. [Google Scholar] [CrossRef]
  20. Lü, F.; Luo, C.; Shao, L.; He, P. Biochar alleviates combined stress of ammonium and acids by firstly enriching Methanosaeta and then Methanosarcina. Water Res. 2016, 90, 34–43. [Google Scholar] [CrossRef]
  21. Karri, S.; Sierra-Alvarez, R.; Field, J.A. Zero valent iron as an electron-donor for methanogenesis and sulfate reduction in anaerobic sludge. Biotechnol. Bioeng. 2005, 92, 810–819. [Google Scholar] [CrossRef]
  22. Zhang, Y.B.; Jing, Y.W.; Quan, X.; Liu, Y.W.; Onu, P. A built-in zero valent iron anaerobic reactor to enhance treatment of azo dyewastewater. Water Sci. Technol. 2011, 63, 741–746. [Google Scholar] [CrossRef]
  23. Liu, Y.W.; Zhang, Y.B.; Quan, X.; Chen, S.; Zhao, H.M. Applying an electric field in a built-in zero valent iron-anaerobic reactor for enhancement of sludge granulation. Water Res. 2011, 45, 1258–1266. [Google Scholar] [CrossRef] [PubMed]
  24. Zhang, Y.B.; Jing, Y.W.; Zhang, J.X.; Sun, L.F.; Quan, X. Performance of a ZVIUASB reactor for azo dye wastewater treatment. J. Chem. Technol. Biotechnol. 2011, 86, 199–204. [Google Scholar] [CrossRef]
  25. Zhang, J.; Zhang, Y.; Quan, X.; Liu, Y.; An, X.; Chen, S.; Zhao, H. Bioaugmentation and functional partitioning in a zero valent ironanaerobic reactor for sulfate-containing wastewater treatment. Chem. Eng. J. 2011, 174, 159–165. [Google Scholar] [CrossRef]
  26. Farghali, M.; Andriamanohiarisoamanana, F.J.; Ahmed, M.M.; Kotb, S.; Yamashiro, T.; Iwasaki, M.; Umetsu, K. Impacts of iron oxide and titanium dioxide nanoparticles on biogas production: Hydrogen sulfide mitigation, process stability, and prospective challenges. J. Environ. Manag. 2019, 240, 160–167. [Google Scholar] [CrossRef]
  27. Hassanein, A.; Lansing, S.; Tikekar, R. Impact of metal nanoparticles on biogas production from poultry litter. Bioresour. Technol. 2019, 275, 200–206. [Google Scholar] [CrossRef]
  28. Yu, B.; Huang, X.; Zhang, D.; Lou, Z.; Yuan, H.; Zhu, N. Response of sludge fermentation liquid and microbial community to nano zero-valent iron exposure in a mesophilic anaerobic digestion system. RSC Adv. 2016, 6, 24236–24244. [Google Scholar] [CrossRef]
  29. Su, L.; Shi, X.; Guo, G.; Zhao, A.; Zhao, Y. Stabilization of sewage sludge in the presence of nanoscale zero-valent iron (nZVI): Abatement of odor and improvement of biogas production. J. Mater. Cycles Waste Manag. 2013, 15, 461–468. [Google Scholar] [CrossRef]
  30. Deng, Y.; Li, X.; Ni, F.; Liu, Q.; Yang, Y.; Wang, M.; Ao, T.; Chen, W. Synthesis of Magnesium Modified Biochar for Removing Copper, Lead and Cadmium in Single and Binary Systems from Aqueous Solutions: Adsorption Mechanism. Water 2021, 13, 599. [Google Scholar] [CrossRef]
  31. Mandal, S.; Pu, S.; Shangguan, L.; Liu, S.; Ma, H.; Adhikari, S.; Hou, D. Synergistic construction of green tea biochar supported nZVI for immobilization of lead in soil: A mechanistic investigation. Environ. Int. 2020, 135, 105374. [Google Scholar] [CrossRef]
  32. Saitİzgi, M.; Saka, C.; Baytar, O.; Saraçoğlu, G.; Şahin, Ö. Preparation and characterization of activated carbon from microwave and conventional heated almond shells using phosphoric acid activation. Anal. Lett. 2018, 52, 772–789. [Google Scholar] [CrossRef]
  33. Guo, J.; Song, Y.; Ji, X.; Ji, L.; Cai, L.; Wang, Y.; Zhang, H.; Song, W. Preparation and characterization of nanoporous activated carbon derived from prawn shell and its application for removal of heavy metal ions. Materials 2019, 12, 241. [Google Scholar] [CrossRef] [PubMed] [Green Version]
  34. El-Nemr, M.A.; Abdelmonem, N.M.; Ismail, I.M.A.; Ragab, S.; El Nemr, A. The efficient removal of the hazardous Azo Dye Acid Orange 7 from water using modified biochar from Pea peels. Desalin. Water Treat. 2020, 203, 327–355. [Google Scholar] [CrossRef]
  35. El-Nemr, M.A.; Abdelmonem, N.M.; Ismail, I.M.A.; Ragab, S.; El Nemr, A. Removal of Acid Yellow 11 Dye using novel modified biochar derived from Watermelon Peels. Desalin. Water Treat. 2020, 203, 403–431. [Google Scholar] [CrossRef]
  36. Hassaan, M.A.; Pantaleo, A.; Tedone, L.; Elkatory, M.R.; Ali, R.M.; El Nemr, A.; Mastro, G.D. Enhancement of biogas produc-tion via green ZnO nanoparticles: Experimental results of selected herbaceous crops. Chem. Eng. Commun. 2019, 208, 1–14. [Google Scholar]
  37. Amirante, R.; Demastro, G.; Distaso, E.; Hassaan, M.A.; Mormando, A.; Pantaleo, A.M.; Tamburrano, P.; Tedone, L.; Clodo-veo, M.L. Effects of ultrasound and green synthesis ZnO nanoparticles on biogas production from Olive Pomace. Energy Procedia 2018, 148, 940–947. [Google Scholar]
  38. Hassaan, M.A.; Pantaleo, A.; Santoro, F.; Elkatory, M.R.; De Mastro, G.; El Sikaily, A.; Ragab, S.; El Nemr, A. Techno-Economic Analysis of ZnO Nanoparticles Pretreatments for Biogas Production from Barley Straw. Energies 2020, 13, 5001. [Google Scholar] [CrossRef]
  39. Remigi, E.U.; Buckley, C.A. Co-Digestion of High Strength/Toxic Organic Effluents in Anaerobic Digesters at Wastewater Treatment Works; Water Research Commission: Pretoria, South Africa, 2016. [Google Scholar]
  40. Salah, H.; Elkatory, M.R.; Fattah, M.A. Novel zinc-polymer complex with antioxidant activity for industrial lubricating oil. Fuel 2021, 305, 121536. [Google Scholar] [CrossRef]
  41. Ahmmad, B.; Leonard, K.; Islam, M.S.; Kurawaki, J.; Muruganandham, M.; Ohkubo, T.; Kuroda, Y. Green synthesis of mesoporous hematite (α-Fe2O3) nanoparticles and their photocatalytic activity. Adv. Powder Technol. 2013, 24, 160–167. [Google Scholar] [CrossRef]
  42. Nguyen, D.D.; Jeon, B.-H.; Jeung, J.H.; Rene, E.R.; Banu, J.R.; Ravindran, B.; Vu, C.M.; Ngo, H.H.; Guo, W.; Chang, S.W. Thermophilic anaerobic digestion of model organic wastes: Evaluation of biomethane production and multiple kinetic models analysis. Bioresour. Technol. 2019, 280, 269–276. [Google Scholar] [CrossRef]
  43. Kafle, G.K.; Chen, L. Comparison on Batch Anaerobic Digestion of Five Different Livestock Manures and Prediction of Bio-chemical Methane Potential (BMP) Using Different Statistical Models. Waste Manag. 2016, 48, 492–502. [Google Scholar] [CrossRef] [Green Version]
  44. Donoso-Bravo, A.; Pérez-Elvira, S.; Fdz-Polanco, F. Application of simplified models for anaerobic biodegradability tests. Evaluation of pre-treatment processes. Chem. Eng. J. 2010, 160, 607–614. [Google Scholar] [CrossRef]
  45. Pang, Y.Z.; Liu, Y.P.; Li, X.J.; Wang, K.S.; Yuan, H.R. Improving Biodegradability and Biogas Production of Corn Stover through Sodium Hydroxide Solid State Pretreatment. Energy Fuels 2008, 22, 2761–2766. [Google Scholar] [CrossRef]
  46. Lassoued, A.; Dkhil, B.; Gadri, A.; Ammar, S. Control of the shape and size of iron oxide (a-Fe2O3) nanoparticles synthesizedthrough the chemical precipitation method. Results Phys. 2017, 7, 3007–3015. [Google Scholar] [CrossRef]
  47. de Jesús Ruíz-Baltazar, Á.; Reyes-López, S.Y.; de Lourdes Mondragón-Sánchez, M.; Robles-Cortés, A.I.; Pérez, R. Eco-friendly synthesis of Fe3O4nanoparticles: Evaluation of their catalytic activity in methylene blue degradation by kinetic adsorption models. Results Phys. 2019, 12, 989–995. [Google Scholar] [CrossRef]
  48. Morel, M.; Martínez, F.; Mosquera, E. Synthesis and Characterization of magnetite nanoparticles from mineral magnetite. J. Magn. Magn. Mater. 2013, 343, 76–81. [Google Scholar] [CrossRef]
  49. Tadic, M.; Panjan, M.; Damnjanovic, V.; Milosevic, I. Magnetic properties of hematite (a-Fe2O3) nanoparticles prepared by hydrothermal synthesis method. Appl. Surf. Sci. 2014, 320, 183–187. [Google Scholar] [CrossRef]
  50. Soliman, E.A.; Elkatory, M.R.; Hashem, A.I.; Ibrahim, H.S. Synthesis and performance of maleic anhydride copolymers with alkyl linoleate or tetra-esters as pour point depressants for waxy crude oil. Fuel 2018, 211, 535–547. [Google Scholar] [CrossRef]
  51. Ali, R.M.; Elkatory, M.R.; Hamad, H.A. Highly active and stable magnetically recyclable CuFe2O4 as a heterogenous catalyst for efficient conversion of waste frying oil to biodiesel. Fuel 2020, 268, 117297. [Google Scholar] [CrossRef]
  52. Ramesh, R.; Ashok, K.; Bhalero, G.M.; Ponnusamy, S.; Muthamizhchelvan, C. Synthesis and properties of a-Fe2O3 nanorods. Cryst. Res. Technol. 2010, 45, 965–968. [Google Scholar] [CrossRef]
  53. Chamritski, I.; Burns, G. Infrared-and Raman-active phonons of magnetite, maghemite, and hematite: A computer simulation and spectroscopic study. J. Phys. Chem. B 2005, 109, 4965–4968. [Google Scholar] [CrossRef]
  54. Jiang, X.C.; Yu, A.B.; Yang, W.R.; Ding, Y.; Xu, C.X.; Lam, S. Synthesis and growth of hematite nanodiscs through a facile hydrothermal approach. J. Nanopart. Res. 2010, 12, 877–893. [Google Scholar] [CrossRef]
  55. Slaný, M.; Jankovič, Ľ.; Madejová, J. Structural characterization of organo-montmorillonites prepared from a series of primary alkylamines salts: Mid-IR and near-IR study. Appl. Clay Sci. 2019, 176, 11–20. [Google Scholar] [CrossRef]
  56. Sheng, K.; Chen, X.; Pan, J.; Kloss, R.; Wei, Y.; Ying, Y. Effect of ammonia and nitrate on biogas production from food waste via anaerobic digestion. Biosyst. Eng. 2013, 116, 205–212. [Google Scholar] [CrossRef]
  57. Dioha, I.J.; Ikeme, C.H.; Nafi’u, T.; Soba, N.I.; Yusuf, M.B.S. Effect of carbon to nitrogen ratio on biogas production. Int. Res. J. Nat. Sci. 2013, 1, 1–10. [Google Scholar]
  58. Abdelwahab, T.A.M.; Mohanty, M.K.; Sahoo, P.K.; Behera, D. Impact of iron nanoparticles on biogas production and effluent chemical composition from anaerobic digestion of cattle manure. Biomass Convers. Biorefin. 2020, 1–13. [Google Scholar] [CrossRef]
  59. Abdelsalam, E.; Samer, M.; Attia, Y.A.; Abdel-Hadi, M.A.; Hassan, H.E.; Badr, Y. Influence of zero valent iron nanoparticles and magnetic iron oxide nanoparticles on biogas and methane production from anaerobic digestion of manure. Energy 2017, 120, 842–853. [Google Scholar] [CrossRef]
  60. Deepanraj, B.; Sivasubramanian, V.; Jayaraj, S. Experimental and Kinetic Study on Anaerobic Digestion of Food Waste: The Effect of Total Solids and PH. J. Renew. Sustain. Energy 2015, 7, 063104. [Google Scholar] [CrossRef]
  61. Mao, C.; Wang, X.; Xi, J.; Feng, Y.; Ren, G. Linkage of Kinetic Parameters with Process Parameters and Operational Conditions during Anaerobic Digestion. Energy 2017, 135, 352–360. [Google Scholar] [CrossRef]
Figure 1. FTIR spectrum of α-Fe2O3 NPs.
Sustainability 13 09275 g001
Figure 2. Raman spectrum of α-Fe2O3 NPs.
Sustainability 13 09275 g002
Figure 3. X-ray diffractograms of α-Fe2O3 NPs.
Sustainability 13 09275 g003
Figure 4. TEM of α-Fe2O3 NPs.
Sustainability 13 09275 g004
Figure 5. PSA of the α-Fe2O3 NPs.
Sustainability 13 09275 g005
Figure 6. FTIR analysis of SD and SD-NH2.
Sustainability 13 09275 g006
Figure 7. XRD analysis of SD and SD-NH2.
Sustainability 13 09275 g007
Figure 8. TGA analysis of (a) SD and (b) SD-NH2.
Sustainability 13 09275 g008
Figure 9. Average production of cumulative net biogas (mL/g VS) using (a) raw and untreated + raw pretreated with α-Fe2O3, (b) raw and raw pretreated with SD, (c) raw and raw pretreated with SD-NH2, (d) raw and combination of α-Fe2O3 NPs and SD, and (e) raw and combination of SD-NH2 with α-Fe2O3 NPs.
Sustainability 13 09275 g009aSustainability 13 09275 g009b
Figure 10. Average rate of the daily production of the biogas using (a) raw and untreated + raw pretreated with α-Fe2O3, (b) raw and raw pretreated with SD, (c) raw and raw pretreated with SD-NH2, (d) raw and combination of α-Fe2O3 NPs and SD, and (e) raw and combination of SD-NH2 with α-Fe2O3 NPs.
Sustainability 13 09275 g010aSustainability 13 09275 g010b
Figure 11. Cumulative biogas yield from Gompertz model, (a) untreated, untreated + α-Fe2O3 (10 mg/L) (b), 50, 100, 150 mg/L SD + untreated (ce), 50, 100, 150 mg/L SD + α-Fe2O3 (10 mg/L) + untreated (fh), 50, 100, 150 mg/L SD-NH2 + untreated (ik), 50, 100, 150 mg/L SD-NH2 + α-Fe2O3 (10 mg/L) + untreated (ln).
Sustainability 13 09275 g011
Figure 12. Cumulative biogas yield from logistic model, (a) untreated, untreated + α-Fe2O3 (10 mg/L) (b), 50, 100, 150 mg/L SD + untreated (ce), 50, 100, 150 mg/L SD + α-Fe2O3 (10 mg/L) + untreated (fh), 50, 100, 150 mg/L SD-NH2 + untreated (ik), 50, 100, 150 mg/L SD-NH2 + α-Fe2O3 (10 mg/L) + untreated (ln).
Sustainability 13 09275 g012
Table 1. Overview of substrates and pretreatment processes used to estimate of the biogas yield of P. capillacea in batch experiments.
ExperimentPretreatmentIncubation Temp. (°C)I/S Ratio
Batch 1Manure + algae untreated37 ± 120:1.5
Batch 2Manure + Algae (Fe 10 mg/L)37 ± 120:1.5
Batch 3Manure + Algae (SD 50 mg/L)37 ± 120:1.5
Batch 4Manure + Algae (SD 100 mg/L)37 ± 120:1.5
Batch 5Manure + Algae (SD 150 mg/L)37 ± 120:1.5
Batch 6Manure + Algae (SD 50 mg/L + Fe 10 mg/L)37 ± 120:1.5
Batch 7Manure + Algae (SD 100 mg/L + Fe 10 mg/L)37 ± 120:1.5
Batch 8Manure + Algae (SD 150 mg/L + Fe 10 mg/L)37 ± 120:1.5
Batch 9Manure + Algae (SD +NH2 50 mg/L)37 ± 120:1.5
Batch 10Manure + Algae (SD + NH2 100 mg/L)37 ± 120:1.5
Batch 11Manure + Algae (SD + NH2 150 mg/L)37 ± 120:1.5
Batch 12Manure + Algae (SD + NH2 50 mg/L + Fe 10 mg/L)37 ± 120:1.5
Batch 13Manure + Algae (SD + NH2 100 mg/L + Fe 10 mg/L)37 ± 120:1.5
Batch 14Manure + Algae (SD + NH2 150 mg/L + Fe 10 mg/L)37 ± 120:1.5
Table 2. The relative values of different substrates.
Proximate TestsP. capillaceaManure
DM%83.9780.67
Ash%16.0115.33
VS%83.9984.66
C%40.0248.95
N%6.794.16
C/N5.8911.76
Table 3. BET surface area and porosity of green α-Fe2O3 NPs.
SampleBET Surface Area (m2/g)Mean Pore Diameter (nm)Total Pore Volume (cm3/g)
Green α-Fe2O3 NPs29.2911.920.087
Table 4. BET surface area and porosity of biochar.
SampleBET Surface Area (m2/g)Mean Pore Diameter (nm)Total Pore Volume (cm3/g)
SD2.91316.8740.01220
SD-NH23.1908.3700.00668
Table 5. Data of kinetic analysis using the modified model of Gompertz.
SD
R2Predicted
P (ml/g VS)
Differences (%)Rmax
mL/g VS.day
λ (Day)
untreated0.991142.312.6910.940.19
50 SD0.993180.940.87913.320.10
100 SD0.996203.951.8612.160.16
150 SD0.989168.920.82211.600.19
Modified SD-NH2
untreated0.991142.312.6910.940.19
50 SD-NH20.975220.781.6227.340.11
100 SD-NH20.69152.1229.168.400.058
150 SD-NH2 *0.9151.410.8048910.0036
α-Fe2O3 (10 mg/L)
untreated0.991142.312.6910.940.19
Fe 10 mg/L0.989162.733.0612.760.16
CombinedSD-α-Fe2O3(10 mg/L)
untreated0.991142.312.6910.940.19
50 SD + 10 mg/L0.99586.910.02511.110.14
100 SD + 10 mg/L0.995213.073.329.810.17
150 SD + 10 mg/L0.997113.920.76312.060.14
Combined Modified SD-NH2—α-Fe2O3(10 mg/L)
untreated0.991142.312.6910.940.19
50 SD-NH2 + 10 mg/L *0.92133.314.557530.0044
100 SD-NH2 + 10 mg/L0.95524.502.054.920.17
150 SD-NH2 + 10 mg/L *−103.3638.850
* Fit Status = Failed.
Table 6. Data of kinetic analysis using the logistic model.
SD
R2Predicted
P (ml/g VS)
Differences (%)Rmax
mL/g VS.day
λ (Day)
untreated0.997139.501.0313.220.28
50 SD0.984169.023.0716.490.17
100 SD0.991196.994.3014.530.25
150 SD0.983164.343.1013.680.29
Modified SD-NH2
untreated0.997139.501.0313.220.28
50 SD-NH20.983183.280.7828.750.21
100 SD-NH20.677300.4619.0986.680.03
150 SD-NH2 *0.91651.971.55136.010.08
α-Fe2O3 (10 mg/L)
untreated0.997139.501.0313.220.28
Fe 10 mg/L0.995157.820.98315.260.25
CombinedSD-α-Fe2O3(10 mg/L)
untreated0.997139.501.0313.220.28
50 SD + 10 mg/L0.99584.002.0513.880.22
100 SD + 10 mg/L0.986207.575.3012.220.25
150 SD + 10 mg/L0.988109.363.1614.770.22
Combined Modified SD-NH2—α-Fe2O3(10 mg/L)
untreated0.997139.501.0313.220.28
50 SD-NH2 + 10 mg/L *0.925134.305.33121.290.10
100 SD-NH2 + 10 mg/L0.95924.251.007.480.24
150 SD-NH2 + 10 mg/L *−0.074.550-0
* Fit Status = Failed.
Publisher’s Note: MDPI stays neutral with regard to jurisdictional claims in published maps and institutional affiliations.

