1. Introduction
In 2011, the Food and Agriculture Organisation of the United Nations (FAO) released a report revealing that more than a third of the world’s food production intended for human consumption was wasted each year [
1]. As is the case with food security and climate change, such food waste represents a severe problem of sustainable development. From an ecological perspective, food loss results in wasted water, degrades soil, and inefficiently highly consumes several energy resources. Additionally, unnecessary greenhouse gas (GHG) emissions generated by the production, transportation, and landfilling of wasted food contribute to climate change. From an economic perspective, an FAO report estimates the production costs of wasted consumables at USD 750 billion annually [
1]. Finally, from a social point of view, food waste contributes to the problems of famine and food insecurity, which affect between 720 and 811 million people worldwide in 2020, with an increase of 118 million people, compared to 2019 [
1,
2]. Reducing food waste makes it possible to alleviate the ecological, social, and economic consequences of the problem and is an essential lever to cope with the demographic increase and its growing needs for food in the coming years.
Despite its obvious consequences, the phenomenon of food waste has received little attention. In Europe, even if the detailed portrait of food waste is incomplete, the subject increasingly worries national and international authorities. The European Parliament declared the year 2014 as the European Year for Combating Food Waste. In the United States, over 30% of all available food is wasted every year, which has led the US department of agriculture to find solutions to food loss and waste in the country through its policies. In Saudi Arabia, however, the situation is still unclear as there is little reliable and precise statistical data on food waste. The present paper, therefore, seeks to intensively examine this issue in Saudi Arabia and propose a number of helpful recommendations to solve it. In addition, this study represents the effort conducted for a national study project that aims to establish the food loss and waste (FLW) index in Saudi Arabia at a time when the Saudi Arabia 2030 Vision seeks to reach an ambitious homeland that preserves its vital resources. The vision document states: ‘... we will collaborate with consumers, food manufacturers and traders to reduce the quantities of waste.’). Additionally, Saudi Arabia is committed to achieving the SDG 12.3 target, which aims to reduce the rates of food loss and waste by 50% in 2030. The Saudi Grains Organisation (SAGO) has sponsored the National Program to Reduce Food Loss and Waste in Saudi Arabia as part of the National Transformational Program (NTP).
The National Project aims to reduce the rates of food loss and waste by 50% in 2030. However, the first phase of the project is a national study designed to establish the FLW Baseline to create the strategic roadmap to achieve the 50% reduction. Its aims are to estimate the volume of FLW according to international standards, to compare FLW Index with other regional and international countries, to measure economic losses, analyse economic, social, and cultural causes of FLW, and to recommend some efficient and helpful policies and initiatives achieve the ambitious target.
To achieve this main objective, a few more specific sub-objectives will make it possible to acquire the information necessary to understand this issue, to identify and analyse the main solutions to fight against food waste, and finally to propose recommendations to reduce waste in Saudi Arabia. The study is based on the Food Loss and Waste Accounting and Reporting Standard [
3], developed by the Food Loss and Waste Protocol, a multi-stakeholder partnership. It conducts a comprehensive survey of food loss and waste throughout the various stages of the food supply chain (FSC), 35 cities in 13 administrative districts of Saudi Arabia: 19 kinds of dried and fresh foods in 8 categories (wheat, rice, dates, vegetables, fruits, meats, chicken, and fish), with a poll of 5000 participants.
This study contributes to the existing literature in two ways. First, it is the first study ever that estimates the FLW percentages at various stages of FSC in Saudi Arabia. Using the approach proposed by [
4], it derives the amounts of FLW at various stages of FSC, as well as the total amount and rate of FLW at a global level. Secondly, it derives the optimal FLW rates in all the stages of FSC to achieve the SDG 12.3 target.
The paper starts with a literature review of the main studies conducted in Saudi Arabia and around the world. Then, it presents the calculation method of the FLW and the main findings. Finally, it puts forward some recommendations to achieve SDG 12.3.
2. Literature Review
Numerous reports and studies have been published by several international organisations and scholars in the past few years, which focus on the issue of food waste and loss, as it included defining concepts and assessments of this issue to highlight its importance. The FAO has estimated that one-third of the food produced for human consumption is lost or wasted along the food chain. However, this percentage differed from one study to another. The study of [
5], for instance, estimated that about half of the food quantity is lost and wasted. This difference may be explained by a number of factors, most notably, the geographical area in which the study is concerned, the variety of commodities consumed, seasons, the effectiveness of the food supply chain, and the methodology of measurement used [
6,
7,
8].
The difference in defining a unified and accurate meaning and definition of the issue of lost and waste has made it difficult to define precisely what is considered a loss, and what is considered waste. Therefore, we must draw on the various definitions used in scientific studies and the reports of international organisations. The FAO [
9,
10] and the study in [
4] suppose that food loss and waste refer to a decrease in edible foods intended for human consumption throughout the food chain from harvest to mass consumption, regardless of the cause. This definition is considered only from the moment after the crop is harvested. The study in [
11] adds materials suitable for human consumption that are deliberately wasted as animal feed or used as secondary materials for food processing and diverted from human consumption. Ref. [
12] uses the same definition presented by [
4,
10] but adds even nonedible ones. Loss and waste begin from the moment the crops are ready to be harvested [
13] Other distinctions in various food waste studies contain the concept of avoidability. Ref. [
14] classify food waste in two categories: avoidable food waste that refers to an edible food and drink but that was disposed of such as a slice of bread. The possibly avoidable waste comprises food that can be eaten by some consumers but not by others, such as bread crusts or potato skins. Unavoidable waste refers to nonedible waste such as eggshells or orange peel.
The terminology of food loss and waste used may differ throughout the food supply chain in the various studies in the literature, which leads to misleading comparisons between the numerous studies and false conclusions. The study in [
10] distinguishes between the loss and waste at each stage in the food chain. It considers loss to be what happens at an early stage of the food chain, after harvest, but food waste usually occurs in the distribution and consumption stage. In contrast, the study in [
15] uses only the term of food waste for all stages of the food supply chain. The authors of [
16] present the term food losses as losses of the food system (including biomass inedible by humans) at stages through production, supply, and consumption.
The definition may change according to the type of food loss and waste that is considered either quantitative or qualitative. Quantity indicates volume and mass. Quantitative food loss can be defined as the decrease in the volume of edible food available for human use. As for quality, it is the change in the physical, chemical, and/or organic properties of the product, such as the decrease in the nutritional value of the product, the change in the taste, colour, or texture [
10,
15]. Consequently, quantifying FLW represents a crucial step in identifying how much and where the FLW occurs. To this end, a protocol proposed by some international organisations is designed to account for the physical amount of FLW and for non-FLW products and packaging.
Consistent measurement of FLW is a necessary step for reducing food loss at every stage of the food supply chain. In [
10], the calculation of FLW is based on the food balance sheet (FBS) and on waste percentages for different food groups at various stages of the food chain [
16]. The advantages of this approach are that the FBS is built on official information and data prepared by government agencies, and based on food production and utilisation data, which, in general, are collected more systematically than waste data [
17]. The studies in [
4,
18] use the FAO food balance sheet where postharvest stages were divided into a locally produced quantity stage, a stock variation stage, an import stage, and an export stage, all of which are used to calculate the domestic food supply quantities for regions or countries. Then, they calculate the waste percentage for commodity groups at each stage of the food supply chain. To better understand the different types of food waste to support informed decisions for more sustainable management of food waste, ref. [
19] develop a food waste management decision tree based on nine-stage categorisation, and a version of the food waste hierarchy are used as a basis of a methodical procedure to identify types of food waste and alternative activities to manage them. This novel methodology aims to minimise environmental impacts while maximising economic and social benefits.
There are a few studies that estimate the total percentage of FLW and the total amount of national food loss and waste in regions or in developed and developing countries [
20]. The WRAP study from the United Kingdom estimated that the total waste was 19% of all food and drink purchases brought into the home by weight, and the avoidable waste was 12% in 2010 [
21]. The European Commission study reveals that food waste in the EU 27 was estimated at a volume of 89 million tons per year [
7]. Furthermore, there are some attempts to study food losses and waste at a national level. The study in [
22] estimates that Americans waste 34 million tons of food every year. Another study [
23] reveals that the avoidable food waste in Swedish households is estimated at 910,000 tons annually, which and corresponds to 56 kg of food waste per capita. Studies in [
24,
25] affirm that the level of food waste in the Kingdom of Saudi Arabia is as high as in other rich countries, and it yearly reaches 427 kg per person. The study in [
26] reports that in Saudi Arabia, up to 197.1 kg of food is annually wasted per head.
3. Methodology
In this study, we used the FAO model calculations proposed by [
4,
10]. The model calculations were based on the FLW percentages and the mass flow of different food groups at various stages of the food chain. The sources of the mass flow data are the 2016 food statistics provided by [
27,
28,
29].
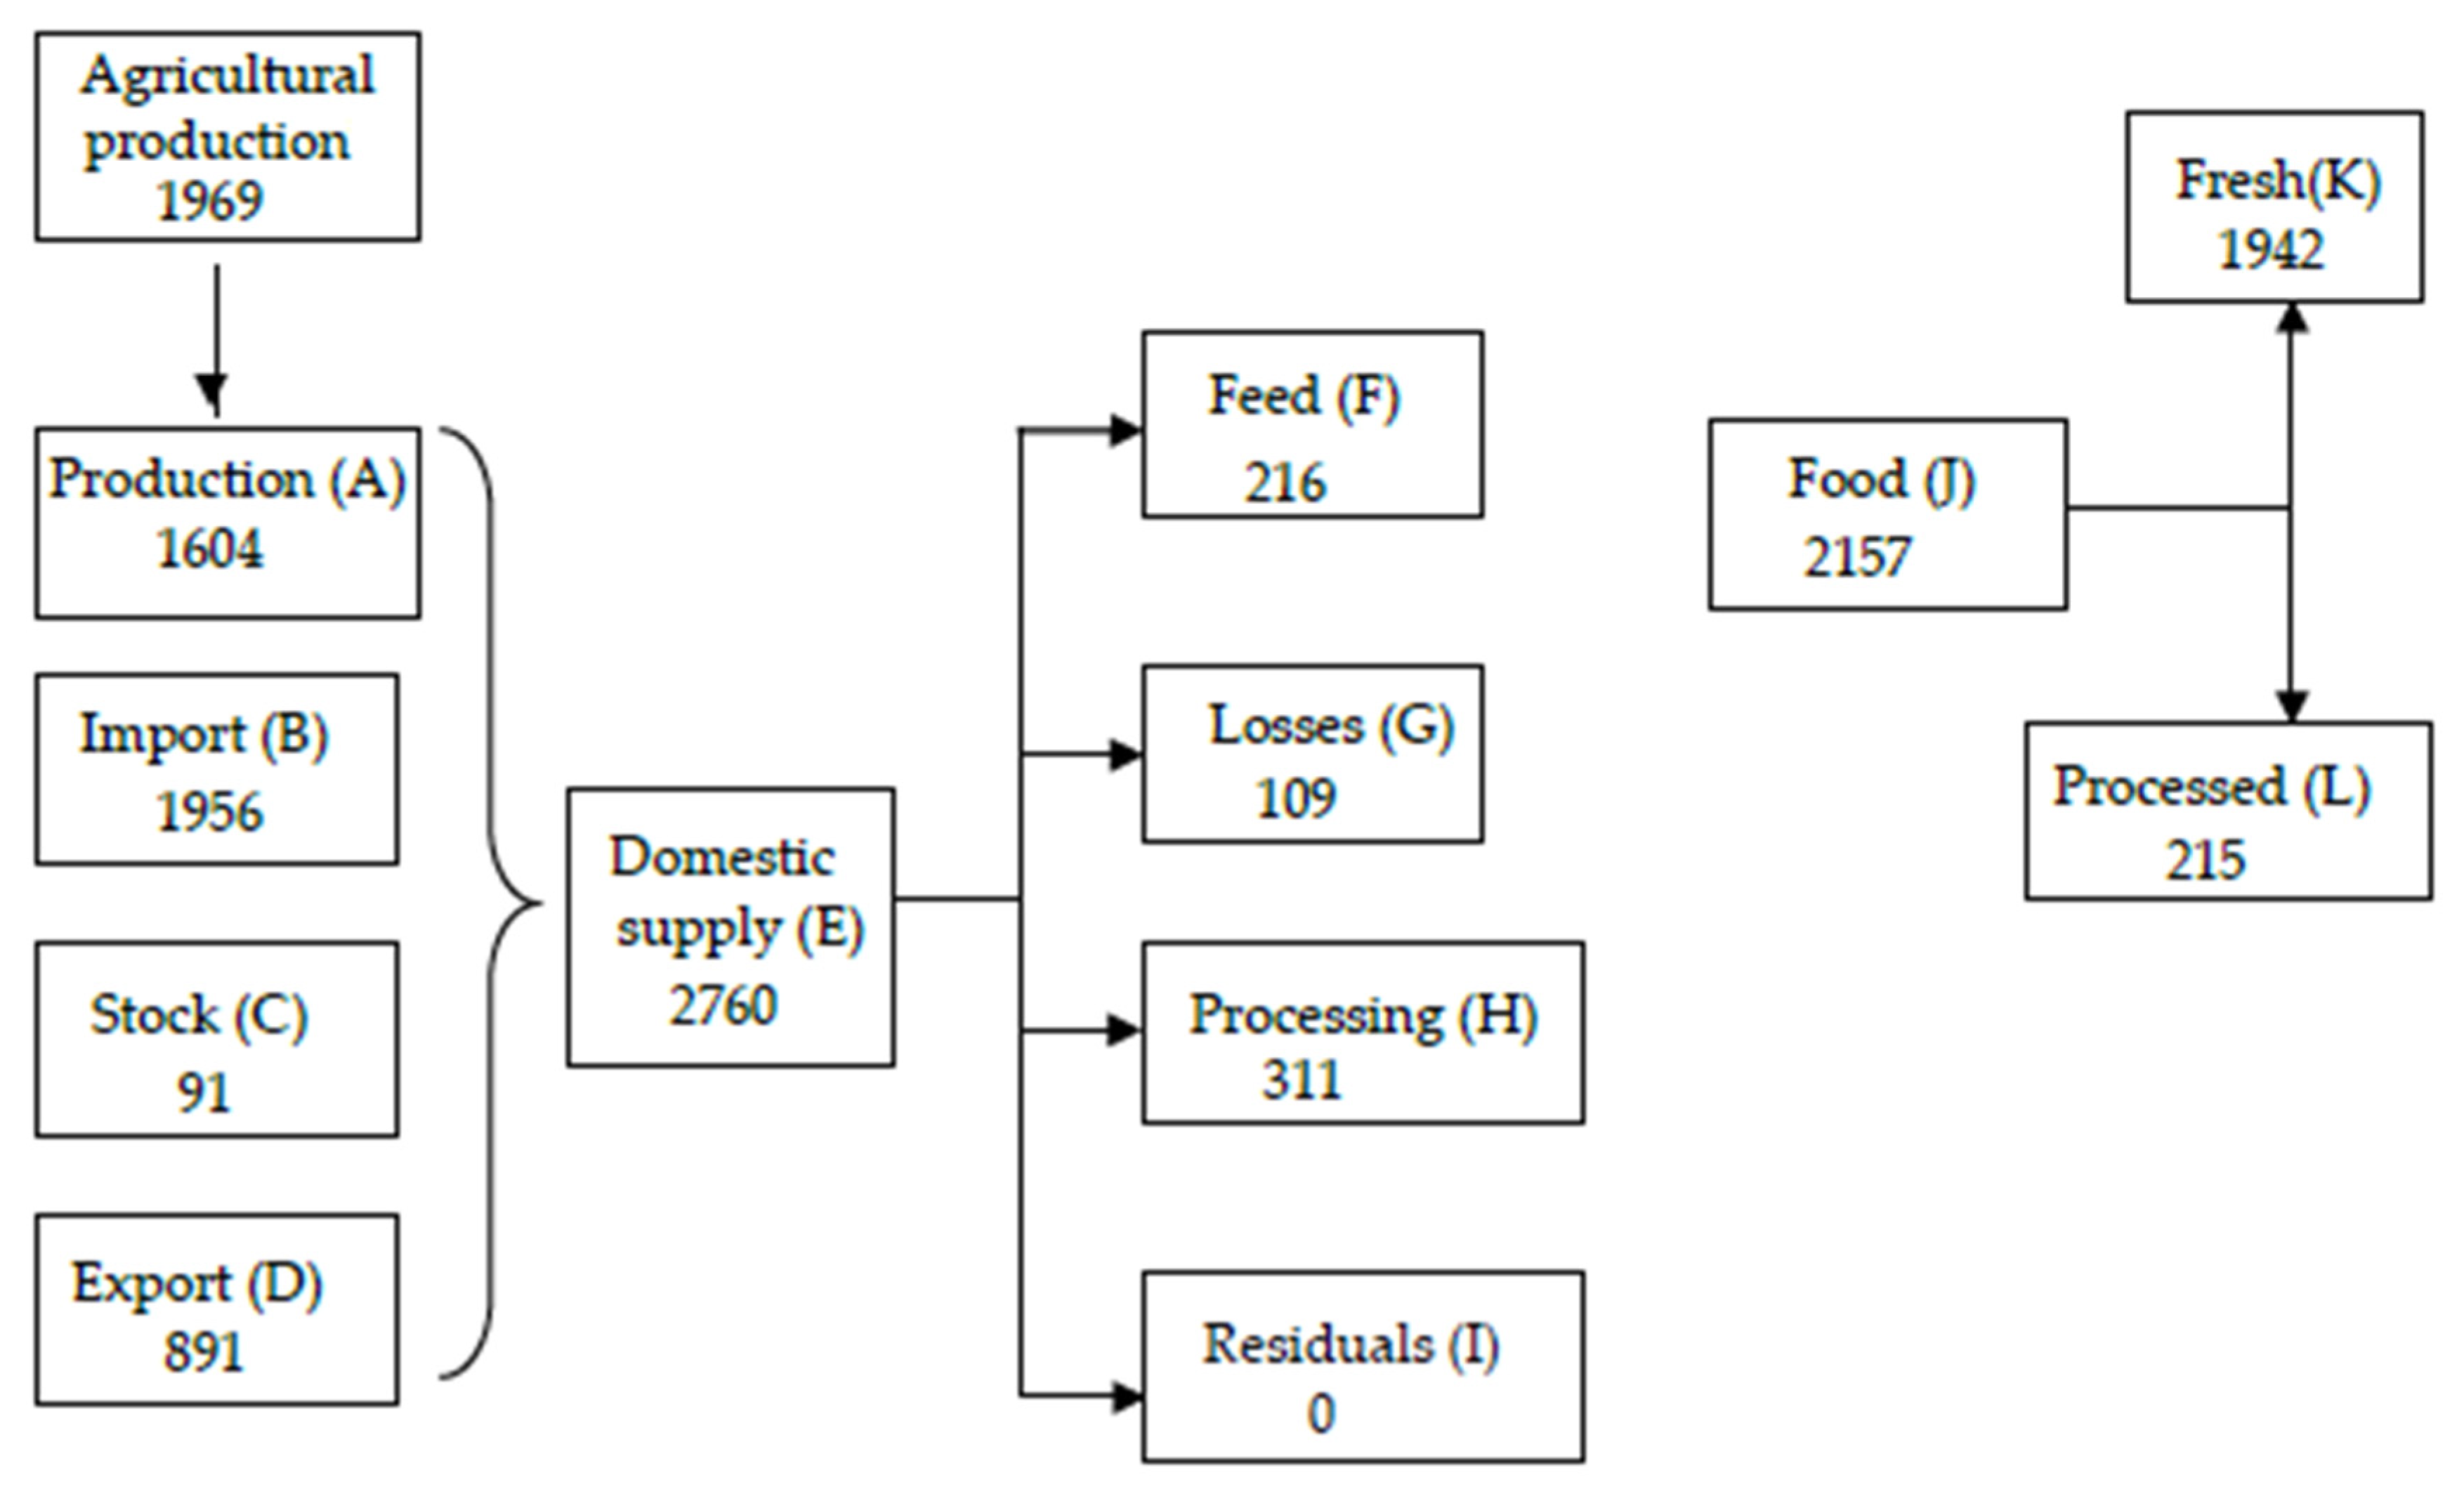
Figure 1 shows the food balance sheet (FBS) of Fruits for Saudi Arabia in 2016.
Domestic supply (E) = Production (A) + Import (B) + Stock (C) − Export (D)
Food (J) = Domestic supply (E) − Feed (F) − Losses (G) – Residuals (I) = Fresh (K) + Processed (L)
The amounts of FLW across the various stages of the food supply chain (FSC) are calculated in 3 steps:
Agricultural production = ; Postharvest handling and storage = , Processing and packaging = , Distribution (fresh) = , Distribution (processed) = , Consumption (fresh) = , Consumption (processed) = ,
Agricultural production: ;
Postharvest handling and storage: ;
Processing and packaging ;
Distribution (fresh): ;
Distribution (processed): ;
Consumption (fresh): ;
Consumption (processed): .
Conversion factors: peeling by hand =; industrial peeling = ; mean = ;
Agricultural production: ;
Postharvest handling and storage: ;
Processing and packaging ;
Distribution: ;
Consumption: .
Several FLW measurement methods are proposed in the literature including diaries, direct measurement, interviews and surveys, mass balance, proxy data, records, and waste composition analysis [
30] In this study, we use structural questionnaires to collect the FLW mass and then estimate the FLW percentages in each stage of FSC.
4. Results
We estimated the amount of food loss and waste of 19 food products grouped into 8 groups: 1. Wheat ‘Flour–Bread’; 2. Rice; 3. Dates; 4. Vegetables ‘zucchini–Cucumber–Tomato–Onion–Potato–Carrots’; 5. Fruits ‘Orange–Melon–Mango’; 6. Red meat ‘Camels–Lamb–Beef’; 7. Poultry; 8. Fish. The survey covers 33 sites of FSC.
Figure 2 and
Figure 3 display the initial distribution of the pilot and main study samples. More details on the poll are available in [
31] (pp. 13–37).
After discarding the incomplete and incorrect samples, we analysed a total of 30,889 samples including 6162 loss samples and waste samples. The distribution of FLW samples by types of products and by cities is reported in the study [
31] (pp. 23–40).
Table 1 provides the estimated FLW percentages for each food product at various stages of FSC (for more details see
Supplementary Material). For food loss, we observe that the fruits and vegetable production stage has the higher FLW percentage, while the lowest loss rate occurs at the processing and packaging stage for rice products. For food waste, the rice product has the higher waste rate, while the dates product has the smallest waste rate.
Using the estimated FLW percentages for each food group at various stages of FSC, we derived the total amount of FLW and its distribution across the various stages of FSC. In addition, we calculated the overall FLW rates for each product, as well as the overall FLW rate for Saudi Arabia in 2016.
Table 2 provides the estimated FLW as a percentage of available food, while
Table 3 displays the results of the total amount of FLW and its distribution across the various stages of FSC [
30] (pp. 41–65).
Table A1,
Table A2 and
Table A3 in
Appendix A provide the total amount of FLW and its distribution across the various stages of FSC of the disaggregated vegetables, fruits, and meat products.
According to
Table 2, the results indicate that the overall FLW rate in Saudi Arabia is 33.1% in 2016. The food waste rate reaches 18.9%, while the food loss rate is 14.2%. The vegetables and fruits recorded the highest FLW rates. The vegetables and fruits food loss and waste rates are 39.5% and 39.6%, respectively. The cost of the food loss and waste is about SAR 13 billion. The per capita food loss and waste is 184 kg/year. The vegetables per capita food loss and waste is high as for fruits.
Regarding the distribution of food loss and waste across the various FSC stages, the results in
Table A1,
Table A2 and
Table A3 in
Appendix A reveal that the high food loss and waste occur at the consumption level for wheat, rice, fish, poultry, and red meats. For vegetables and fruits, the production and—to a lesser extent—the consumption are the stages with the largest food loss and waste.
Overall, the study found that the levels of bread waste were extremely high, which calls for new measures at the level of the manufacture and sale of bread, as well as a review of sales prices, gradually raising support, developing mechanisms to raise awareness, rationalise consumption, recycle bread losses, and exploit it as animal feed. The study also confirms that rice is the most wasted food in Saudi Arabia, and therefore, a national plan to reduce rice waste is more necessary and urgent. It is important that this plan be three-dimensional, combining awareness, motivation, and punishment. The awareness-raising aspect involves changing the consumption habits associated with feasting and ceremonies, while the incentive is to encourage grace-keeping associations to contribute to the disposal, redistribution, or recycling of leftovers, and the deterrent aspect remains necessary to address the rice waste observed in most popular restaurants and the lack of food to dump leftovers into waste containers.
Moreover, for dates, climatic factors (such as rainfall during the vaccine period and the outbreak of some diseases and pests in palm forests), and poor storage conditions (heat, humidity, etc.) were also the main key factors causing dates loss. For all these reasons, the development of scientific research linked to improving the efficiency of pest control methods is a future strategic priority, and expanding the capacity to manufacture, mobilise and store dates is urgent to value the surplus of production and to direct it to external markets.
The traditional fishing techniques, the inconsistency of the fish production with international standards, as well as the methods of distribution between major markets, were the main causes of fish loss. In addition, health factors such as virus spread, bird diseases, and the inconsistent of poultry production with standards were among the main causes of loss in the poultry sector. Moreover, the low-skilled workers in the sector and the failure to respect the conditions of cooling led to the destruction of massive quantities of poultry meat.
Finally, in the case of vegetables and fruits, the high food losses at the production stage are due to the inefficiency of the labour force in fruit farms and to some extent to poor agricultural practices and the procedures followed, while the climatic factor and the unconformity of the products to the required specifications represented the key factors affecting and causing the waste of fruits at the consumption stage.
5. Optimal FLW Rates in Each Stage of FSC to Achieve the SDG 12.3
The Saudi Vision 2030 seeks to increase the percentage of food self-sufficiency, which in turn would reduce the levels of FLW rates. The Sustainable Development Goal (SDG) and its SDG 12.3 target aim to reduce the rates of food loss and waste by 50% in 2030. Thus, in order to achieve the SDG 12.3 target, we employed a nonlinear optimisation simulation model with the objective function of reducing FLW by 5% each year under the constraints of the available food and the equations calculating the amounts of FLW at each stage of FSC (see
Section 3). The solutions of the simulated model are the optimal FLW percentages at various stages of FSC, and the optimal supply inputs, namely, imports, production, exports, and stocks. The available food is the product of food per capita by the projected population. The projected population data are retrieved from the United States Projected Populations database.
Table A4 provides the data of available food series, as well as the projected populations for the period 2020–2030. We used the Excel Solver add-in to solve the model.
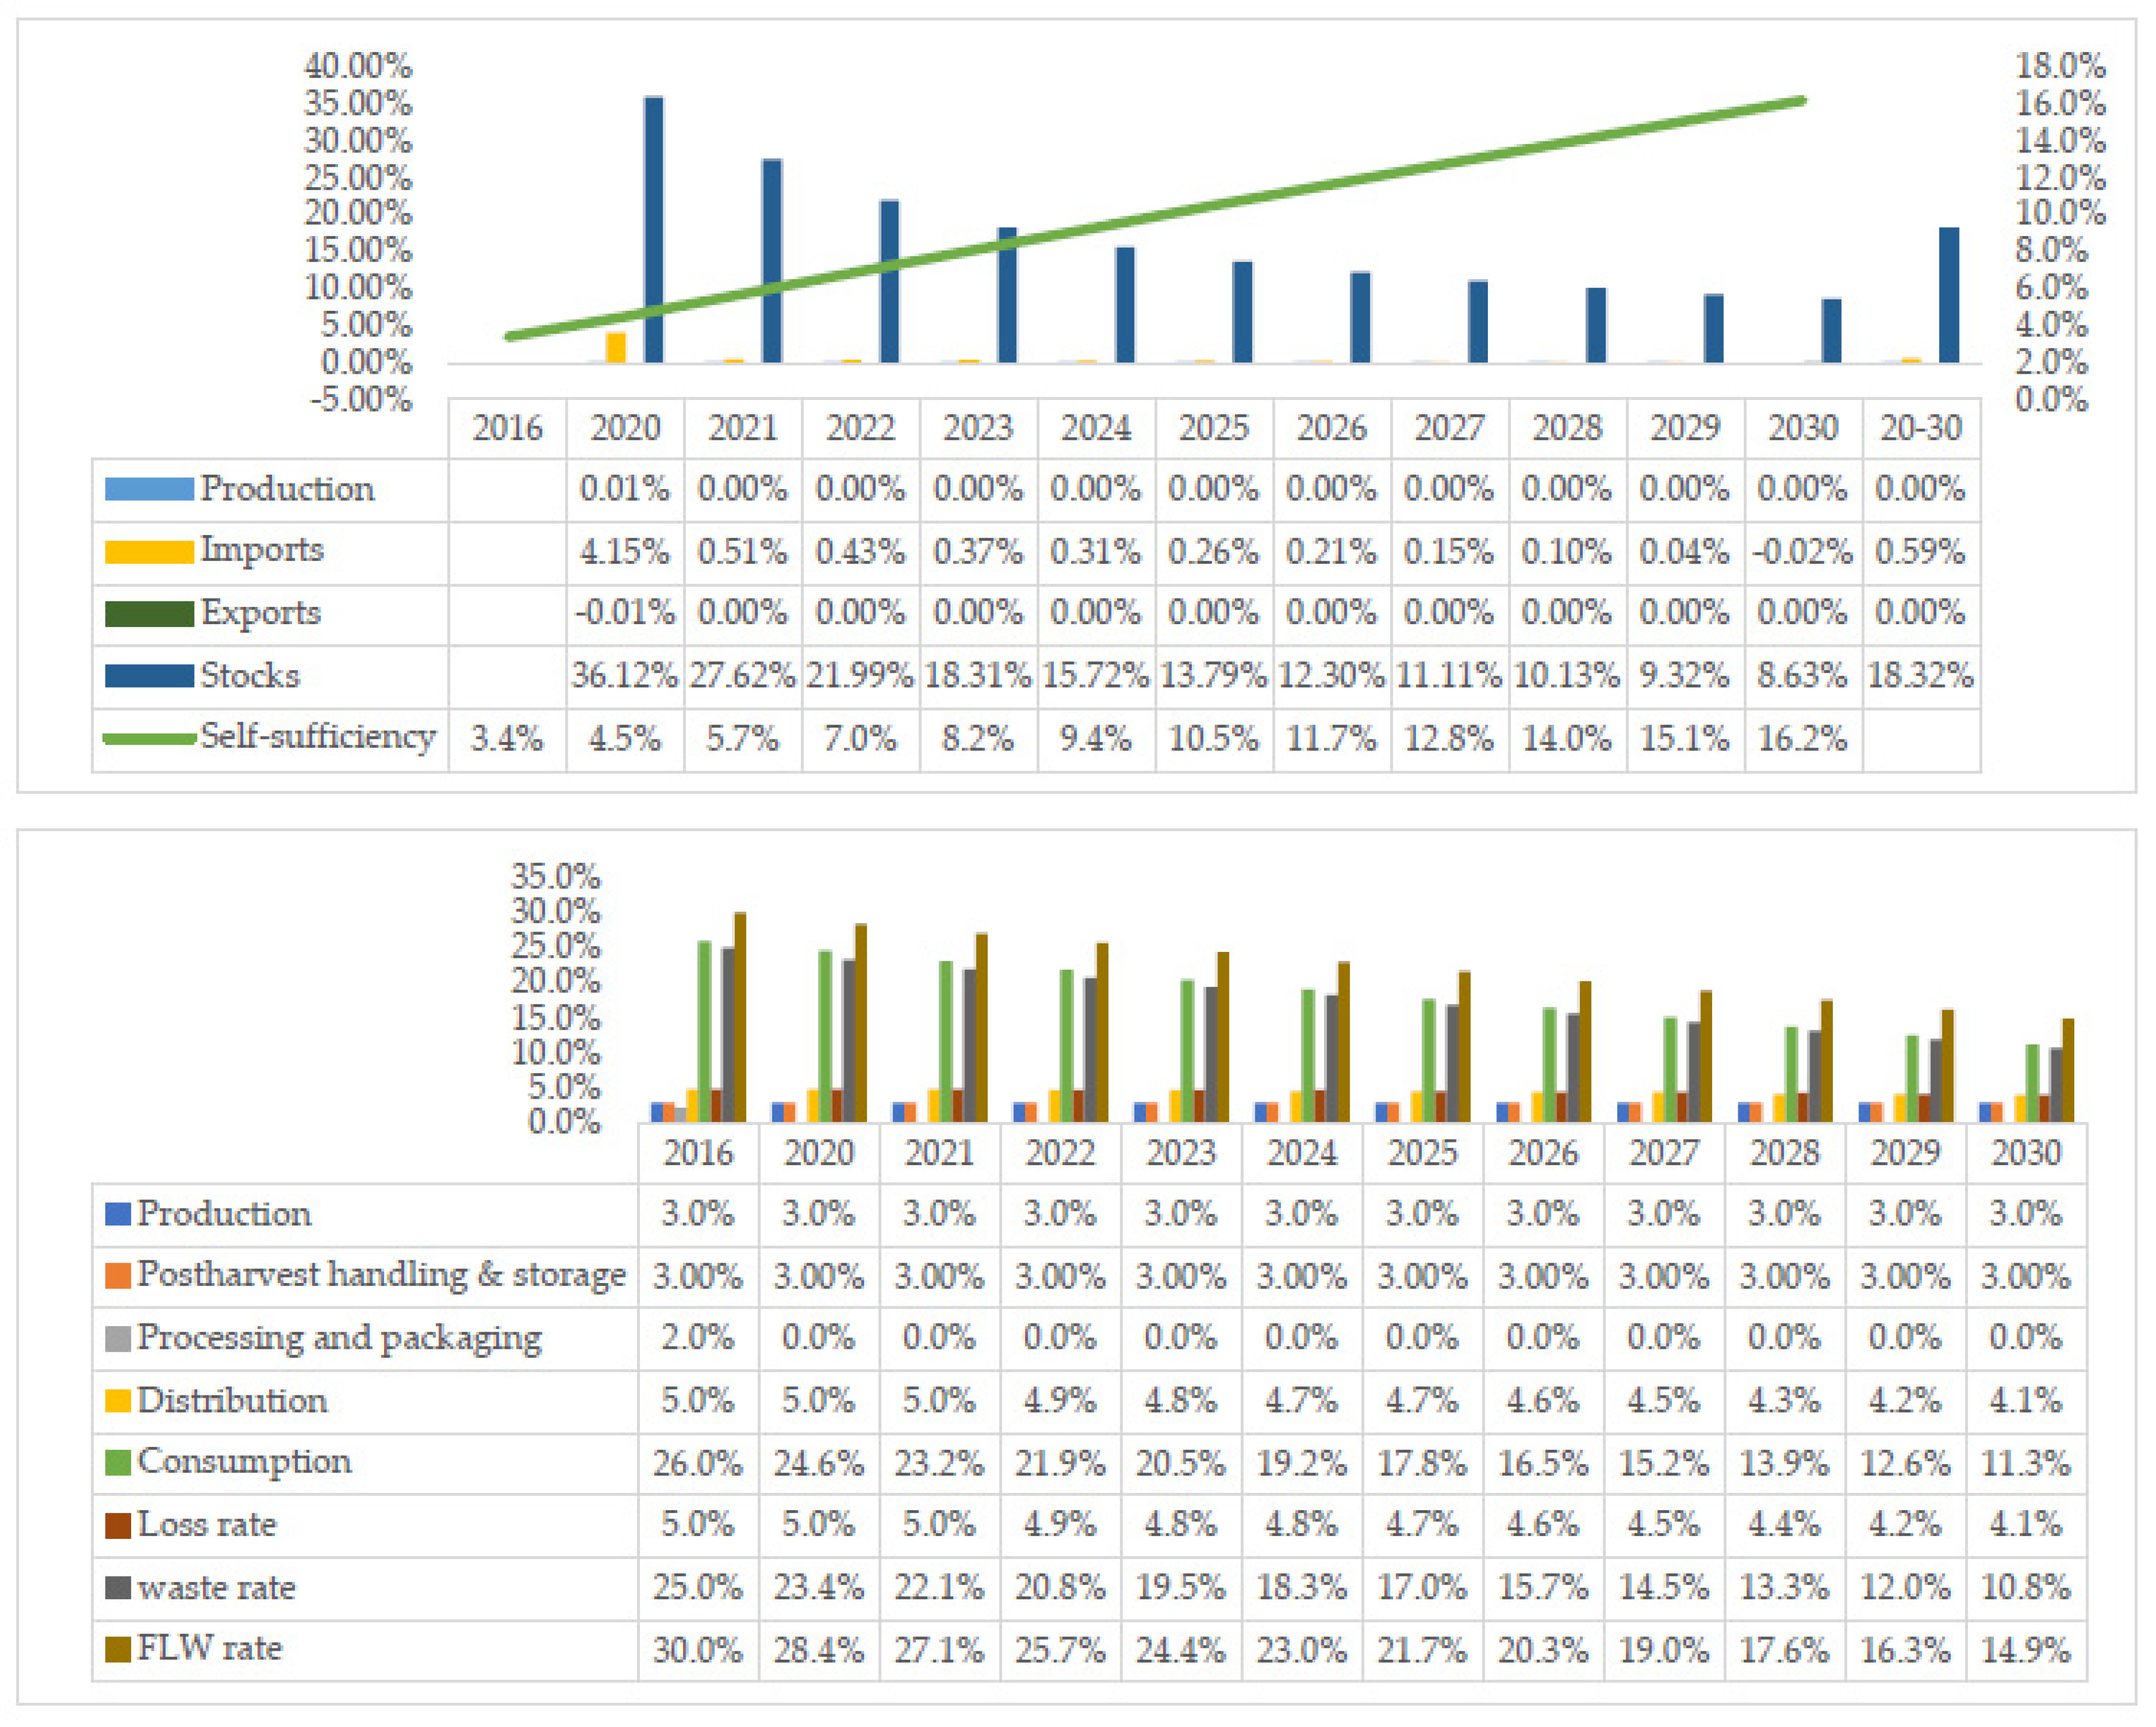
Figure 4 provides the results of wheat’s simulation model. Achieving the goal of reducing the rate of loss and waste in wheat by 50% by the end of 2030, compared to its level in 2016, requires reducing the loss rate in the distribution stage of FSC from 5% in 2016 to 4.1% by 2030 and reducing the waste rate in consumption from 26% in 2016 to 11.3% in 2030. In addition, the reduction of the FLW rate by 50% will allow Saudi Arabia to increase its strategic stocks of wheat at an average annual rate of 18.3% during the period 2020–2030. The self-sufficiency ratio of wheat will increase from 3.4% in 2016 to 16.2% by 2030. We also note that reduction FLW will reduce the import’s growth rate from 4.15% for the period 2016–2020 to 0.59% by 2029–2030.
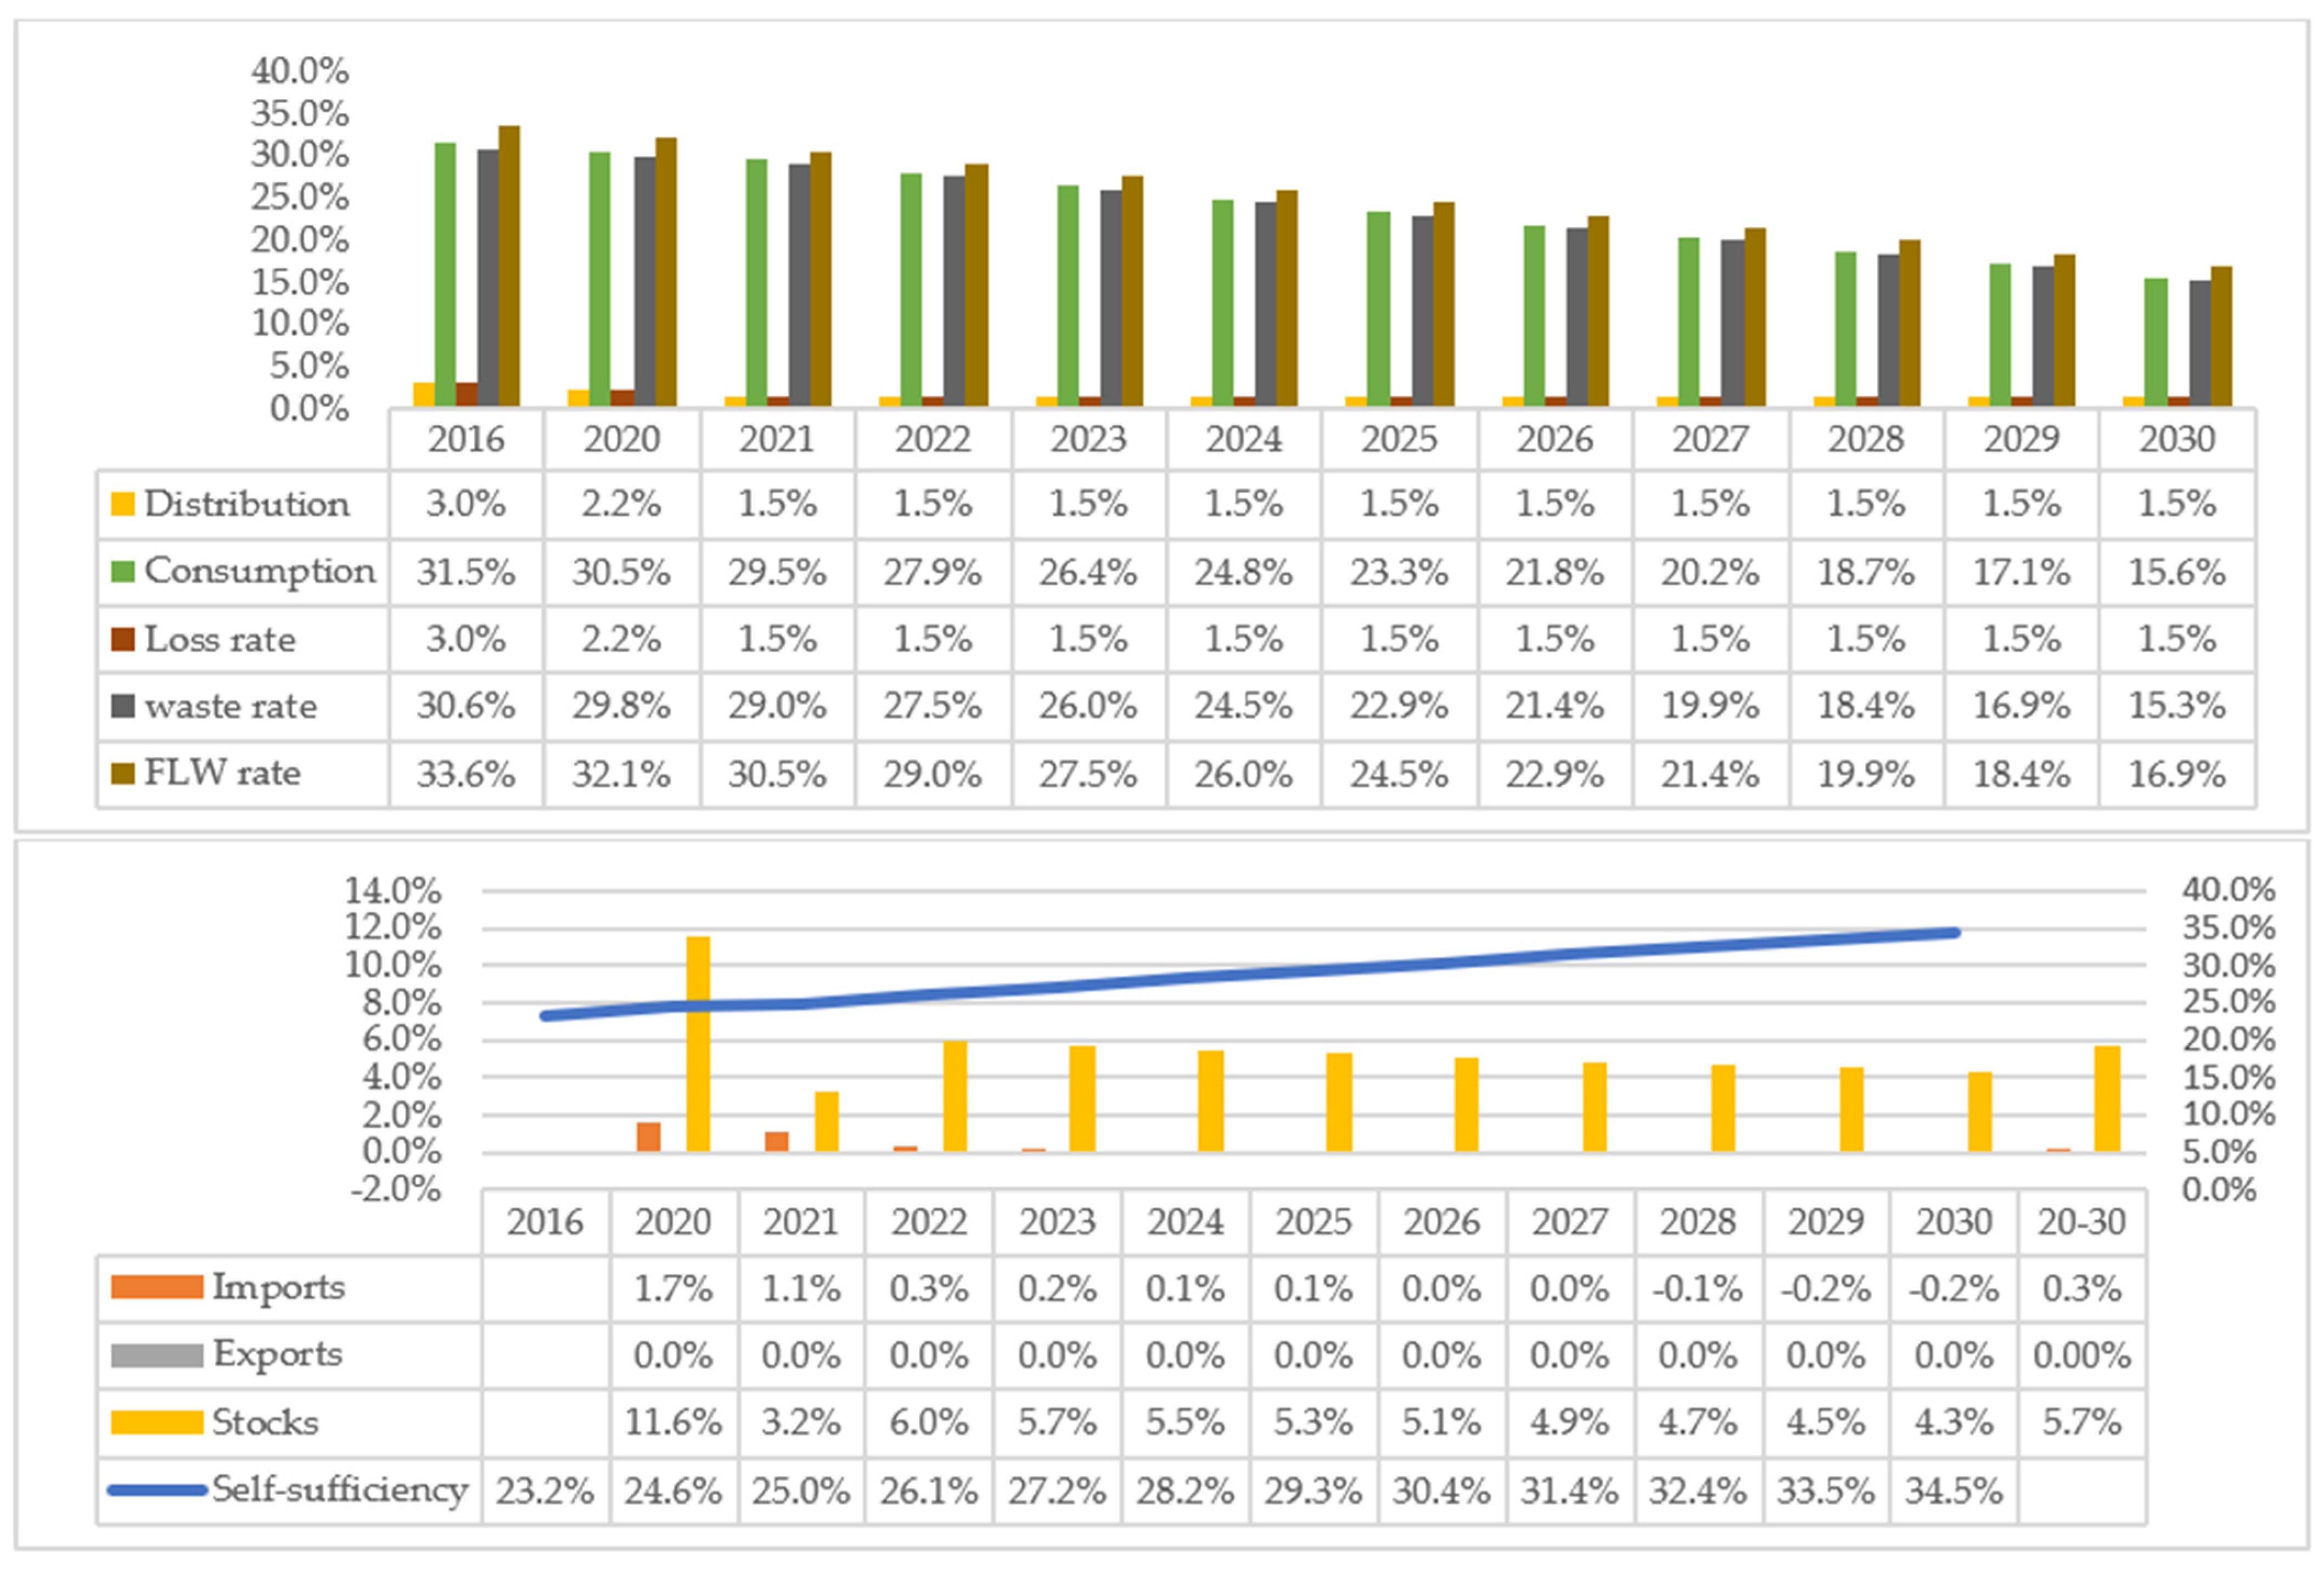
Figure 5 shows the results of rice’s simulation model. In order to reduce the rate of loss and waste in rice by 50% by the end of 2030, compared to that of 2016, the loss rate in the distribution stage of FSC should be reduced from 3% in 2016 to 1.5% by 2030 and the waste rate in consumption from 31.5% in 2016 to 15.6% in 2030. Additionally, the drop in rice’s FLW rate by 50% will allow Saudi Arabia to increase its strategic stocks of rice to an average annual rate of 5.7% during the period 2020–2030. The self-sufficiency ratio of wheat increases from 23.2% in 2016 to 34.5% by 2030. We also note that the drop in FLW will reduce the import’s growth rate from 1.7% for the period 2016–2020 to 0.3% by 2029–2030.
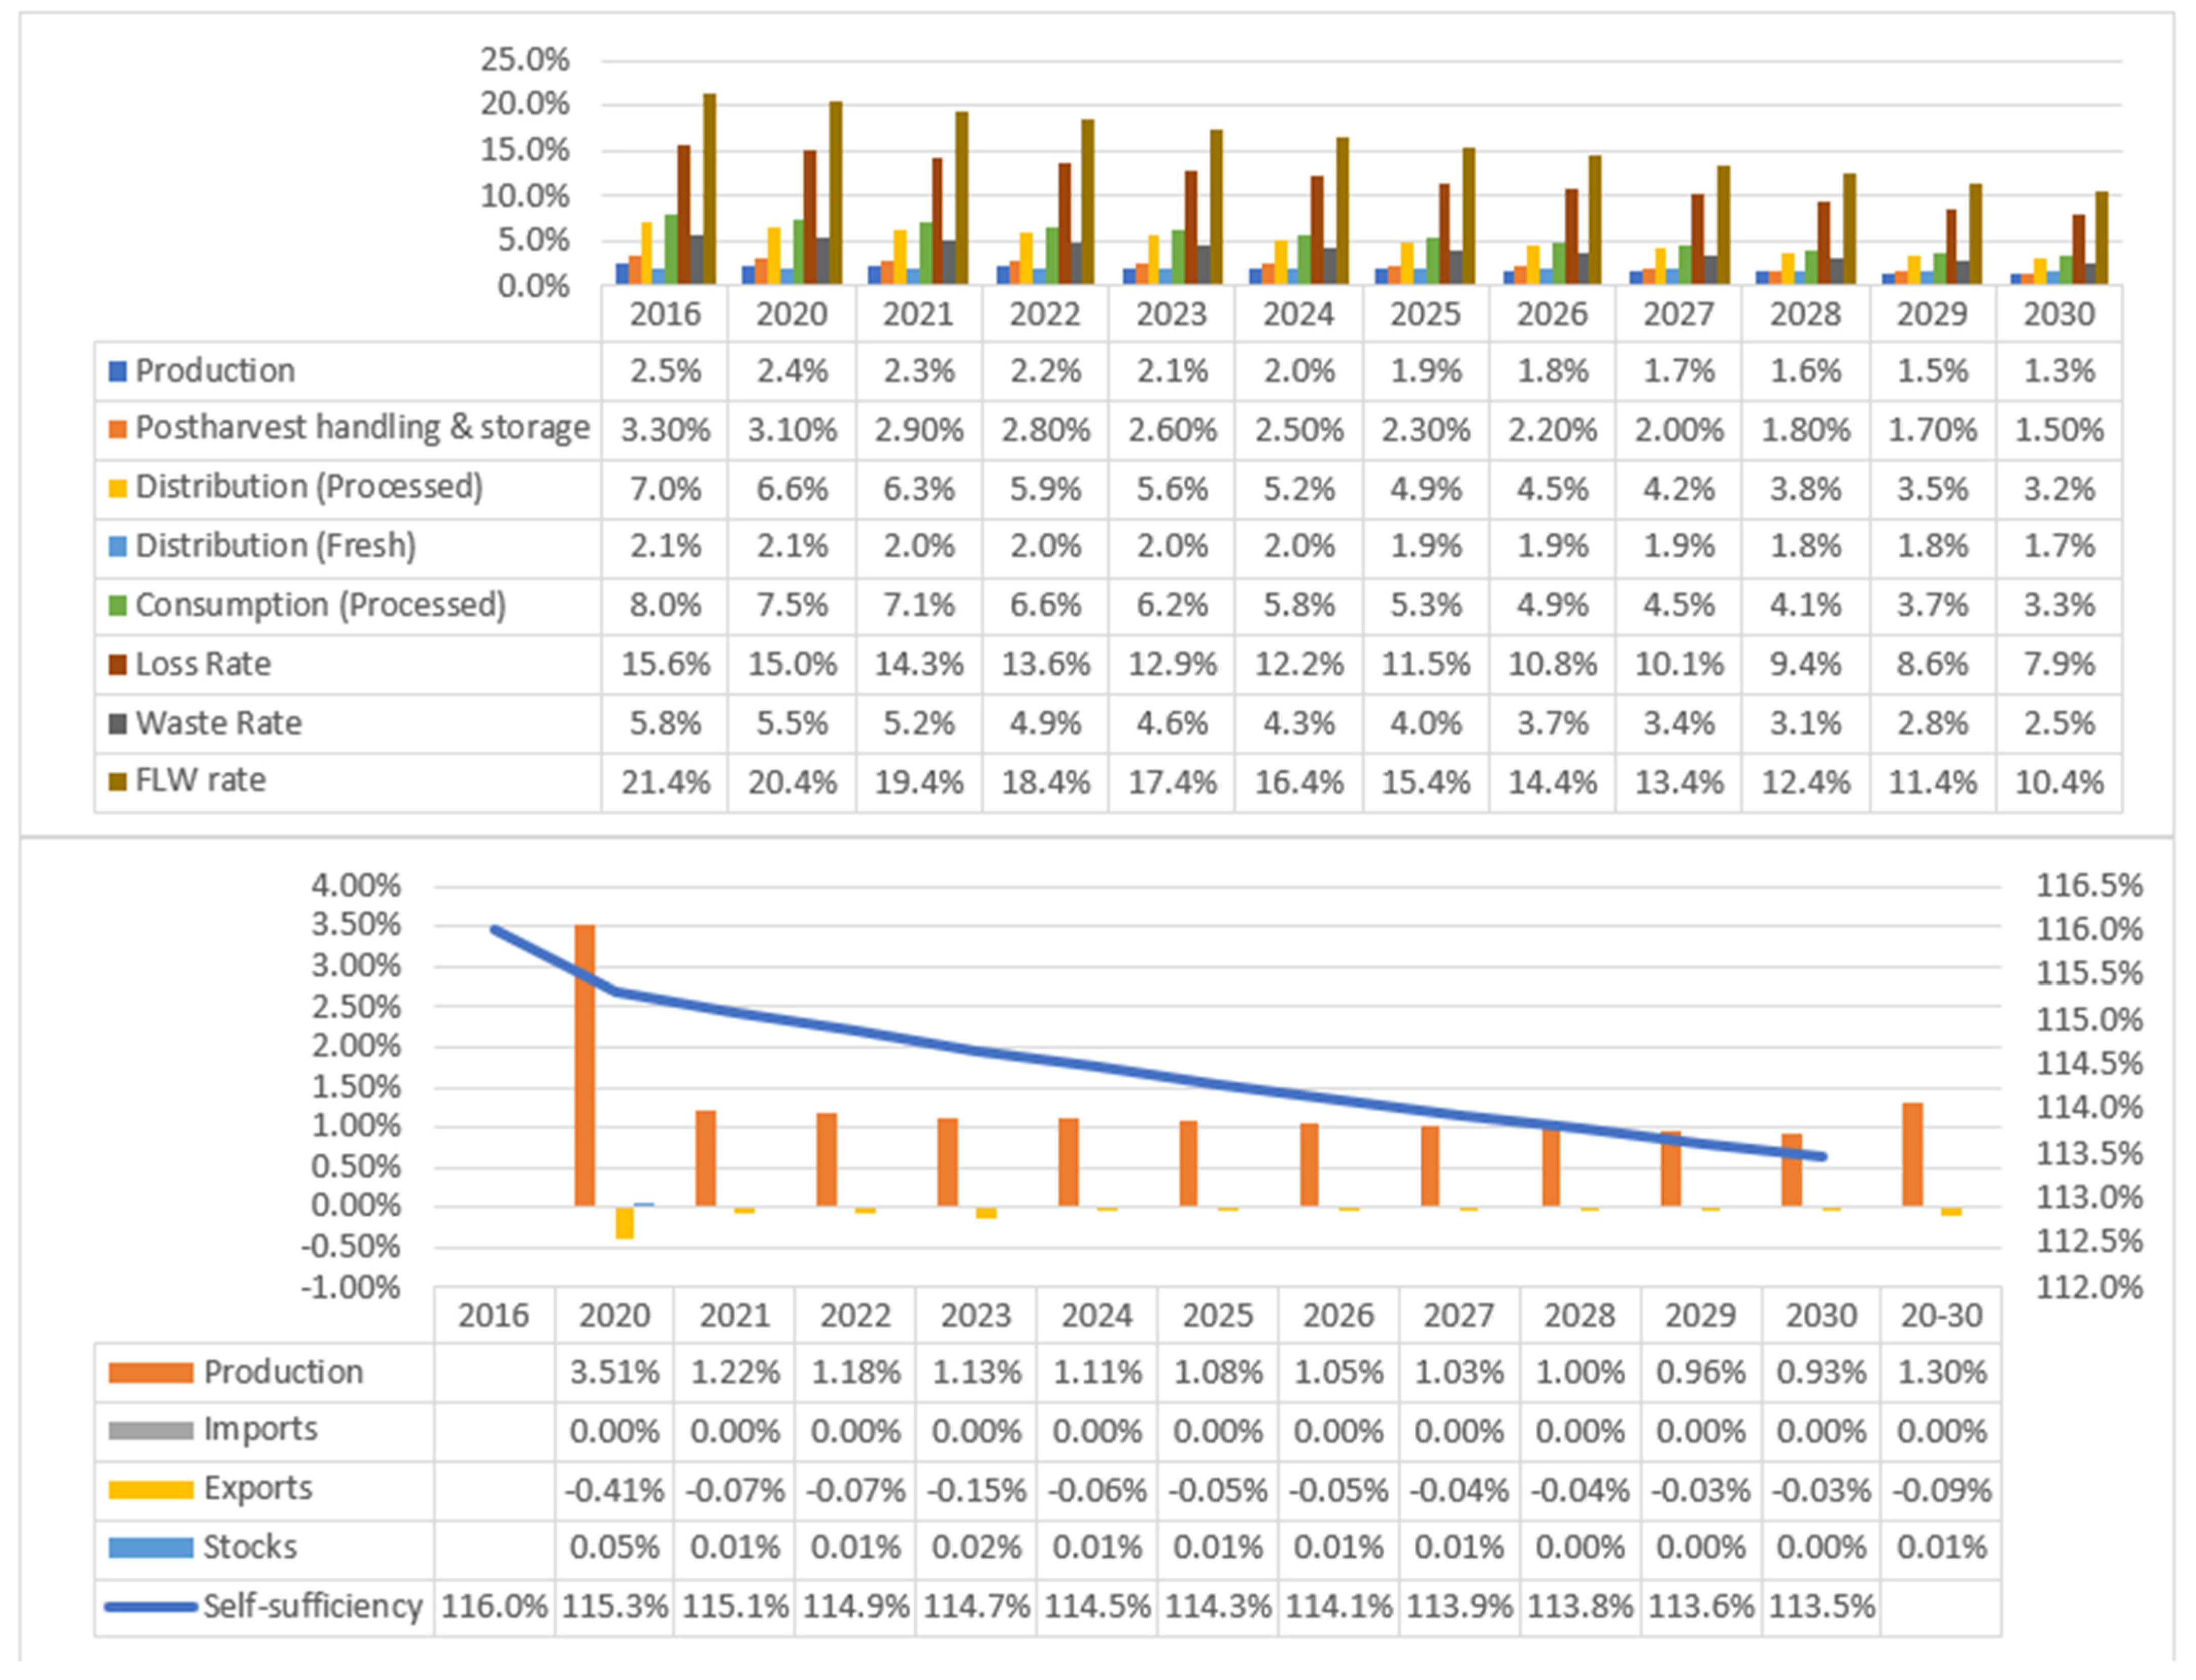
Figure 6 presents the findings of the date’s simulation model. Reaching the objective of decreasing the rate of loss and waste in dates by 50% by the end of 2030, compared to its level in 2016, entails reducing the loss rate in production level from 2.5% in 2016 to 1.3% in 2030, also in the distribution stage of FSC from 7% in 2016 to 3.2% by 2030 and decreasing waste rate in consumption from 8% to 3.3% for fresh dates between 2016 and 2030. Moreover, the decrease of rice’s FLW rate by 50% will make it possible for Saudi Arabia to increase its national production of dates at an average annual rate of 1.3% during the period 2020–2030. The self-sufficiency ratio of dates will decrease from 116% in 2016 to 113.5 by 2030%, which can be explained by the double decline in export growth (average annual rate of 0.09%) and the share of exports in production from 14.1% in 2016 to 12.1% by 2030.
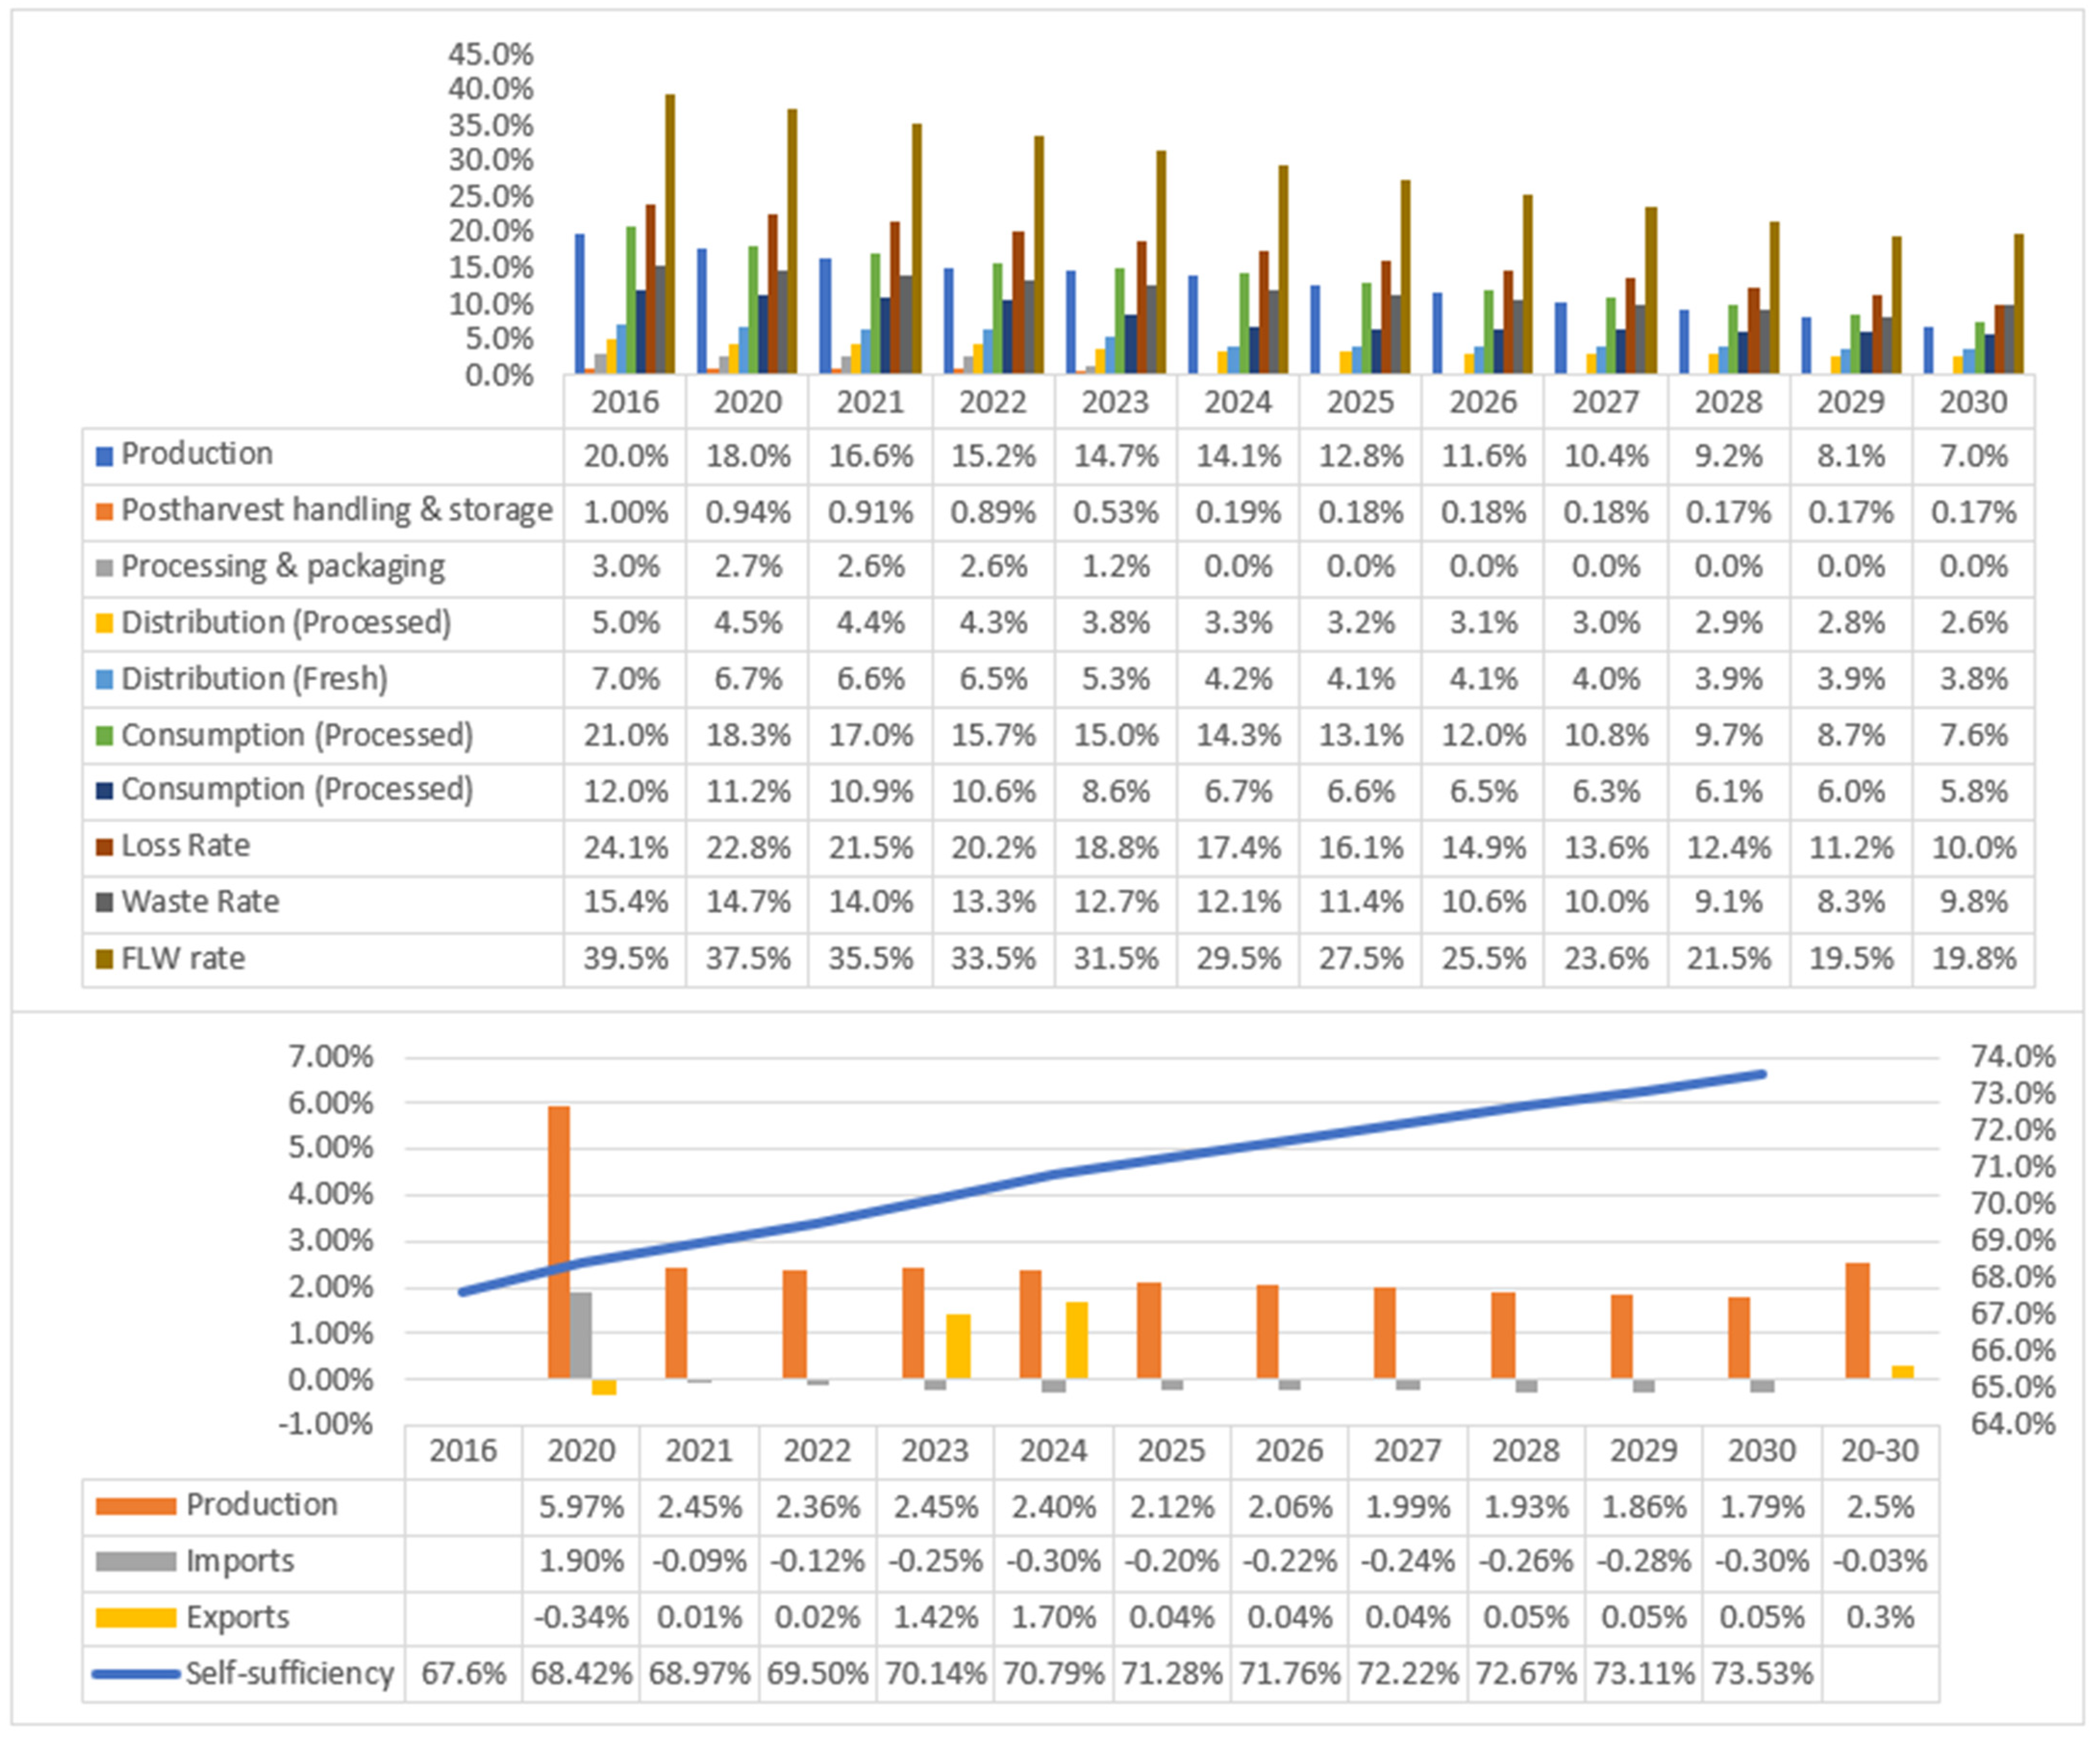
Figure 7 provides the results of the vegetable’s simulation model. Achieving the goal of reducing the rate of loss and waste in vegetables by 50% by the end of 2030, compared to its level in 2016, requires a reduction in the loss rate during the production phase of FSC from 20% to 7% and in distribution one of FSC from 5% in 2016 to 2.6% by 2030 for fresh vegetables, and from 7% to 3.8% for processed (manufactured) vegetables between 2016 and 2030; the waste rate in consumption should also be dropped from 21% to 7.6% for fresh vegetables and from 12% to 5.8% for processed vegetables. The reduction of vegetables’ FLW rate by 50% will allow Saudi Arabia to increase its national production at an annual average rate of 2.5%. The self-sufficiency ratio of vegetables will increase from 67.6% in 2016 to 73.5% by 2030. The reduction in FLW will decrease the import’s growth rate from 1.9% for the period 2016–2020 to 0.3% by 2030 and raise the growth of exports at an average annual growth rate of 0.3% during the period 2020–2030.
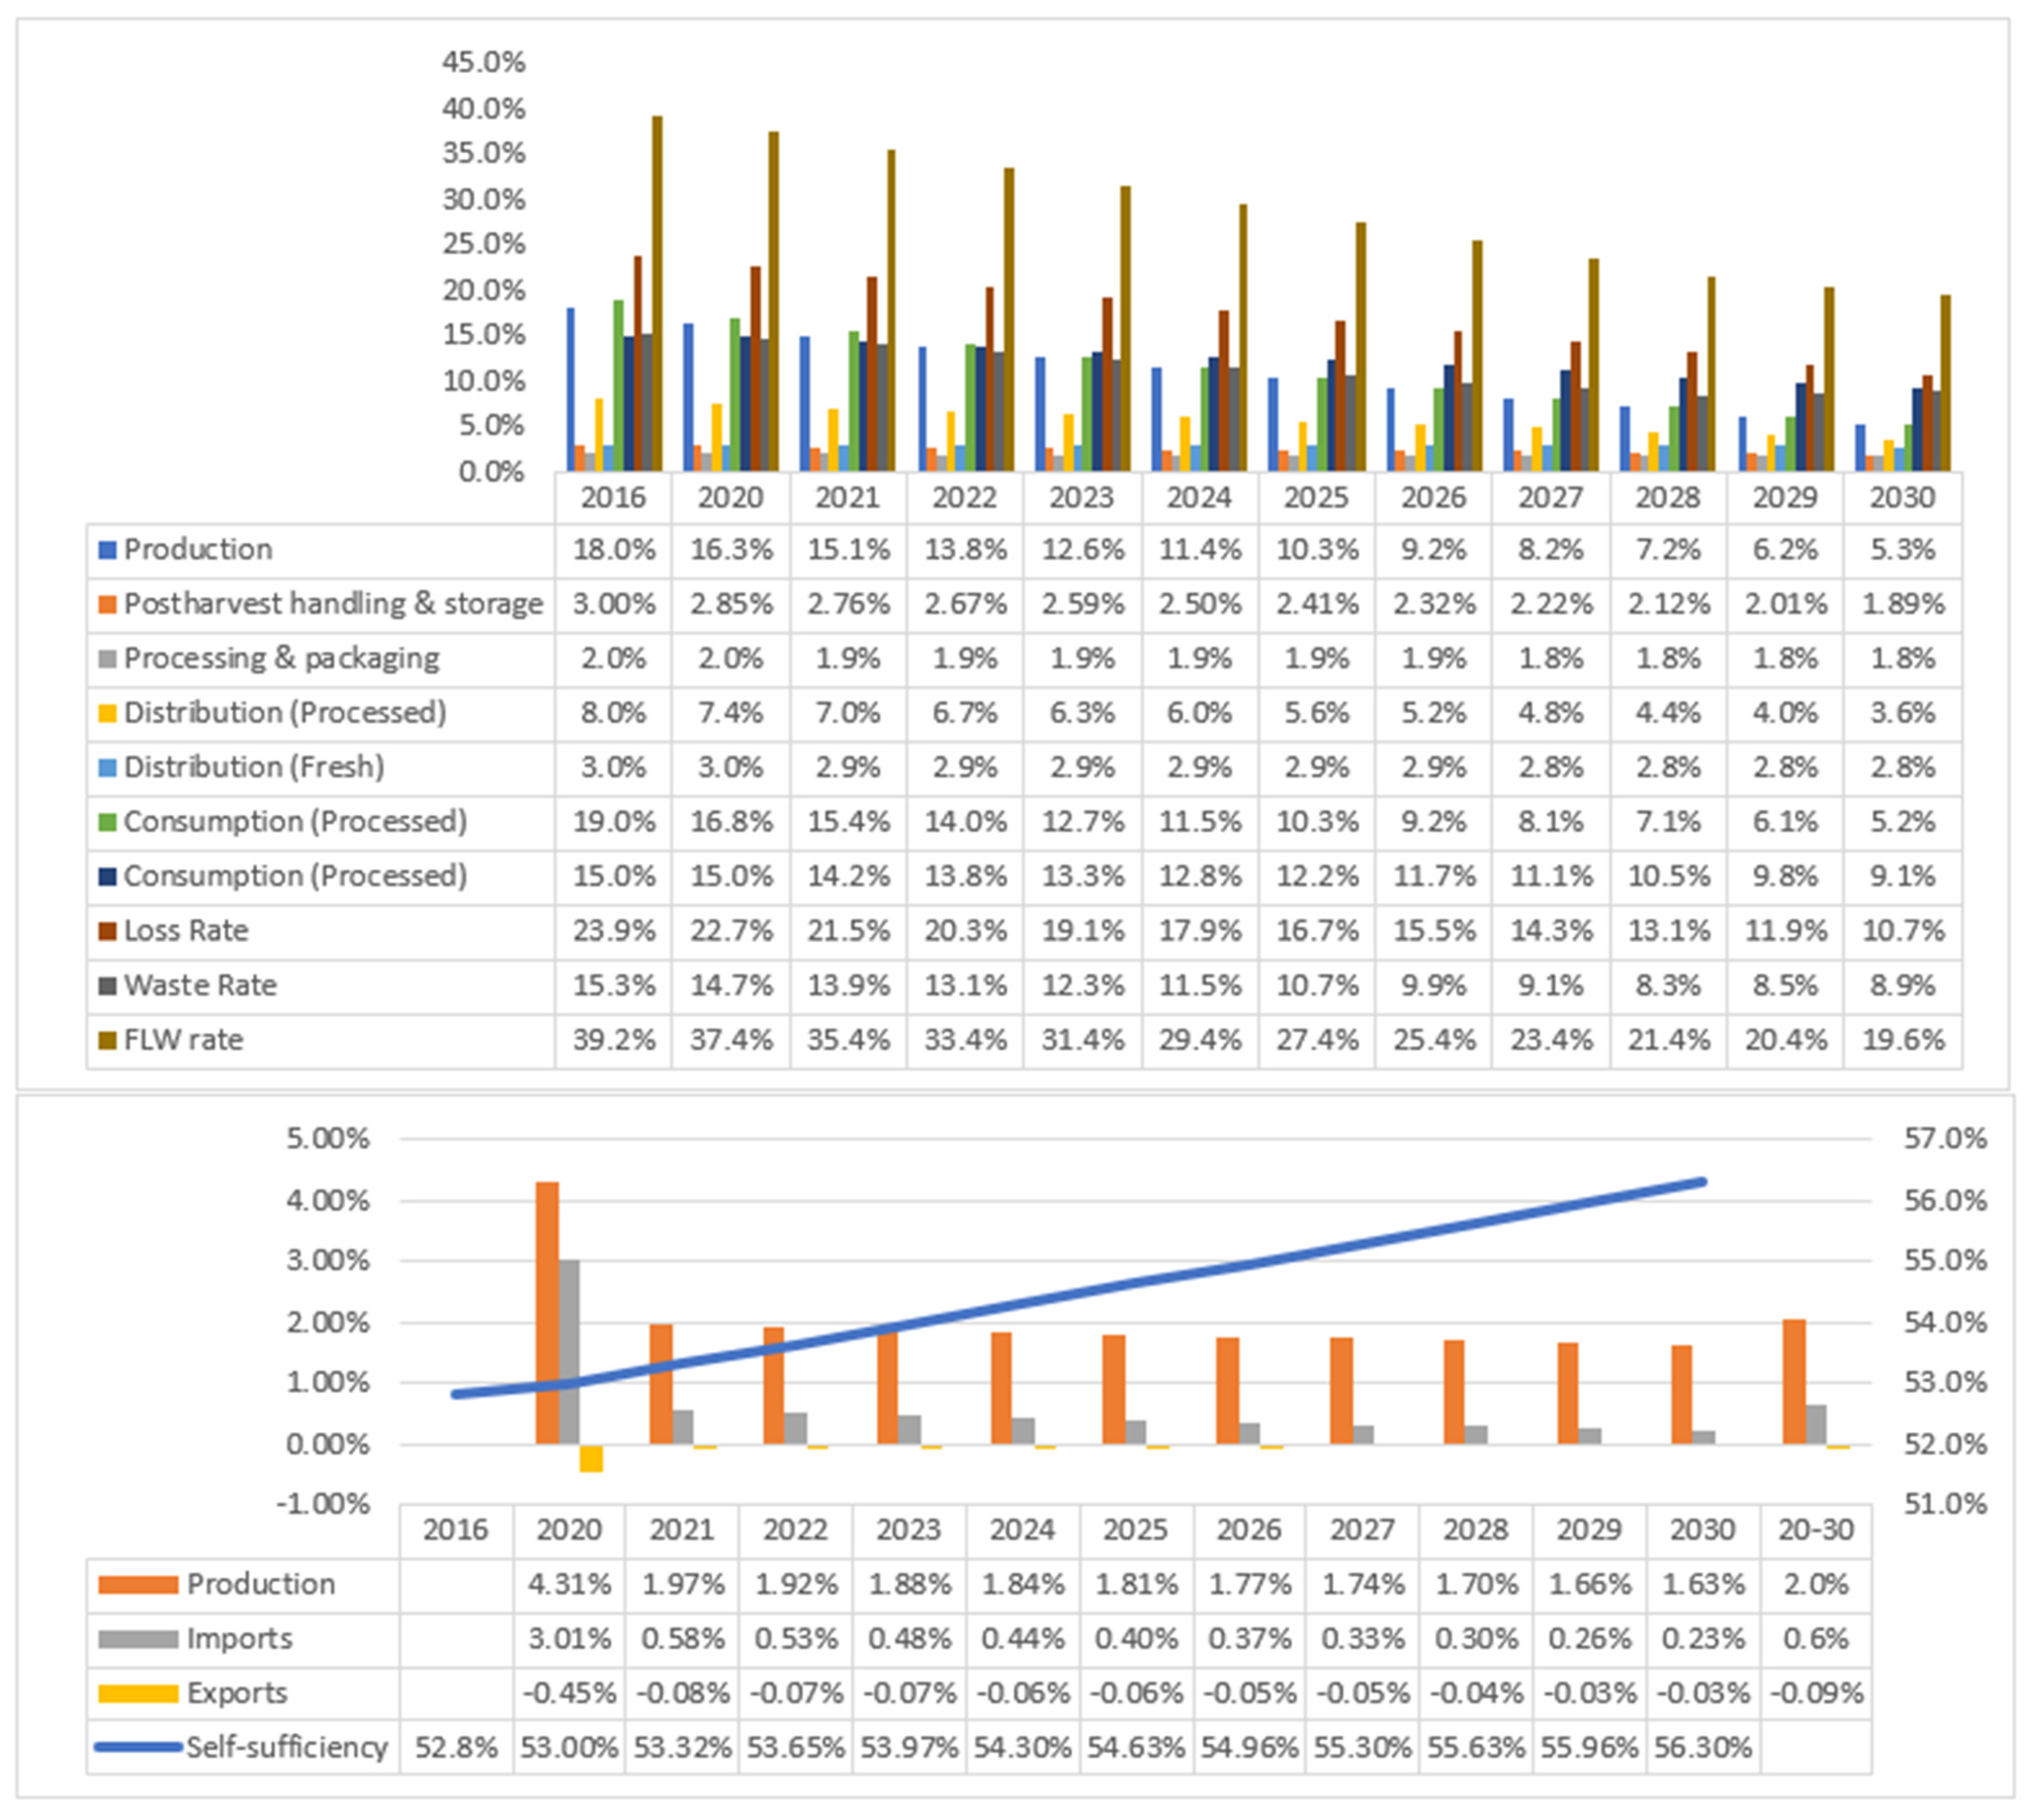
Figure 8 illustrates the findings of the fruit’s simulation model. Achieving the objective of reducing the rate of loss and waste in fruit by 50% by the end of 2030, compared to its level in 2016, needs a decrease in the loss rate in the production level from 18% in 2016 to 5.3% in 2030 and in the distribution stage of FSC from 8% in 2016 to 3.6% by 2030; the waste rate in consumption should also decrease from 19% in 2016 to 5.2% in 2030 for fresh fruits and from 15% to 9.1% for processed fruits between 2016–2030. Additionally, the decrease of fruit’s FLW rate by 50% will allow Saudi Arabia to increase its national production at an average yearly rate of 2% during the period 2020–2030. The self-sufficiency ratio of fruits will increase from 52.8% in 2016 to 56.3% by 2030, and this decrease in FLW will bring down the import’s growth rate from 4.31% for the period 2016–2020 to 0.23% by 2030.
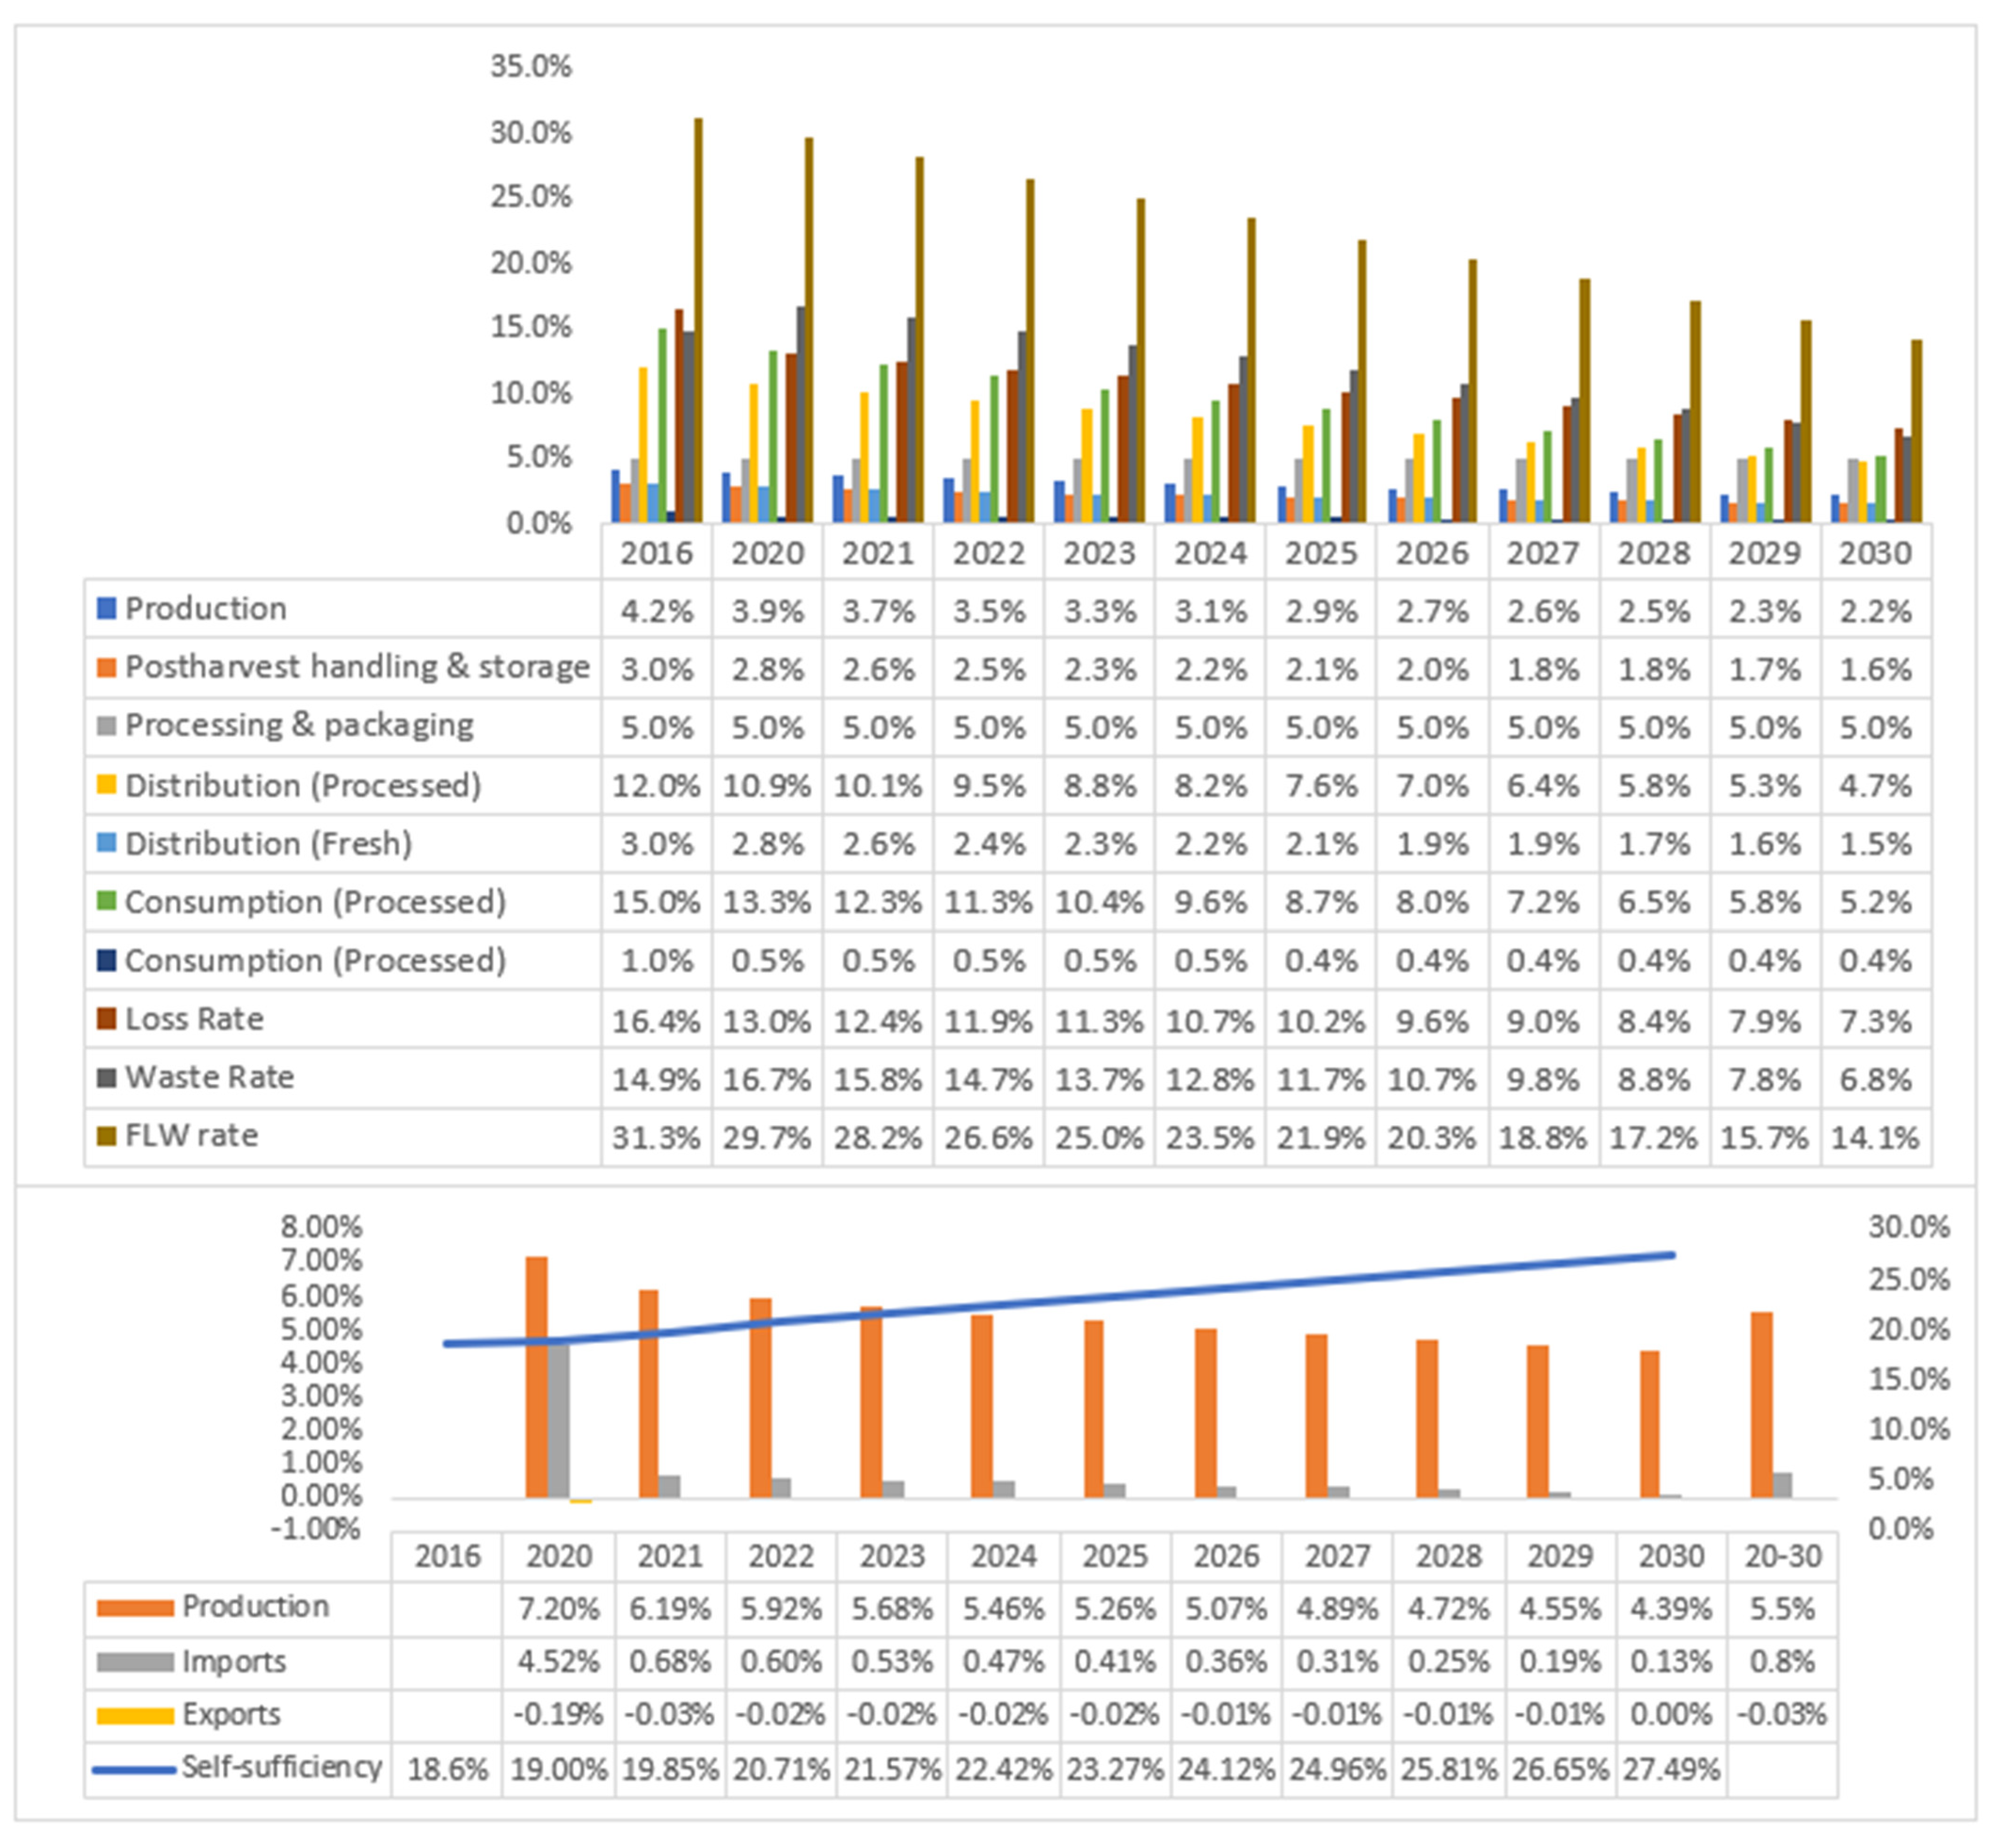
Figure 9 presents the results of meat’s simulation model. Attaining the objective of reducing the loss and waste rates in meat by 50% by the end of 2030, compared to its level in 2016, entails a loss rate in the production stage from 4.2% in 2016 to 2.2% in 2030, a decrease in the loss rate in the distribution stage of FSC from 12% to 4.7% by 2030 for fresh meat, and a decrease in waste rate in consumption stage from 15% in 2016 to 5.2% for fresh meat in 2030. The drop in meat’s FLW rate by 50% will allow Saudi Arabia to increase its national production of meat at an average yearly rate of 5.5% during the period 2020–2030. The self-sufficiency ratio of meat will go up from 18.6% in 2016 to 27.5% by 2030. The reduction in FLW will subsequently lead to a reduction in the import’s growth rate from 4.52% for the period 2016–2020 to 0.13% by 2030.
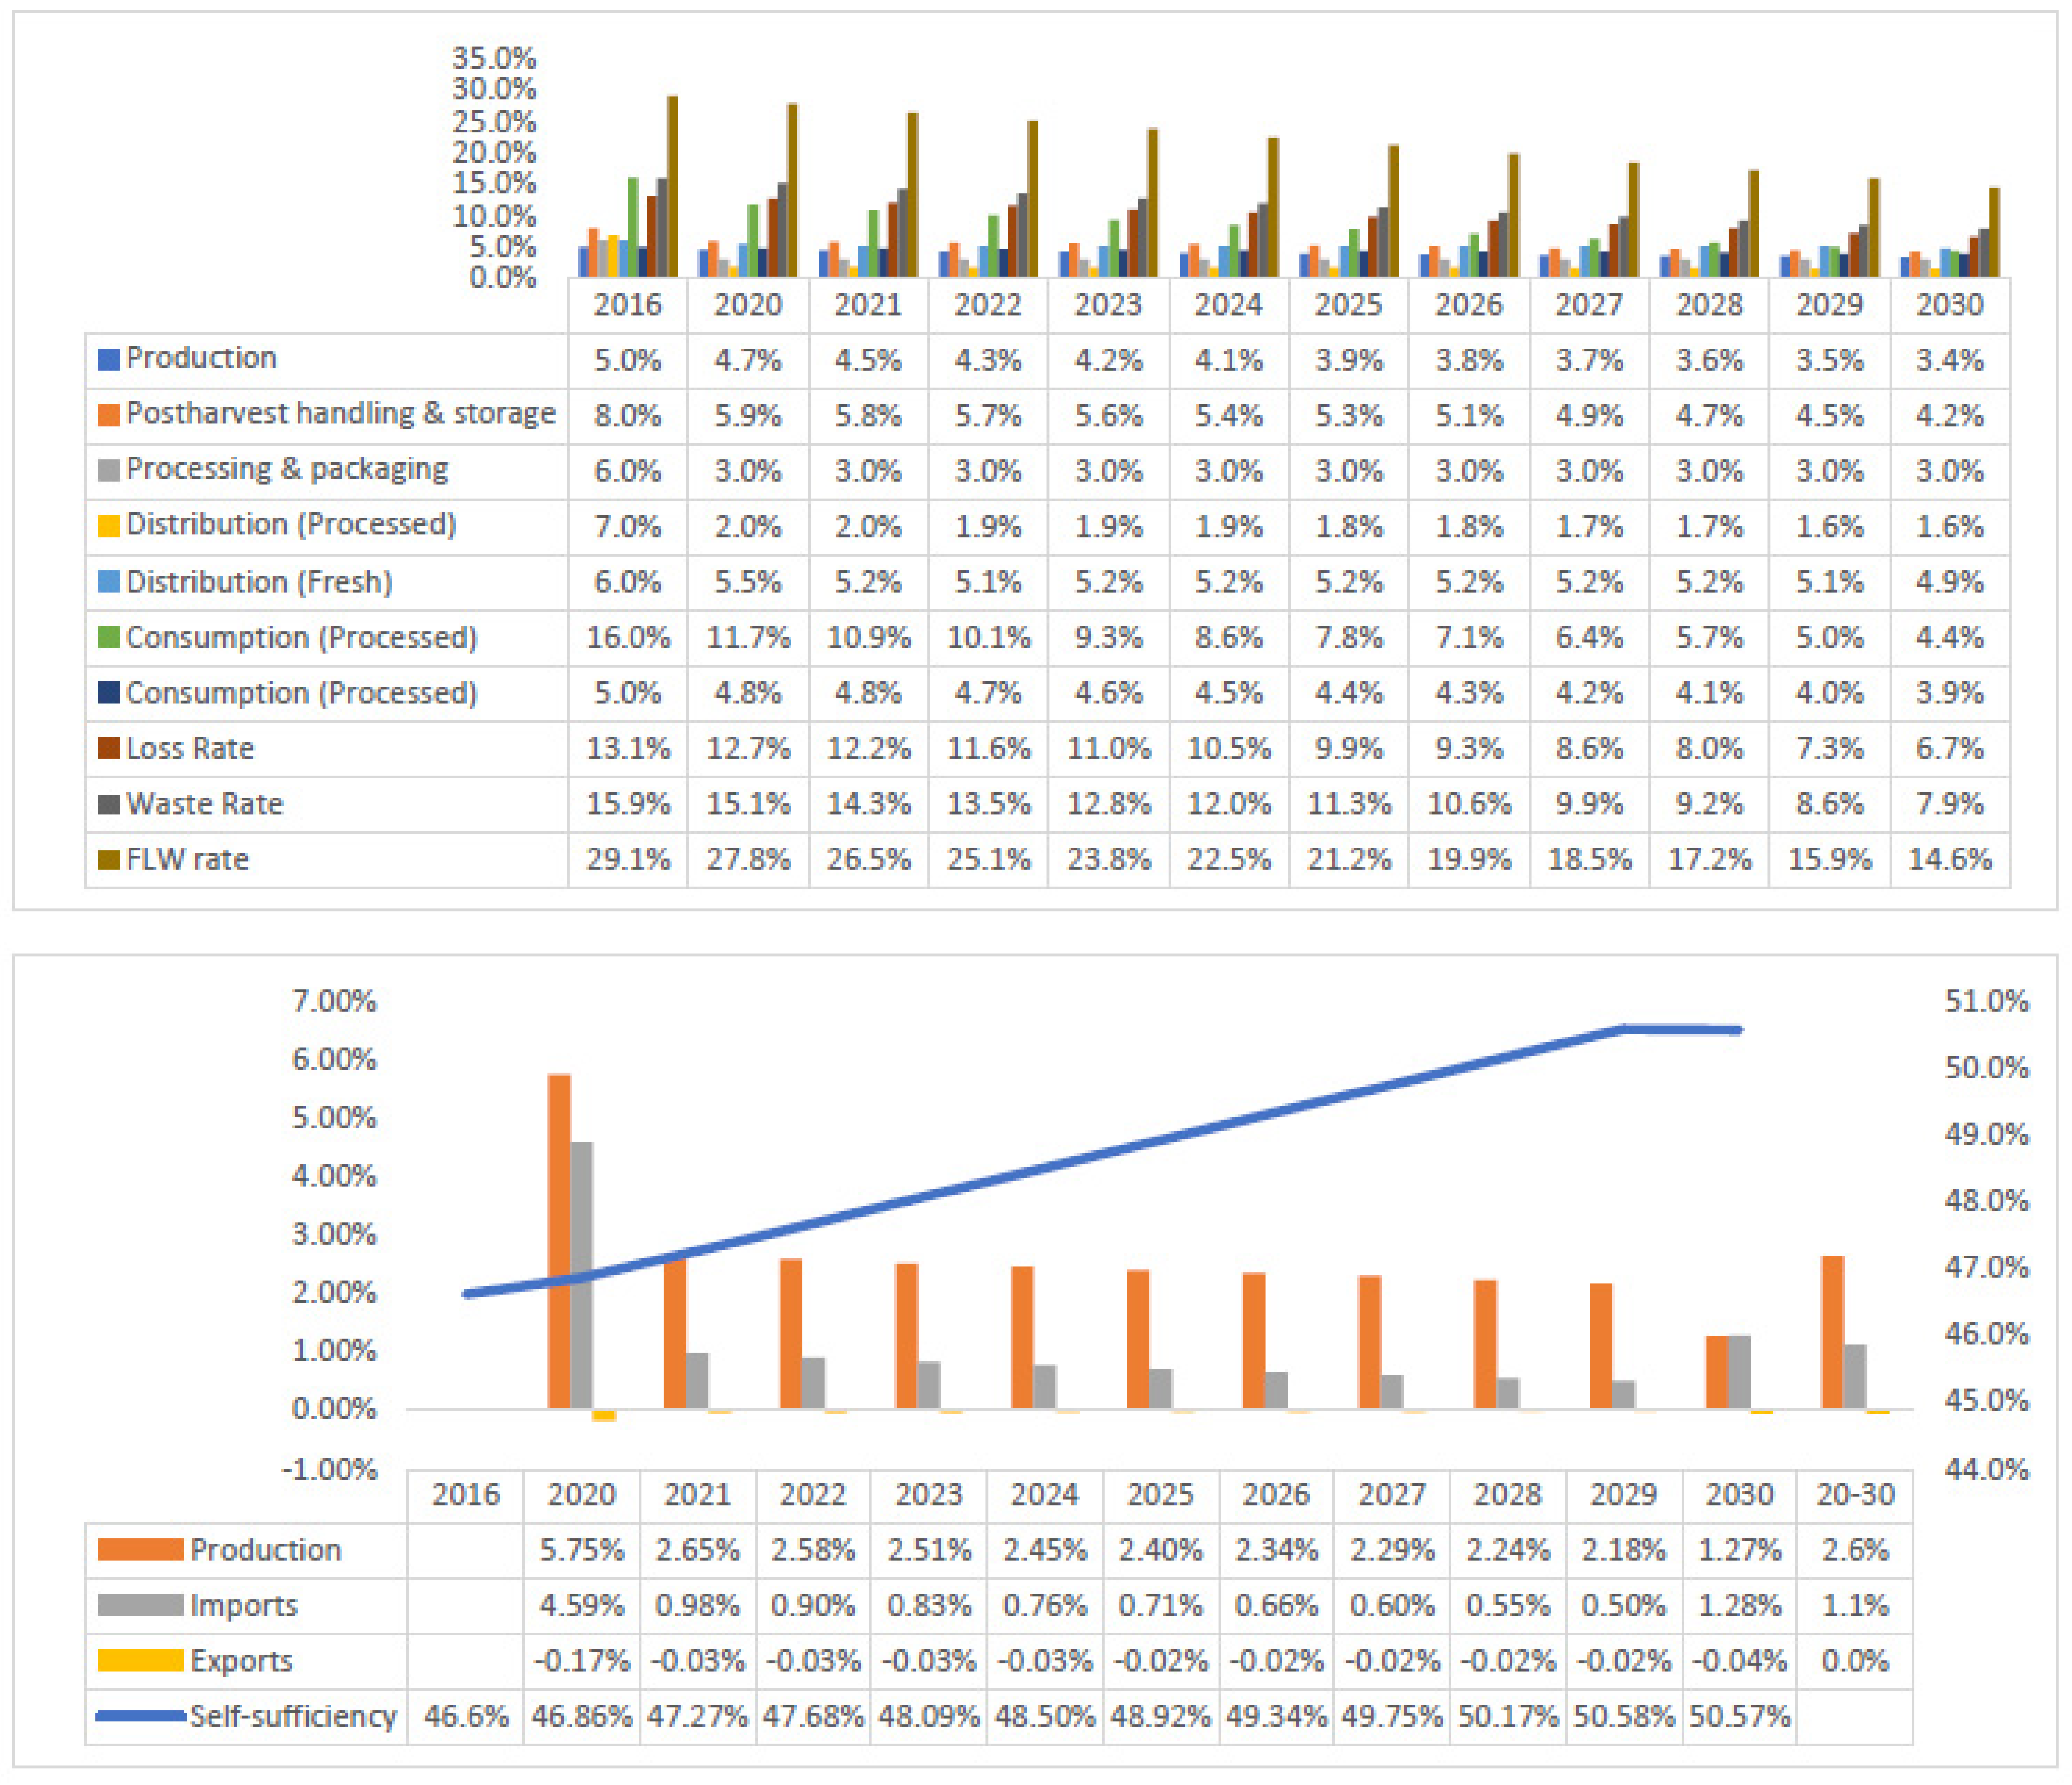
Figure 10 shows the results of the poultry’s simulation model. Reducing the loss and waste rates in Poultry by 50% by the end of 2030, compared to its level in 2016, calls for reducing the loss rate in the production stage of FSC from 5% to 3.4%, in postharvest, handling, and storage stage from 8% to 4.2%, in processing and packaging stage from 6% to 3%, in distribution stage of FSC from 7% in 2016 to 1.6% by 2030 for fresh poultry and from 6% to 4.9% for manufactured poultry, and finally, reducing the waste rate in consumption from 16% to 4.4% for fresh poultry and from 5% to 3.9% for manufactured poultry between 2016 and 2020. Moreover, the reduction of poultry’s FLW rate by 50% will make it possible for Saudi Arabia to augment its national production of poultry at an average annual rate of 2.6% during the period 2020–2030. The self-sufficiency ratio of poultry will rise from 46.6% in 2016 to 50.6% by 2030. The reduction of FLW will consequently lower the import’s growth rate from 4.59% for the period 2016–2020 to 1.28% by 2029–2030.
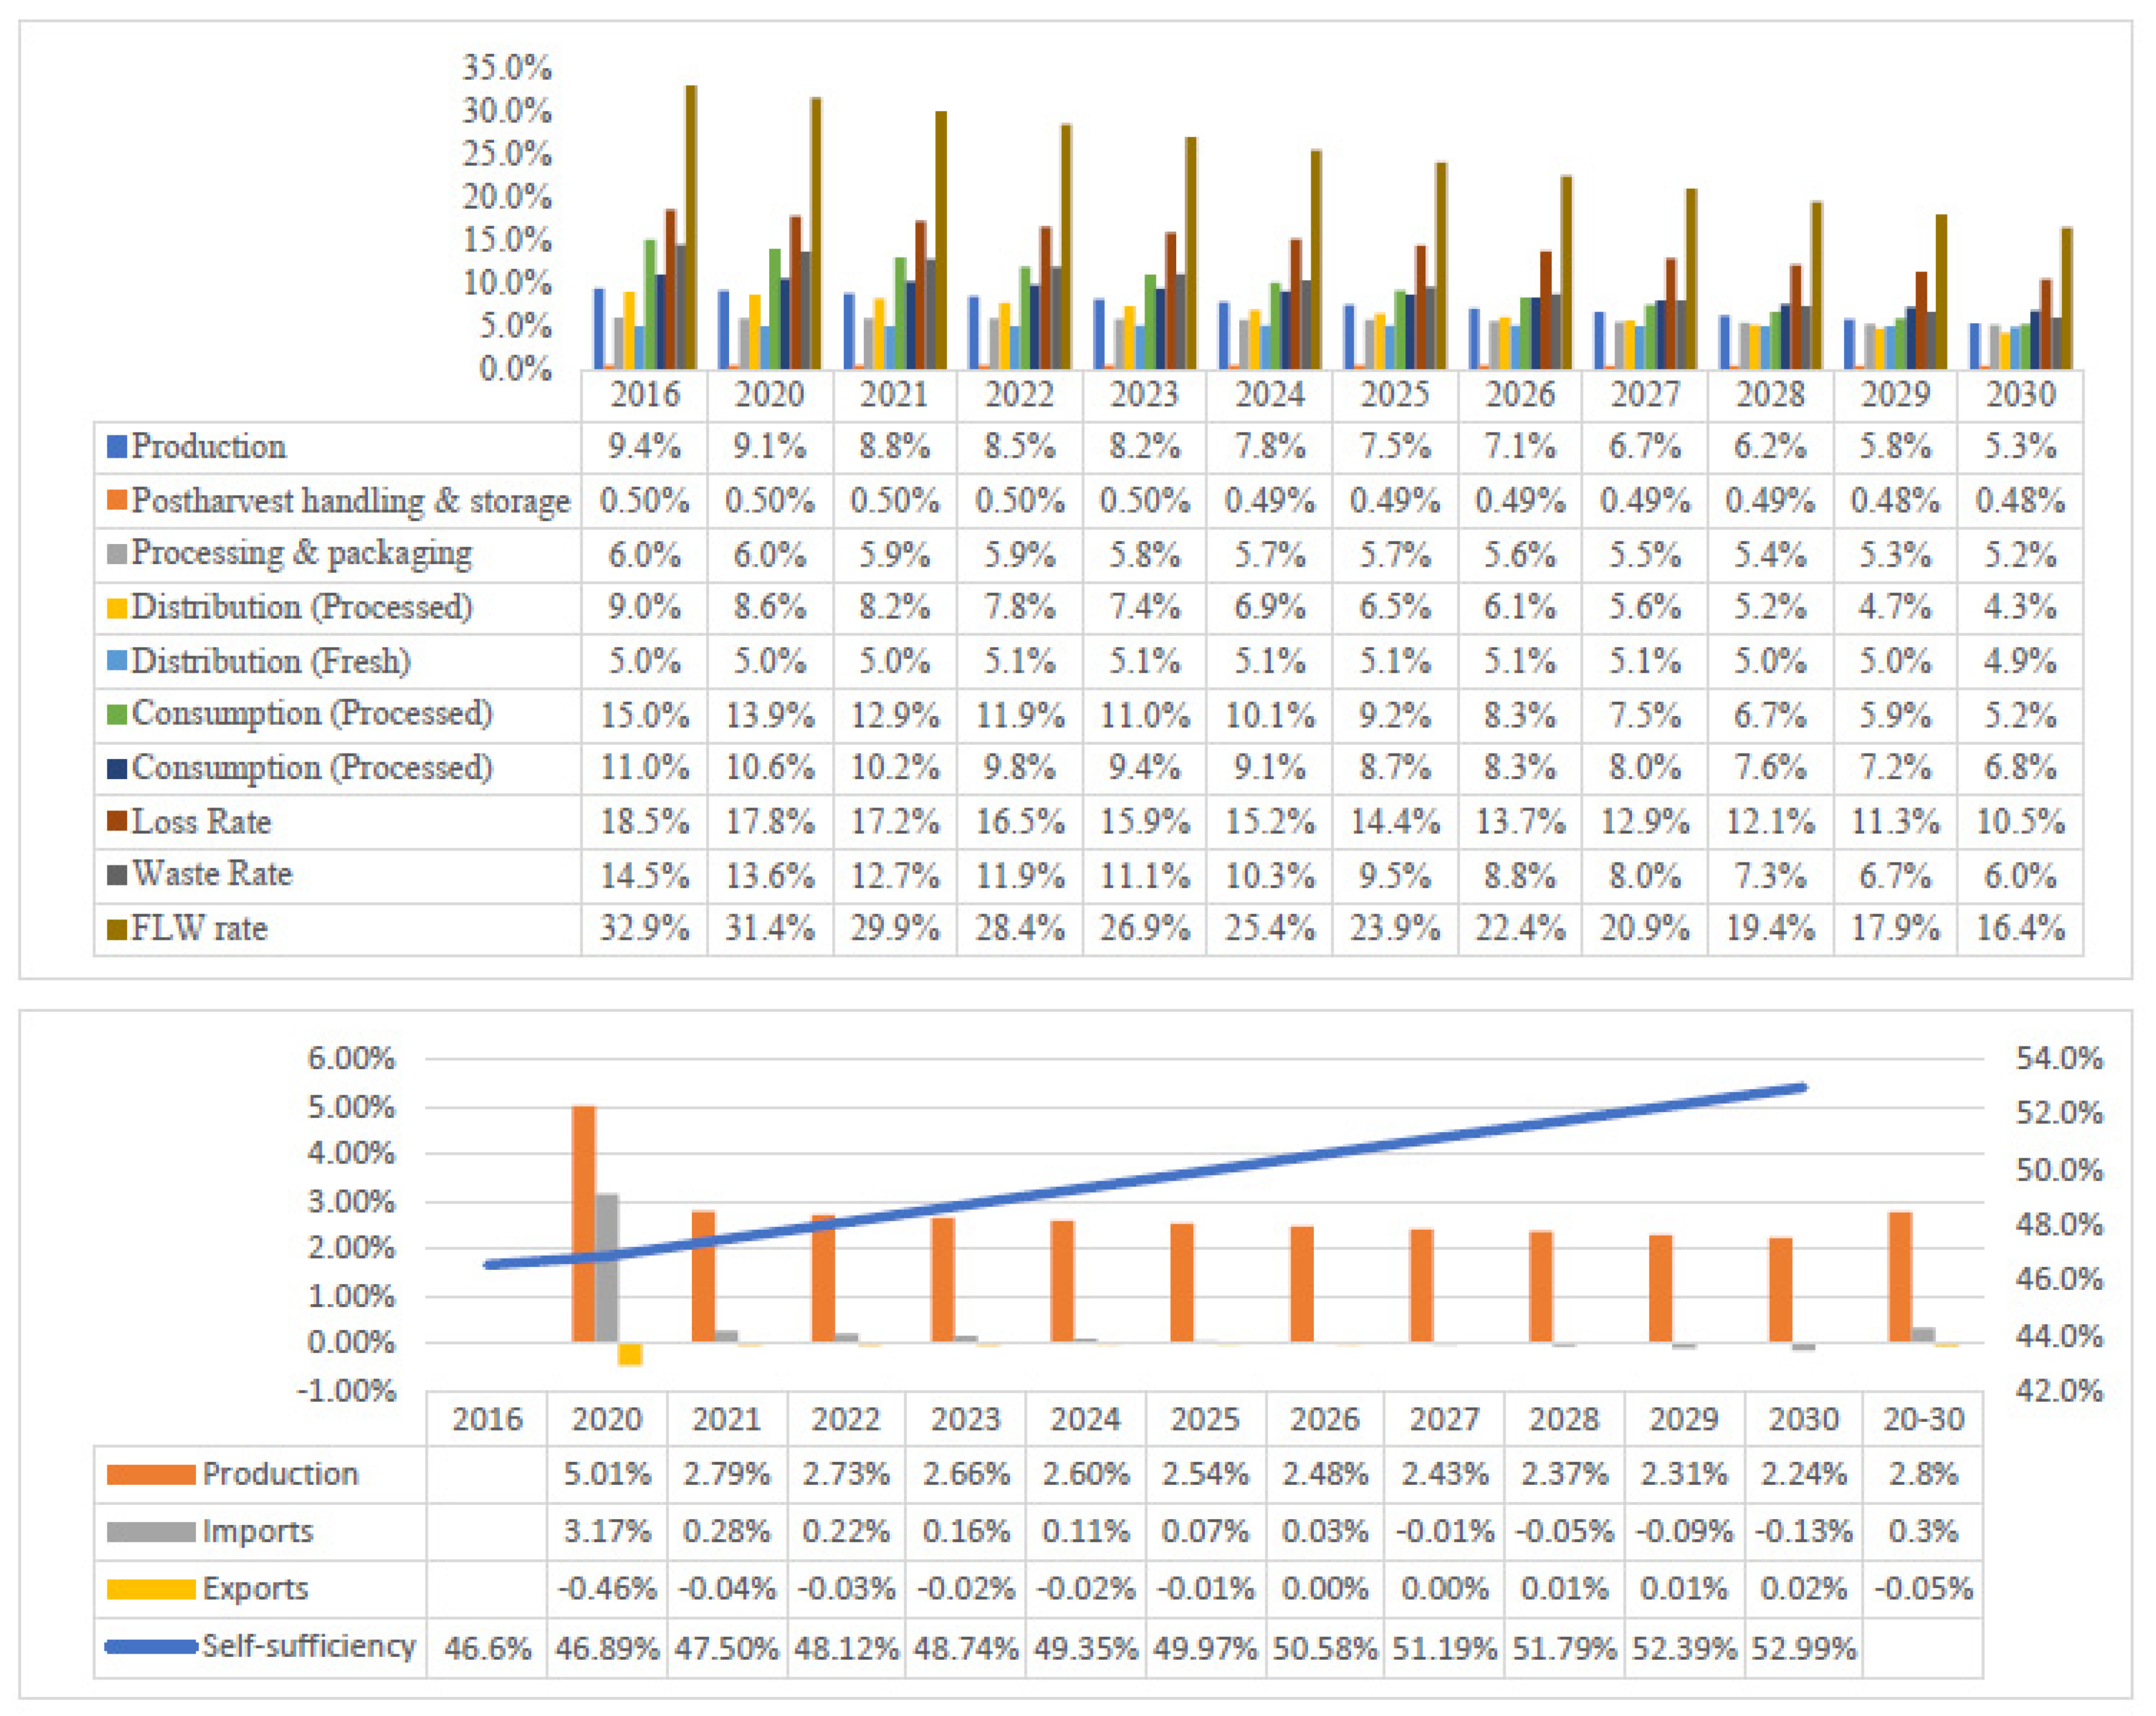
Figure 11 gives the results of the fish’s simulation model. Reaching the objective of reducing the loss and waste rates in fish by 50% by the end of 2030, compared to its level in 2016, necessarily entails reducing the loss rate in the production level of FSC from 9.4% in 2016 to 5.3% in 2030, in the distribution stage of FSC from 9% in 2016 to 4.3% by 2030, and reducing the waste rate in consumption from 15% in 2016 to 5.2% in 2030 for fresh fish and from 11% to 6.8% for manufactured fish.
In addition, the reduction of fish’s FLW rate by 50% will allow Saudi Arabia to increase its national production of fish at an average annual rate of 2.8% during the period 2020–2030. The self-sufficiency ratio of fish will increase from 46.6% in 2006 to 53% by 2030. We also note that the reduction in FLW will reduce the import’s growth rate from 3.17% for the period 2016–2020 to 0.3% by 2029–2030.
6. Recommendations
The results of quantifying FLW and the national study project to reduce food loss and waste have reached several action tasks to be taken as recommendations to reduce the food loss and waste. In view of the findings of this study, the issue of reducing food loss and waste in Saudi Arabia requires concerted efforts by many parties and the adoption of new policies and programs. In this context, we can present a set of recommendations that would achieve this goal. These recommendations consist of a set of procedures that are expected to be followed in the short and medium term and include almost all stages of the supply chain to reduce food loss and waste.
Saudi Arabia relies heavily on imports to cover its food needs. Here, new measures must be adopted to reduce food loss when importing grains, rice, vegetables, and meat through more investment in the infrastructure for unloading, transporting, and storing these products. In the field of cereals, for example, successful experiences in Sudan can be benefited from using bags in the form of silos, where a study [
32] showed that this method ‘allows grain to be stored in a safe and economically viable system that preserves the quality of the grain for a long time’, and it reduces the spread of insects
Saudi Arabia also produces significant quantities of other foods such as dates, chicken, and fish, but it needs to further improve the refrigerated storage capacity to accommodate the produced quantities and maintain its quality for a long time. The study also recommends reconsidering the map of plant and animal production areas and distributing them geographically in a way that contributes to bringing production closer to distribution centres and thus reducing the quantities lost. Moreover, a large loss of food occurs at the level of the retail stage, and it is necessary to develop new ways to display and sell products based on smart packaging methods and improve techniques for doing business, such as production and inventory management to avoid spoilage and rotting of the offered products.
Disposing of imports, production, and inventory management requires high technical and human capabilities. In this context, modern machinery must be provided at differential prices that enable farmers to collect crops quickly and at an acceptable cost, even if the quantities of those crops are small. Workers also need specialised training and professional courses at all stages of the food supply chain, especially in slaughterhouses, major markets, retail stores, and fish farming.
Many farmers and animal breeders still adopt traditional methods of production and are in urgent need of awareness, guidance, and education. It is necessary to intensify programs and initiatives that help them identify good seeds and modern methods and techniques to raise production efficiency, resist pests, and reduce losses in the preharvest, during harvest, and postharvest stages.
Consumption habits in weddings, banquets, and festivals result in wasting large quantities of food. In this regard, the study recommends the need to reconsider the subsidy policy in the direction of gradual lifting of subsidies in bread and rice It is also possible to review the current weight of bread, estimated at 510 g for one riyal, and reduce it in half (i.e., 250 g). Among the solutions proposed for the disposal of surplus food is the recycling of food waste and organic waste to produce soil conditioners and fertilisers. More support is also expected for charitable work, which aims to preserve food and redistribute it to poor families and needy individuals. The ‘Etaam’ charity initiative is one of the initiatives that must be encouraged.
It remains that reducing food waste is mainly related to the consumption behaviour of the individual, and in this context, it is necessary to educate the consumer about the necessity of planning and controlling purchases. Encouraging scientific research in universities and professional and agricultural colleges and searching for foreign markets to promote the large surplus in local production, especially of dates.
7. Conclusions
In this study, using the methodology proposed by Gustavsson et al. (2013) and FAO (2014), we estimated the food loss and waste (FLW) rates in Saudi Arabia for eight aggregated products, namely, wheat, rice, dates, poultry, vegetables, fruits, fish, and meat. We conducted a comprehensive survey of food loss and waste throughout the food supply chain, which covers 33 sites of 6 food supply chains (FSCs) (agricultural/animal farms, postharvest (processing and storage), processing and packaging, distribution, consumers (food industries, households), 35 cities in 13 administrative districts of the Kingdom of Saudi Arabia—19 dried and fresh foods in 8 categories (wheat, rice, dates, vegetables, fruits, meat (camel/sheep), chicken, and fish), with a poll of more than 5000 participants, using 5 scientific methods.
The empirical results showed that the baseline FLW rate is equal to 33.1% of the available food, where the loss and waste rates are 14.2% and 18.9%, respectively. In addition, the FLW rates for 8 products (wheat, rice, dates, poultry, vegetables, fruits, fish, and meat) are 29.7% (of which 5% is food loss and 24.7% for the waste), 33.6% (of which 3% is food loss and 30.6% for the waste), 21.4% (of which 15.6% is food loss and 5.8% for the waste), 29.1% (of which 13.2% is food loss and 15.9% for the waste), 39.4% (of which 24.5% is food loss and 14.9% for the waste), 39.6% (of which 24.3% is food loss and 15.3% for the waste), 33.0% (of which 18.5% is food loss and 14.5% for the waste), and 31.3% (of which 16.4% is food loss and 14.9% for the waste), respectively.
Distribution contributes the most to postharvest losses for all types of food (16.8% for wheat, 9% for rice, 26% for poultry, 27% for dates, 12.9% for vegetables, 14.4% for fruits, 31% for fish, and 31.3% for meat. and 15.9% for meats). One notable reason behind this is the failure of distribution methods between suppliers and markets to respect the conditions of cooling and leading to the destruction of massive quantities of meats.
To achieve the SDG 12.3 target that aims to reduce the FLW rates by 50% in 2030, we performed a nonlinear optimisation simulation model, which consists of cutting the FLW rate by 5% of its previous level over the period 2020–2030 as the target. The solutions of the simulated model are the optimal FLW percentages at various stages of FSC, and the optimal supply inputs, namely, imports, production, exports, and stocks. The empirical results suggest that different stakeholders must act to reduce FLW rates mainly in the distribution and consumption stages of FSC. Moreover, the actions to reduction FLW rates allow a reduction in the growth of imports of the eight aggregated products, and increase the food self-efficiency, therefore enhancing Saudi food security.
Author Contributions
Conceptualisation, Z.A. and A.A.; data curation, A.A. and H.B.H.; formal analysis, H.B.H., I.M., A.G., A.T. and M.A.A.; funding acquisition, Z.A.; investigation, A.A., H.B.H., I.M., A.G. and A.T.; methodology, Z.A., A.A. and H.B.H.; project administration, Z.A. and A.A.; resources, A.A., H.B.H., I.M., A.G. and A.T.; software, H.B.H.; supervision, Z.A. and A.A.; validation, Z.A., A.A. and H.B.H.; visualisation, A.A., H.B.H., I.M., A.T., A.G. and M.A.A.; writing—original draft preparation, H.B.H., I.M., A.G., A.T. and M.A.A.; writing—review and editing, A.A., H.B.H., I.M., A.G., A.T., M.A.A. and K.A.G. All authors have read and agreed to the published version of the manuscript.
Funding
The research was funded by Ministry of Environment, Water and Agriculture (MEWA) and the Saudi Grains Organization (SAGO), Saudi Arabia. The APC was funded by Ministry of Environment, Water and Agriculture (MEWA) and the Saudi Grains Organization (SAGO), Saudi Arabia.
Institutional Review Board Statement
Not Applicable.
Informed Consent Statement
Not Applicable.
Data Availability Statement
Not Applicable.
Acknowledgments
The authors of this paper express their gratitude to the Government of Saudi Arabia, especially the Ministry of Environment, Water, and Agriculture (MEWA) and the Saudi Grains Organisation (SAGO) for sponsoring this study. Special thanks to HE Eng. Abdulrahman bin Abdul Mohsen Al Fadhli, the Minister of Environment, Agricultural and Water (MEWA) and HE Eng. Ahmad bin Abdulaziz Al-Fares, the Governor of SAGO. Our thanks also to the team, who conducted this study and the over 865 volunteers, who worked hard to collect 50 thousand samples from 35 cities around Saudi Arabia. To all of you, may this work be the least way to express our thanks and gratitude.
Conflicts of Interest
The authors declare no conflict of interest.
Appendix A
Table A1.
Total amount of Vegetables’ FLW in 1000 tons and share (in %) of the individual stages of the food chain in total amount of FLW.
Table A1.
Total amount of Vegetables’ FLW in 1000 tons and share (in %) of the individual stages of the food chain in total amount of FLW.
| | | Production | Postharvest | Packaging and Storage | Distribution | Consumption | Total Loss | Total Waste | Total FLW |
|---|
| Potatoes | quantity | 104.1 | 4.2 | 2.3 | 22.7 | 67.4 | 133.3 | 67.4 | 200.7 |
| | share | 52 | 2 | 1 | 11 | 34 | 66 | 34 | 100 |
| Carrots | quantity | 8.8 | 0.4 | 0.5 | 4.4 | 12.7 | 14.1 | 12.7 | 26.8 |
| | share | 33 | 2 | 2 | 16 | 47 | 53 | 47 | 100 |
| zucchini | quantity | 18.5 | 0.9 | 0 | 4.2 | 14.2 | 23.5 | 14.2 | 37.7 |
| | share | 49 | 2 | 0 | 11 | 38 | 62 | 38 | 100 |
| Cucumber | quantity | 39.4 | 2 | 0 | 8.1 | 32 | 49.5 | 32 | 81.5 |
| | share | 48 | 2 | 0 | 10 | 39 | 61 | 39 | 100 |
| Onions | quantity | 17.1 | 0.9 | 0 | 19.3 | 72.4 | 37.2 | 72.4 | 109.6 |
| | share | 16 | 1 | 0 | 18 | 66 | 34 | 66 | 100 |
| Tomatoes | quantity | 96.9 | 4.8 | 2.4 | 31.6 | 97.8 | 135.7 | 97.8 | 233.5 |
| | share | 41 | 2 | 1 | 14 | 42 | 58 | 42 | 100 |
| Unclassified vegetables | quantity | 181.9 | 5.5 | 8.3 | 37.4 | 101.9 | 233 | 101.9 | 334.9 |
| | share | 54 | 2 | 2 | 11 | 30 | 70 | 30 | 100 |
| All Vegetables | quantity | 466.657 | 18.666 | 13.461 | 132.325 | 393.645 | 631.109 | 393.645 | 1024.755 |
| | share | 45.54 | 1.82 | 1.31 | 12.91 | 38.41 | 62 | 38 | 100 |
Table A2.
Total amount of Fruits FLW in 1000 tons and share (in %) of the individual stages of the food chain in total amount of FLW.
Table A2.
Total amount of Fruits FLW in 1000 tons and share (in %) of the individual stages of the food chain in total amount of FLW.
| | | Production | Postharvest | Packaging and Storage | Distribution | Consumption | Total Loss | Total Waste | Total FLW |
|---|
| Watermelon | quantity | 39 | 43 | 0 | 37 | 34 | 120 | 34 | 153 |
| | share | 35 | 23 | 2 | 21 | 18 | 82 | 18 | 100 |
| Mango | quantity | | | 0.5 | 5.91 | 5.42 | 6.41 | 5.42 | 11.83 |
| | share | | | 4 | 50 | 46 | 54 | 46 | 100 |
| Orange | quantity | | | 1.347 | 18.332 | 49.088 | 19.679 | 49.088 | 68.768 |
| | share | | | 2 | 27 | 71 | 29 | 71 | 100 |
| Unclassified fruits | quantity | 3.45 | 275.3 | 2.58 | 59.33 | 267.01 | 340.66 | 267.01 | 607.67 |
| | share | 0.60 | 45 | 0.40 | 10 | 44 | 56 | 44 | 100 |
| All-fruits | quantity | 314.42 | 46.05 | 4.92 | 120.94 | 355.23 | 486.33 | 355.23 | 841.56 |
| | share | 37.4 | 5.5 | 0.6 | 14.4 | 42.2 | 57.8 | 42.2 | 100 |
Table A3.
Total amount of Meats and All-products FLW in 1000 tons and share (in %) of the individual stages of the food chain in total amount of FLW.
Table A3.
Total amount of Meats and All-products FLW in 1000 tons and share (in %) of the individual stages of the food chain in total amount of FLW.
| | | Production | Postharvest | Packaging and Storage | Distribution | Consumption | Total Loss | Total Waste | Total FLW |
|---|
| Sheep | quantity | 2.66 | 3.33 | 0.61 | 3.63 | 11.49 | 10.23 | 11.49 | 21.72 |
| | share | 12 | 15 | 3 | 17 | 53 | 47 | 53 | 100 |
| Beef | quantity | 3.13 | 8.35 | 1.64 | 8.12 | 19.57 | 21.24 | 19.57 | 40.81 |
| | share | 8 | 20 | 4 | 20 | 48 | 52 | 48 | 100 |
| Camel | quantity | 3.03 | 2.91 | 0.22 | 1.92 | 4.98 | 8.084 | 4.976 | 13.06 |
| | share | 23 | 22 | 2 | 15 | 38 | 62 | 38 | 100 |
| Meats | quantity | 8.82 | 14.60 | 2.47 | 13.67 | 36.04 | 39.55 | 36.04 | 75.59 |
| | share | 11.7 | 19.3 | 3.3 | 18.1 | 47.7 | 52 | 48 | 100 |
| All-products | quantity | 870.87 | 175.97 | 43.21 | 646.00 | 2329.90 | 1736.06 | 2329.90 | 4065.96 |
| | share | 21.4% | 4.3% | 1.1% | 15.9% | 57.3% | 42.7% | 57.3% | 100.0% |
Table A4.
Projected populations and available food.
Table A4.
Projected populations and available food.
| | Projected Population | Available Food |
|---|
| | | Wheat | Rice | Dates | Fruits | Vegetables | Meat | Poultry | Fish |
|---|
| 2016 | 32.44 | 3073.90 | 1658.00 | 496.93 | 2078.41 | 2189.96 | 228.40 | 1584.48 | 202.23 |
| 2020 | 35.02 | 3242.81 | 1749.11 | 672.10 | 2436.24 | 2717.99 | 240.95 | 1671.54 | 222.23 |
| 2021 | 35.67 | 3302.51 | 1781.31 | 684.47 | 2481.09 | 2768.03 | 245.39 | 1702.31 | 226.32 |
| 2022 | 36.30 | 3360.87 | 1812.78 | 696.57 | 2524.93 | 2816.95 | 249.72 | 1732.40 | 230.32 |
| 2023 | 36.92 | 3418.02 | 1843.61 | 708.41 | 2567.87 | 2864.85 | 253.97 | 1761.86 | 234.24 |
| 2024 | 37.52 | 3474.12 | 1873.87 | 720.04 | 2610.02 | 2911.87 | 258.14 | 1790.77 | 238.08 |
| 2025 | 38.12 | 3529.30 | 1903.63 | 731.48 | 2651.47 | 2958.12 | 262.24 | 1819.21 | 241.87 |
| 2026 | 38.71 | 3583.62 | 1932.93 | 742.73 | 2692.28 | 3003.65 | 266.28 | 1847.21 | 245.59 |
| 2027 | 39.28 | 3637.05 | 1961.75 | 753.81 | 2732.42 | 3048.43 | 270.25 | 1874.76 | 249.25 |
| 2028 | 39.85 | 3689.46 | 1990.02 | 764.67 | 2771.80 | 3092.36 | 274.14 | 1901.77 | 252.84 |
| 2029 | 40.40 | 3740.63 | 2017.62 | 775.28 | 2810.24 | 3135.25 | 277.94 | 1928.15 | 256.35 |
| 2030 | 40.94 | 3790.40 | 2044.46 | 785.59 | 2847.63 | 3176.96 | 281.64 | 1953.80 | 259.76 |
References
- FAO. Food Wastage Footprint: Impacts on Natural Resources. Summary Report; FAO: Rome, Italy, 2013; Available online: http://www.fao.org/3/i3347e/i3347e.pdf (accessed on 25 March 2021).
- FAO; IFAD; UNICEF; WFP; WHO. The State of Food Security and Nutrition in the World 2021. Transforming Food Systems for Food Security, Improved Nutrition and Affordable Healthy Diets for All; FAO: Rome, Italy, 2021. [Google Scholar] [CrossRef]
- Food Loss and Waste Protocol. Food Loss and Waste Accounting and Reporting Standard (VERSION 1.0). Available online: https://www.flwprotocol.org/wp-content/uploads/2017/05/FLW_Standard_final_2016.pdf (accessed on 5 May 2019).
- Gustavsson, J.; Cederberg, C.; Sonesson, U.; Emanuelsson, A. The methodology of the FAO study. In Global Food Losses and Food Waste—Extent, Causes and Prevention; FAO: Rome, Italy, 2011. [Google Scholar]
- European Commission. Commission Staff Working Paper SEC (2011) 1067 Final, Analysis Associated with the Roadmap to a Resource Efficient Europe. Available online: https://ec.europa.eu/environment/resource_efficiency/pdf/working_paper_part1.pdf (accessed on 25 March 2021).
- Lunqvist, J.; De Fraiture, C.; Molden, D.J.; Berndes, G. Saving Water: From Field to Fork: Curbing Losses and Wastage in the Food Chain; Stockholm International Water Institute: Stockholm, Sweden, 2008; Volume 273, p. 17. [Google Scholar]
- Bio Intelligence Service. Preparatory Study on Food Waste across EU 27; European Commission-Directorate C-Industry: Paris, France, 2010. [Google Scholar]
- Affognon, H.; Mutungi, C.; Sanginga, P.; Borgemeister, C. Unpacking Postharvest Losses in Sub-Saharan Africa: A Meta-Analysis. World Dev. 2015, 66, 49–68. [Google Scholar] [CrossRef] [Green Version]
- FAO. The Agriculture and Food of State; Agriculture Series, n 14; FAO: Rome, Italy, 1980. [Google Scholar]
- FAO. Definitional Framework of Food Loss; Working Paper; Save Food & Food and Agriculture Organization of the United Nations: Rome, Italy, 2014. [Google Scholar]
- Stuart, T. Waste: Uncovering the Global Food Scandal; WW Norton Co.: London, UK, 2009. [Google Scholar]
- WRAP. Estimates of Waste in the Food and Drink Supply Chain; Waste and Resources Action Programme: London, UK, 2013. [Google Scholar]
- Östergren, K.; Gustavsson, J.; Bos-Brouwers, H.; Timmermans, T.; Hansen, O.-J.; Møller, H.; Anderson, G.; O’Connor, C.; Soethoudt, H.; Quested, T.; et al. Fusions Definitional Framework for Food Waste; Full Report; SIK-The Swedish Institute for Food and Biotechnology: Göteborg, Sweden, 2014. [Google Scholar]
- Alexander, P.; Brown, P.; Arneth, A.; Finnigan, J.; Moran, D.; Rounsevell, M.D. Losses, inefficiencies, and waste in the global food system. Agric. Syst. 2017, 153, 190–200. [Google Scholar] [CrossRef] [PubMed]
- Chabous, G.; Daviron, B. Food losses and waste: Navigating the inconsistencies. Glob. Food Secur. 2017, 12, 1–7. [Google Scholar] [CrossRef]
- Bräutigam, K.R.; Jörissen, J.; Priefer, C. The extent of food waste generation across EU-27: Different calculation methods and the reliability of their results. Waste Manag. Res. 2014, 32, 683–694. [Google Scholar] [CrossRef]
- Jacobs, K.; Sumner, D.A. The Food Balance Sheets of the Food and Agriculture Organization: A Review of Potential Ways to Broaden the Appropriate Uses of the Data; FAO: Rome, Italy, 2002. [Google Scholar]
- Kummu, M.; De Mole, H.; Pokka, M.; Siebert, S.; Varies, O.; Ward, P.J. Lost food, waste resources: Global food supply chain losses and their impacts on freshwater, cropland, and fertilizer use. Sci. Total Environ. 2012, 438, 477–489. [Google Scholar] [CrossRef] [PubMed]
- Garcia-Garcia, G.; Wooley, E.; Rahimifard, S.; Colwill, J.; White, R.; Needham, L. A methodology for sustainable management of food waste. Waste Biomass Valorization 2017, 8, 2209–2227. [Google Scholar] [CrossRef] [Green Version]
- Buzby, J.C.; Hyman, J. Total and per capita value of food loss in the United States. Food Policy 2012, 37, 561–570. [Google Scholar] [CrossRef]
- Quested, T.; Parry, A. New Estimates for Household Food and Drink Waste in the UK; Waste & Reources Action Programme (WRAP): London, UK, 2011. [Google Scholar]
- Myers, D. 10 Mind-Blowing Facts about Food Waste in America. Available online: https://www.thedailymeal.com/10-mind-blowing-facts-about-food-waste-america (accessed on 17 November 2019).
- Modin, R. Livsmedelssvinn i Hushll och Skolor: En Kunskapssammanställning; National Food Administration, Livsmedels Verket: Stockholm, Sweden, 2011. [Google Scholar]
- Baig, M.B.; Al-Zahrani, K.H.; Schneider, F.; Straquadine, G.S.; Mourad, M. Food waste posing a serious threat to sustainability in the kingdom of Saudi Arabia—A systematic review. Saudi J. Biol. Sci. 2019, 26, 1743–1753. [Google Scholar] [CrossRef]
- Baig, M.B.; Gorski, I.; Neff, R.A. Understanding and addressing waste of food in the kingdom of Saudi Arabia. Saudi J. Biol. Sci. 2019, 26, 1633–1648. [Google Scholar] [CrossRef] [PubMed]
- Tolba, M.K.; Saab, N.W. Arab Environment Future Challenges; Arab Forum for Environment and Development: Beirut, Lebanon, 2008. [Google Scholar]
- Saudi General Authority for Statistics. Annual Report of Foreign Trade Statistics. SA. 2016. Available online: https://www.stats.gov.sa/sites/default/files/annual_report_2016_en.pdf (accessed on 11 November 2017).
- Arab Organisation for Agricultural Development. Arab Agriculture Statistics Yearbook 2016; AOAD: Khartoum, Sudan, 2017. [Google Scholar]
- FAOSTAT. Food Balances (2014–); FAO: Rome, Italy, 2014. [Google Scholar]
- Food Loss and Waste Protocol. Guidance on FLW Quantification Methods. Available online: https://www.flwprotocol.org/wp-content/uploads/2016/05/FLW_Protocol_Guidance_on_FLW_Quantification_Methods.pdf (accessed on 5 May 2019).
- SAGO. Saudi FLW Baseline: Food Loss & Waste Index in Kingdom of Saudi Arabia. Available online: https://www.sago.gov.sa/Content/Files/Baseline_230719.pdf (accessed on 15 March 2019).
- FAO; ESCWA. Arab Horizon 2030: Prospects for Enhancing Food Security in the Arab Region; UN Technical Summary; FAO: Rome, Italy, 2017. [Google Scholar]
| Publisher’s Note: MDPI stays neutral with regard to jurisdictional claims in published maps and institutional affiliations. |
© 2021 by the authors. Licensee MDPI, Basel, Switzerland. This article is an open access article distributed under the terms and conditions of the Creative Commons Attribution (CC BY) license (https://creativecommons.org/licenses/by/4.0/).


 ,
, 


