Article

Implications of Social Isolation in Combating COVID-19 Outbreak in Kingdom of Saudi Arabia: Its Consequences on the Carbon Emissions Reduction

by
Mary Oluwatoyin Agboola
1,*,
Festus Victor Bekun
2 and
Daniel Balsalobre-Lorente
3
1
Finance and Banking Department, College of Business, Dar Al Uloom University, Riyadh 13314, Saudi Arabia
2
Department of International Logistics and Transportation, Faculty of Economics Administrative and Social Sciences, Istanbul Gelisim University, Istanbul 34310, Turkey
3
Department of Political Economy and Public Finance, Economics and Business Statistics and Economic Policy, University of Castilla-La Mancha, 13001 Ciudad Real, Spain
*
Author to whom correspondence should be addressed.
Sustainability 2021, 13(16), 9476; https://0-doi-org.brum.beds.ac.uk/10.3390/su13169476
Submission received: 27 July 2021 / Revised: 18 August 2021 / Accepted: 19 August 2021 / Published: 23 August 2021
(This article belongs to the Special Issue Energy Transition amidst Global Energy Demand and Trade Studies)

Abstract

:
The aftermath of the COVID-19 pandemic has two striking impacts on the economy of the Kingdom of Saudi Arabia. First, the economic contraction of business and economic activities. Second, the effect of oil prices dropping as energy demand decreases in the international market. This study seeks to underpin the linkage between GDP growth, oil price, foreign direct investment (FDI), air transport, social globalization and carbon dioxide emission by applying time-series econometrics techniques of the following: fully modified ordinary least squares, dynamic ordinary least squares and canonical tests. The results of the Johansen cointegration test and empirical analysis trace a long-run equilibrium relationship between the highlighted variables. Our study shows that a 1% increase in FDI attraction increases economic growth by 0.004%; similarly, air transport and oil rent from KSA increased economic growth by 0.547% and 0.005%, respectively. These outcomes are indicative of the GDP growth ambition of the KSA economy in order to intensify FDI attraction and the air transportation sector. However, we also observe that increases in CO2 emission increase GDP growth. Thus, this suggests that the economic growth in KSA is not green, indicating the need for green economic growth pursuit targets.

1. Introduction

The present study is motivated by the lack of a definitive agreement in the literature on the nexus between energy consumption and economic growth. Most evident in the literature support are the varying hypotheses that include energy-induced growth, the conservative hypothesis, the feedback relationship and the neutrality hypothesis and much more [1,2]. This study aligns with the United Nations Sustainable Development Goals (UN-SDGs 7, 8, 11,12 and 13). These goals range from access to clean and responsible energy consumption, sustainable economic growth and mitigation of climate change issues. These goals align with the Kingdom of Saudi Arabia’s sustainability targets. Over the last decade, there have been dwindling prices of energy products at the international market, especially crude oil prices, with a record time more recently of zero [3,4,5]. The prevalence of crude oil in the global energy mix reveals that crude oil is pertinent and the most chased after energy source worldwide. The Kingdom of Saudi Arabia’s (KSA hereafter) economy strives on crude oil, with heavy dependence, as a major source of government revenue as a net exporter and major sharer of the energy mix. This study seeks to examine the relationship between energy, oil prices, foreign direct investment and air transport in the context of the present COVID-19 pandemic period as it relates to KSA.
It is well known that most economies have yet to fully recover from the aftermath of the global financial shock of 2008–2009, as outlined in the study of [6]. Furthermore, the recent global COVID-19 pandemic, which originated from Wuhan, China, has its ripple effects and implications on the global economy, with KSA being no exception [7]. The implication is evident with the reduction in global oil prices, destruction of energy patterns, suspension of air and land travel in KSA and the globe in general and reduction in industrial production activities and its effect on reducing pollutant emission (CO2). These highlighted effects have consequences on key macroeconomic indicators and the socioeconomic well-being of citizenry of KSA. This is hinged on the social isolation strategies adopted to combat the menace of the COVID-19 virus, as prescribed by the World Health Organization.
Several studies in the extant literature have been documented on the nexus of social isolation in mitigating the adverse effect of carbon emission. Recently, Reference [8] explored the connection between economic expansion and emission level for the case of China amidst globalization. The study finding shows the isolation of the Chinese economy responds less than her economic growth while the country’s political willpower is elastic, as demonstrated by a government commitment to reduce the devastating effect of COVID-19 pandemic. Similarly, Reference [9] affirms the pivotal role of social isolation in combating the effect of the COVID-19 pandemic. The study of [9] revealed that COVID-19 improved China’s air quality in the short term. However, during the period of lifting the restriction on mobility, the quality of air in the environment dampens as a result of resumption of industrial production; its energy consumption especially those of fossil-fuel origin and greenhouse gas (GHG) emissions are likely to increase even more compared to previous times. Furthermore, the study of [10] alludes to the argument that the COVID-19 outbreak environmentally reduces pollution on a global scale; however, the study highlighted COVID-19 outbreak on the renewable energy value chain.
Saudi Arabia, alongside other OPEC countries, has been hit from both the supply and demand side of crude oil market due to COVID-19. The demand side is currently experiencing shrinkage, with energy consumption expected to reduce globally, especially in US, China and India. In 2020, it is expected that China’s oil demand will decline by 1 percent, India’s oil demand will decline by 0.6 percent and the United States of America’s natural gas demand will decline by more than 2.7 percent from 2019 [11]. On the supply side, due to the failure of OPEC in reaching an agreement on the output size in response to the pandemic, it implies that member countries can decide the level of output supplied once the existing agreement expires. Countries such as Saudi Arabia and UAE have the capacity to increase production and are currently doing so, while simultaneously coupled with Saudi Arabia’s decrease in the official selling price (OSP) of its crude oil with the aim of maintaining market share [12].
The need for global lockdown due to the COVID-19 outbreak also resulted in economic and industrial activities being halted, and global CO2 emission in the year 2020 declined by 6.5 percent [13]. Saudi Arabia’s manufacturing production sector has experienced reductions in output across different industries by 32.10 percent in April 2020 [14], with the 2020 air transport sector revenue loss at US$5.61 billion, risking 217,570 jobs and US$13.6 billion in contribution to the economy [15]; all these can be associated with the country lockdown measures to mitigate the spread of the virus. With 2.1 percent global mortality rate, COVID-19 is expected to be significantly lower than previous disease outbreaks such as SARS and MERS-COV, with a global mortality rate of 10 percent and 35 percent, respectively [16,17]. However, COVID-19 has more global economic implications since most countries adopted social isolation to mitigate the spread of the novel virus. Therefore, it is expected to have a severe effects on trade and economic growth [18] and globalization, tourism, energy consumption and CO2 emissions.
In 2019, Saudi Arabia experienced a boost in the tourism sector, with the country opening to entertainment and leisure events such as events relating to international football, golf, boxing, car racing and tennis held within the Kingdom for the first time. These events contributed 6.3 percent in the non-oil sector growth in 2019. Since the current lockdown and airspace ban has persisted in an attempt to mitigate COVID-19 impact, the non-oil sector dropped by −2.9 percent in the year-to-Q3 compared to the same period in 2019 [19].
Although the government has put in place various stimulus packages targeted towards the private sectors, the Saudi Arabia Monetary Agency (SAMA) proposed SAR 50 billion specifically for SMEs, with measures such as a six months deferral payment program by injecting up to SAR 30 billion funding into banks and other financial institutions, providing about SAR 13.2 billion in easy loans for SMEs to avoid disruptions in operation and salary payment due to the pandemic. Moreover, loan guarantee programs of up to SAR 6 billion for SMEs to reduce lending cost for beneficiaries in 2020 were put in place, and an excess of SAR 32 billion financial support for the private sector is available, which includes the aviation sector. This is expected to put pressure on the already strained government revenue due to reduced crude oil prices.
To this end, as Saudi Arabia is considered a petrostate, this study is aimed at testing the impact of the current low crude oil price, foreign direct investment (FDI, hereafter), air transport and carbon emission on economic growth. Furthermore, it is essential to examine the impact of the imposed isolation in response to the COVID-19 pandemic on economic growth, FDI and carbon dioxide emission. We seek to further explore the effect and consequences of the COVID-19 pandemic on the KSA economy by concentrating on its effect on the oil glut in recent times and the decline in pollutant emission across the country during the period of strict isolation from the rest of the world. Reference [20] concluded that the spread of the COVID-19 virus restricted international travel and activity participation in many countries, generating social distancing. Thus, social isolation negatively affects well-being and health status, with pernicious effects on economic systems. Reference [21] concluded that social isolation induced contraction in demand and the decline in investor confidence. It is essential to understand the impact of the double shocks experienced within this country in 2020 to be able to offer policy recommendations and future guides to avert such shocks. This study intends to provide answers to the following hypotheses highlighted below, as the answer will help foster economic growth, serve as policy documents for all key players in the KSA and achieve the KSA environmental sustainability target at large.
Due to differences in institutional, structural frameworks, policies and methodology applied to the studied countries, there has been conflicting results regarding the relationship between energy consumption and economic growth. The literature can be grouped into four categories: unidirectional relationship from energy consumption to economic growth, unidirectional relationship from economic growth to energy consumption, bidirectional relationship and no causality. First, the bidirectional relationship includes the study of Greece by [22], where using a 1960–1996 dataset and employing a vector error-correction model estimate confirmed a long-run relationship between energy consumption, economic growth and price development. A similar study for OECD countries was developed by [23], who established bidirectional causality between renewable energy consumption and economic growth in the short run and in the long run. Another study on OECD countries with dataset from 1981–2007 by [24] also established a bidirectional causal relationship between energy consumption and economic growth using dynamic ordinary least square (DOLS) estimate, dynamic panel causality and Johansen’s cointegration test. For 80 countries, ref. [25] examined the relationship between renewable and non-renewable energy consumption and economic growth by using a multivariate panel framework for the period 1990–2007 and further confirmed a bidirectional relationship between renewable and non-renewable energy consumption and economic growth. Other examples include [26] for India, for Nigeria [27], for India [28], for Turkey [29] and for Qatar [30].
Reference [31], using 16 Asian countries, explored energy consumption relative to economic growth. They found a unidirectional relationship from energy consumption to economic growth and over the study period, within a multivariate framework, they established a long-run unidirectional relationship flowing from energy consumption to economic growth. Other studies include [32] for Pakistan [33], for China [34], for India, Brazil and Uruguay [35], to mention a few.
The relationship between energy consumption and economic growth in the literature can be observed through the causality direction. Thus, the study of one-way causality relationship from economic growth to energy consumption includes [36,37,38,39,40,41]. Moreover, studies on neutrality causality includes [42] for 11 Sub Saharan African countries, for 17 African countries [43], for Turkey [44], for 11 Middle East and North African countries [45] and for Greece [46].
Other studies have examined the relationship between globalization, economic growth and energy consumption, and its impact on environmental viz-a-viz pollutants. Recent studies such as [47] explored the impact of globalization and economic growth on energy consumption for BRICS countries from 1970 to 2015 and concluded that a positive shock economic growth promotes energy consumption while a negative shock inhibits energy consumption. Reference [48] also examined the impact of globalization, economic factors and energy consumption on carbon dioxide emissions for Pakistan for 1971–2016 and concluded that economic factors, globalization and energy consumption negatively affected CO2 emissions. Moreover, Reference [49] for China examined the role of globalization and energy consumption during economic expansion and its role in environmental sustainability for the data period 1971–2015, and their findings supported the growth-induced energy consumption hypothesis with a positive and significant relationship between economic growth, ecological footprint and globalization index.
Furthermore, other studies have examined the relationship between economic growth and foreign direct investment and conflicting results emerge. Some studies suggest that there is no causal relationship, others argue an inverse relationship and the third group believe that FDI contributes positively to economic growth. For the first group of studies, Reference [50] examined the impact of FDI on economic growth and whether countries with a better financial system can exploit FDI more efficiently by using an empirical study of cross-country data for the period from 1975 to 1995. Their findings’ posit that the role of FDI alone is ambiguous in contributing to economic growth although countries with well improved financial systems benefit more from FDI. Moreover, Reference [51] examined the impact of FDI on economic growth and the determinants of FDI for Nigeria by using time series data for the period 1970–2002; the study concluded that although the overall effect of FDI may be insignificant, the determinants of FDI tend to have a positive and significant impact on economic growth. Reference [52] also found widely varying results when considering the impact of industry-specific FDI on the output for India by using Granger causality tests within a panel cointegration framework. Their findings suggest a mutually reinforcing relationship in the manufacturing sector but an absent causal relationship in the primary sector. Similarly, Reference [53] found that FDI has no significant impact on the economic growth of Kazakhstan and Reference [8], using cross-country data from 91 countries over the period 1975–2005, also concluded that FDI had no impact on economic growth until financial development exceeded a certain threshold.
For the second group of studies, Reference [9] investigated the relationship between trade, FDI and economic growth by applying the bounds testing autoregressive distributed lag (ARDL) approach to cointegration for the period from 1970 to 2008 for Tunisia. The study revealed that although it is common knowledge to assume that FDI will generate positive spillovers for the host country, the findings from this study fail to support this claim. Moreover, Reference [10] studied China and established an inverse relationship between FDI and economic growth.
The third group of studies includes [54], and this study worked on 45 countries from 1997 to 2004. The study concluded that FDI only has a positive impact on economic growth in the presence of skilled labour. The study of [55] examined the role of energy consumption, FDI, trade and economic growth complexity in sustaining economic growth using panel quantile regression model and data from 32 European countries in the period 1995–2014; their findings posit that the variables of interest all enhance economic growth. Furthermore, Reference [56] investigated the effects of air transportation, energy, ICT and FDI on economic growth in the Industry 4.0 era for the United States for the period 1981–2017, and their findings concluded that investments in aviation contribute to both directly and indirectly to the national income.
With the recent COVID-19 pandemic, it is imperative to investigate its impact on globalization, economic growth, energy consumption and pollutants. For China, Reference [57] explored the impact of isolation due to the COVID-19 pandemic on the relationship between economic growth and pollution emission amidst globalization using annual data for the period 1981–2014. Findings from this study suggest the existence of a long-run relationship between economic growth and pollutant emissions. Moreover, despite the isolation of the Chinese economy from the rest of the world due to the pandemic, the economy still experienced a significant growth trajectory, which does not reflect causality with pollutant emission. The study of [58] established a reduction in pollutant emissions for China since the beginning of the COVID-19 pandemic, and this is also observed in most countries with the lockdown resulting in a reduction in greenhouse gas emissions [59]. However, international cooperative efforts through the Paris Agreement and the Sustainable Development Goals (SDGs) are still ongoing, with the threat of irreversible climate change issues being the central focus of policymakers [60].
Similarly, Rugani and Caro [61] examined the impact of COVID-19 outbreak measures, such as lockdown, on the carbon footprint in Italy. The study findings posit that the impact of COVID-19 lockdown measures has resulted in a 20% carbon footprint (CF) when compared to the mean of previous years, resulting in avoided greenhouse gas emissions between −5.6 and −10.6 MtCo2e. Furthermore, for the Indian state Kolkata, [62] examined the before and after COVID-19 pandemic effect on intercity carbon emission levels and found a significant difference between the two periods with a decrease in carbon emissions during the pandemic due to the closure of business activities.
For Rio de Janeiro, a city of Brazil, [63] explored the impact of COVID-19 on air quality by comparing the values of particulate matter (Pm10), carbon monoxide (CO), nitrogen dioxide (NO2) and ozone (O3) concentrations during the partial lockdown period and the same period in 2019, as well as the weeks preceding the virus outbreak. The study revealed that CO level reduced the most, with 30.3–48.5% reduction level. NO2 has also reduced, while Pm10 levels were only reduced during the initial lockdown week. A similar result was observed in Saudi Arabia by [64] when they examined the impact of COVID-19 lockdown on the air quality of an eastern province by comparing the pre-lockdown period with the nationwide lockdown period during 23 Marchand 20 June 2020. The study confirmed varying concentration reduction rates of 21–70% for Pm10, 5.8–55% for CO and 8.7–30% for Sulfur dioxide (SO2). Interestingly, O3 showed an increased concentration rate of 6.3–45%. Furthermore, Reference [65] also examined the impact of COVID-19 lockdown on the air quality in Saudi Arabia using data from the Saudi Arabian General Authority of Meteorology and Environmental protection (GAMEP) on nine cities within the Kingdom and found that although there was a decrease in pollutant concentrations during the lockdown, the concentration for CO, PM10, SO2,No2 and O3 were still above the World Health Organization (WHO) 24 h and annual average limit levels. The lockdown revealed the possibility of a significant reduction in atmospheric pollutants through the control of traffic, industrial activities and environmentally friendly transportation programs.
Similarly, Reference [66] investigated the effect of COVID-19 measures on the global environment and fertility by using data for the period 1980–2019, and findings from this study revealed that due to city-wide lockdown, global carbon emissions had decreased significantly. As much as a relief to the ecosystem was observed during the COVID-19 pandemic due to lower pollutants associated with the period lockdown, this period is also accompanied by global market uncertainty coupled with job loss, and many economies of the world have been thrown into recession and possibly economic depression [67].
Furthermore, Reference [68] examined the impact of the COVID-19 pandemic on FDI for Nepal and observed a net shrink of 3.3% in FDI, which will result in less economic development as Nepal is a dependent country. Similar submission is expected for the OECD region. Although FDI is expected to fall by 30% in 2020, even under the most optimistic scenario given the government’s public health and economic support policy measures to overcome the resulting recession due to the COVID-19 pandemic [69], the FDI for this region only fell by 15 percent in 2020 [70].
To this end and to the best of our knowledge, there is a dearth in the empirical literature about the impact of the COVID-19 pandemic on globalization using FDI as a proxy, economic growth, energy consumption, air transport and pollution emission in Saudi Arabia; this work aims to contribute to the literature in this area.

2. Materials and Methods

This study aligns with the motivation highlighted in Section one and the United Nations Sustainable Development Goals (UN-SDGs 7, 8, 11,12 and 13). These goals include access to clean and responsible energy consumption, sustainable economic growth and mitigation of climate change issues. These issues align with the Saudi government’s sustainability target. The uniqueness of this study lies on the choice of variables, which apparently is in line with the UNSDGs’ agenda that is to be achieved by 2030. There is very little documentation in the extant literature. The present study draws strength from the tourism-led growth hypothesis and FDI-induced growth hypothesis as key driver for economic growth while controlling for oil rent revenue accrual, which is in line with empirical studies [59,71]. This study is conducted in a growth model environment while accounting for the effect of emission on economic growth for the case of KSA. That is, the trade-off between income level and emission known in the literature as the environmental Kuznets curve (EKC) hypothesis. Additionally, the current study employed a variety of econometrics analyses for soundness of estimation and policy crafting. It is on this premise that the current study builds the following hypothesis to guide the study motivation. To achieve the highlighted hypothesis claim and study objective, we rely on both primary and secondary data for the outlined indicators under consideration. The secondary data were derived from the World Bank Development Indicator database [72]. We used the conventional unit root PP test [73]. Subsequently, we further explored the coefficient and interaction between the intended variables for proper and sound policy direction. Thus, the following hypotheses were constructed in line with the study objective and with econometrics model formulation in order to test all highlighted hypotheses in a holistic manner for KSA.
Hypotheses
Hypotheses 1 (H1).
For Saudi Arabia, there is a relationship between CO2 per capita and GDP per capita.
Hypotheses 2 (H2).
There is a relationship between globalization proxied by FDI and economic growth.
Hypotheses 3 (H3).
For Saudi Arabia, there is a relationship between global oil price, CO2 and economic growth.
Hypotheses 4 (H4).
COVID-19 isolation policy that restricts air transport poses adverse effect on Saudi Arabia’s economic growth.
For testing these hypotheses, a baseline model is proposed in Equation (1), as stated below:
L G D P t = β 1 L C O 2 t + β 2 L A T t + β 3 L F D I t + β 4 L O R t + β 5 L S G t + ε i t  
where LGDP, LCO2, LFDI, LOR, LATP and LSG represent the gross domestic product, carbon dioxide emissions, foreign direct investment, oil rent, air transport passengers and globalization proxied by FDI, respectively. All variables are expressed in logarithms. The study employs the dataset for the period 1980–2017, and data were obtained from World Bank data and the International Energy Association [74]. This study employed the fully modified ordinary least square (FMOLS) econometric analysis.
The FMOLS is used to explore the magnitude of the long-run equilibrium relationship. Additionally, FMOLS technique has the merit of circumventing autoregression and endogeneity problems, as well as errors emerging from sample bias issues [75]. Additionally, our study also considers the isolation of LCO2 (Equation (2)) and the isolation of LSG (Equation (3)) in order to explore changes in the significance and elasticity of the proposed variables.
L G D P t = β 2 L A T t + β 3 L F D I t + β 4 L O R t + β 5 L S G t + ε i t  
L G D P t = β 2 L A T t + β 3 L F D I t + β 4 L O R t + + β 5 L S G t + ε i t  

3. Results

This section presents the preliminary analysis of basic summary statistics and correlation matrix analysis. Table 1 shows the central tendency and dispersion of the outlined variables (LGDP, LFDI, LCO2, LATP, LOR and LSG). All variables were transformed to their logarithmic form. LGDP growth shows the highest average over the sampled period. In terms of symmetry, all variables possessed negative skewness, except for oil rent. As reported by the Kurtosis, the peaks of the variables reveal that most series show heavy tail with a numerical value of more than three. Subsequently, the pairwise analysis presents the one–one relationship among the study variables. We observed a strong positive relationship between GDP growth and LFDI, LATP and LOR. Thus, this suggests that growth in KSA is induced by FDI attraction, FDI inflow attraction and the air transport sector. However, the positive correlation between GDP growth and CO2 emission is suggestive of KSA’s environmental target. However, the correlation analysis is not sufficient to validate these relationships among the variables. Given the weakness of the correlation analysis, the correlation analysis does not represent causation. Thus, this situation necessitates the need for more econometrics analysis, which the current study proceeds within the next section.
This study proceeds with the examination of stationarity properties of the study variables. Stationarity analysis is necessary in order to avoid spurious regression by modelling variables integrated of order two. Thus, the current study explores the unit root properties of variables under review by using the Philips and Perron (PP) unit root test as outlined in Table 2. The test outcomes confirm that the proposed model parameters are stationary after the first difference, i.e.,~I (1), thereby indicating their order of integration to be one, and this enables the study to proceed with long-run regression analysis. From empirical results, we can infer that the selected variables can be used to predict long-term effects. Consequently, the stationarity properties of the selected variables do not posit whether regulations and policy decisions will be efficient or not.
In Table 3, we have obtained evidence of a stable, long-term relationship among selected variables using the Johansen cointegration test (Table 3). The results displayed in Table 3 allow us to build recommendations that are more than temporary.
Table 4 reveals the connection proposed in Equations (1)–(3) through the FMOLS econometric cointegration estimation.
Table 4 presents the long-run elasticity relationship between LGDP growth, LFDI, LCO2 emission, LATP, LOR and LSG for KSA.
The growth model shows that air transport exerts a positive relationship with GDP growth as a 1% increase in air transportation increases economic growth, as reported by Table 4. Thus, the econometric results corroborate with the Tourism-Led Growth Hypothesis (TLGH) in KSA, providing evidence of a direct linkage between international air transport and economic growth. This finding is similar to the study of [71] for Spain. This result is instructive for government representatives in KSA in the sense that international air transport is a key driver for sustainable economic growth. Reference [77] showed that COVID-19 affected the international transport sector, resulting in shipping disruptions and increasing trade costs dramatically. According to the WTO report, transport and travel costs account for 33% of the trade costs involving cross-border transportation and other specialized transportation services [78]. This process implies that the relevance of air transport on GDP would be affected by the increasing cost of travel. Thus, we induced a contraction in the KSA economy due to ascending travel costs, as a result of the COVID-19 pandemic.
Overall, as presented by Figure 1, which highlights the key drivers of economic growth in KSA, among the key drivers are revenue accrual from oil rent, air transportation, FDI influx and more. Furthermore, when we consider the social globalization process, the empirical results confirm the relevance of isolation and how it affects economic growth directly and indirectly, increasing the effect of carbon emissions inputs on economic growth when we isolate social globalization. In other words, the econometric results reveal the relevance of social globalization and the pernicious effect that the pandemic has exerted on economic growth induced by global lockdown (Table 5) [20].
Furthermore, the FDI-induced growth is validated by our study where FDI attraction engenders economic growth. As such, there is a need for government officials of KSA to promote specific action steps for the attraction of FDI from the rest of the world to her economy, especially into the energy (oil industry) sector of which the county has a substantial commercial deposit as a net exporter in the international market. The action of FDI attraction will have a positive spillover effect on economic growth [79]. This proposition is in line with Saudi Arabia’s Vision 2030 long-term strategy program. The authority has made available platforms such as investment in energy, service and the sport sector in order to attract foreign investment both in the real sector and service sectors to drive KSA’s economic growth trajectory. Similarly, oil rent increases economic growth, which is no surprise for an oil-exporting economy such as KSA, where the energy (oil) sector contributes significantly to economic growth. This is in line with the study of [5]. However, the energy-led growth hypothesis affirmed by this study comes with the implication for high CO2 emission. Thus, there exists a trade-off between CO2 emission and GDP growth level. This entails that the KSA economic growth stems from anthropogenic activities, which might have implications on the environmental sustainability in KSA. This outcome resonates with the study of [80] for the case of India. However, the current authority of KSA is on a trajectory for a clean and sustainable economic path by the adoption of clean and accessible energy sources (SGD-12 and 13). The current study results shed light on economic growth and its implications on macroeconomic indices such as environment, energy, FDI attraction and the service sector, such as international air transport, which drives KSA. The finding of this study has implications for KSA. This study validates the pivotal role of the energy sector; in particular, the accrual from oil rent which has driven a significant share of KSA’s GDP over the years. This aligns with the finding of [81] for the case of Iran, which is also an oil-sector-driven economy. Furthermore, we also observe that economic growth contributes to pollution; as such, there is a need to develop green development and decarbonization of economic growth in KSA. This process has been the pursuit of the Saudi sustainability target, which coincides with the UN_SDG-7, 8, 11, 12 and 13 that highlights the need for sustainability concerning clean and responsible energy consumption (SDG-11), sustainable economic growth (SDG-8) and much more climate change actions (SDG-13).

4. Conclusions

The age-old debate on energy and economic growth is still very much alive in the extant literature. The growth path discourse is still inconclusive in terms of empirical results. Based on the annual time series data for Saudi Arabia, a crude-oil-based nation serves as a base case for explore the nexus between GDP growth, oil rent, FDI inflow and air transport. In order to operationalize this objective, we explore a variety of econometrics analyses such as FMOLS and estimation techniques. According to the Johansen multivariate cointegration test, long-run equilibrium relationship is traced among the highlighted variables over the investigated period. The finding from this study draws the attention of relevant stakeholders. This study validates the TLGH as air transport exerts a positive and significant relationship with GDP growth. Similarly, FDI inflow and oil rent accrual also induce growth in KSA. These outcomes are desirable and in line with theoretical expectations and economic intuition. However, our study shows that the highlighted economic growth is driven by anthropogenic activities, which might have implications on environmental sustainability in KSA, where CO2 emission is positively correlated with GDP growth. This draws concerns for environmental specialists and government officials to disentangle the economic growth path from pollution. This can be achieved via a commitment to environmental treaties, sustainability action programs and different strategies in the world such as the Kyoto Protocol nations.
From a policy standpoint, the take-aways from this study are highlighted below.
-
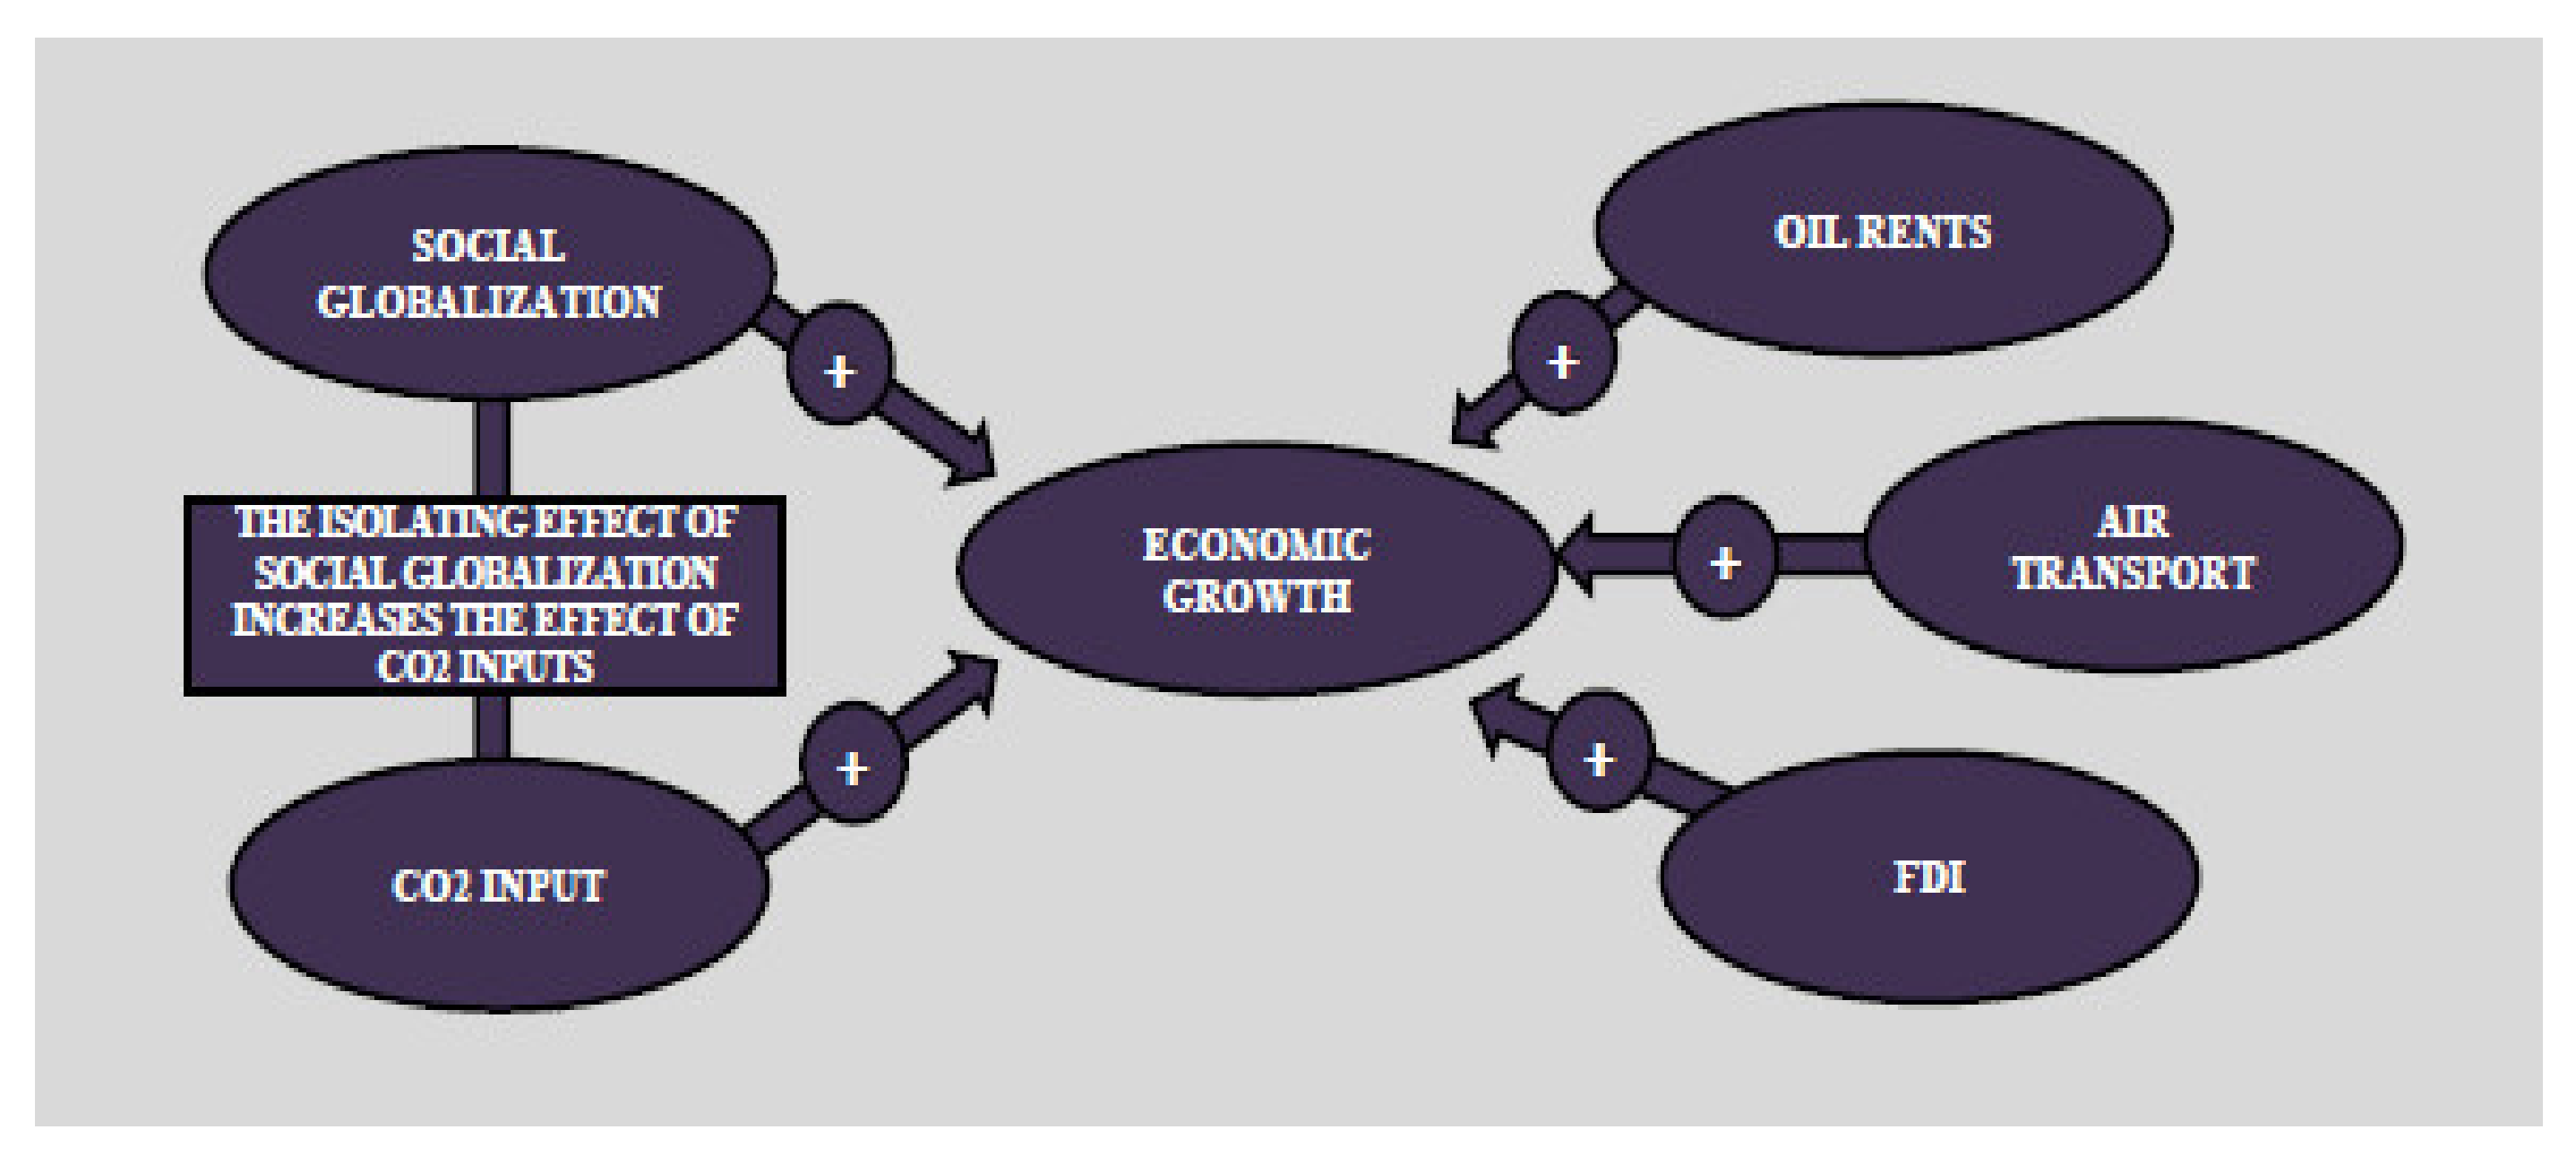
First, the positive nexus between GDP growth and emission level is instructive for sustainability targets as concerted action is required to disentangle economic growth from emission by development of green growth (SGD-13). This action is achieved by adherence to innovative and alternative energy (oil) consumption and the diversification of the KSA economy from crude-oil dependency to other sectors such as service, manufacturing and others. That is, from mono-economy to diversified-digital and dynamic economy.
-
Second, the positive significant relationship between FDI and GDP is informative for more commitment from KSA towards the infrastructure of economic architecture to attract foreign investment in the economy and favorable policies for ease of conducting business, which is in line with Saudi Arabia’s Vision 2030 long-term strategy program. Furthermore, there is a need for economic insulation policies against externalities and shocks, such as COVID-19, that hampers economic indices and jeopardies economic prosperity. Thus, economies such KSA can achieve this by engaging active macroeconomic measures such as isolation and restriction to protect infant and fragile industries against foreign competition. This is more similar to controlled protection polices with the ultimate aim of building economic growth without compromise of FDI attraction to the home country.
-
Third, we observe that the TLGH as proxied by air transport induced economic growth. This suggests that the tourism sector is an alternative route from a mono-economy driven by crude oil to the service sector such as the aviation sector for developing sustainable economic growth in the country. The TLGH validation suggests that global tourism attraction is affected by the global pandemic, which started since 2019. This implies that the tourism sector and its spillover energy (oil) sector, which run simultaneously, experienced a huge setback in the last year. These occurrences call for more pragmatic action steps given that KSA gleaned huge revenue from both her energy and tourism sector. To circumvent such phenomenon, KSA government officials can adopt ecotourism structures that align with clean tourism for sustainable economic growth, which resonates with the sustainability targets of the Kingdom of Saudi Arabia.
Our empirical results are in line with Ministry of Finance of KSA and that of the United Nations Economic and Social Commission for Western Asia (UNESCWA) on the possible decline in economic gain as a result of COVID-19. The UNESCWA cautioned that the Arab world, due to the COVID-19 pandemic, could experience more than 1.7 million job loss and decrease in Gross Domestic Product (GDP) in terms of US$42 billion in 2020; the unemployment rate is expected to decrease to 11.3 percent while GDP will grow by 4.3 percent in 2021 [82,83]. The losses will be due to debility in crude oil price since the pandemic will limit industrial activities across the globe. The Saudi Arabia share of the pandemic economic effect will become more evident in businesses that deal directly with the Asian markets. Companies that deal in export or import of raw materials from other Asia countries, especially from China, will be affected. Moreover, the tourism sector, financial institutions, corporations that produce competitive goods and retail enterprises will be affected due to the lack of supplies caused by the COVID-19. The market price of petrochemical products will likely further decrease due to previous forecasts of price decline during the second half of 2020 to the second half of 2021 [82]. Saudi Arabia has reiterated that it has the economic and financial capability and plasticity in reducing expenditures or borrowing to face the adverse effect of the pandemic coupled with the country’s large reserves and investments.
In conclusion, this study has examined the relationship between carbon dioxide emissions, foreign direct investment, oil rent, air transport passengers and social globalization relative to economic growth in KSA, as well as the impact of isolation policy in response to COVID-19. Further studies can advance the literature by considering other crude-oil-dependent nations such as Nigeria and Qatar in terms of key growth determinants in the context of the global pandemic, among others. Additional other macro-economic indicators omitted can be incorporated to advance the literature by accounting for asymmetry using disaggregated data set. A limitation for this study is the access to data, which plagues the context in which it was conducted.

Author Contributions

Conceptualization; M.O.A., F.V.B. and D.B.-L.; methodology, M.O.A., F.V.B. and D.B.-L.; software, M.O.A., F.V.B. and D.B.-L.; validation, M.O.A., F.V.B. and D.B.-L.; formal analysis, M.O.A., F.V.B. and D.B.-L.; investigation, M.O.A., F.V.B. and D.B.-L.; resources, M.O.A., F.V.B. and D.B.-L.; data curation, M.O.A., F.V.B. and D.B.-L.; writing—original draft preparation, M.O.A., F.V.B. and D.B.-L.; writing—review and editing, M.O.A. and F.V.B.; visualization, M.O.A., F.V.B. and D.B.-L.; supervision, M.O.A.; project administration, M.O.A.; funding acquisition, M.O.A. All authors have read and agreed to the published version of the manuscript.

Funding

This research was funded by the Deanship of Post Graduate and Scientific Research at Dar Al Uloom University.

Institutional Review Board Statement

Not applicable.

Informed Consent Statement

Not applicable.

Data Availability Statement

Not applicable.

Acknowledgments

The authors extend their appreciation to the Deanship of Post Graduate and Scientific Research at Dar Al Uloom University for funding this work.

Conflicts of Interest

The authors declare no conflict of interest.

References

  1. Ozturk, I. A literature survey on energy–growth nexus. Energy Policy 2010, 38, 340–349. [Google Scholar] [CrossRef]
  2. Agboola, M.O.; Bekun, F.V. Does agricultural value added induce environmental degradation? Empirical evidence from an agrarian country. Environ. Sci. Pollut. Res. 2019, 26, 27660–27676. [Google Scholar] [CrossRef] [Green Version]
  3. Bloomberg: Oil for Less Than Nothing? Here’s How That Happened. Available online: https://www.bloomberg.com/news/articles/2020-04-20/negative-prices-for-oil-here-s-what-that-means-quicktake (accessed on 5 August 2020).
  4. Tollefson, J. How the coronavirus pandemic slashed carbon emissions—in five graphs. Nature 2020, 582, 158–159. [Google Scholar] [CrossRef]
  5. Wada, I. Energy production and economic growth in Saudi Arabia: Dynamic causality. Energy Sources Part B Econ. Plan. Policy 2017, 12, 584–590. [Google Scholar] [CrossRef]
  6. Akinmade, B.; Adedoyin, F.F.; Bekun, F.V. The impact of stock market manipulation on Nigeria’s economic performance. J. Econ. Struct. 2020, 9, 1–28. [Google Scholar]
  7. Chu, D.K.; Pan, Y.; Cheng, S.M.; Hui, K.P.; Krishnan, P.; Liu, Y.; Poon, L.L. Molecular diagnosis of a novel coronavirus (2019-nCoV) causing an outbreak of pneumonia. Clin. Chem. 2020, 66, 549–555. [Google Scholar] [CrossRef] [PubMed] [Green Version]
  8. Balsalobre-Lorente, D.; Driha, O.M.; Bekun, F.V.; Sinha, A.; Adedoyin, F.F. Consequences of COVID-19 on the Social isolation of the Chinese economy: Accounting for the role of reduction in carbon emissions. Air Qual. Atmos. Health 2020, 13, 1439–1451. [Google Scholar] [CrossRef]
  9. Wang, Q.; Su, M. A preliminary assessment of the impact of COVID-19 on environment—A case study of China. Sci. Total Environ. 2020, 728, 138915. [Google Scholar] [CrossRef]
  10. Erol, H. Effects of COVID-19 Outbreak on Environment and Renewable Energy Sector. Environ. Dev. Sustain. 2020, 23, 4782–4790. [Google Scholar] [CrossRef]
  11. IEA. Oil Market Report-April 2020. Available online: https://www.iea.org/reports/oil-market-report-april-2020 (accessed on 5 October 2020).
  12. JADWA Report. Available online: http://www.jadwa.com/en/researchsection/research/economic-research/macroeconomic-reports (accessed on 6 October 2020).
  13. Le Quéré, C.; Jackson, R.B.; Jones, M.W.; Smith, A.J.; Abernethy, S.; Andrew, R.M. Temporary reduction in daily global CO2 emissions during the COVID-19 forced confinement. Natl. Clim. Chang. 2020, 10, 647–653. [Google Scholar] [CrossRef]
  14. Trading Economics Saudi Arabia Manufacturing Data. Available online: https://tradingeconomics.com/saudi-arabia/manufacturing-production (accessed on 30 September 2020).
  15. The International Air Transport Association (IATA) Pressroom. Available online: https://www.iata.org/en/pressroom/pr/2020-04-02-01/ (accessed on 18 August 2021).
  16. CDC Center for Disease Control, 2020 NCHS Mortality Surveillance Data. Available online: https://www.cdc.gov/coronavirus/2019-ncov/covid-data/covidview/09252020/nchs-mortality-report.html. (accessed on 30 September 2020).
  17. WHO Coronavirus (COVID-19) Dashboard. Available online: https://covid19.who.int/table (accessed on 14 August 2021).
  18. Leiva-Leon, D.; Perez-Quiros, G.; Rots, E. Real-Time Weakness of the Global Economy: A First Assessment of The Coronavirus Crisis. Working Paper of the Banco de España Documentos de Trabajo. N.º 2015. 2020. Available online: https://papers.ssrn.com/sol3/papers.cfm?abstract_id=3617695 (accessed on 30 September 2020).
  19. Macroeconomic Reports—Jadwa Investment. Available online: http://www.jadwa.com/en/researchsection/research/economic-research/macroeconomic-reports (accessed on 14 August 2021).
  20. De Vos, J. The effect of COVID-19 and subsequent social distancing on travel behavior. Transp. Res. Interdiscip. Perspect. 2020, 5, 100121. [Google Scholar] [CrossRef] [PubMed]
  21. Maliszewska, M.; Mattoo, A.; Van Der Mensbrugghe, D. The Potential Impact of COVID-19 on GDP and Trade: A Preliminary Assessment. World Bank Policy Research Working Paper No. 9211. Available online: https://papers.ssrn.com/sol3/papers.cfm?abstract_id=3573211 (accessed on 14 August 2021).
  22. Hondroyiannis, G.; Lolos, S.; Papapetrouc, E. Energy consumption and economic growth: Assessing the evidence from Greece. Energy Econ. 2002, 24, 319–336. [Google Scholar] [CrossRef]
  23. Apergis, N.; Payne, J.E. Renewable energy consumption and economic growth: Evidence from a panel of OECD countries. Energy Policy 2010, 38, 656–660. [Google Scholar] [CrossRef]
  24. Belke, A.; Dobnik, F.; Dreger, C. Energy consumption and economic growth: New insights into the Cointegration relationship. Energy Econ. 2011, 33, 782–789. [Google Scholar] [CrossRef] [Green Version]
  25. Apergis, N.; Payne, J.E. Renewable and non-renewable energy consumption-growth nexus: Evidence from a panel error correction model. Energy Econ. 2012, 34, 733–738. [Google Scholar] [CrossRef]
  26. Ozturk, I.; Salah Uddin, G. Causality Among Carbon Emissions, Energy Consumption and Growth in India. Econ. Res.-Ekon. Istraživanja 2012, 25, 752–775. [Google Scholar] [CrossRef] [Green Version]
  27. Nnaji, C.E.; Chukwu, J.O.; Nnaji, M. Electricity Supply, Fossil fuel Consumption, CO2 Emissions and Economic Growth: Implications and Policy Options for Sustainable Development in Nigeria. Energy Econ. Policy 2013, 3, 262–271. [Google Scholar]
  28. Ahmad, A.; Zhao, Y.; Shahbaz, M.; Bano, S.; Zhang, Z.; Wang, S.; Liu, Y. Carbon emissions, energy consumption and economic growth: An aggregate and disaggregate analysis of the Indian economy. Energy Policy 2016, 96, 131–143. [Google Scholar] [CrossRef]
  29. Destek, M.A.; Aslan, A. Renewable and non-renewable energy consumption and economic growth in emerging economies: Evidence from bootstrap panel causality. Renew. Energy 2017, 111, 757–763. [Google Scholar] [CrossRef]
  30. Salauddin, M.; Gow, J. Effects of energy consumption and economic growth on environmental quality: Evidence from Qatar. Environ. Sci. Pollut. Res. 2019, 26, 18124–18142. [Google Scholar] [CrossRef]
  31. Lee, C.; Chang, C. Energy consumption and economic growth in Asian economies: A more comprehensive analysis using panel data. Resour. Energy Econ. 2008, 30, 50–65. [Google Scholar] [CrossRef]
  32. Muhammad, S.D.; Usman, M.; Mujahid, N.; Lakhan, G.R. Nexus Between Energy Consumption and Economic Growth: A Case Study of Pakistan. World Appl. Sci. 2013, 24, 739–745. [Google Scholar]
  33. Shahbaz, M.; Khan, S.; Tahir, M.I. The dynamic links between energy consumption, economic growth, financial development and trade in China: Fresh evidence from multivariate framework analysis. Energy Econ. 2013, 40, 8–21. [Google Scholar] [CrossRef]
  34. Vidyarthi, H. Energy consumption, carbon emissions and economic growth in India. World J. Sci. Technol. Sustain. Dev. 2013, 10, 278–287. [Google Scholar] [CrossRef]
  35. Odhiambo, N.M. Energy dependence in developing countries: Does the level of income matter? Atl. Econ. J. 2014, 42, 65–77. [Google Scholar] [CrossRef]
  36. Kraft, J.; Kraft, A. Relationship between energy and GNP. Energy Dev. 1978, 3, 401–403. [Google Scholar]
  37. Narayan, P.K.; Smyth, R. Energy consumption and real GDP in G7 countries: New evidence from panel cointegration with structural breaks. Energy Econ. 2008, 30, 2331–2341. [Google Scholar] [CrossRef]
  38. Halicioglu, F. Residential electricity demand dynamics in Turkey. Energy Econ. 2007, 29, 199–210. [Google Scholar] [CrossRef]
  39. Sari, R.; Awing, B.T.; Soytas, U. The relationship between disaggregate energy consumption and industrial production in the United States: An ARDL approach. Energy Econ. 2008, 30, 2302–2313. [Google Scholar] [CrossRef]
  40. Zhang, X.; Cheng, X. Energy consumption, carbon emissions, and economic growth in China. Ecol. Econ. 2009, 68, 2706–2712. [Google Scholar] [CrossRef]
  41. Stern, D.I.; Enflo, K. Causality between energy and output in the long-run. Energy Econ. 2013, 39, 135–146. [Google Scholar] [CrossRef] [Green Version]
  42. Akinlo, A.E. Energy consumption and economic growth: Evidence from 11 Sub-Sahara African countries. Energy Econ. 2008, 30, 2391–2400. [Google Scholar] [CrossRef]
  43. Wolde-Rufael, Y. Energy consumption and economic growth: The experience of African countries revisited. Energy Econ. 2009, 30, 217–224. [Google Scholar] [CrossRef]
  44. Ozturk, I.; Acaravci, A. CO2 emissions, energy consumption and economic growth in Turkey. Renew. Sustain. Energy Rev. 2010, 14, 3220–3225. [Google Scholar] [CrossRef]
  45. Ozturk, I.; Acaravci, A. Electricity consumption and real GDP causality nexus: Evidence from ARDL bounds testing approach for 11 MENA countries. Appl. Energy 2011, 88, 2885–2892. [Google Scholar] [CrossRef]
  46. Marques, A.C.; Fuinhas, J.A.; Menegaki, A.N. Interactions between electricity generation sources and economic activity in Greece: A VECM approach. Appl. Energy 2014, 132, 34–46. [Google Scholar] [CrossRef]
  47. Shahbaz, M.; Shahzad, S.J.H.; Alam, S.; Apergis, N. Globalization, economic growth and energy consumption in the BRICS region: The importance of asymmetries. J. Int. Trade Econ. Dev. 2018, 27, 985–1009. [Google Scholar] [CrossRef] [Green Version]
  48. Khan, M.K.; Teng, J.; Khan, M.I.; Khan, M.O. Impact of globalization, economic factors and energy consumption on CO2 emissions in Pakistan. Sci. Total Environ. 2019, 388, 424–436. [Google Scholar] [CrossRef] [PubMed]
  49. Bekun, F.V.; Yalciner, K.; Etokakpan, M.U.; Alola, A.A. Renewed evidence of environmental sustainability from globalization and energy consumption over economic growth in China. Environ. Sci. Pollut. Res. 2020, 27, 29644–29658. [Google Scholar] [CrossRef]
  50. Alfaro, L.; Chanda, A.; Kalemli-Ozcan, S.; Sayek, S. FDI and economic growth: The role of local financial markets. J. Int. Econ. 2004, 64, 89–112. [Google Scholar] [CrossRef]
  51. Ayanwale, A.B. FDI and Economic Growth: Evidence from Nigeria; AERC Research Paper 165; African Economic Research Consortium: Nairobi, Kenya, 2007; Available online: https://media.africaportal.org/documents/RP_165.pdf (accessed on 5 September 2020).
  52. Chakraborty, C.; Nunnenkamp, P. Economic Reforms, FDI, and Economic Growth in India: A Sector Level Analysis. World Dev. 2008, 36, 1192–1212. [Google Scholar] [CrossRef]
  53. Rakhmatullayeva, D.; Kuliyev, I.; Beisenbaiyev, Z.; Tabeyev, T. Assessment of the influence of FDI on the economic growth of the host country: Evidence from Kazakhstan. E3S Web Conf. 2020, 159, 06007. [Google Scholar] [CrossRef] [Green Version]
  54. Azman-Saini, W.N.W.; Hook Law, S.; Halim Ahmad, A. FDI and economic growth: New evidence on the role of financial markets. Econ. Lett. 2010, 107, 211–213. [Google Scholar] [CrossRef]
  55. Belloumi, M. The relationship between trade, FDI and economic growth in Tunisia: An application of the autoregressive distributed lag model. Econ. Syst. 2014, 38, 269–287. [Google Scholar] [CrossRef]
  56. Wu, W.; Yuan, L.; Wang, X.; Cao, X.; Zhou, S. Does FDI drive Economic growth? Evidence from city data in China. Emerg. Mark. Financ. Trade 2020, 56, 2594–2607. [Google Scholar] [CrossRef]
  57. Wijeweera, A.; Villano, R.; Dollery, B. Economic Growth and FDI Inflows: A Stochastic Frontier Analysis. J. Dev. Areas 2010, 43, 143–158. Available online: http://0-www-jstor-org.brum.beds.ac.uk/stable/40376254. (accessed on 6 March 2021). [CrossRef] [Green Version]
  58. Doğan, B.; Balsalobre-Lorente, D.; Ali Nasir, M. European commitment to COP21 and the role of energy consumption, FDI, trade and economic complexity in sustaining economic growth. J. Environ. Manag. 2020, 273, 111146. [Google Scholar] [CrossRef]
  59. Adedoyin, F.F.; Bekun, F.V.; Driha, O.M.; Balsalobre-Lorente, D. The effects of air transportation, energy, ICT, and FDI on economic growth in the industry 4.0 era: Evidence from the United States. Technol. Forecast. Soc. Chang. 2020, 160, 120297. [Google Scholar] [CrossRef]
  60. Chapman, A.; Tsuji, T. Impacts of COVID-19 on a Transitioning Energy System, Society, and International Cooperation. Sustainability 2020, 12, 8232. [Google Scholar] [CrossRef]
  61. Rugani, B.; Caro, D. Impact of COVID-19 outbreak measures of lockdown on the Italian Carbon Footprint. Sci. Total. Environ. 2020, 737, 139806. [Google Scholar] [CrossRef]
  62. Mitra, A.; Ray Chaudhuri, T.; Mitra, A.; Pramanick, P.; Zaman, S. Impact of COVID-19 related shutdown on atmospheric carbon dioxide level in the city of Kolkata. Parana J. Sci. Educ. 2020, 6, 84–92. [Google Scholar]
  63. Dantas, G.; Sicilliano, B.; França, B.B.; da Silva, C.M.; Arbilla, G. The impact of COVID-19 partial lockdown on the air quality of the city of Rio de Janeiro, Brazil. Sci. Total. Environ. 2020, 729, 139085. [Google Scholar] [CrossRef] [PubMed]
  64. Anil, I.; Alagha, O. The Impact of COVID-19 lockdown on the air quality of Eastern Province, Saudi Arabia. Air Qual. Atmos. Health 2021, 14, 117–128. [Google Scholar] [CrossRef] [PubMed]
  65. Aljahdali, M.O.; Alhassan, A.B.; Albeladi, M.N. Impact of novel coronavirus disease (COVID-19) lockdown on ambient air quality of Saudi Arabia. Saudi J. Biol. Sci. 2021, 28, 1356–1364. [Google Scholar] [CrossRef]
  66. Anser, M.K.; Yousaf, Z.; Khan, M.A.; Voo, X.H.; Nassani, A.A.; Alotaibi, S.M.; Qazi Abro, M.M.; Zaman, K. The impacts of COVID-19 measures on global environment and fertility rate: Double coincidence. Air Qual. Atmos. Health 2020, 13, 1083–1092. [Google Scholar] [CrossRef]
  67. Barua, S. Understanding Coronanomics: The Economic Implications of Coronavirus (COVID-19) Pandemic. Available online: https://papers.ssrn.com/sol3/papers.cfm?abstract_id=3566477 (accessed on 6 March 2021).
  68. Chaudhary, M.K.; Ghimire, R.P.; Ghimire, D.M. Impact of COVID-19 Pandemic on foreign direct investment in Nepal from South Asian perspective. J. Dev. Econ. 2020, 5, 137–146. [Google Scholar]
  69. OECD Data Base. Available online: https://www.oecd.org/ (accessed on 6 September 2020).
  70. OECD Data Base. Available online: https://www.oecd.org/investment/FDI-in-Figures-April-2021.pdf (accessed on 14 August 2021).
  71. Balsalobre-Lorente, D.; Driha, O.M.; Bekun, F.V.; Adedoyin, F.F. The asymmetric impact of air transport on economic growth in Spain: Fresh evidence from the tourism-led growth hypothesis. Curr. Issues Tour. 2021, 24, 503–519. [Google Scholar] [CrossRef]
  72. World Bank Data Base. Available online: https://data.worldbank.org/ (accessed on 6 September 2020).
  73. Phillips, P.C.; Perron, P. Testing for a unit root in time series regression. Biometrika 1988, 75, 335–346. [Google Scholar] [CrossRef]
  74. IEA. Available online: https://www.iea.org/ (accessed on 6 September 2020).
  75. Narayan, P.K.; Smyth, R. Multivariate Granger causality between electricity consumption, exports and GDP: Evidence from a panel of Middle Eastern countries. Energy Policy 2009, 37, 229–236. [Google Scholar] [CrossRef]
  76. MacKinnon, J.G.; Haug, A.A.; Michelis, L. Numerical distribution functions of likelihood ratio tests for cointegration. J. Appl. Econom. 1999, 14, 563–577. [Google Scholar] [CrossRef]
  77. Vo, T.D.; Tran, M.D. The impact of covid-19 pandemic on the global trade. Int. J. Soc. Sci. Econ. Invent. 2021, 7, 1–7. [Google Scholar] [CrossRef]
  78. WTO. Available online: https://www.wto.org/english/res_e/booksp_e/anrep_e/anrep20_chap3_e.pdf (accessed on 6 September 2020).
  79. Balsalobre-Lorente, D.; Shahbaz, M.; Roubaud, D.; Farhani, S. How economic growth, renewable electricity and natural resources contribute to CO2 emissions? Energy Policy 2018, 113, 356–367. [Google Scholar] [CrossRef] [Green Version]
  80. Udemba, E.N.; Güngör, H.; Bekun, F.V.; Kirikkaleli, D. Economic performance of India amidst high CO2 emissions. Sustain. Prod. Consum. 2021, 27, 52–60. [Google Scholar] [CrossRef]
  81. Balsalobre-Lorente, D.; Bekun, F.V.; Etokakpan, M.U.; Driha, O.M. A road to enhancements in natural gas use in Iran: A multivariate modelling approach. Resour. Policy 2019, 64, 101485. [Google Scholar] [CrossRef]
  82. Saudi Arabia Ministry of Finance. Available online: https://www.mof.gov.sa/en/Pages/default.aspx (accessed on 6 July 2021).
  83. United Nations ESCWA COVID-19 “Economic Cost to the Arab Region”. Available online: https://www.unescwa.org/sites/default/files/pubs/pdf/covid-19-economic-cost-arab-region-en_0.pdf. (accessed on 17 August 2021).
Figure 1. Driving forces of economic growth in KSA, based on the empirical approach.
Sustainability 13 09476 g001
Table 1. Main statistics.
LGDPLCO2LATPLFDILOR
Mean9.1331332.67979916.053756.7508423.6380213.791645
Median9.0899192.67152516.2678020.307403.6008723.719824
Maximum10.136322.97425817.4399324.398454.4883784.264259
Minimum6.8258362.04818613.14920−22.040322.9671143.452608
Std. Dev.0.7333830.2043441.02840720.390830.3279660.287258
Skewness−1.261161−0.670195−1.469093−0.5904580.2705560.414233
Kurtosis5.0804833.3765954.6840881.3808702.7886731.705056
Jarque–Bera21.381033.87694222.938198.0322880.6749224.726474
Probability0.0000230.1439240.0000100.0180220.7135800.094115
Sum438.3904128.6304770.5801324.0404174.6250181.9989
Sum Sq. Dev.25.278971.96254649.7081819541.945.0554123.878313
Correlation Matrix
LGDPLCO2LATPLFDILORLSG
LGDP1.0000000.8020330.8717890.3398720.1525010.683813
LCO20.8020331.0000000.7064800.2285030.1009530.643952
LATP0.8717890.7064801.0000000.290774−0.2459930.756236
LFDI0.3398720.2285030.2907741.000000−0.1454790.340351
LOR0.1525010.100953−0.245993−0.1454791.000000−0.208176
LSG0.6838130.6439520.7562360.340351−0.2081761.000000
Table 2. Stationarity analysis: unit root test table (PP).
ParametersTestsLevelFirst Difference
LGDPWith Constant−3.3021 **−4.5950 *
(0.0204)(0.0005)
With Constant and Trend−3.0524−4.7560 *
(0.1296)(0.0020)
Without Constant and Trend1.2316−4.3692 *
(0.9422)(0.0000)
LCO2With Constant−3.4177−8.1029 *
(0.0152)(0.0000)
With Constant and Trend−3.8986 *−7.9553 *
(0.0198)(0.0000)
Without Constant and Trend0.9812−7.8022 *
(0.9112)(0.0000)
LATWith Constant−3.2107 *−3.4279 *
(0.0255)(0.0149)
With Constant and Trend−2.7041−4.3595 *
(0.2398)(0.0060)
Without Constant and Trend2.1360−2.4423 *
(0.9913)(0.0156)
LFDIWith Constant−5.1378 *−32.4792 *
(0.0001)(0.0001)
With Constant and Trend−5.6685 *−31.7245 *
(0.0001)(0.0000)
Without Constant and Trend−4.8669 *−23.6608 *
(0.0000)(0.0000)
LORWith Constant−2.6265 *−7.1048 *
(0.0949)(0.0000)
With Constant and Trend−2.9408−7.0426 *
(0.1596)(0.0000)
Without Constant and Trend−0.3391−7.1705 *
(0.5576)(0.0000)
LSGWith Constant1.1036−6.6842 *
(0.9970)(0.0000)
With Constant and Trend−2.3421−6.9708 *
(0.4040)(0.0000)
Without Constant and Trend5.9111−1.3899
(1.0000)(0.1507)
* Significant at the 10%; ** significant at the 5%; and *** significant at the 1%.
Table 3. Johansen cointegration test.
Hypothesized Trace0.05
No. of CE (s)EigenvalueStatisticCritical ValueProb. **
None *0.709133153.119895.75366(0.0000)
At most 1 *0.61149696.3149669.81889(0.0001)
At most 2 *0.38655252.8241947.85613(0.0159)
At most 3 *0.32526430.3458529.79707(0.0432)
At most 40.23338312.2478915.49471(0.1454)
At most 50.0004900.0225623.841466(0.8805)
Trace test indicates 4 cointegrating eqn(s) at the 0.05 level. * Denotes rejection of the hypothesis at the 0.05 level. ** [76] p-values.
Table 4. Fully modified least squares (FMOLS); estimation results.
Dependent Variable: LGDP
Sample (Adjusted): 1980–2017
VariableEQUATION 1EQUATION 2EQUATION 3
LCO20.642133 *-0.988331 *
(2.528931)-(2.740381)
−0.0164-−0.0097
LATP0.211397 *0.323365 *0.300764 *
(3.648095)(9.563297)(4.903738)
−0.000900
LOR0.543425 *0.527164 *0.443512 *
(5.005847)(7.775293)(2.831478)
00−0.0077
LFDI0.005514 *0.008875 *0.007508 *
(3.195932)(8.069035)(3.041973)
−0.00310−0.0045
LSG0.547957 *0.533099 *-
(2.785838)(4.311338)-
−0.0088−0.0001-
R-squared0.8365770.7848850.799044
Adjusted R-squared0.8167680.7659050.781312
SE of regression0.2020230.2283480.220705
Long-run variance0.0398310.0166530.085015
Mean dependent var9.3493429.3493429.349342
S.D. dependent var0.4719550.4719550.471955
Sum squared residuals1.346841.7728511.656168
Note: * denotes significance at 1%.
Table 5. Pairwise Granger causality tests.
Null Hypothesis:F-StatisticProb.
LATP does not Granger Cause LCO23.30669 **(0.0499)
LCO2 does not Granger Cause LATP3.69643 **(0.0363)
LFDI does not Granger Cause LCO20.35628(0.7031)
LCO2 does not Granger Cause LFDI2.73649 ***(0.0805)
LGDP does not Granger Cause LCO22.36020(0.1111)
LCO2 does not Granger Cause LGDP0.62411(0.5423)
LSG does not Granger Cause LCO24.64631 *(0.0172)
LCO2 does not Granger Cause LSG0.84379(0.4397)
LFDI does not Granger Cause LATP0.05635(0.9453)
LATP does not Granger Cause LFDI6.59506 *(0.0041)
LGDP does not Granger Cause LATP3.06723 **(0.0609)
LATP does not Granger Cause LGDP4.40935 **(0.0206)
LSG does not Granger Cause LATP2.72093 **(0.0815)
LATP does not Granger Cause LSG4.71156(0.0163)
LGDP does not Granger Cause LFDI7.71131(0.0019)
LFDI does not Granger Cause LGDP0.94107(0.4011)
LSG does not Granger Cause LFDI1.41193(0.2589)
LFDI does not Granger Cause LSG0.48810(0.6184)
LSG does not Granger Cause LGDP14.1377 *(0.00004)
LGDP does not Granger Cause LSG0.75914(0.4766)
Publisher’s Note: MDPI stays neutral with regard to jurisdictional claims in published maps and institutional affiliations.

