
Solar Irradiance Reduction Using Optimized Green Infrastructure in Arid Hot Regions: A Case Study in El-Nozha District, Cairo, Egypt


Abstract
:1. Introduction
1.1. MENA Region Climates
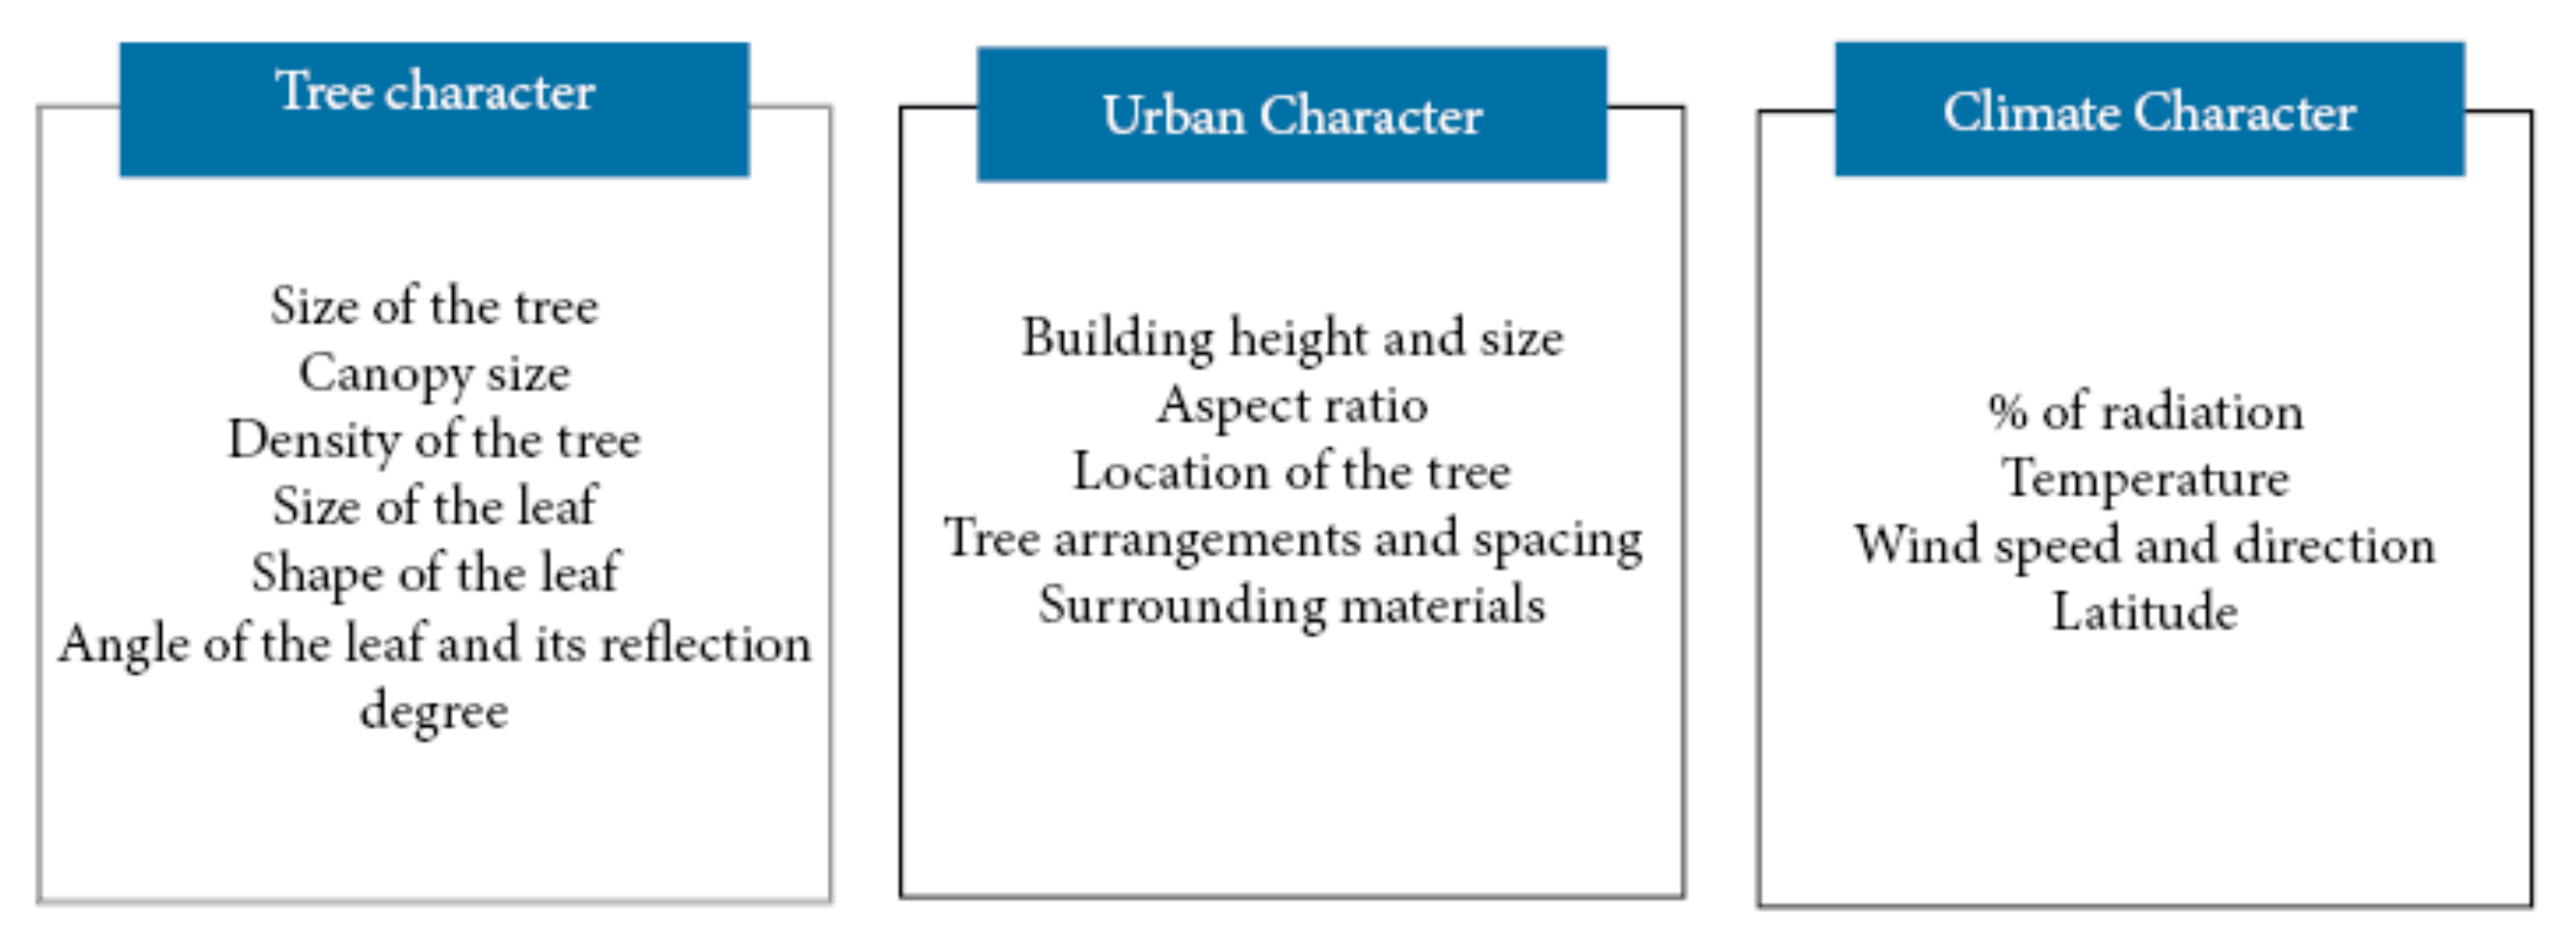
1.2. Urban Trees
1.3. Mitigation Strategies: Numerical Assessment of Different Proposed Tree Patterns
1.4. Problem Statement
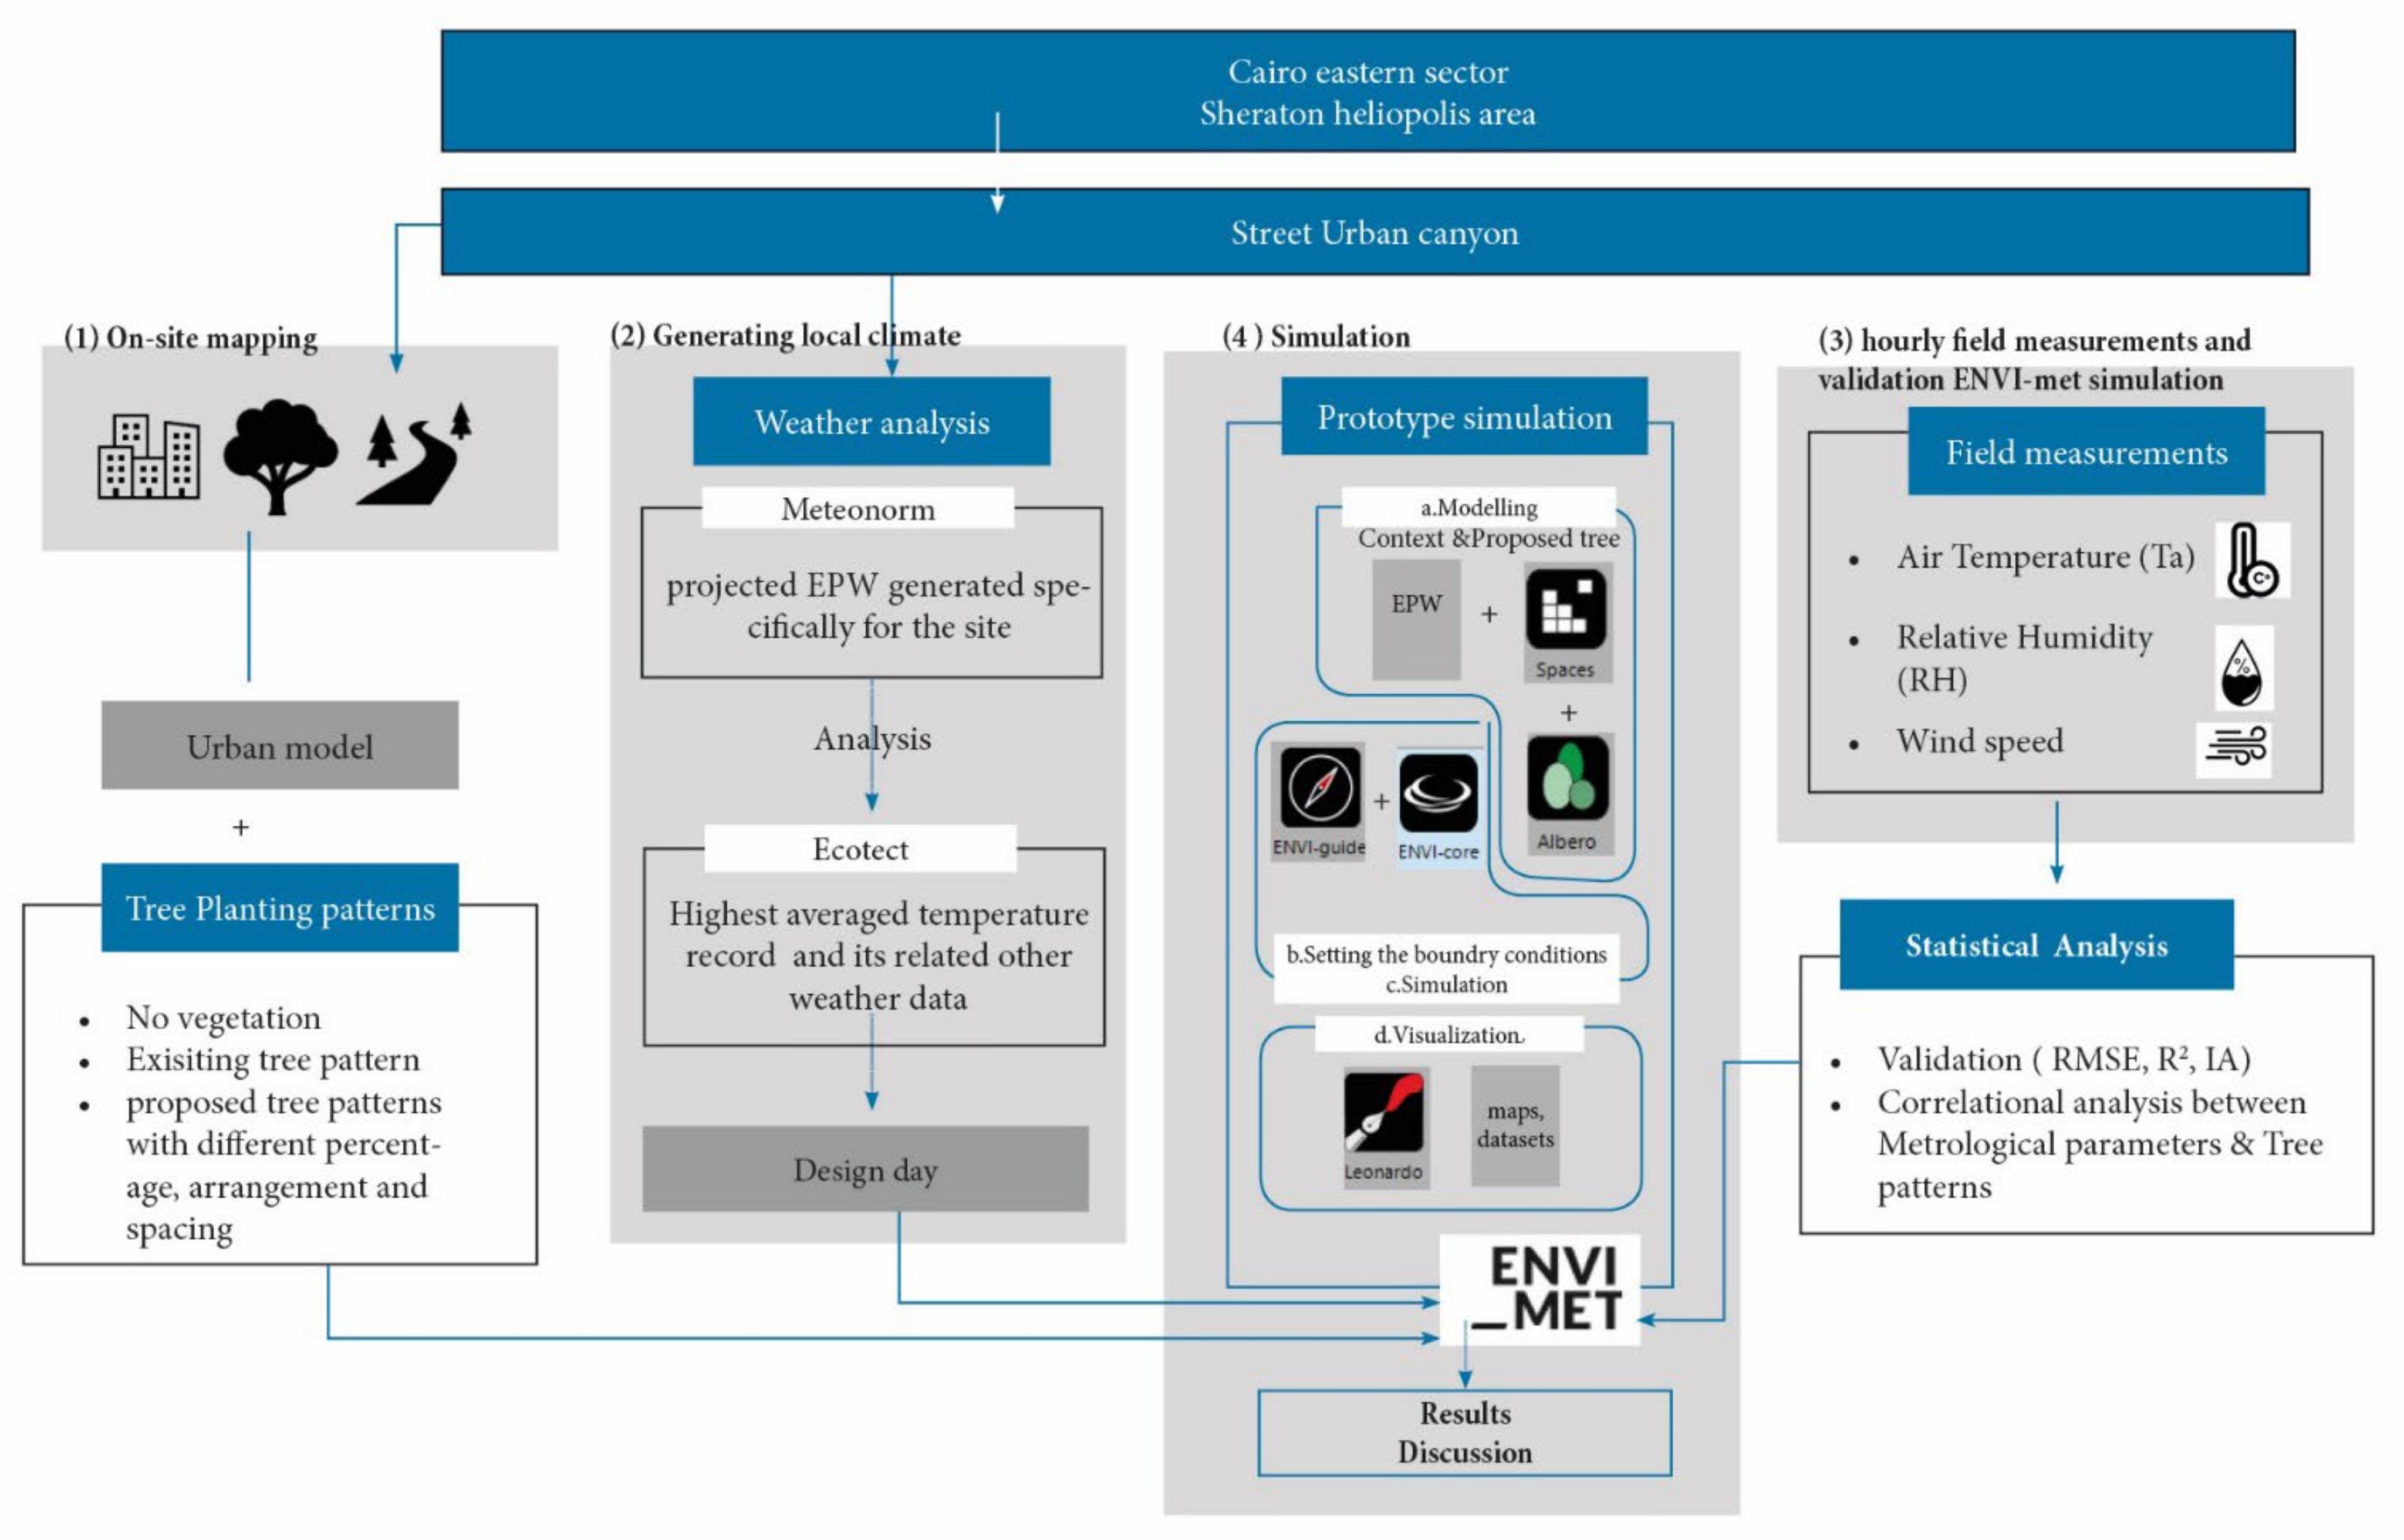
2. Methodology
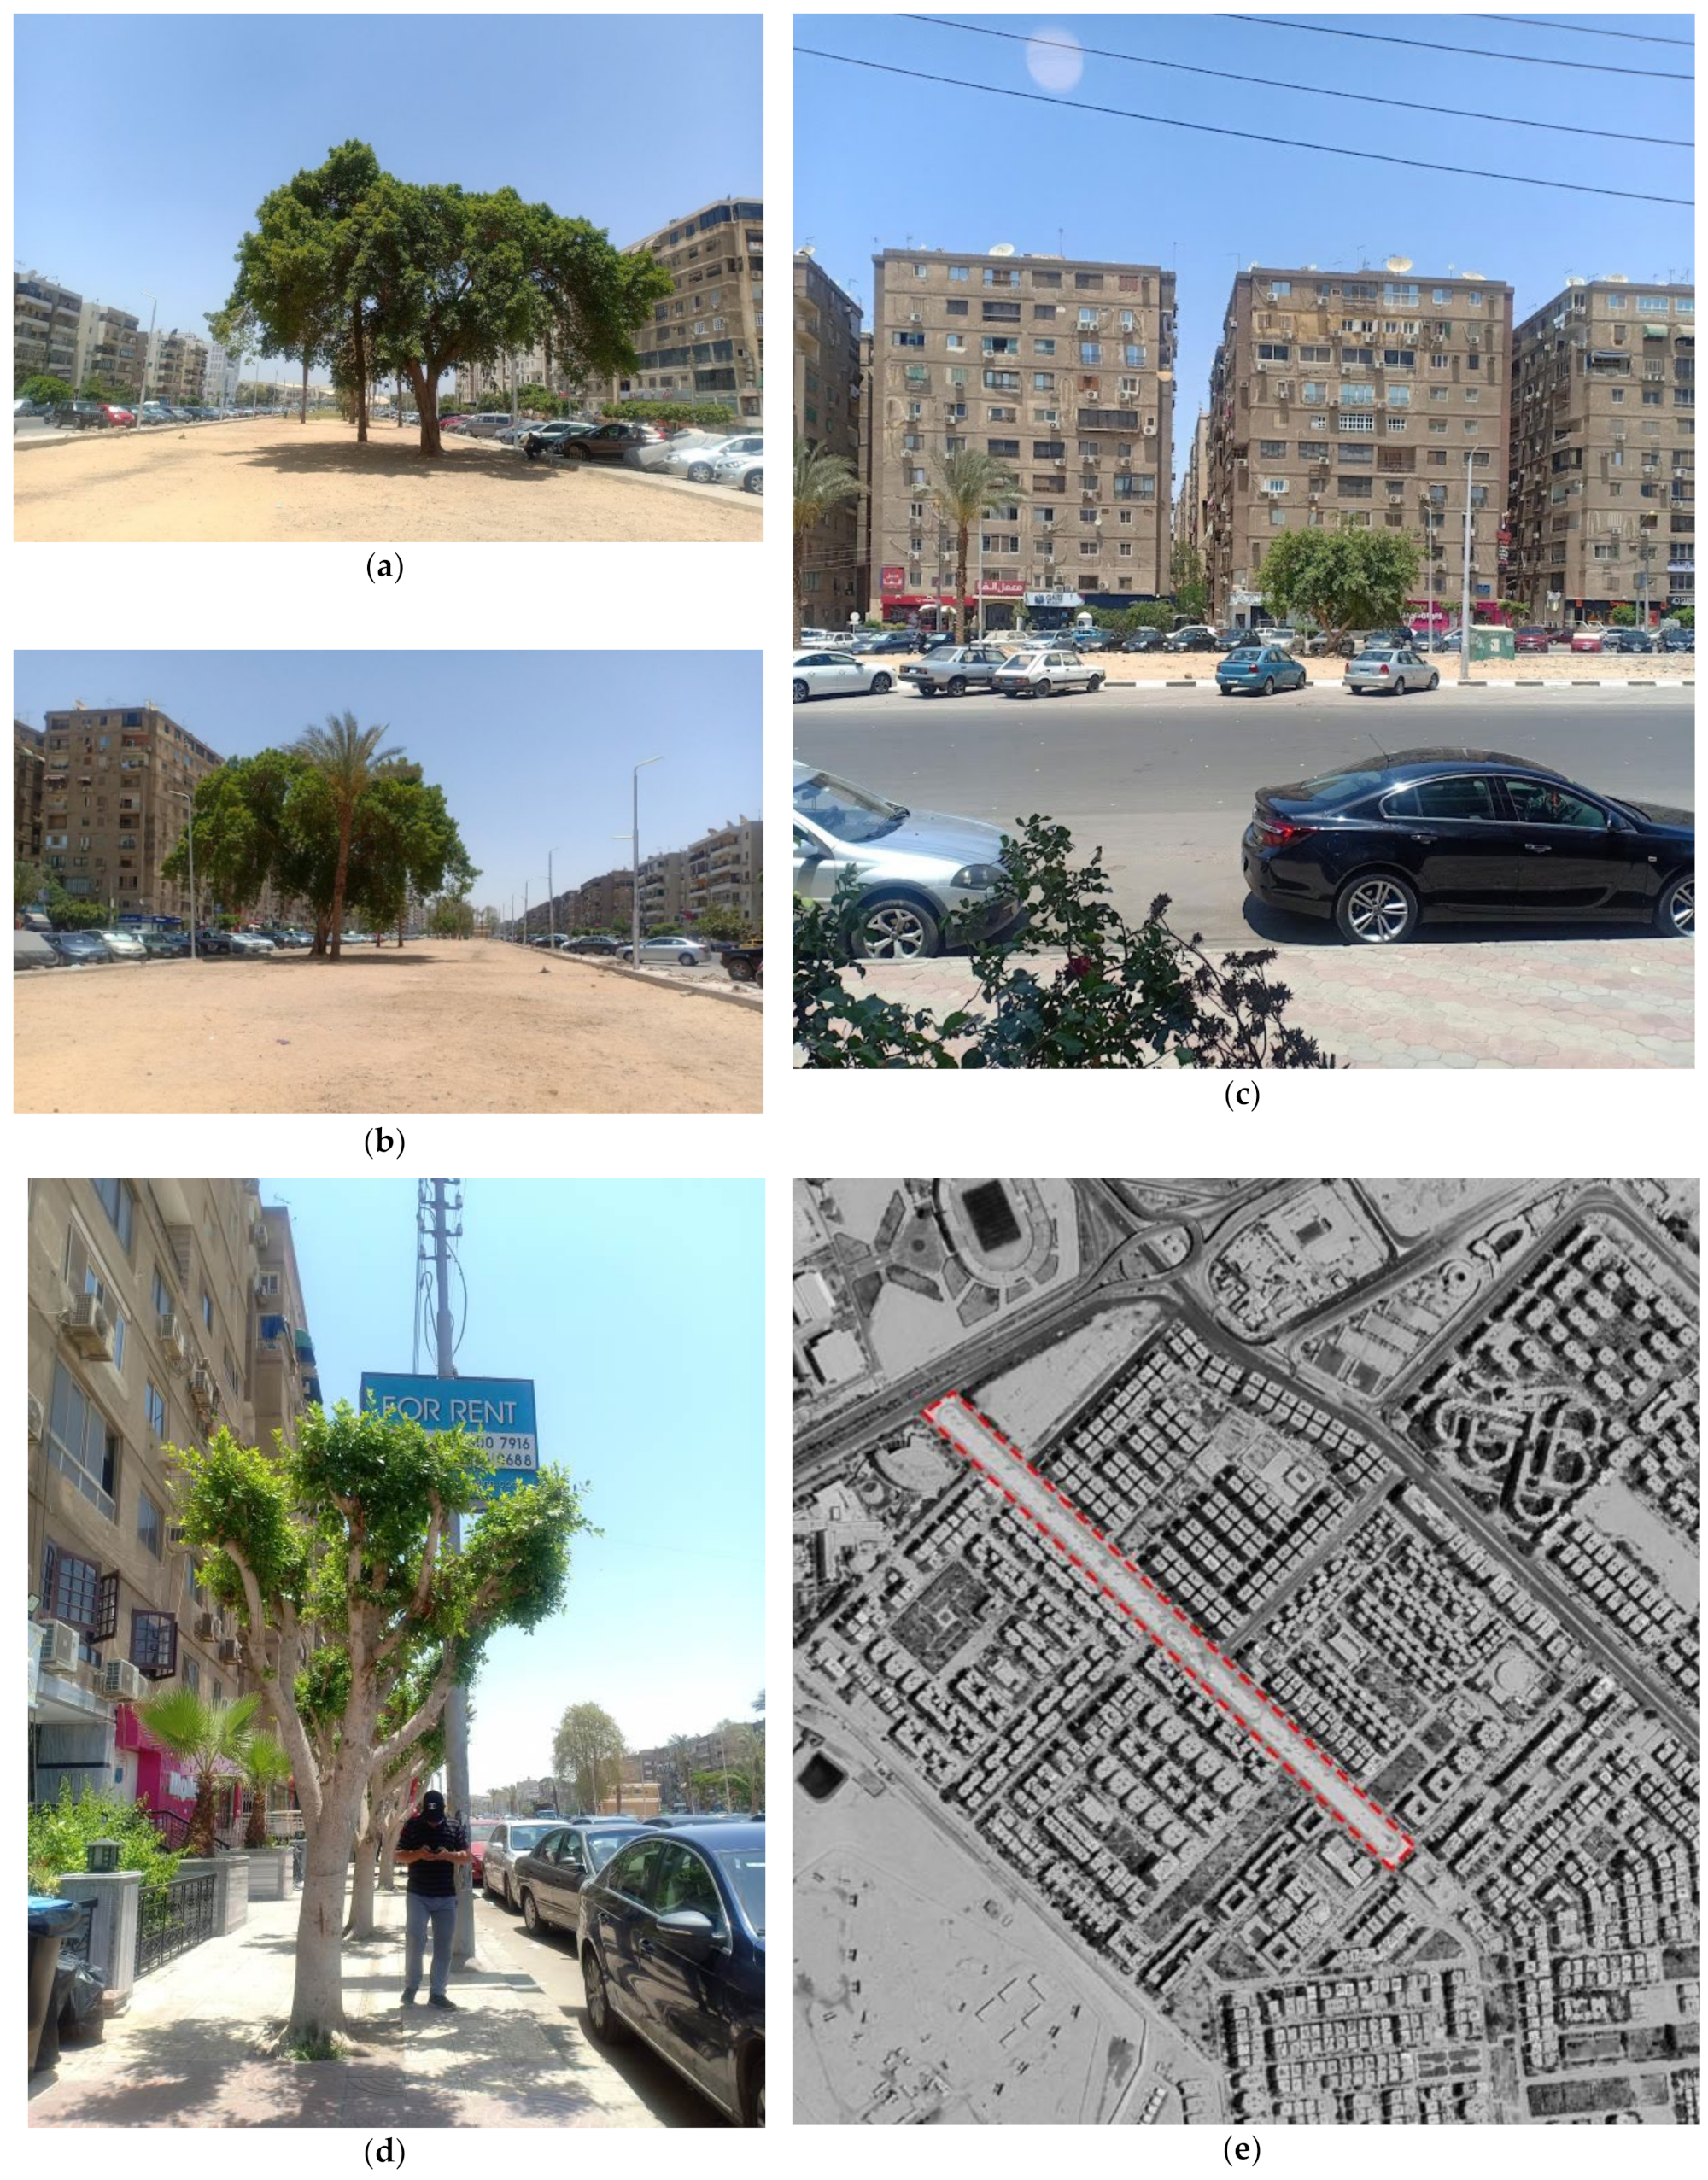
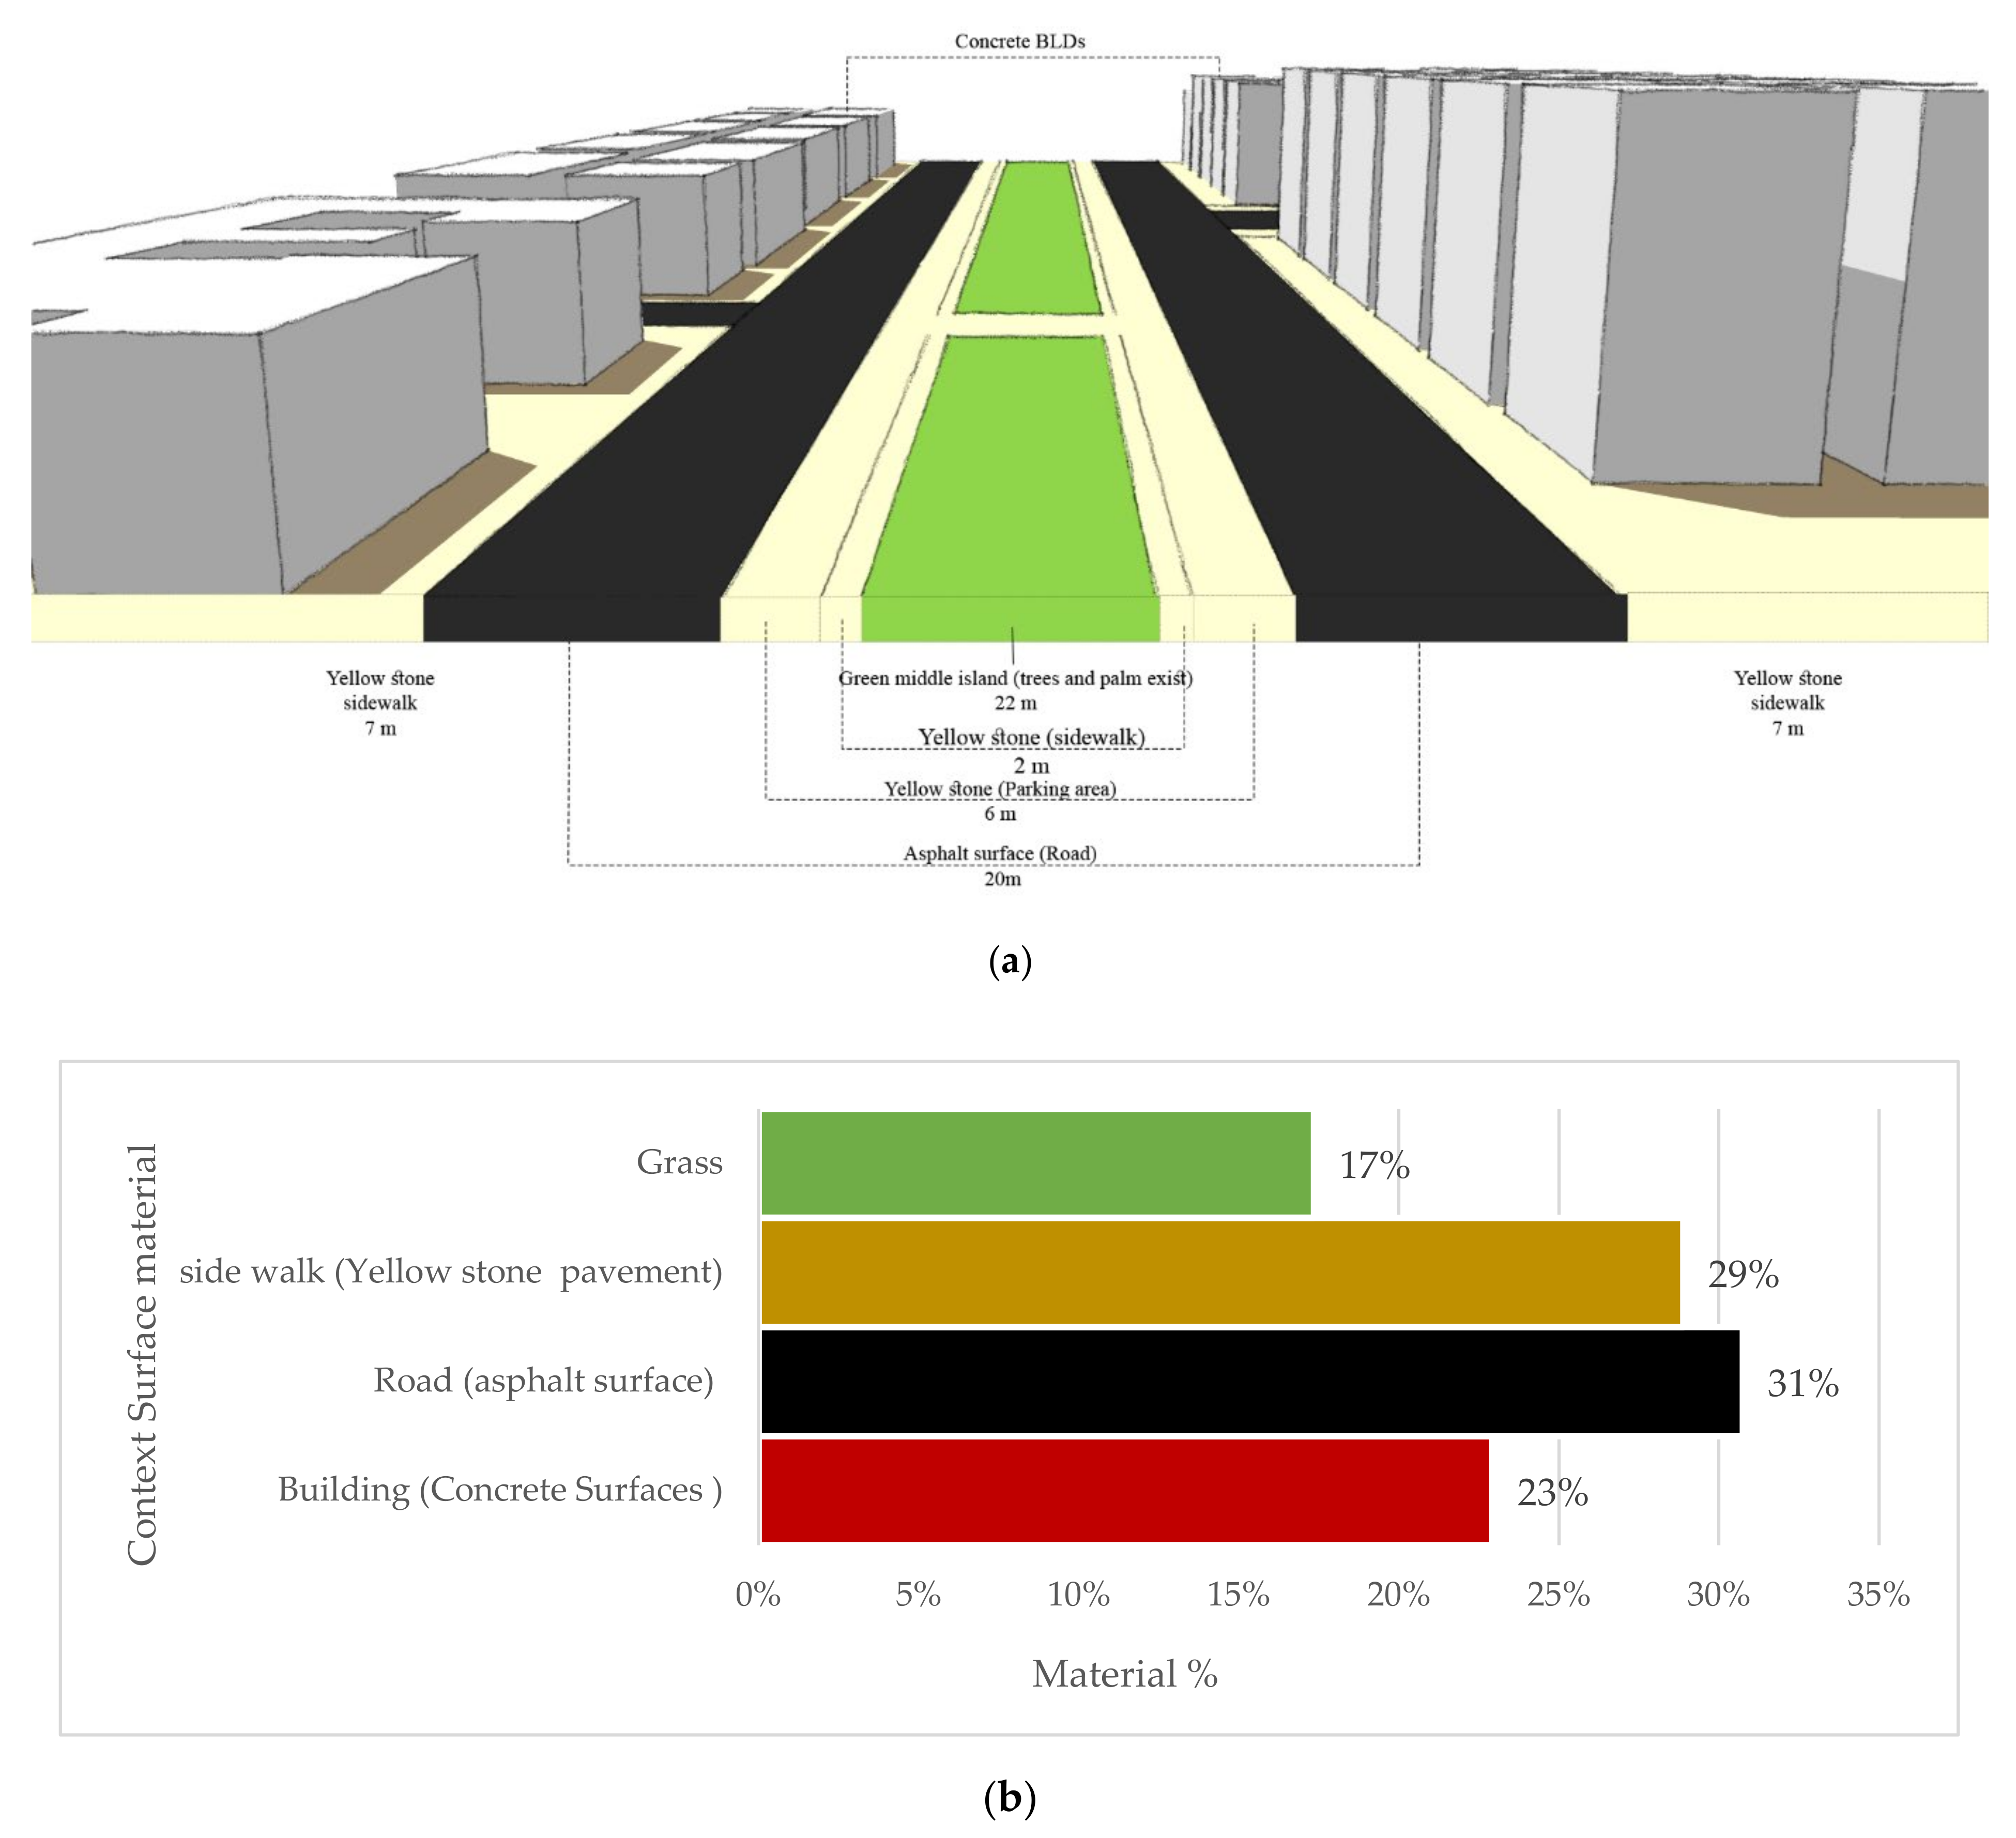
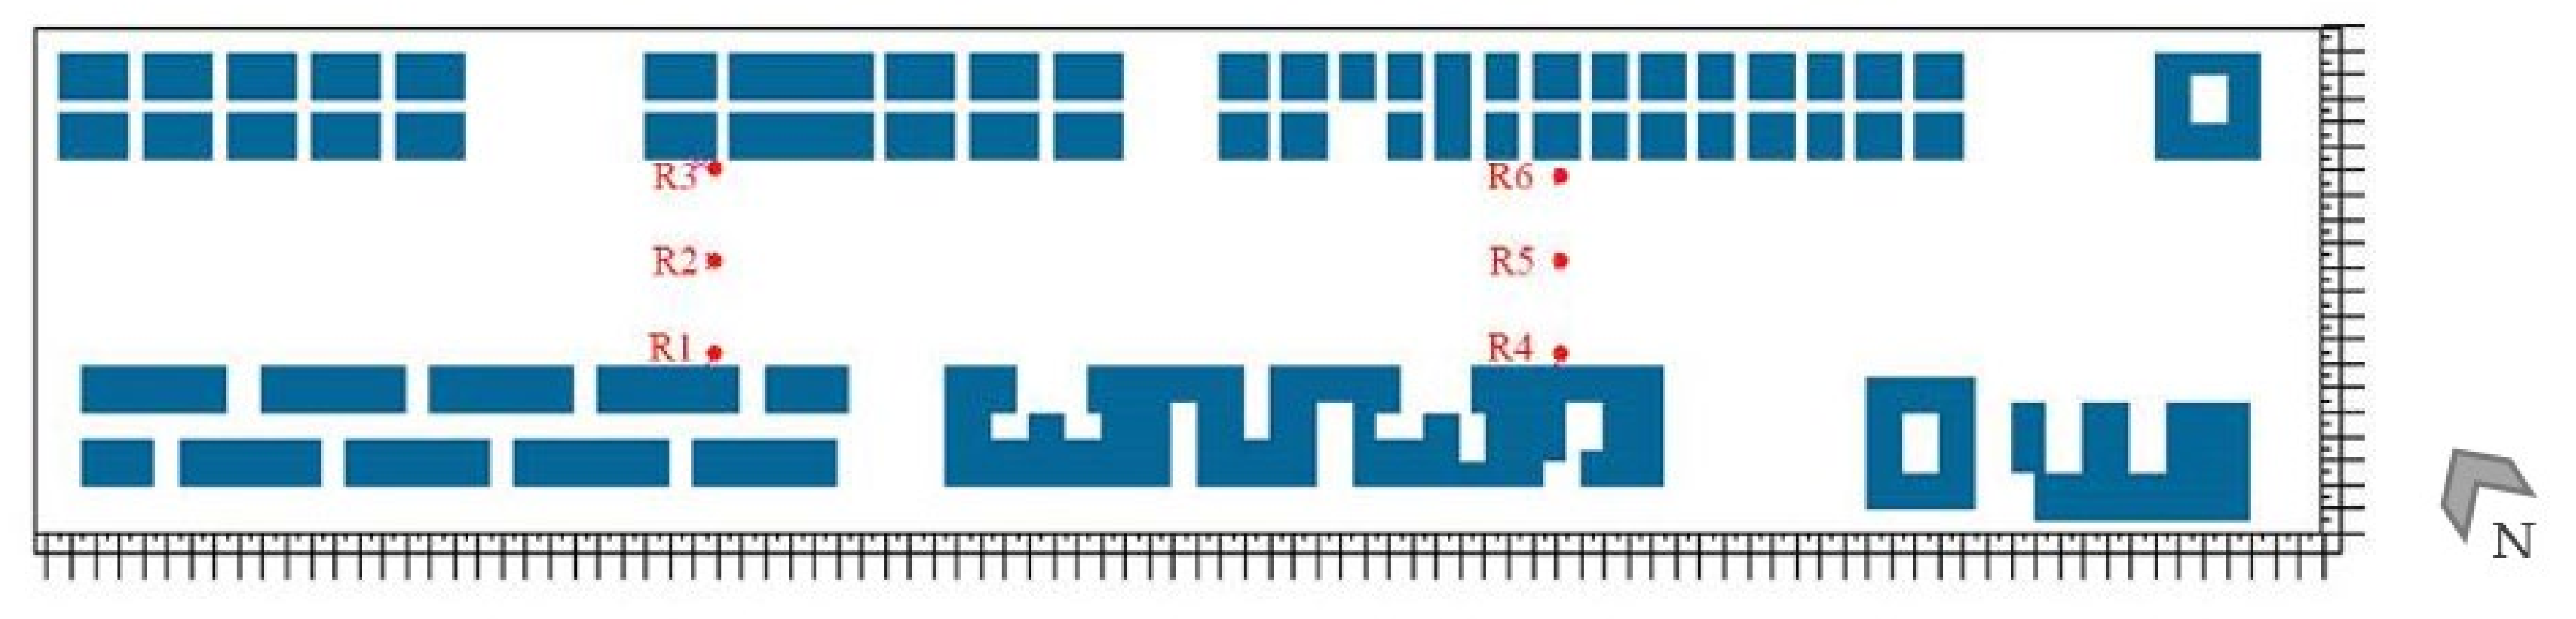
2.1. Case Study
2.2. Methods and Scenarios
2.2.1. Urban Trees
2.2.2. ENVI-Met Modeling Scenarios, Calibration, and Sensitivity
- In the designed scenarios, the spacing between trees was 5 m and equidistant, as Abu Ali et al. have shown that 6 m spacing performs better than 8 m, with respect to climate moderation. A 5 m spacing was selected, according to the developed horizontal grid (dx = dy = 5) for the site ENVI-met model.
- Following the previous point, no spacing was added to the scenarios, in order to maximize the tree density with no overlap. The superior performance of small, dense trees has been discussed by Zhao et al. (2008) [24].
- Small-sized trees were selected in the first place, knowing that their performance for moderating temperature is less than large trees during the day; however, at night, the smallest temperature increase has been observed with small trees [16].
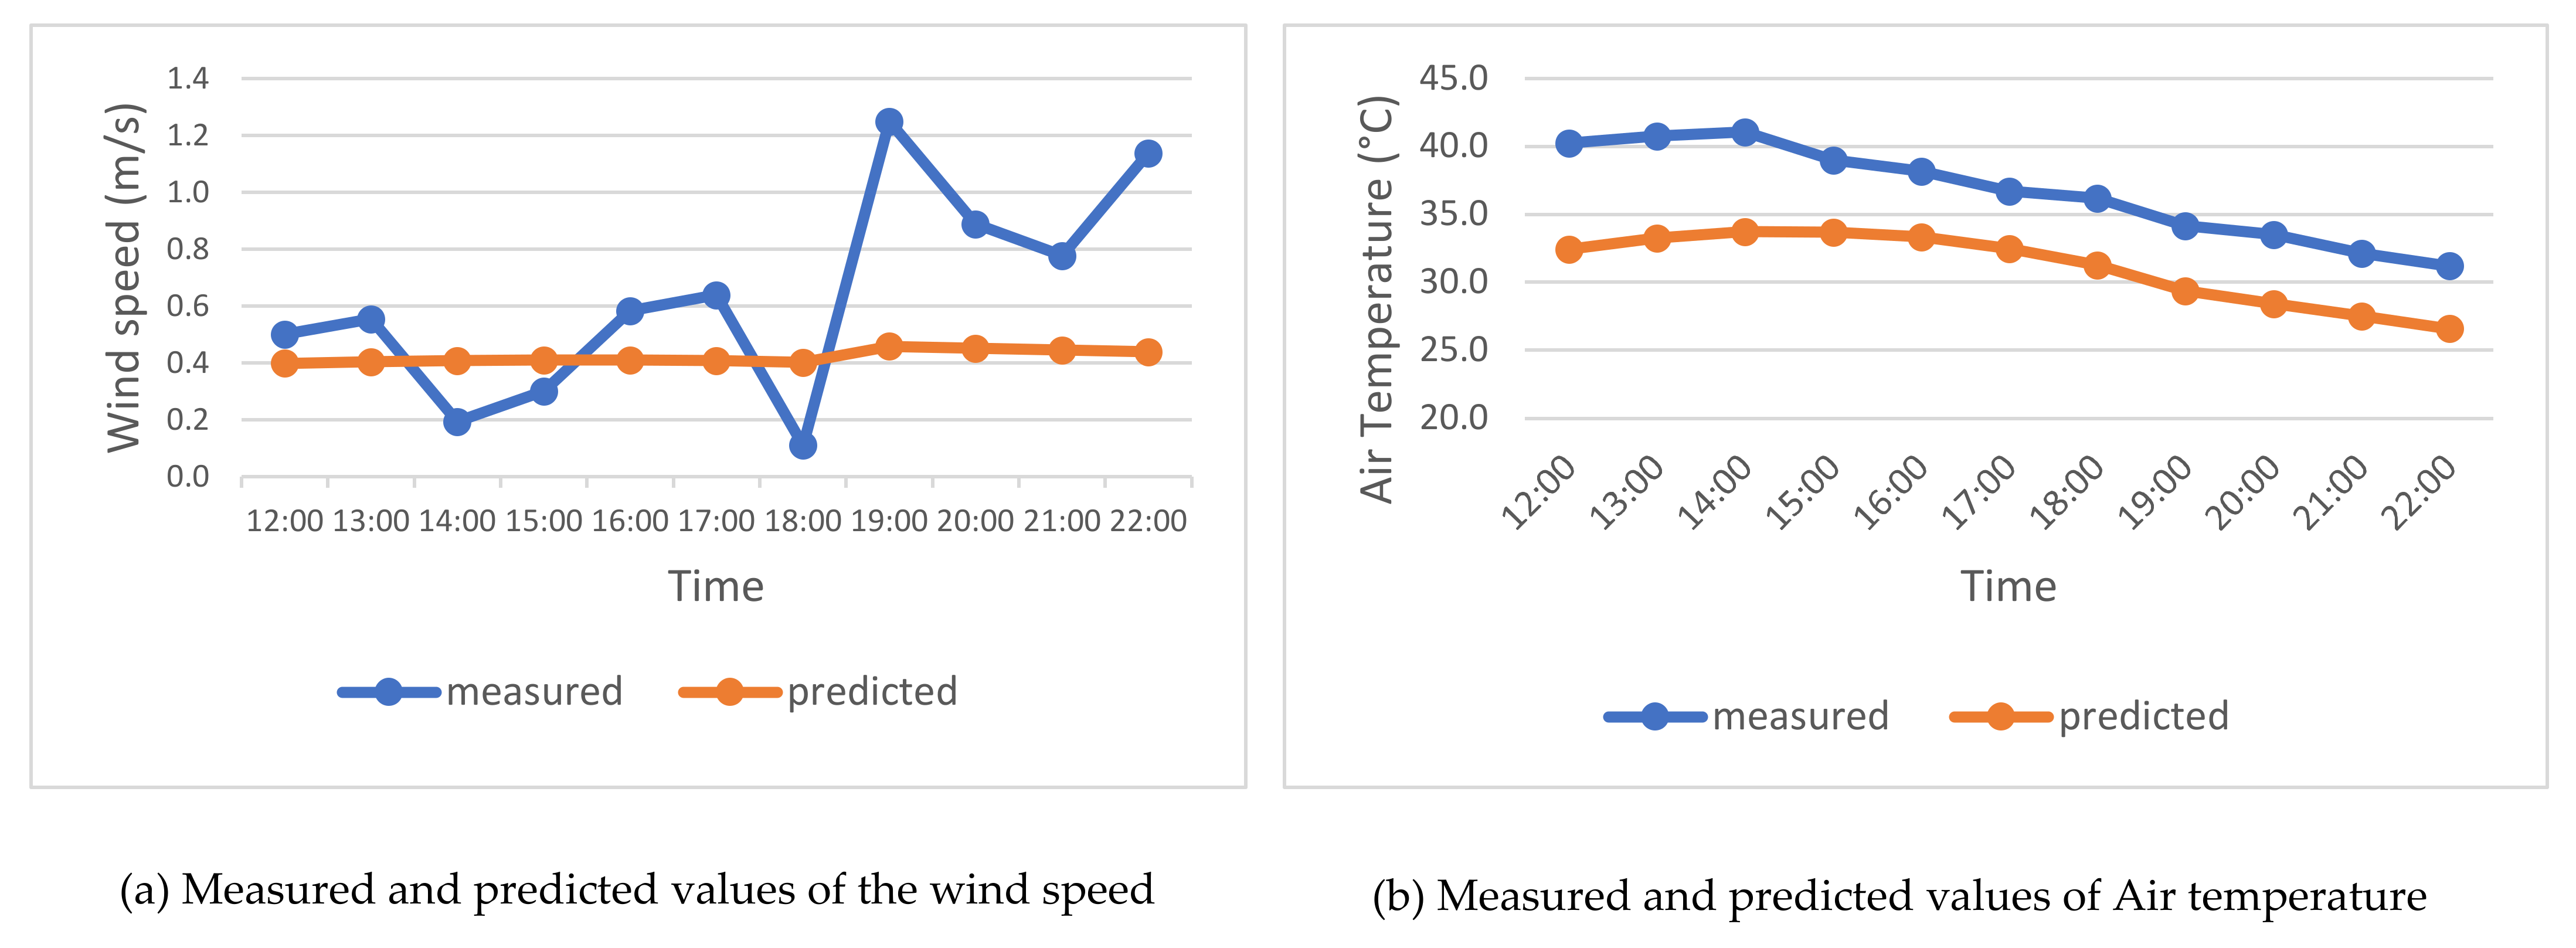
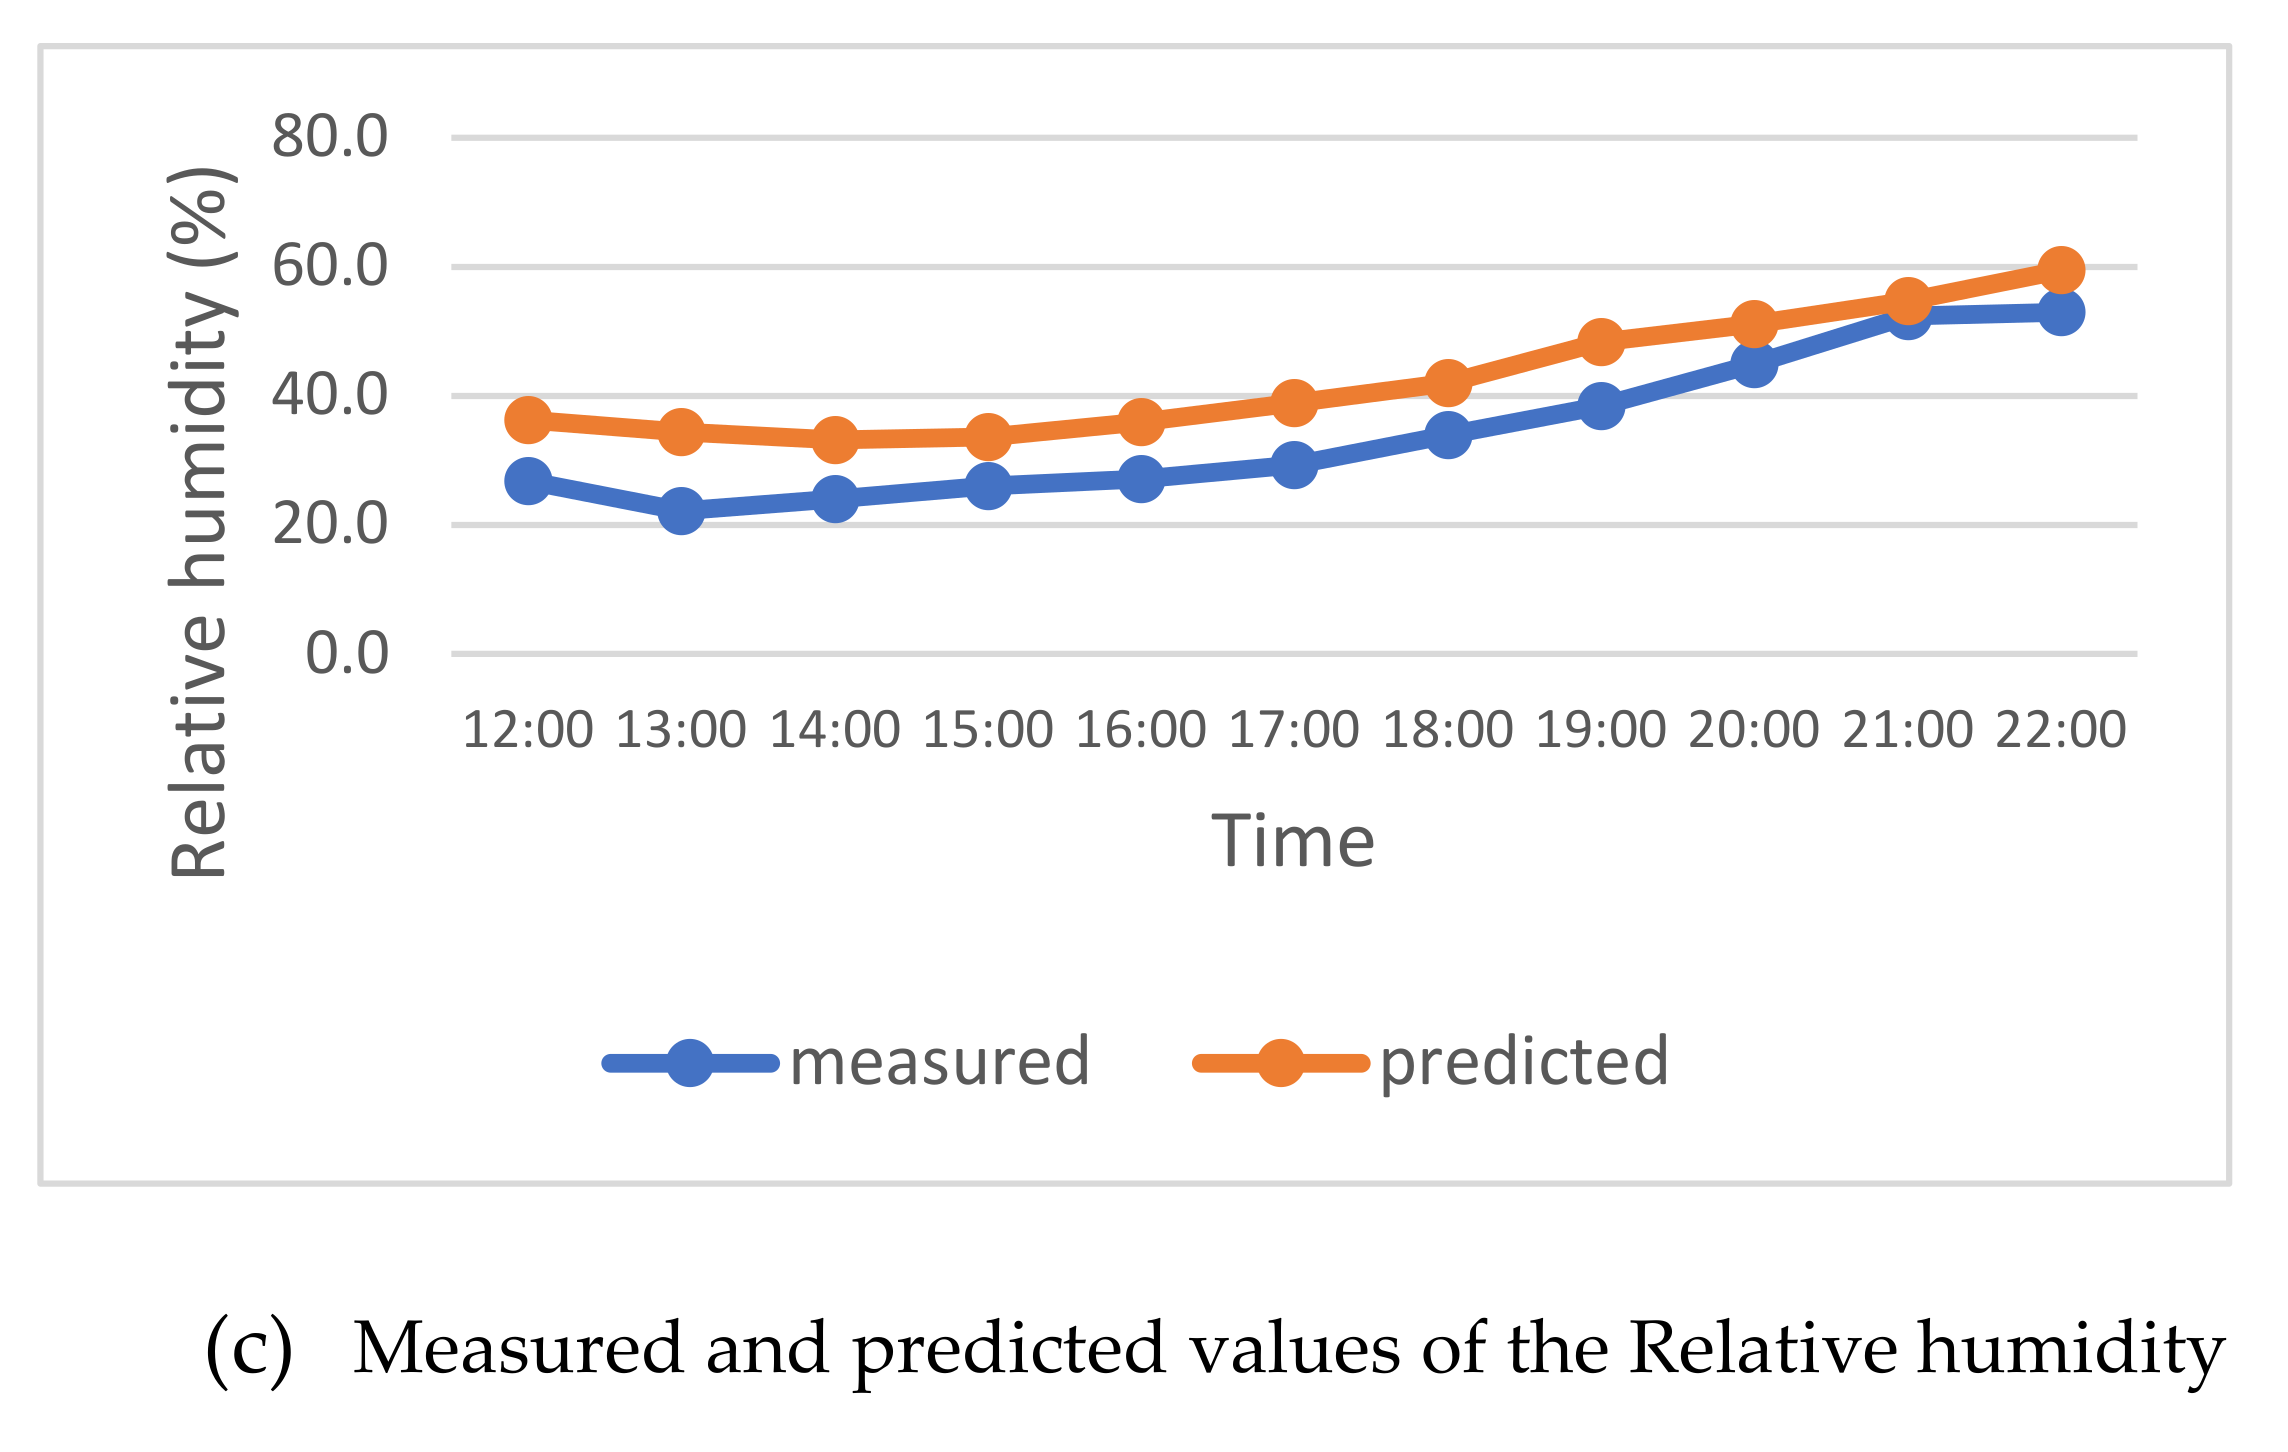
2.2.3. ENVI-Met Model Validation
3. Results
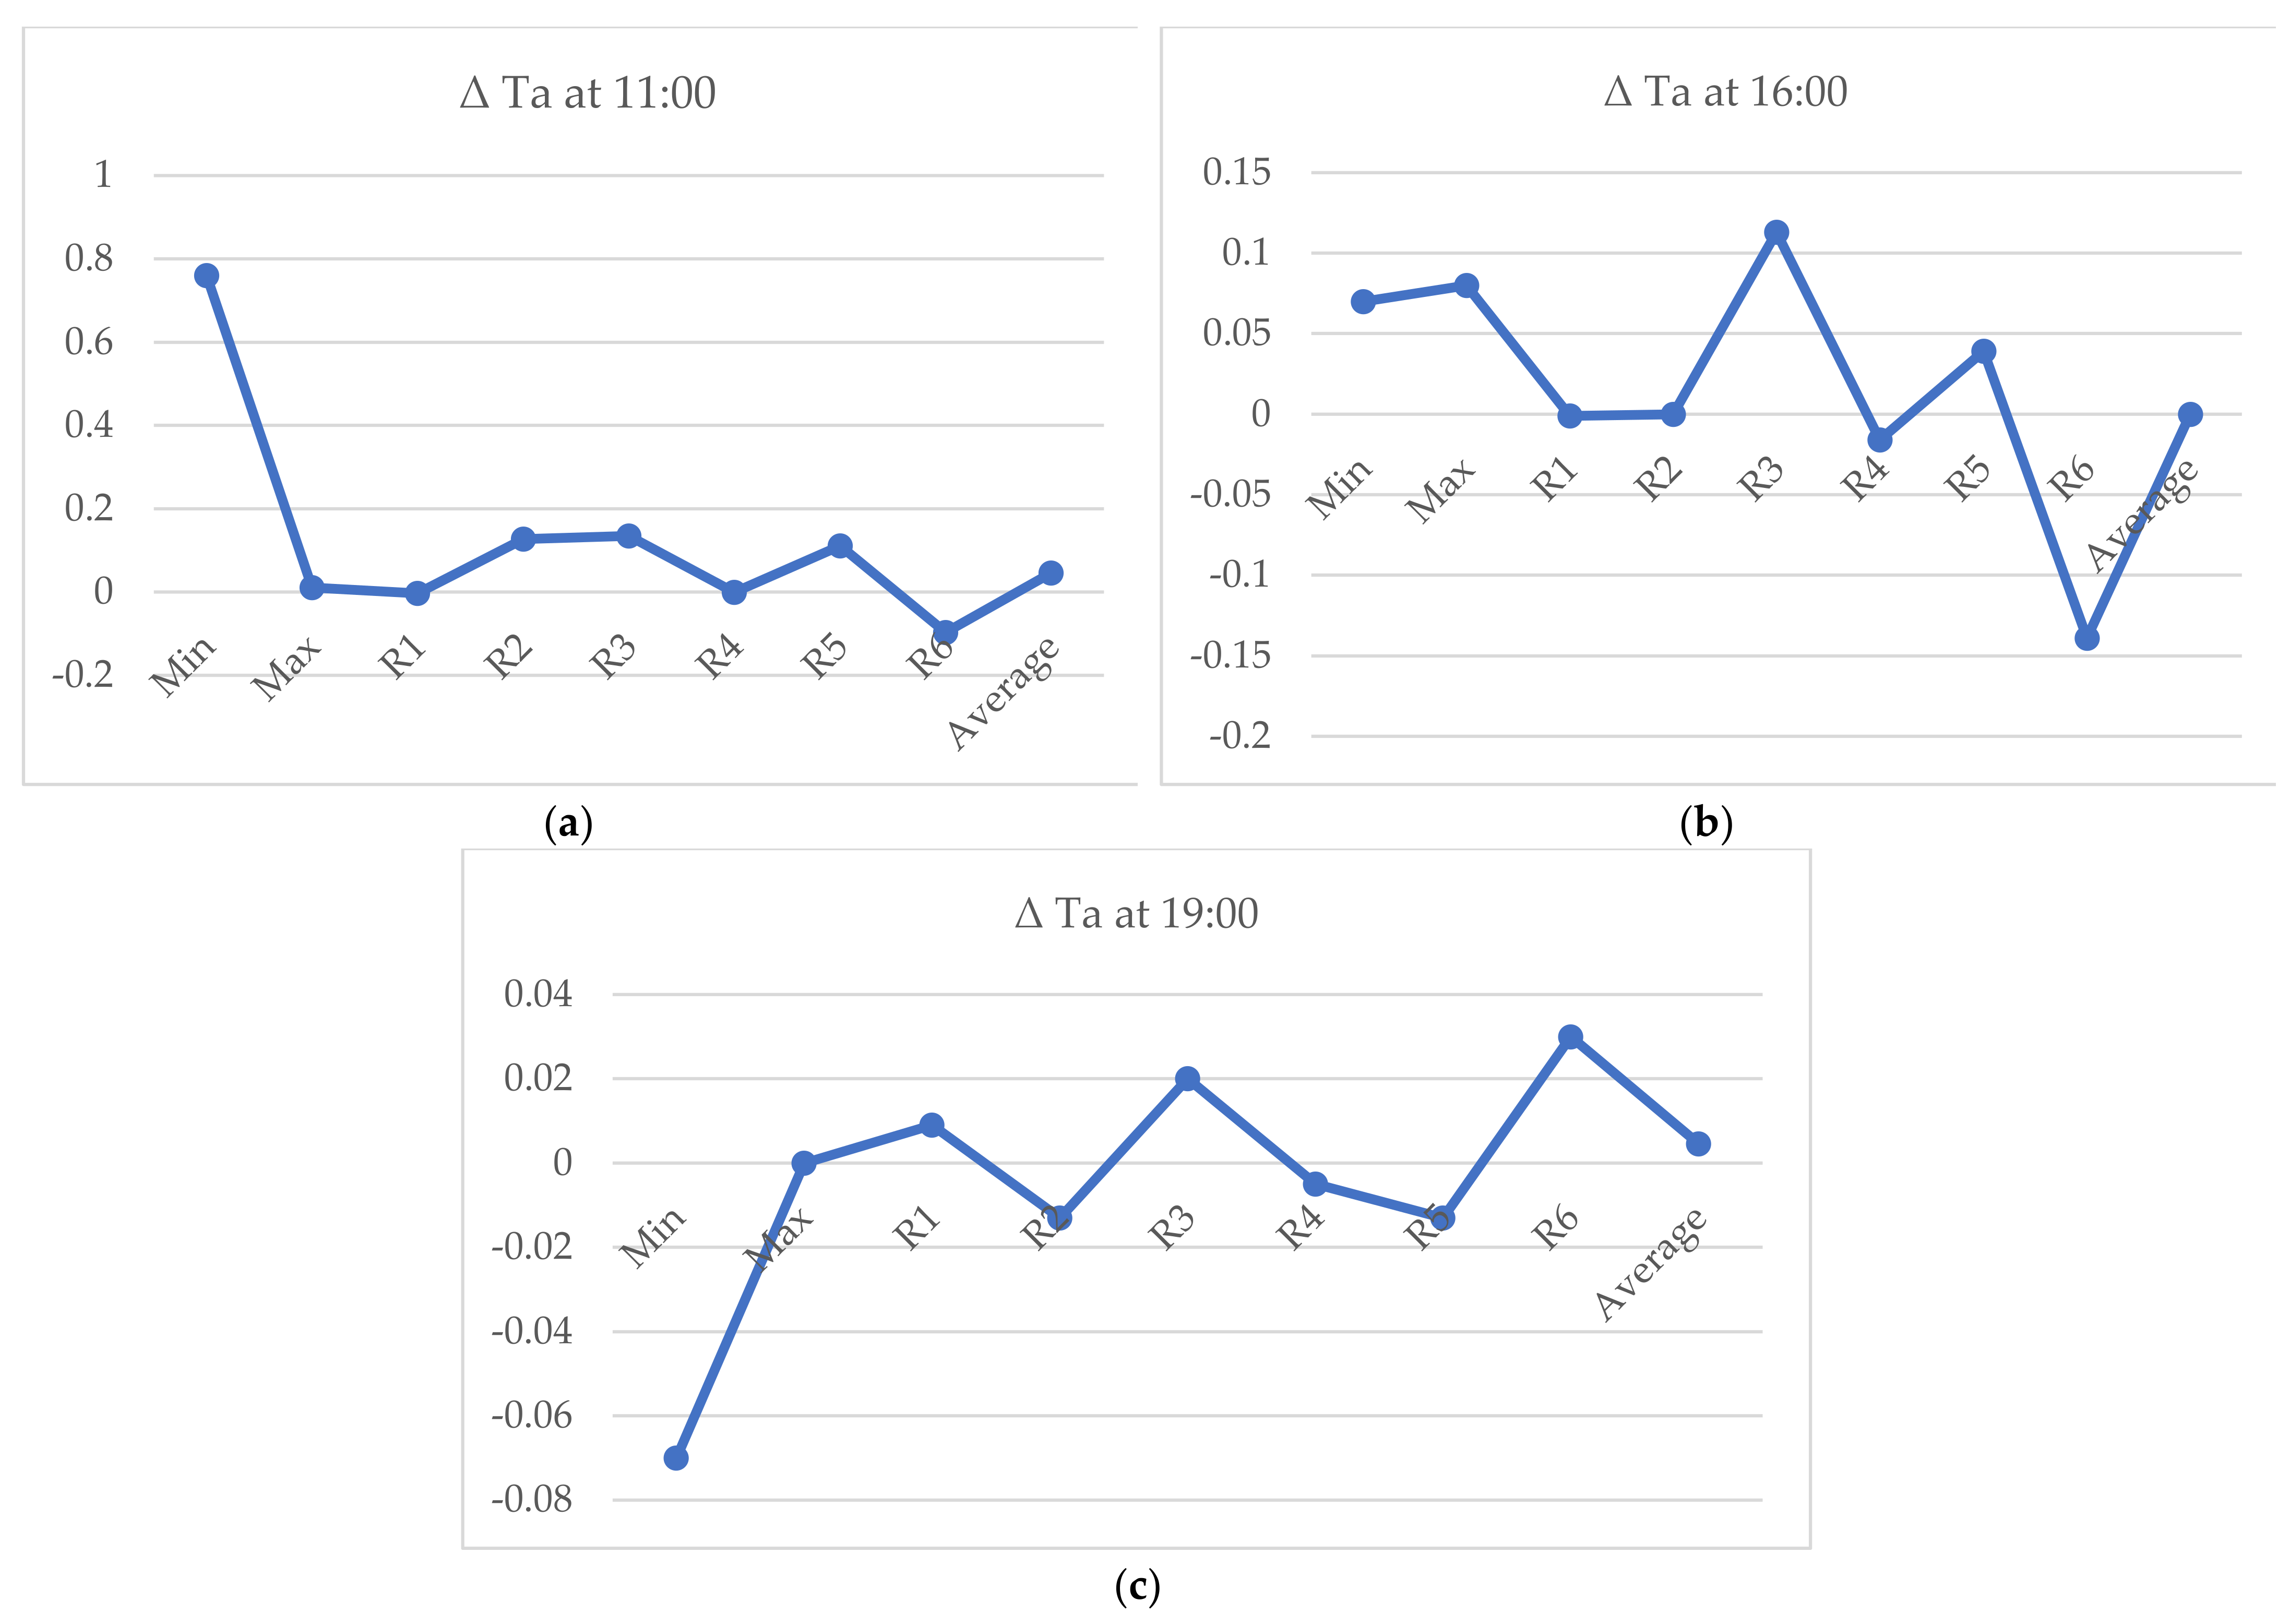
3.1. Current Design and No-Vegetation Scenarios
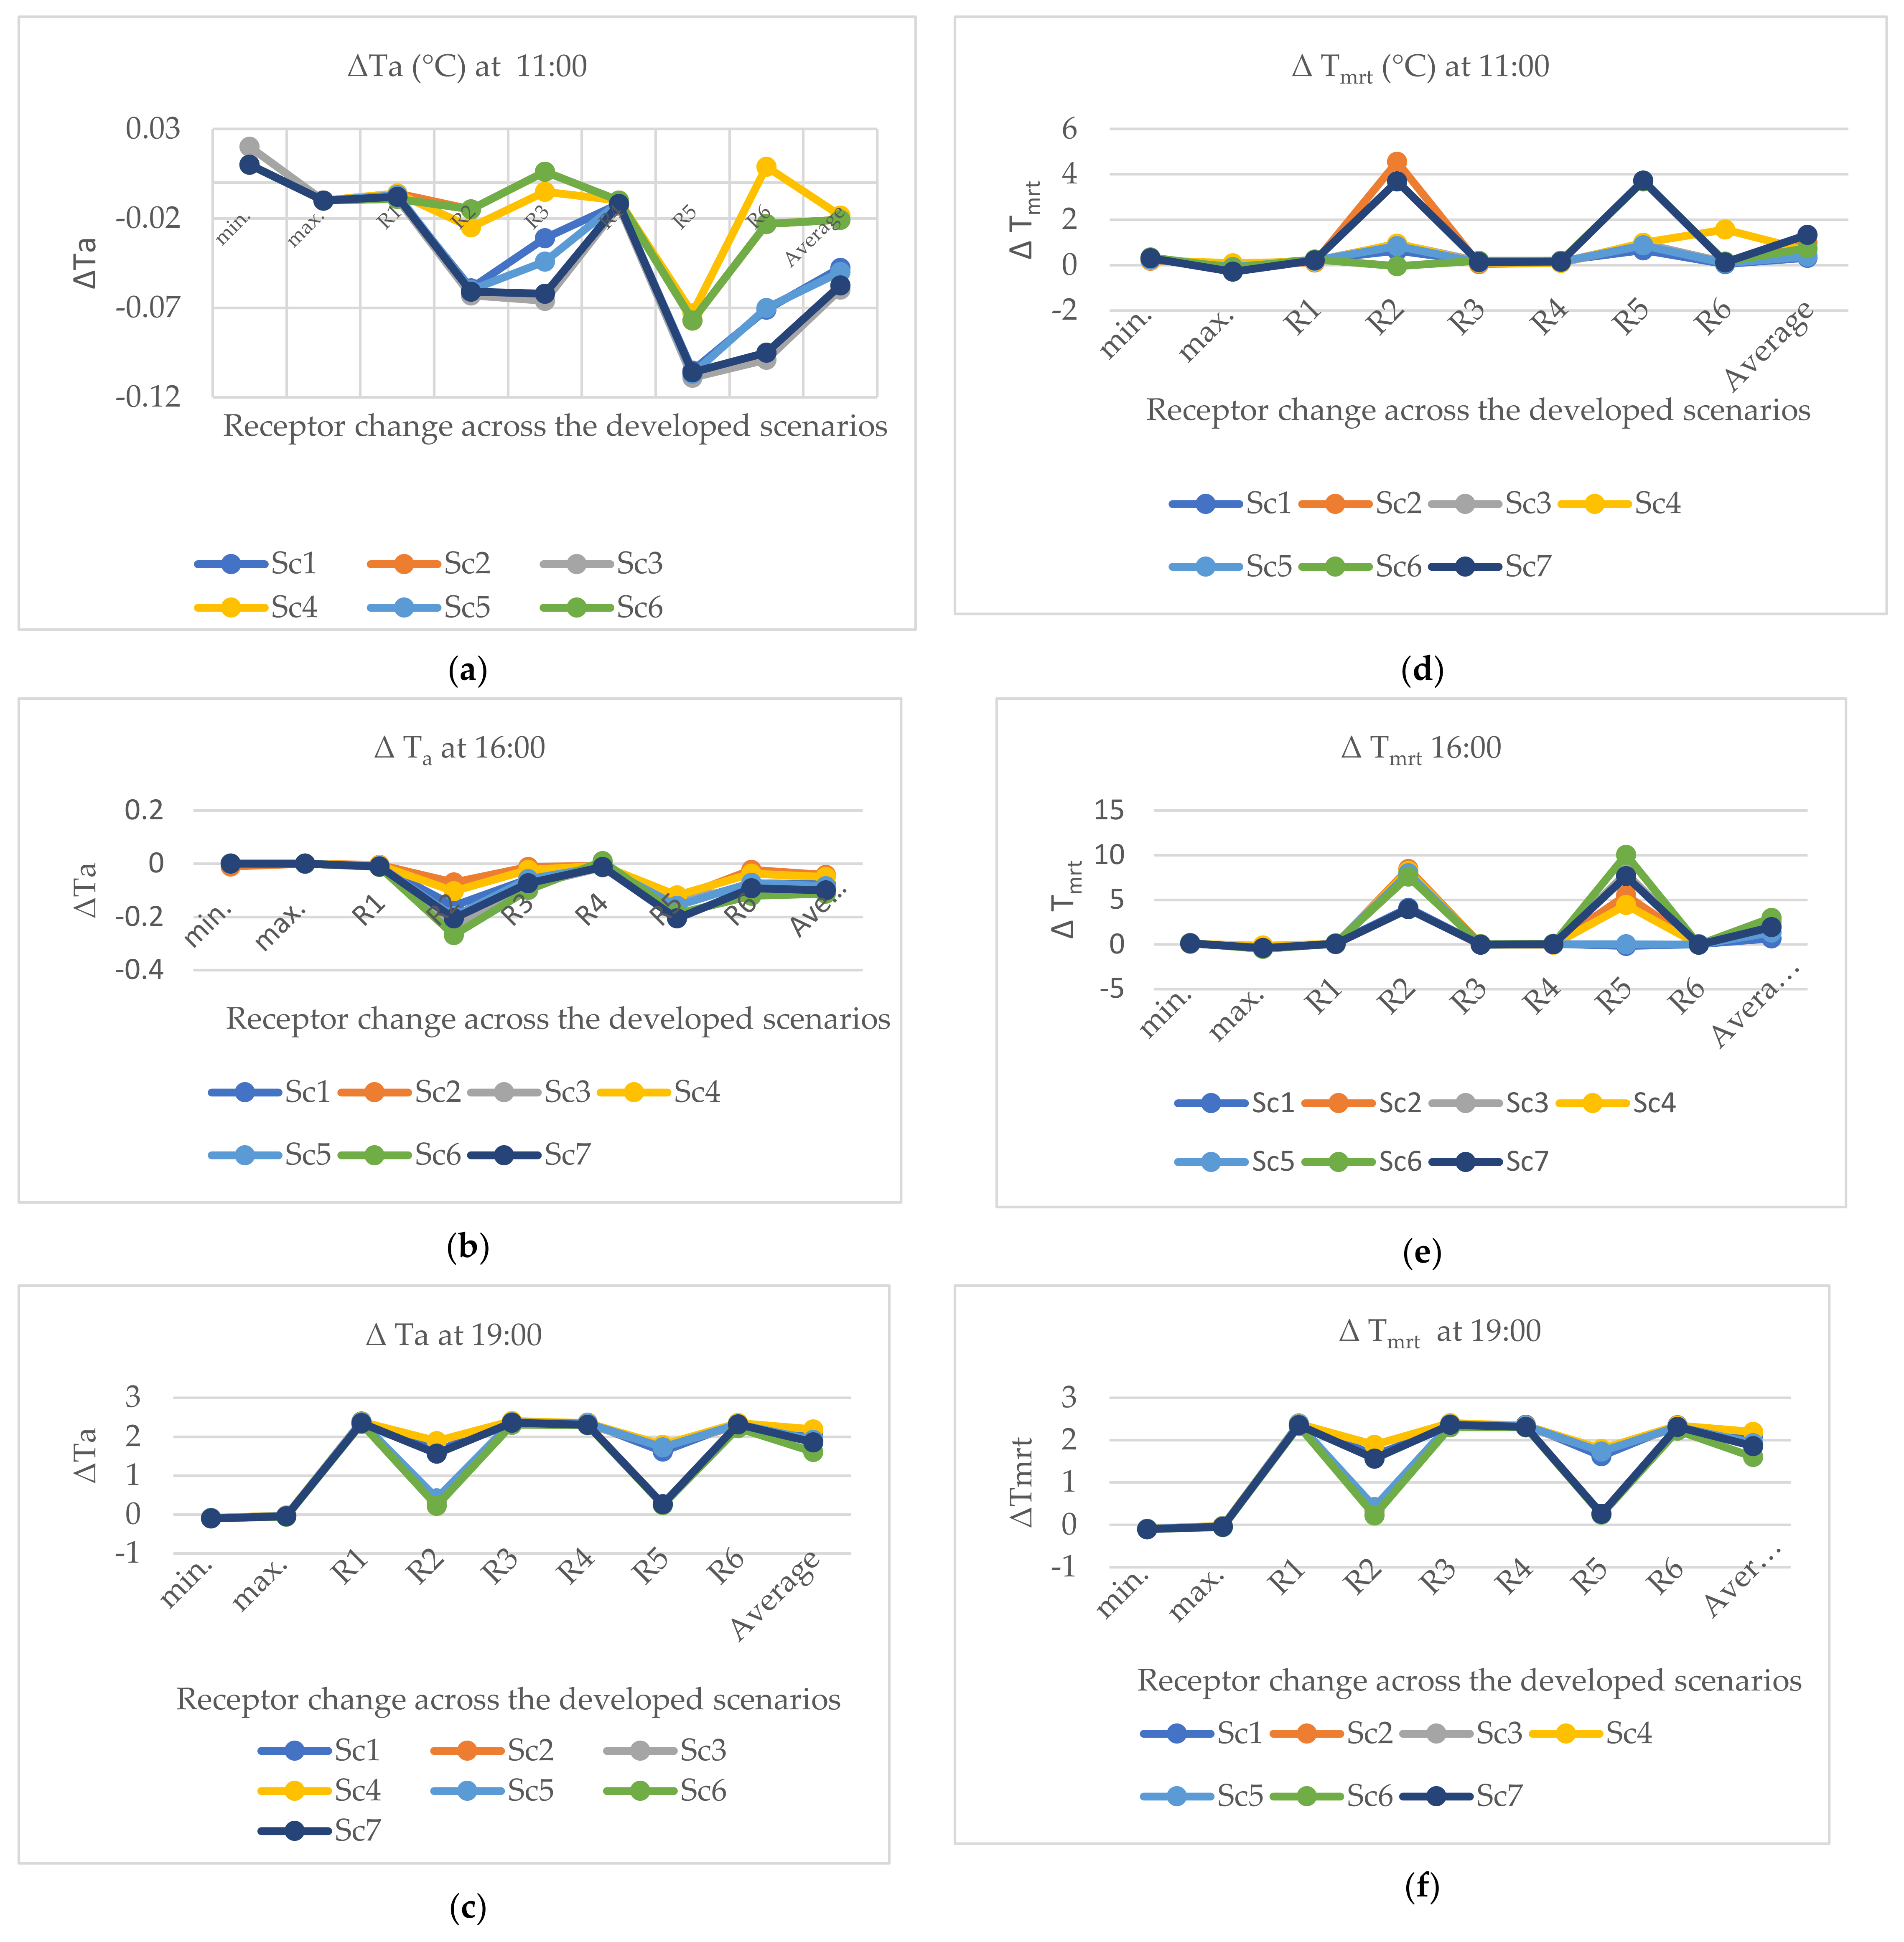
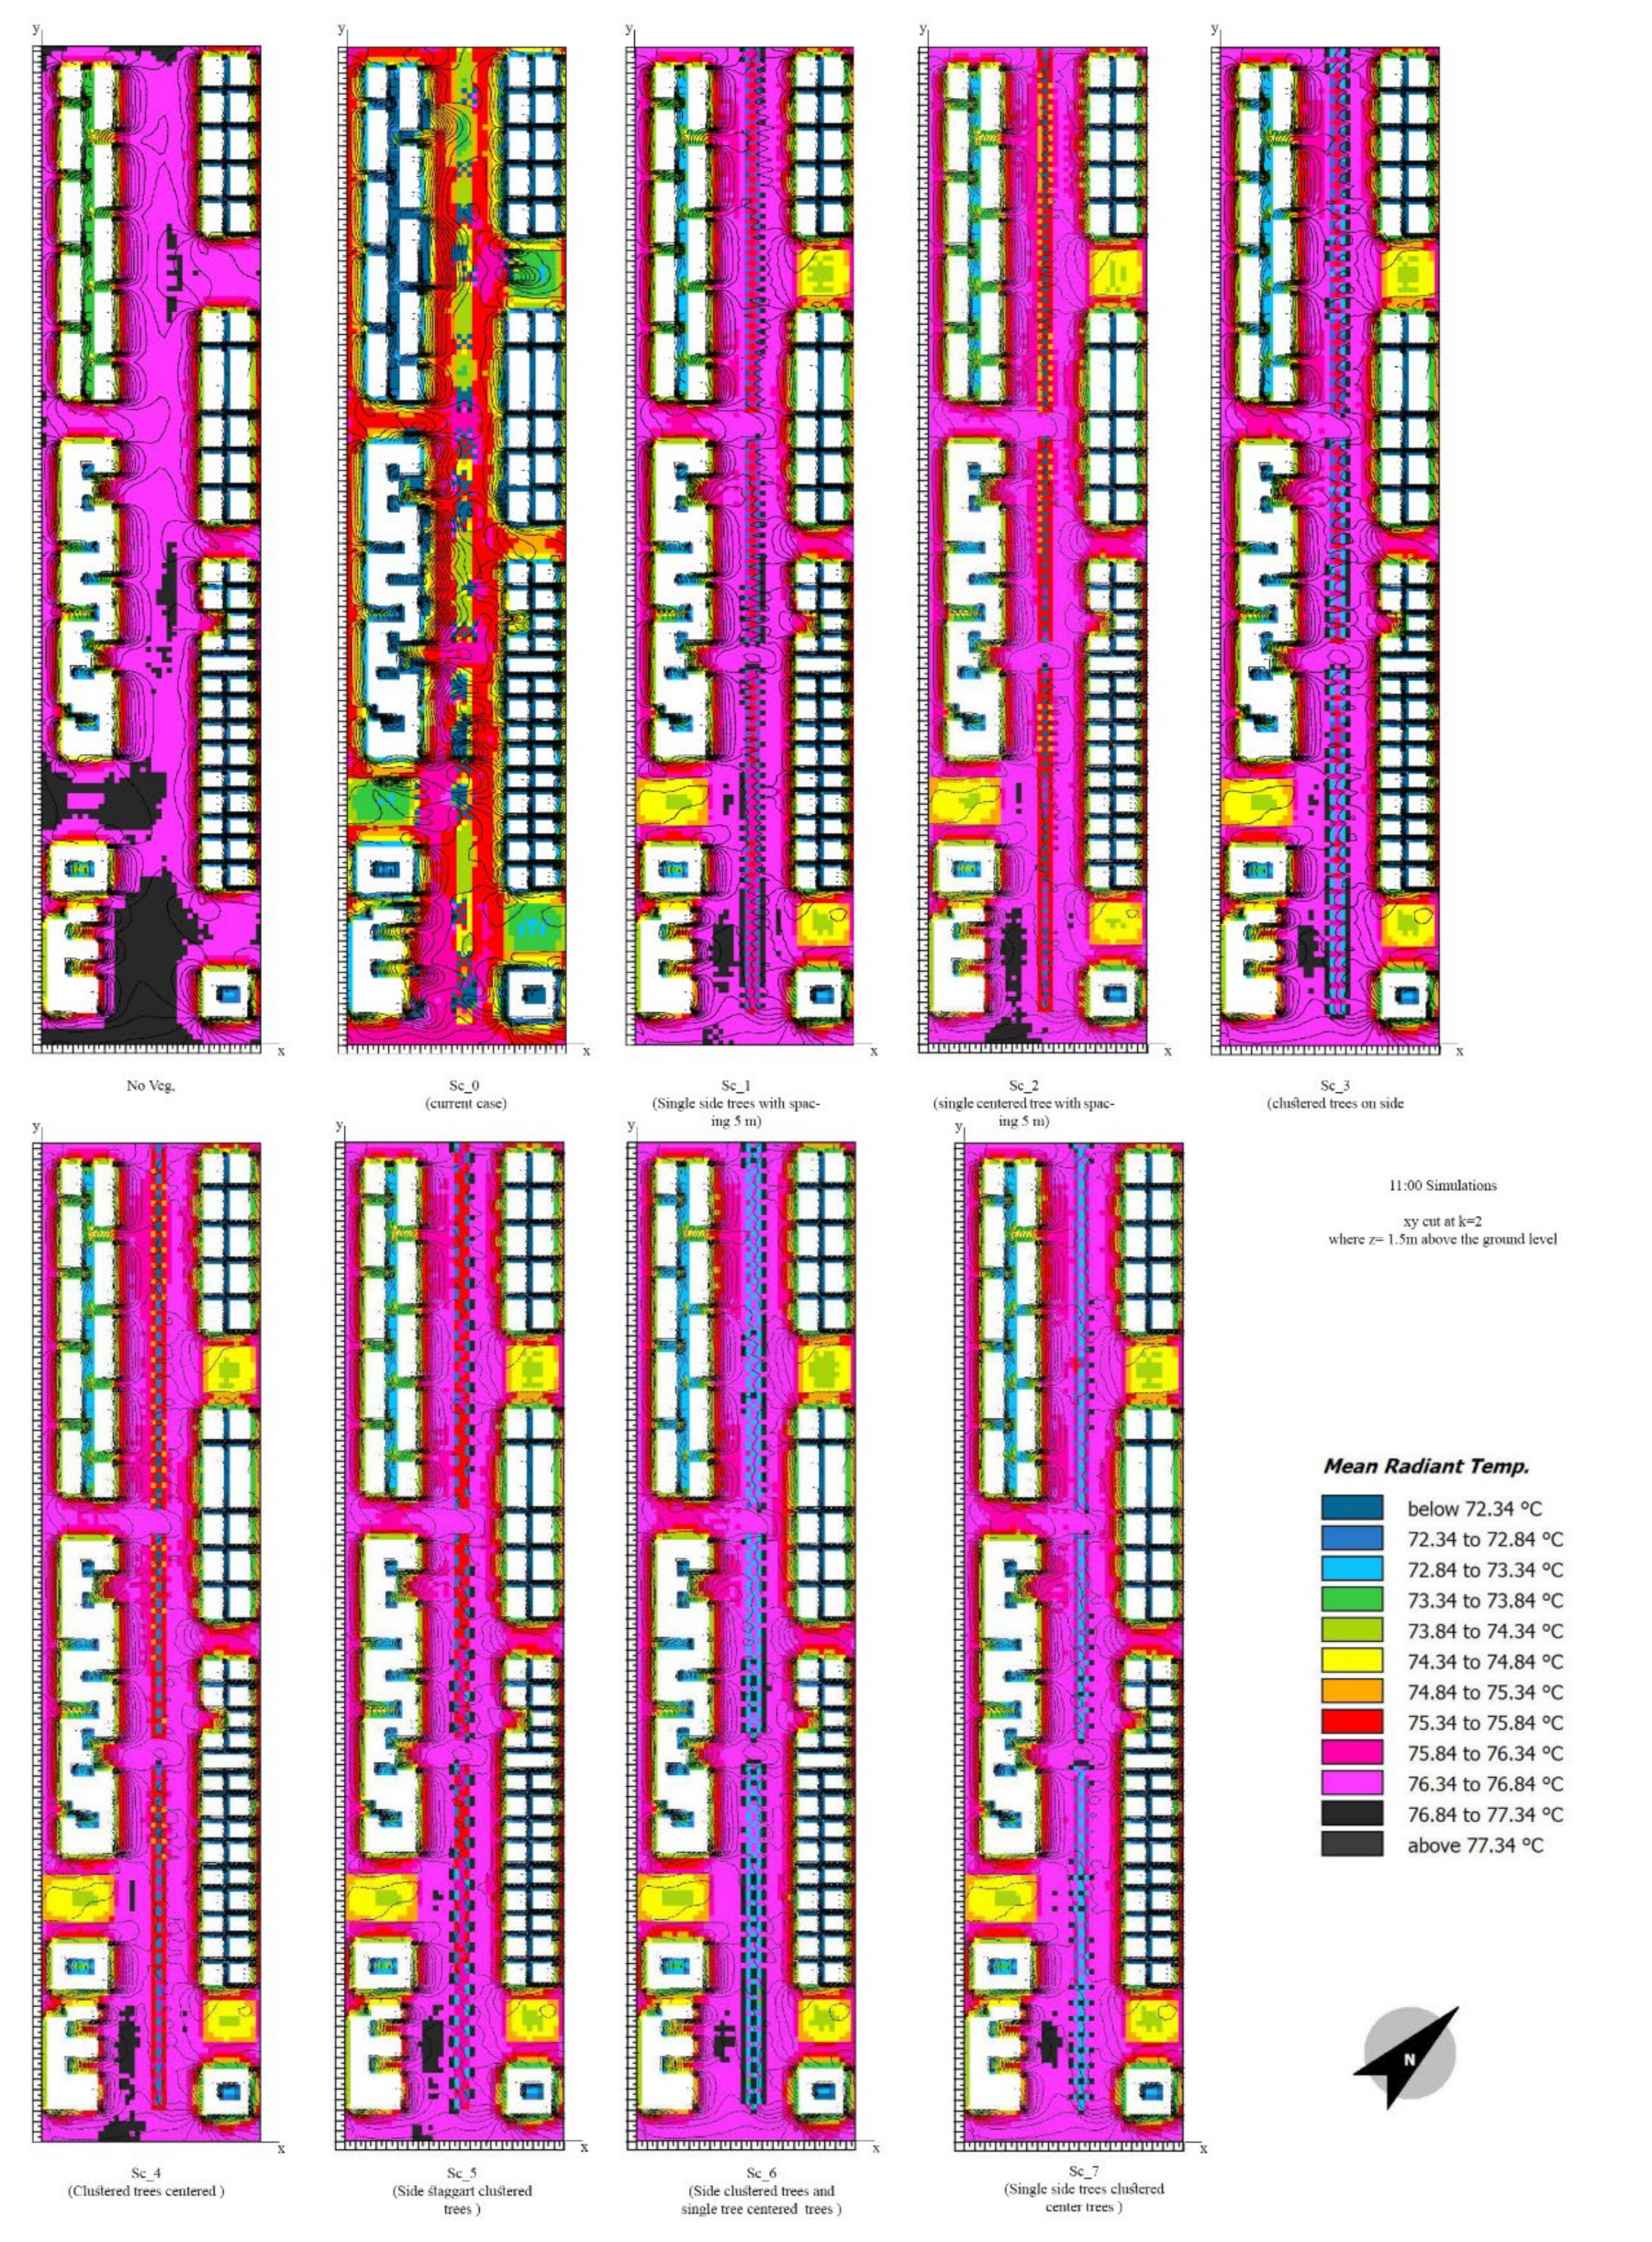
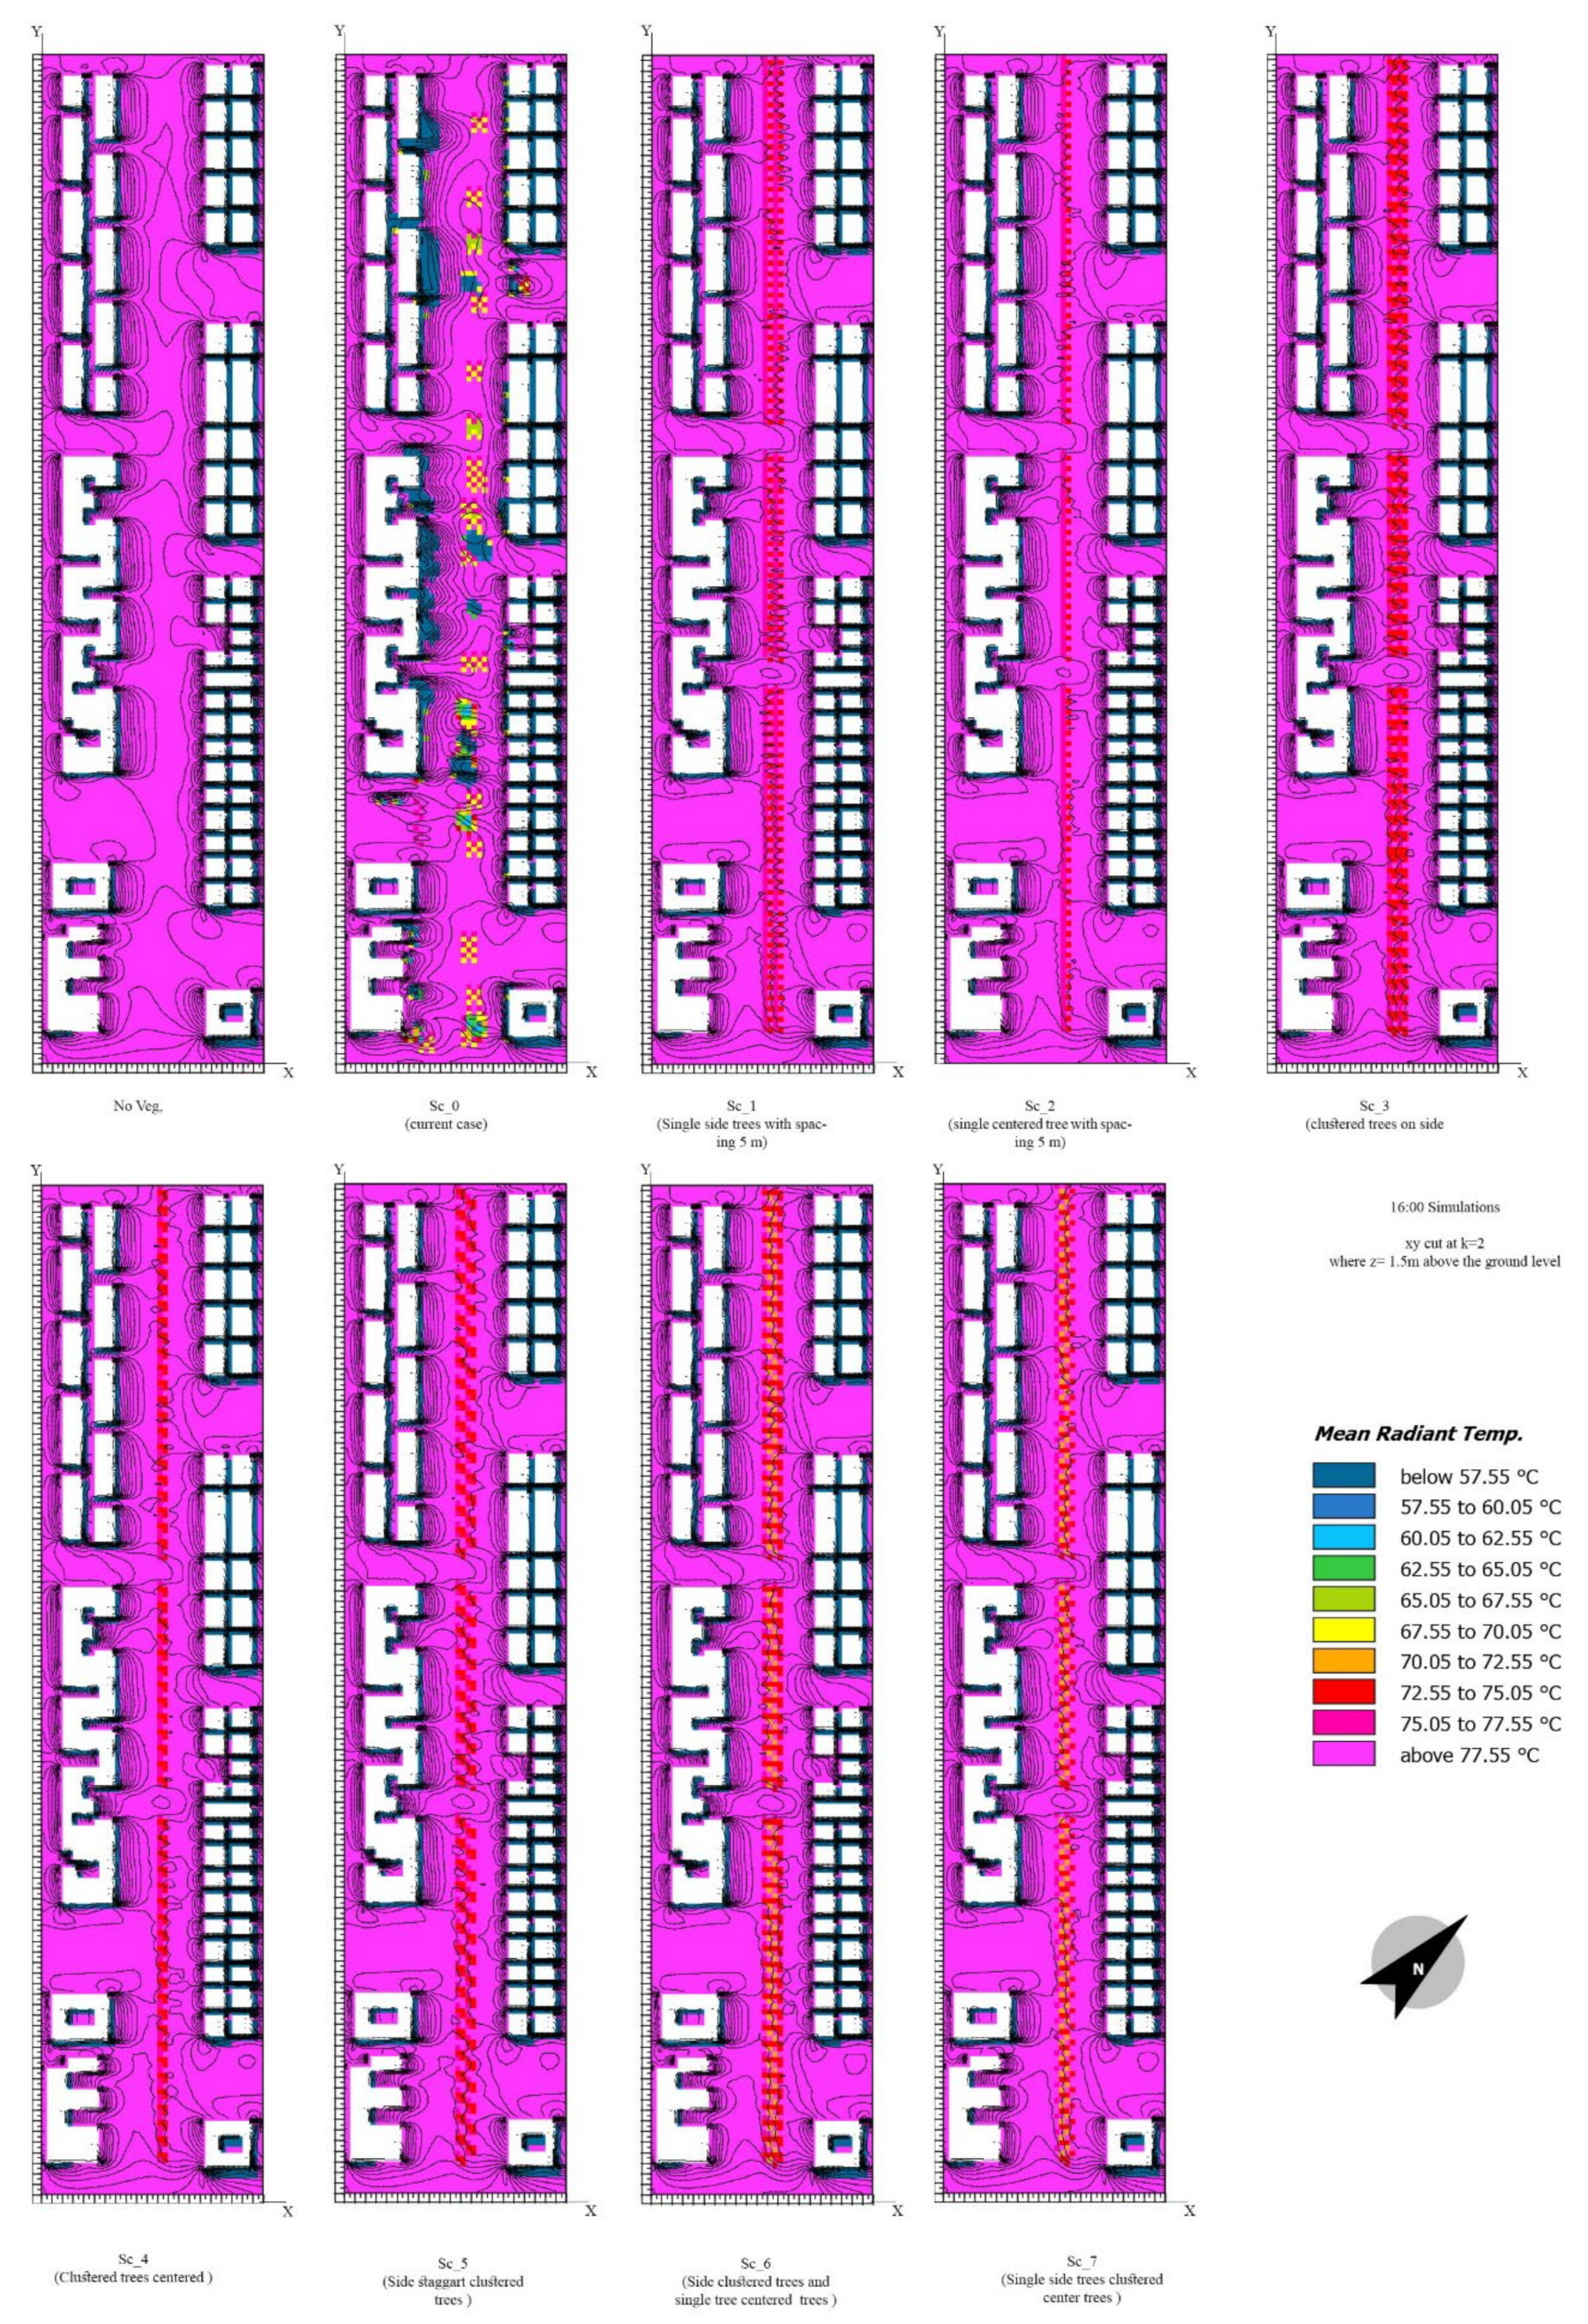
3.2. Results of the Proposed Scenarios
Temporal Responses to Trees Coverage
- At 11:00
- At 16:00
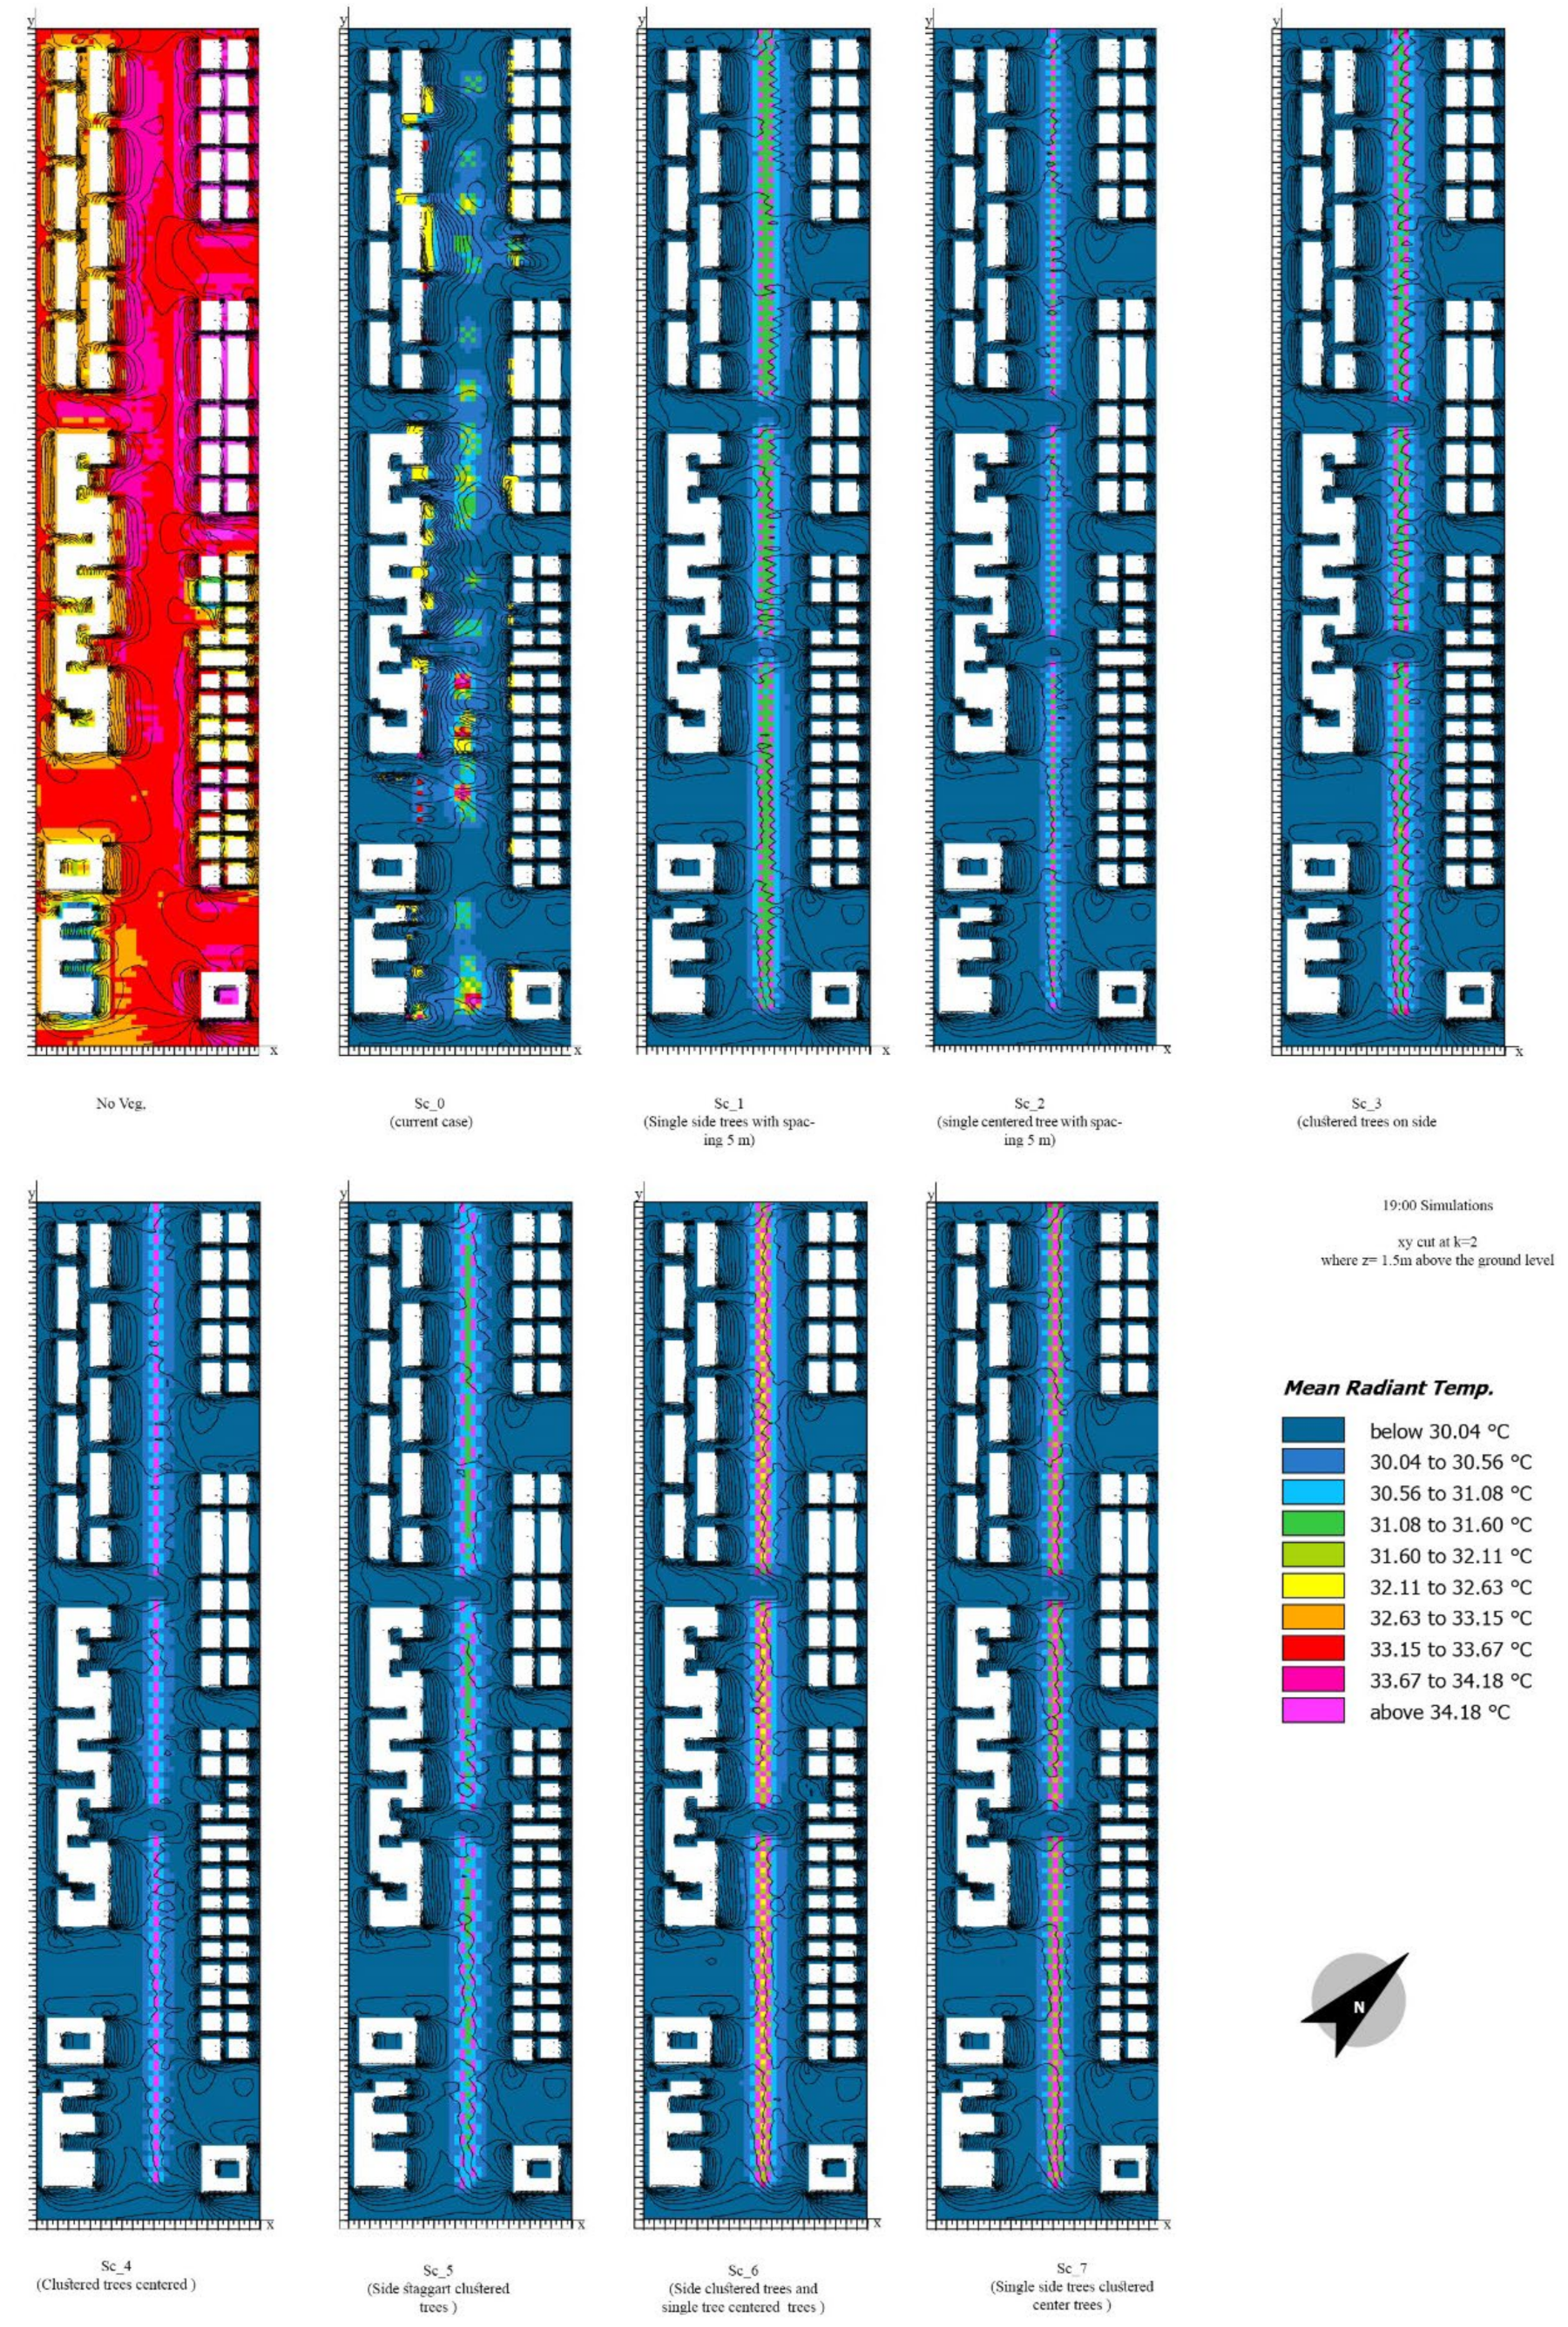
- At 19:00
3.3. Correlation of Meteorology and Pedestrian Thermal Comfort
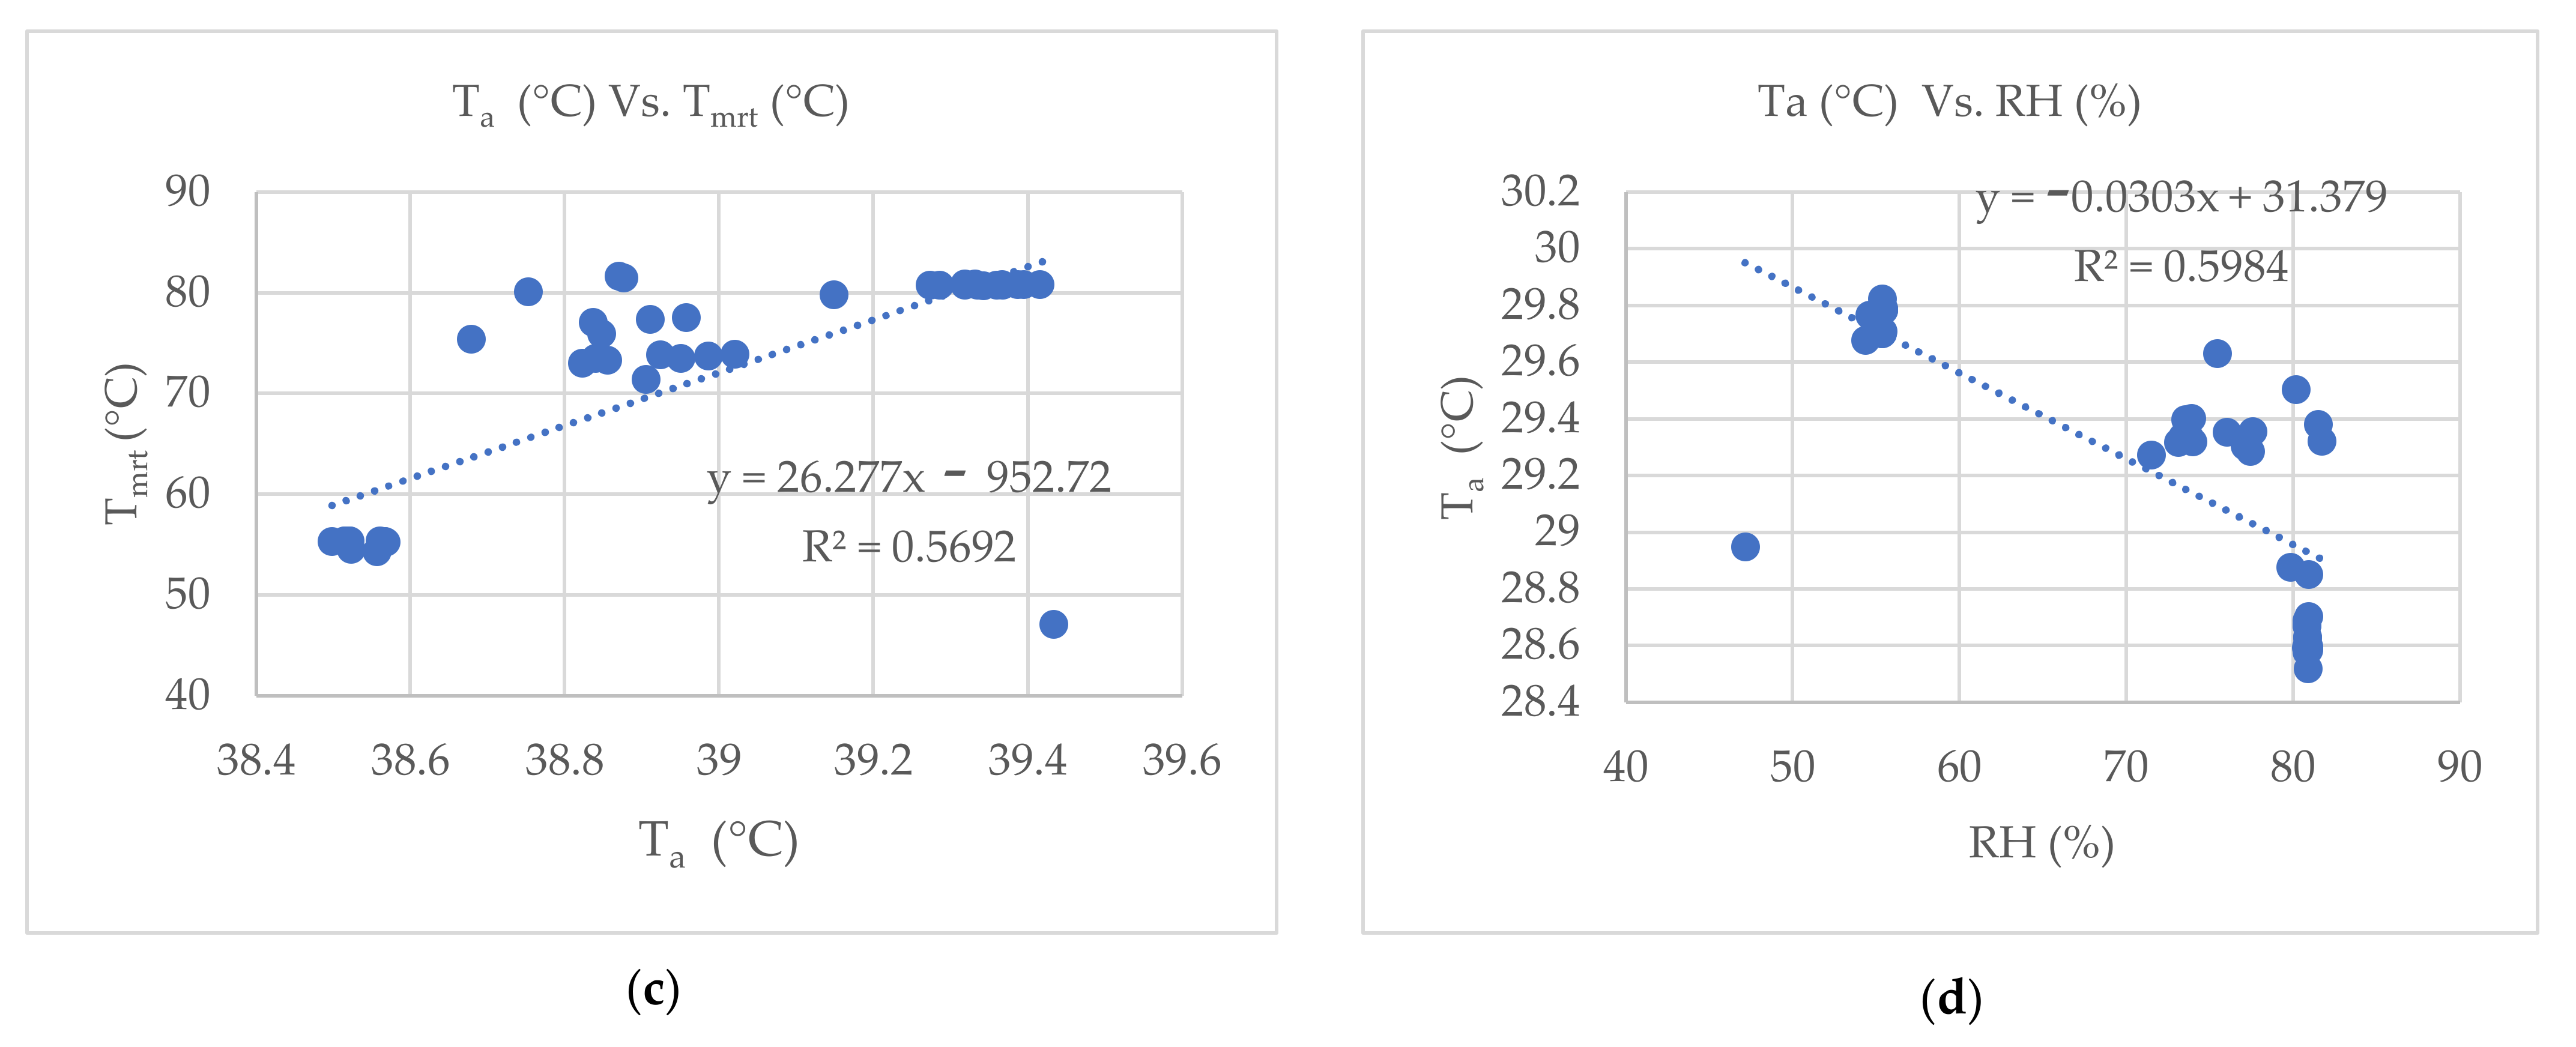
3.3.1. No Vegetation
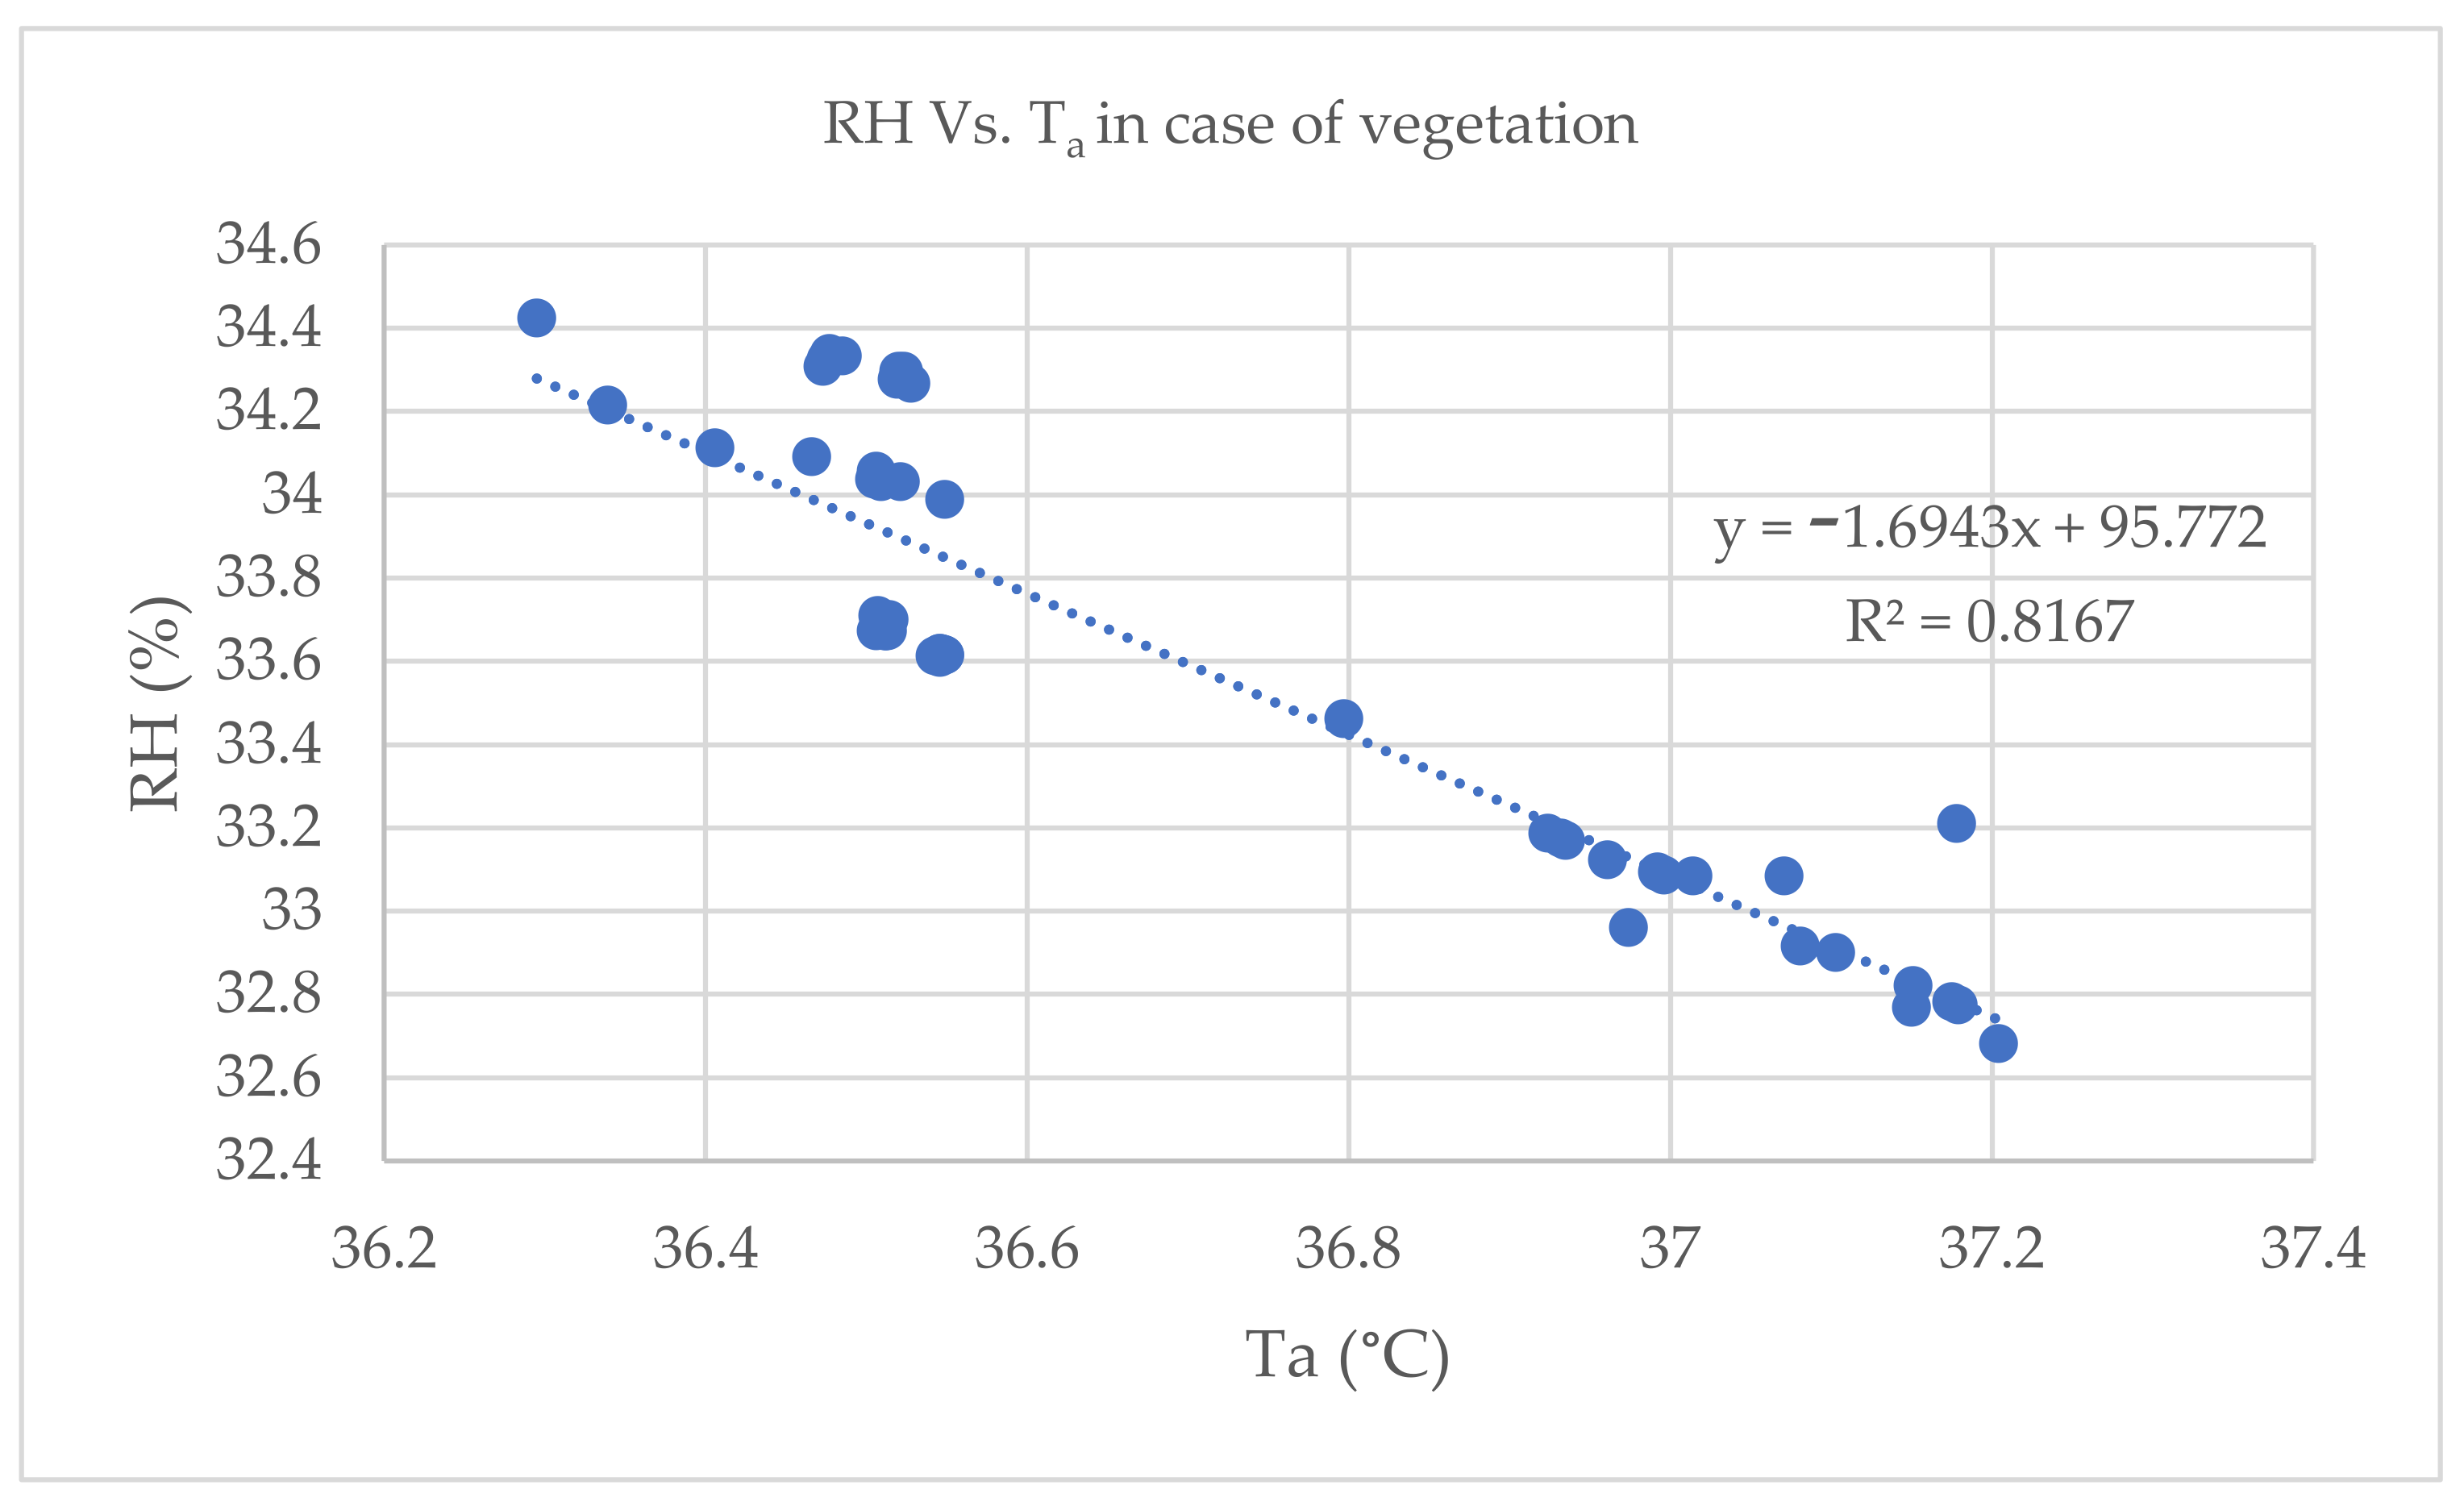
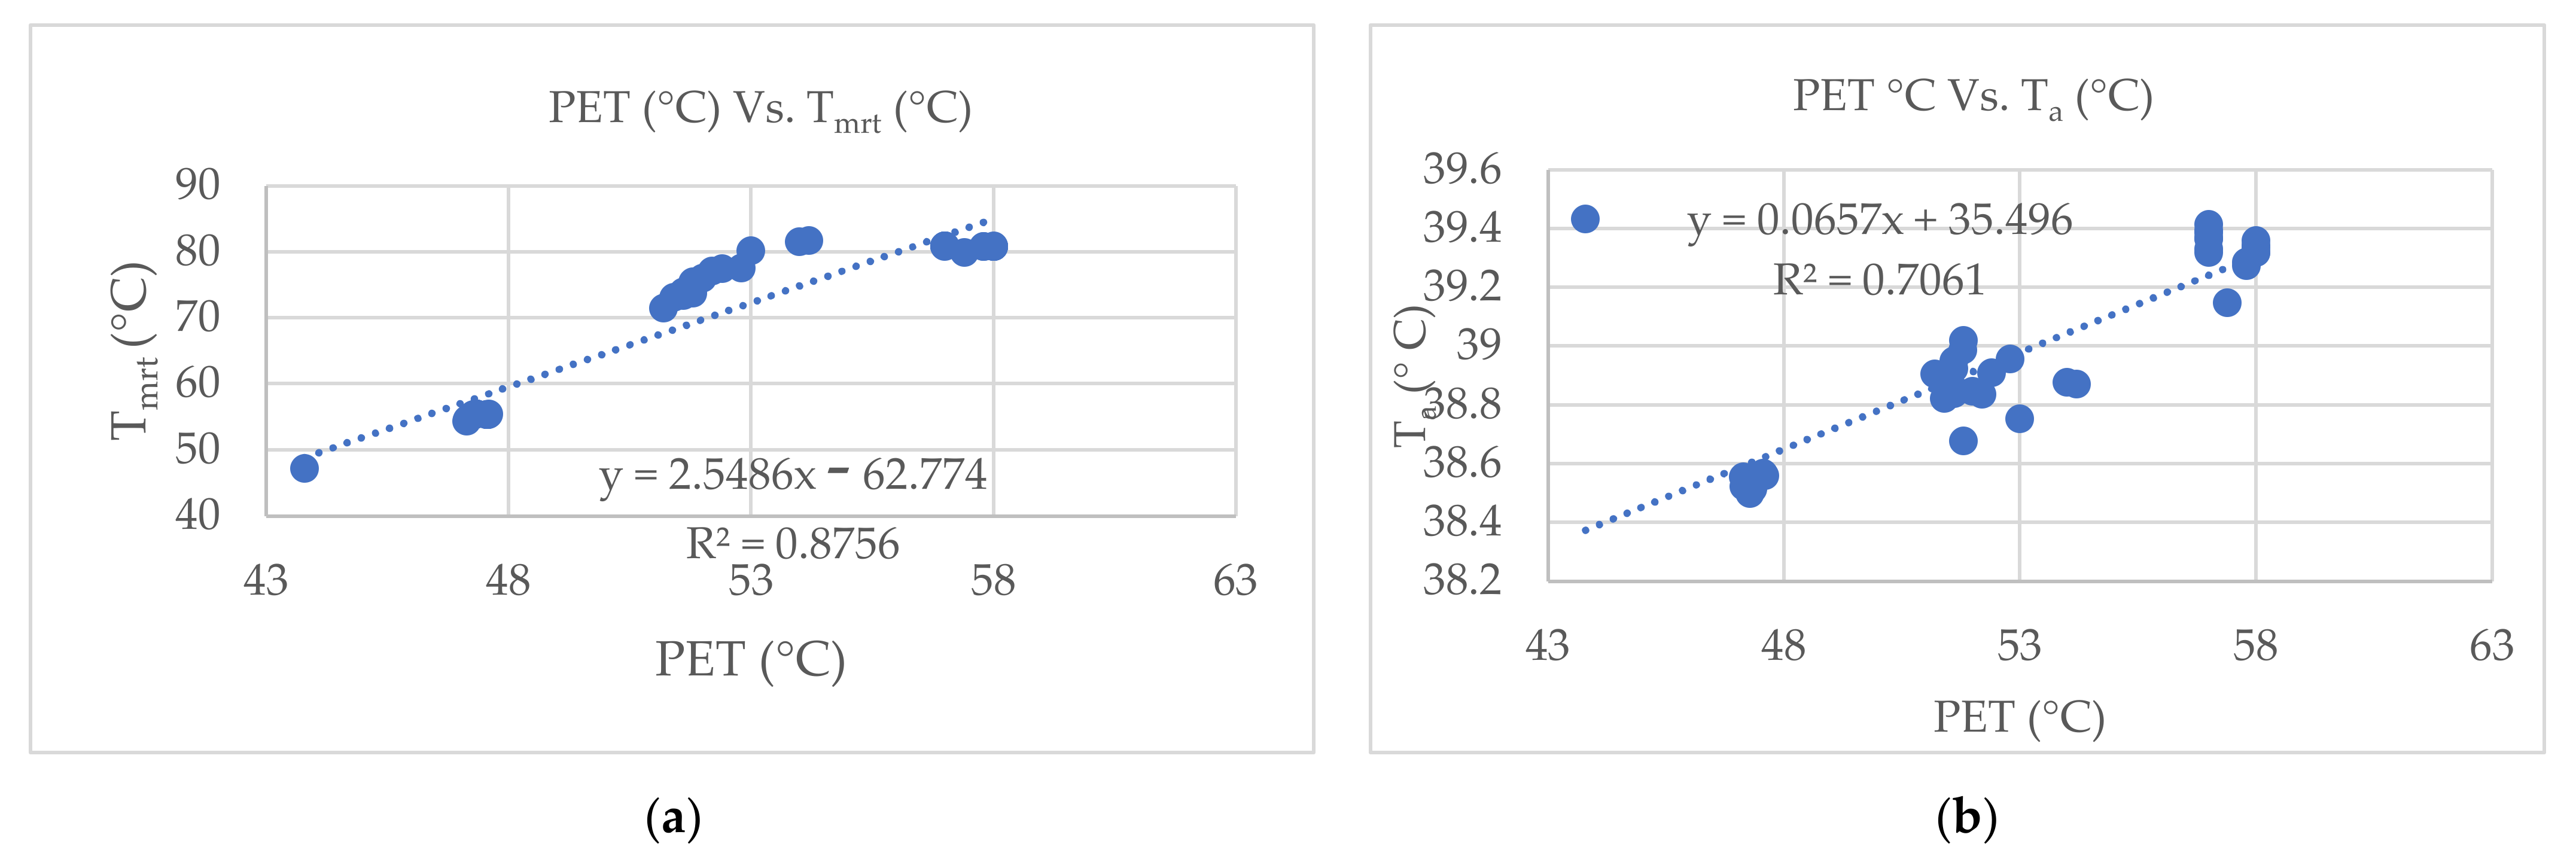
3.3.2. With Vegetation
- The major impact of vegetation was witnessed between Tmrt with the PET index and V; the relationship between Tmrt and PET changed from an inverse strong relation to a moderate relation. The inverse relationship was seen between Tmrt and V, and the strong relationship was changed to no relationship when the vegetative pattern was present.
- The relationship between PET and V decreased to a moderate relationship (r = −0.65).
- A strong negative association developed between PET and Tmrt, to a positive moderate relationship (r = 0.54).
- Slight and negligible changes were witnessed between PET with RH and Ta.
- The lack of relationship between PET and V turned into a moderate correlation (0.51).
- Otherwise, relationships were maintained between the other parameters.
- The strong associations between PET, Ta, Tmrt, and Ta with Tmrt were maintained.
- Moderate relationships between Tmrt with V and RH were also maintained, when vegetation was considered.
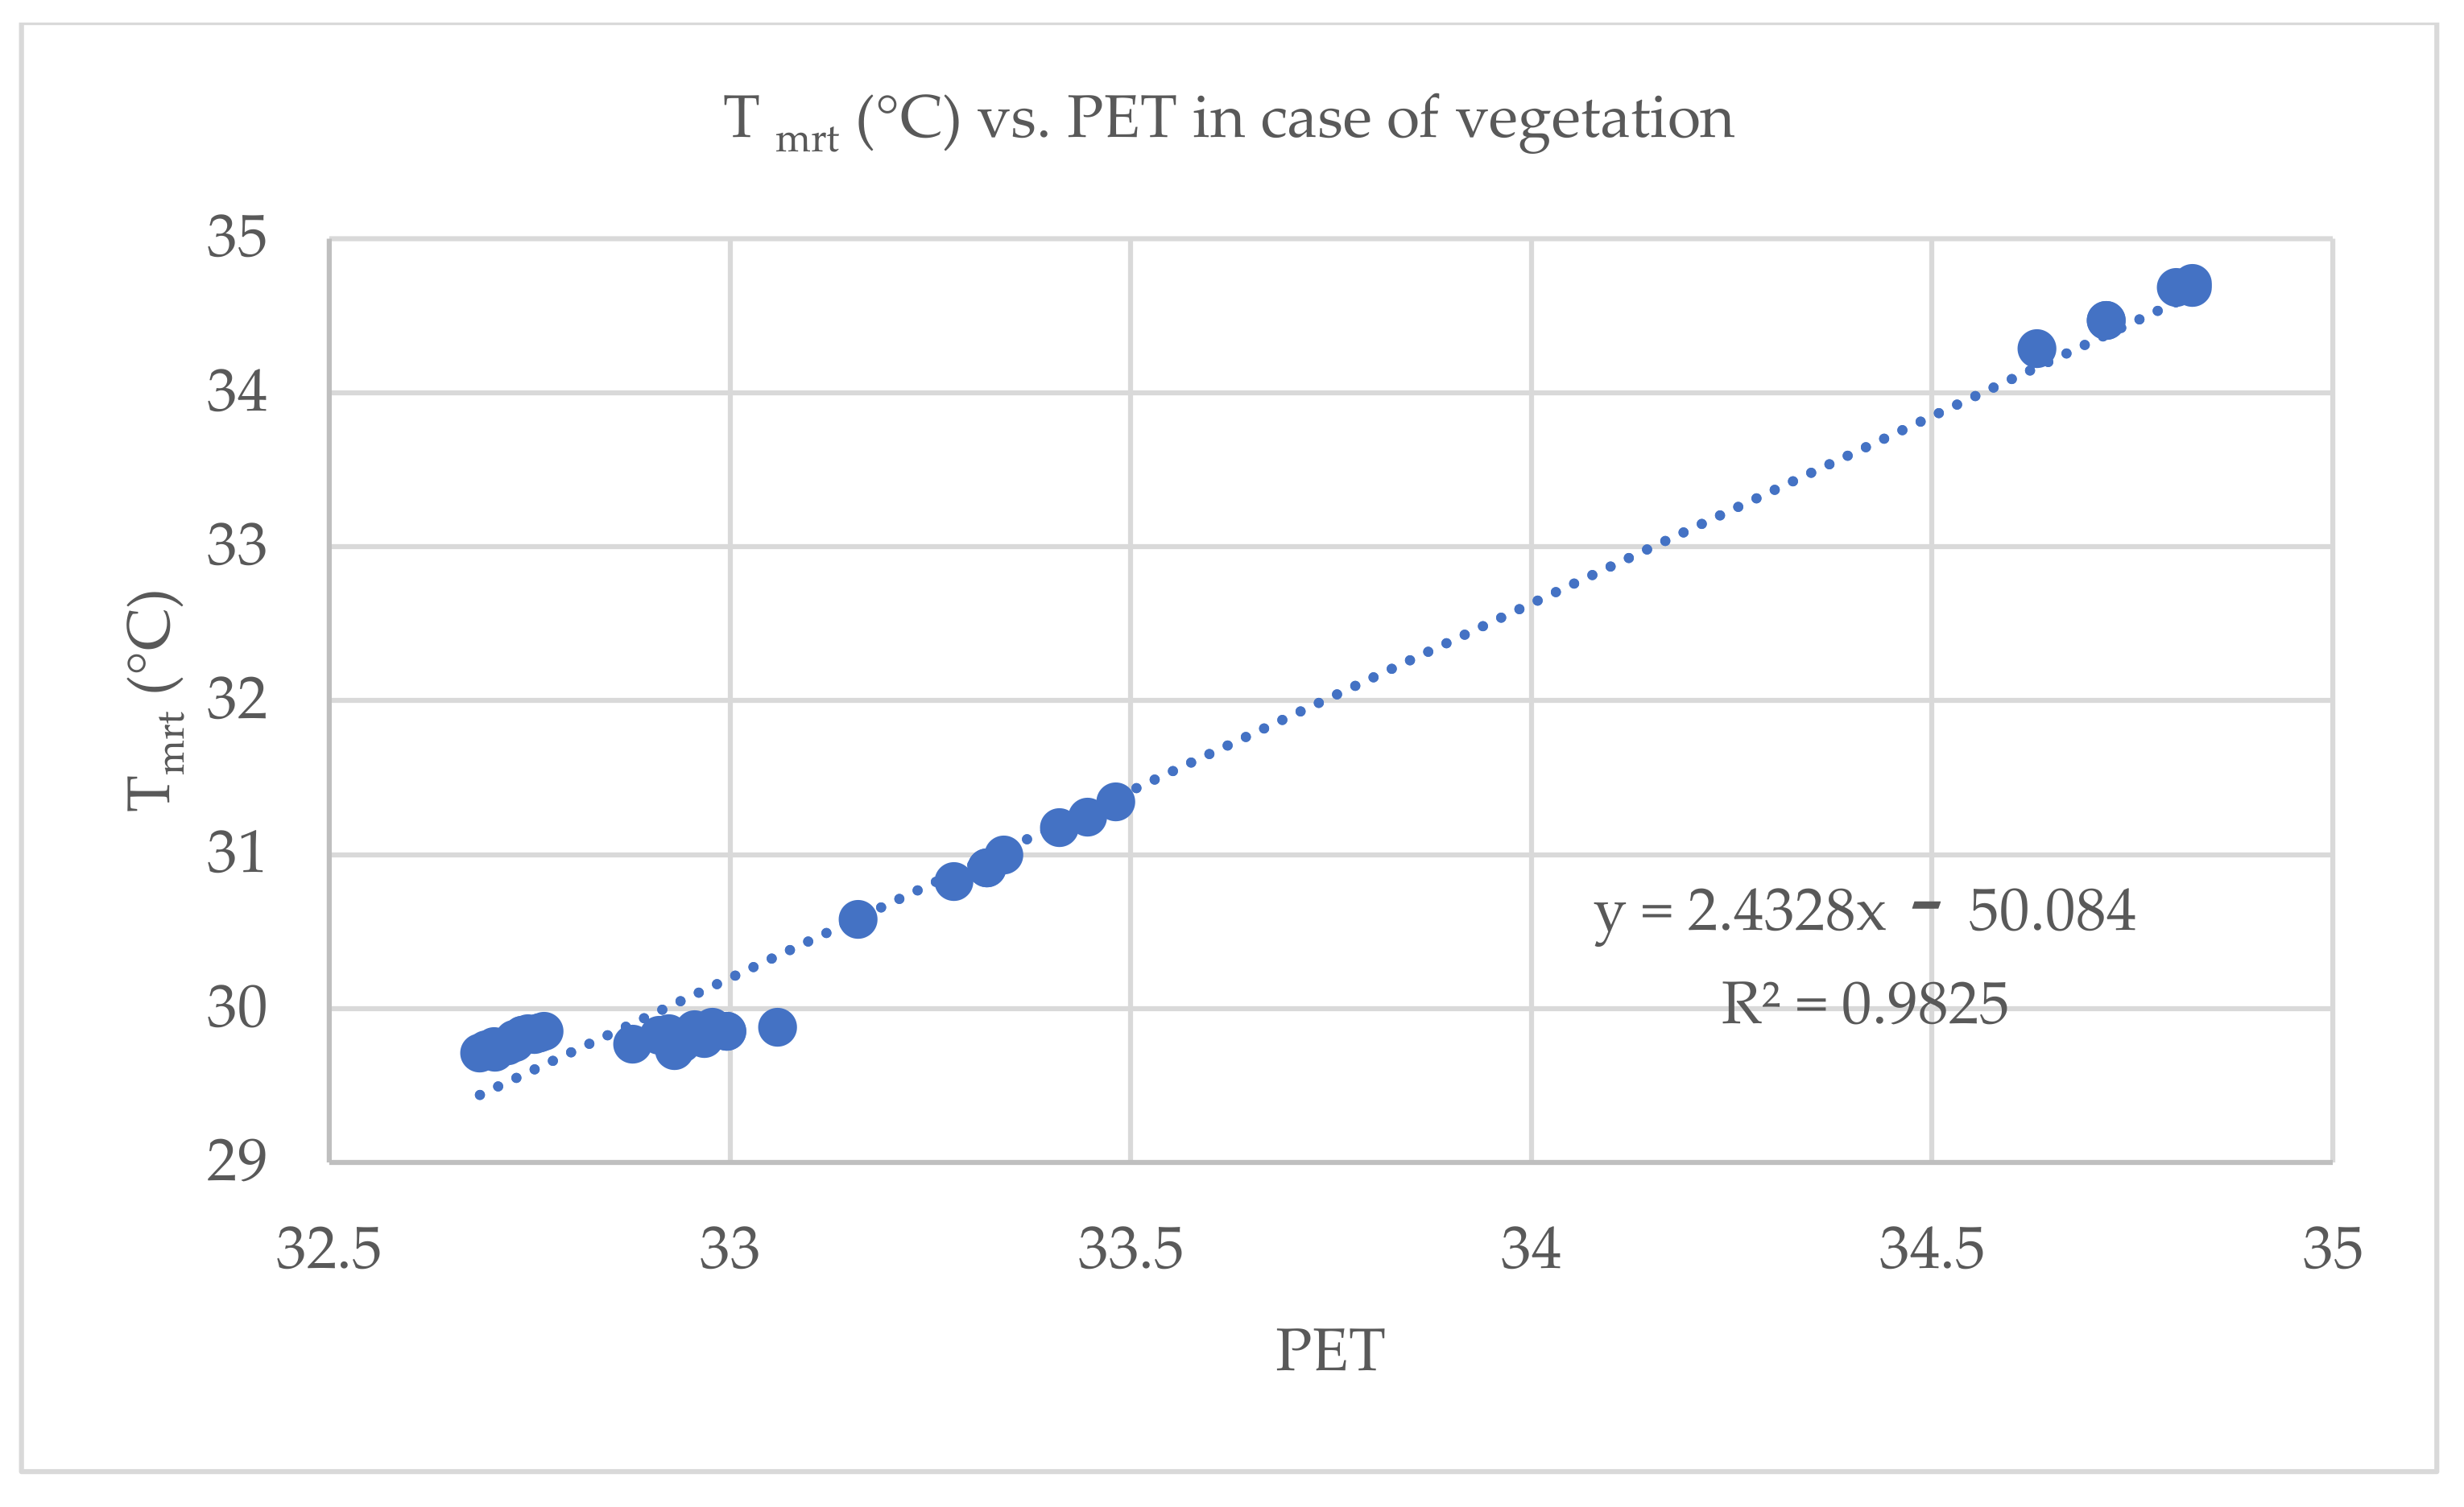
- It is notable that a strong correlation existed between PET and Tmrt (0.99), as shown in Figure 11; differing from the case of no vegetation, where a moderate relation was observed between these parameters.
- Other parameters, such as PET and Ta, did not show any significant correlation (and PET and RH, in the no-vegetation case).
- There was no significant impact of vegetation on PET and V, and Tmrt and V.
- Generally, there was a significant correlation between PET and the mean radiant temperature when vegetation was present, as shown in Figure 12.
4. Discussion
5. Conclusions
- In the western part of the street, where trees are placed next to the buildings’ east side, the area is mostly shaded by the building throughout the day. The air temperature range is minorly changed by a maximum 0.016 °C and the mean radiant temperature by 28 K. Thus, grass would be recommended for climate moderation, or the present trees’ size should be maintained, as larger canopies may hinder or trap the airflow.
- In the eastern part of the street, where trees are placed next to the buildings’ west side, small-sized evergreen trees perform well throughout the day. The air temperature decreases by 0.1 °C and mean radiant temperature is lower by 26 K. An inverse outcome was observed in the lower part of the street, where the temperature increased by 0.14 °C. Thus, it is recommended that the upper evergreen is maintained, with the addition of grass surfaces to enhance the radiant temperature values. Meanwhile, in the lower part of the street, deciduous trees are suggested, with grass as a ground cover.
- In the middle island, among the different developed plantation patterns, the highest canopy coverage (4%) led to better mean radiant reduction: 1.3, 1, and 0.75 °C for the average receptor points under the single-side and cluster trees, cluster side trees with single center arrangement, and cluster side trees arrangements, respectively.
- Finally, to investigate the responses of trees under thermal extremes and heat waves under the same geometrical attributes, the correlational analysis mentioned earlier can be adopted for rapid prediction. This should be applied cautiously, as the outcome varies according to the weather conditions, tree percent, and its type. It is valid when considering high ambient temperatures, as the cooling capacity of trees is highly dependable on the saturation vapor pressure released during plant transpiration [58].
Author Contributions
Funding
Institutional Review Board Statement
Informed Consent Statement
Data Availability Statement
Conflicts of Interest
Abbreviations
| MENA | Middle East and North Africa region |
| PET | Physiological Equivalent Temperature |
| Tmrt | Mean Radiant Temperature |
| Ta | Air Temperature |
| V | Wind speed |
| RH | Relative Humidity |
| TMY | Typical Meteorological Year |
| UHI | Urban Heat Island |
| TC | Tree Canopy |
| WMO | World Metrological Organization |
| EPW | Energy Plus Weather format |
Appendix A

| Time Frame | Scenario | Overall Min. Ta | Overall Max. Ta. | Receptor 1 | Receptor 2 | Receptor 3 | Receptor 4 | Receptor 5 | Receptor 6 | Average |
|---|---|---|---|---|---|---|---|---|---|---|
| 11:00 | No-veg. | 36.11 | 38.11 | 36.54 | 36.46 | 36.93 | 36.50 | 36.40 | 37.08 | 36.65 |
| Current design | 35.35 | 38.10 | 36.54 | 36.33 | 36.79 | 36.50 | 36.29 | 37.17 | 36.61 | |
| Δ Ta | 0.76 | 0.01 | −0.003 | 0.127 | 0.135 | −0.001 | 0.111 | −0.097 | 0.045334 | |
| 16:00 | No-veg. | 38.21 | 40.37 | 38.555 | 38.752 | 39.261 | 38.507 | 38.717 | 39.294 | 38.84 |
| Current design | 38.14 | 40.29 | 38.556 | 38.752 | 39.148 | 38.523 | 38.678 | 39.433 | 38.84 | |
| Δ Ta | 0.07 | 0.08 | −0.001 | 0 | 0.113 | −0.016 | 0.039 | −0.139 | 0 | |
| 19:00 | No-veg. | 34.60 | 35.40 | 35.082 | 35.051 | 35.284 | 35.07 | 35.072 | 35.288 | 35.14 |
| Current design | 34.67 | 35.40 | 35.073 | 35.064 | 35.264 | 35.075 | 35.085 | 35.258 | 35.136 | |
| Δ Ta | −0.07 | 0 | 0.009 | −0.013 | 0.02 | −0.005 | −0.013 | 0.03 | 0.0046 |
| Time Frame | Scenario | Overall Min. Temperature | Overall, Max. Temp. | Receptor 1 | Receptor 2 | Receptor 3 | Receptor 4 | Receptor 5 | Receptor 6 | Average |
|---|---|---|---|---|---|---|---|---|---|---|
| 11:00 | Sc1 | 36.10 | 38.12 | 36.548 | 36.519 | 36.961 | 36.512 | 36.505 | 37.151 | 36.69933 |
| Sc2 | 36.10 | 38.12 | 36.546 | 36.475 | 36.924 | 36.51 | 36.477 | 37.103 | 36.6725 | |
| Sc3 | 36.09 | 38.12 | 36.549 | 36.523 | 36.996 | 36.513 | 36.509 | 37.179 | 36.7115 | |
| Sc4 | 36.10 | 38.12 | 36.546 | 36.485 | 36.935 | 36.51 | 36.473 | 37.071 | 36.67 | |
| Sc5 | 36.10 | 38.12 | 36.547 | 36.52 | 36.974 | 36.511 | 36.507 | 37.15 | 36.7015 | |
| Sc6 | 36.10 | 38.12 | 36.549 | 36.549 | 37.014 | 36.514 | 36.528 | 37.204 | 36.72633 | |
| Sc7 | 36.10 | 38.12 | 36.548 | 36.521 | 36.992 | 36.512 | 36.506 | 37.175 | 36.709 | |
| No-veg. | 36.11 | 38.11 | 36.54 | 36.46 | 36.93 | 36.50 | 36.40 | 37.08 | 36.65 | |
| 16:00 | Sc1 | 38.20 | 40.37 | 38.565 | 38.91 | 39.319 | 38.518 | 38.87 | 39.367 | 38.92483 |
| Sc2 | 38.21 | 40.37 | 38.56 | 38.822 | 39.273 | 38.514 | 38.847 | 39.318 | 38.889 | |
| Sc3 | 38.20 | 40.37 | 38.566 | 38.986 | 39.342 | 38.521 | 38.839 | 39.394 | 38.94133 | |
| Sc4 | 38.20 | 40.37 | 38.561 | 38.855 | 39.285 | 38.515 | 38.836 | 39.331 | 38.89717 | |
| Sc5 | 38.20 | 40.37 | 38.564 | 38.95 | 39.318 | 38.518 | 38.876 | 39.366 | 38.932 | |
| Sc6 | 38.20 | 40.37 | 38.568 | 39.02 | 39.359 | 38.498 | 38.905 | 39.415 | 38.96083 | |
| Sc7 | 38.20 | 40.37 | 38.566 | 38.957 | 39.334 | 38.52 | 38.923 | 39.386 | 38.94767 | |
| No-veg. | 38.20 | 40.37 | 38.555 | 38.752 | 39.261 | 38.507 | 38.717 | 39.294 | 38.84767 | |
| 19:00 | Sc1 | 34.69 | 35.43 | 32.688 | 33.411 | 32.956 | 32.707 | 33.447 | 32.931 | 33.023 |
| Sc2 | 34.69 | 35.42 | 32.741 | 34.718 | 32.919 | 32.762 | 33.321 | 32.996 | 33.24 | |
| Sc3 | 34.70 | 35.44 | 32.741 | 34.718 | 32.919 | 32.762 | 33.321 | 32.996 | 33.24 | |
| Sc4 | 34.69 | 35.42 | 32.696 | 33.16 | 32.879 | 32.723 | 33.28 | 32.94 | 32.946 | |
| Sc5 | 34.69 | 35.43 | 32.706 | 34.631 | 32.912 | 32.732 | 33.342 | 32.968 | 33.215 | |
| Sc6 | 34.70 | 35.45 | 32.748 | 34.825 | 32.978 | 32.768 | 34.825 | 33.06 | 33.534 | |
| Sc7 | 34.70 | 35.44 | 32.731 | 33.482 | 32.924 | 32.756 | 34.805 | 32.972 | 33.278 | |
| Mean Radiant Temperature | ||||||||||
| 11:00 | Sc1 | 71.94 | 77.1 | 74.029 | 76.031 | 73.797 | 74.074 | 75.975 | 75.732 | 74.93967 |
| Sc2 | 71.99 | 77.04 | 74.132 | 72.116 | 73.899 | 74.176 | 75.715 | 75.65 | 74.28133 | |
| Sc3 | 71.88 | 77.21 | 74.056 | 75.74 | 73.772 | 74.127 | 75.684 | 75.668 | 74.84117 | |
| Sc4 | 71.98 | 77 | 74.102 | 75.71 | 73.859 | 74.171 | 75.65 | 74.216 | 74.618 | |
| Sc5 | 71.94 | 77.16 | 74.061 | 75.827 | 73.835 | 74.132 | 75.769 | 75.701 | 74.8875 | |
| Sc6 | 71.84 | 77.21 | 74.012 | 76.703 | 73.761 | 74.082 | 72.942 | 75.622 | 74.52033 | |
| Sc7 | 71.89 | 77.38 | 74.045 | 72.974 | 73.816 | 74.113 | 72.913 | 75.665 | 73.921 | |
| 16:00 | Sc1 | 55.01 | 82.08 | 55.294 | 77.439 | 80.855 | 55.335 | 81.701 | 80.838 | 71.91033 |
| Sc2 | 55.06 | 81.86 | 55.391 | 73.088 | 80.804 | 55.429 | 76.008 | 80.912 | 70.272 | |
| Sc3 | 54.99 | 82.19 | 55.341 | 73.769 | 80.785 | 55.417 | 73.546 | 80.904 | 69.96033 | |
| Sc4 | 55.05 | 81.84 | 55.368 | 73.341 | 80.825 | 55.44 | 77.102 | 80.92 | 70.49933 | |
| Sc5 | 55.02 | 82.13 | 55.326 | 73.567 | 80.825 | 55.401 | 81.503 | 80.903 | 71.25417 | |
| Sc6 | 54.97 | 82.21 | 55.319 | 73.965 | 80.799 | 55.369 | 71.478 | 80.885 | 69.63583 | |
| Sc7 | 55.01 | 82.1 | 55.347 | 77.572 | 80.841 | 55.419 | 73.896 | 80.905 | 70.66333 | |
| 19:00 | Sc1 | 29.51 | 34.10 | 29.709 | 31.177 | 29.862 | 29.718 | 31.241 | 29.727 | 30.239 |
| Sc2 | 29.49 | 33.77 | 29.825 | 34.472 | 29.823 | 29.843 | 30.915 | 29.851 | 30.78817 | |
| Sc3 | 29.53 | 34.81 | 29.825 | 34.472 | 29.823 | 29.843 | 30.915 | 29.851 | 30.78817 | |
| Sc4 | 29.49 | 34.09 | 29.732 | 30.581 | 29.767 | 29.76 | 30.826 | 29.772 | 30.073 | |
| Sc5 | 29.51 | 34.30 | 29.751 | 34.286 | 29.825 | 29.777 | 30.995 | 29.806 | 30.74 | |
| Sc6 | 29.54 | 34.73 | 29.836 | 34.684 | 29.877 | 29.854 | 34.709 | 29.881 | 31.4735 | |
| Sc7 | 29.53 | 34.70 | 29.801 | 31.344 | 29.835 | 29.829 | 34.684 | 29.835 | 30.888 | |
Appendix B


References
- Huq, S.; Kovats, S.; Reid, H.; Satterthwaite, D. Reducing risks to cities from disasters and climate change. Environ. Urban. 2007, 19, 3–15. [Google Scholar] [CrossRef]
- Mills, G. Climate information for improved planning and management of mega cities (Needs Perspective). Procedia Environ. Sci. 2010, 1, 228–246. [Google Scholar] [CrossRef] [Green Version]
- Campbell-Lendrum, C.; Corvalan, D. Climate Change and Developing-Country Cities: Implications for Environmental Health and Equity. J. Urban Health Bull. N. Y. Acad. Med. 2007, 84, 109–117. [Google Scholar] [CrossRef] [PubMed] [Green Version]
- Lelieveld, J.; Proestos, Y.; Hadjinicolaou, P.; Tanarhte, M.; Tyrlis, E.; Zittis, G. Strongly increasing heat extremes in the Middle East and North Africa (MENA) in the 21st century. Clim. Chang. 2016, 137, 245–260. [Google Scholar] [CrossRef] [Green Version]
- Khalil, H. New Urbanism, Smart Growth And Informal Areas: A Quest For Sustainability. In Proceedings of the CSAAR Conference 2010, Sustainable Architecture & Urban Development, Amman, Jordon, 14 July 2010; pp. 137–153. [Google Scholar]
- World Maps of Köppen-Geiger Climate Classification. 2021. Available online: http://koeppen-geiger.vu-wien.ac.at/present.htm. (accessed on 22 April 2021).
- Halil, H.A.E.E.; Ibrahim, A.; Elgendy, N.; Makhlouf, N. Could/should improving the urban climate in informal areas of fast-growing cities be an integral part of upgrading processes? Cairo case. Urban Clim. 2018, 24, 63–79. [Google Scholar]
- United Nations. Arab Sustainable Development Report; United Nations: New York, NY, USA, 2020. [Google Scholar]
- El-Bardisy, W.M.; Fahmy, M.; El-Gohary, G.F. Climatic Sensitive Landscape Design: Towards a Better Microclimate through Plantation in Public Schools, Cairo, Egypt. Procedia Soc. Behav. Sci. 2016, 216, 206–216. [Google Scholar] [CrossRef] [Green Version]
- Darbani, E.S.; Rafiean, M.; Hanaee, T.; Monsefi Parapari, D. Environmental Effects Of Urban Geometry Changes On Air Temperature And Outdoor Thermal Comfort In Arid Climate Of Mashhad (Case Study Of Pachenar And Shahed). J. Environ. Stud. 2018, 43, 561–578. [Google Scholar]
- Ridha, S.; Ginestet, S.; Lorente, S. Effect of the Shadings Pattern and Greenery Strategies on the Outdoor Thermal Comfort. Int. J. Eng. Technol. 2018, 10, 108–114. [Google Scholar] [CrossRef] [Green Version]
- Kotzen, B. An investigation of shade under six different tree species of the Negev desert towards their potential use for enhancing micro-climatic conditions in landscape architectural development. J. Arid Environ. 2003, 55, 231–274. [Google Scholar] [CrossRef]
- Wong, H.; Tan, N.H.; Kolokotsa, C.; Takebayashi, D. Greenery as a mitigation and adaptation strategy to urban heat. Nat. Rev. Earth Environ. 2021, 2, 166–181. [Google Scholar] [CrossRef]
- Zölch, T.; Rahman, M.A.; Pfleiderer, E.; Wagner, G.; Pauleit, S. Designing public squares with green infrastructure to optimize human thermal comfort. Build. Environ. 2019, 149, 640–654. [Google Scholar] [CrossRef]
- Loibl, W.; Vuckovic, M.; Etminan, G.; Ratheiser, M.; Tschannett, S.; Österreicher, D. Effects of Densification on Urban Microclimate—A Case Study for the City of Vienna. Atmosphere 2021, 12, 511. [Google Scholar] [CrossRef]
- Amani-Beni, M.; Zhang, B.; Xie, G.-D.; Xu, J. Impact of urban park’s tree, grass and waterbody on microclimate in hot summer days: A case study of Olympic Park in Beijing, China. Urban For. Urban Green. 2018, 32, 1–6. [Google Scholar] [CrossRef]
- Tsoka, S. Investigating the Relationship Between Urban Spaces Morphology and Local Microclimate: A Study for Thessaloniki. Procedia Environ. Sci. 2017, 38, 674–681. [Google Scholar] [CrossRef]
- Zheng, S.; Guldmann, J.M.; Liu, Z.; Zhao, L. Influence of trees on the outdoor thermal environment in subtropical areas: An experimental study in Guangzhou, China. Sustain. Cities Soc. 2018, 42, 482–497. [Google Scholar] [CrossRef]
- Fahmy, M.; Mahmoud, S.; Elwy, I.; Mahmoud, H. A Review and Insights for Eleven Years of Urban Microclimate Research Towards a New Egyptian ERA of Low Carbon, Comfortable and Energy-Efficient Housing Typologies. Atmosphere 2020, 11, 236. [Google Scholar] [CrossRef] [Green Version]
- Symons, J.; Jones, R. Assessing the Economic Value of Green Infrastructure Literature Review; Victoria Institute of Strategic Economics Studies, Victoria University: Melbourne, Australia, 2015. [Google Scholar]
- Hassaan, A.; Mahmoud, A. Analysis of the microclimatic and human comfort conditions in an urban park in hot and arid regions. Build. Environ. 2011, 46, 2641–2656. [Google Scholar]
- Fahmy, M.; Mahdy, M.; El-Hady, H.; Ibrahim, Y.; Abdelalim, M.F. Simulating the carbon foot print reduction of an arid urban form applying canopy layer green coverage under climate change scenarios. Int. J. Appl. Eng. Res. 2017, 12, 12906–12913. [Google Scholar]
- Wang, Y.; Akbari, H. A simulation study of the effects of street tree planting on Urban Heat Island mitigation in Montreal. In Proceedings of the EIC Climate Change Technology Conference, Montreal, QC, Canada, 25 May 2015; pp. 1–12. [Google Scholar]
- Zhao, Q.; Sailor, D.J.; Wentz, E.A. Impact of tree locations and arrangements on outdoor microclimates and human thermal comfort in an urban residential environment. Urban For. Urban Green. 2018, 32, 81–91. [Google Scholar] [CrossRef] [Green Version]
- Ali, M.A.; Alawadi, K.; Khanal, A. The role of green infrastructure in enhancing microclimate conditions: A case study of a low-rise neighborhood in Abu Dhabi. Sustainability 2021, 13, 4260. [Google Scholar] [CrossRef]
- Wang, L.; Su, J.; Gu, Z.; Shui, Q. Effect of Street Canyon Shape and Tree Layout on Pollutant Diffusion under Real Tree Model. Sustainability 2020, 12, 2105. [Google Scholar] [CrossRef] [Green Version]
- EnergyPlus. Weather Data by Location. 2001. Available online: https://energyplus.net/weather-location/africa_wmo_region_1/EGY//EGY_Cairo.623660_IWEC (accessed on 10 May 2021).
- Krebs, F. Extensive Green Roofs in Porto Alegre, Brazil Extensive Green Roofs in Porto Alegre, Brazil Effect on Indoor Thermal Comfort in Residential Buildings; Department of Architecture and Built Environment, Lund University: Lund, Sweden, 2018. [Google Scholar]
- El-Masry, L. Landscape Architecture and the Planting Design of Al-Azhar Park [AR], 1st ed.; El-Sherouk International Library: Cairo, Egypt, 2014. [Google Scholar]
- Fahmy, M.; Ibrahim, Y.; Hanafi, E.; Barakat, M. Would LEED-UHI greenery and high albedo strategies mitigate climate change at neighborhood scale in Cairo, Egypt? Build. Simul. 2018, 11, 1273–1288. [Google Scholar] [CrossRef]
- Fahmy, M.; Sharples, S.; Yahiya, M. LAI based trees selection for mid latitude urban developments: A microclimatic study in Cairo, Egypt. Build. Environ. 2010, 45, 345–357. [Google Scholar] [CrossRef] [Green Version]
- Shata, R.; Mahmoud, A.; Fahmy, M. Correlating the Sky View Factor with the Pedestrian Thermal Environment in a Hot Arid University Campus Plaza. Sustainability 2021, 13, 468. [Google Scholar] [CrossRef]
- Meteonorm Version 8—Meteonorm (en). Available online: https://meteonorm.com/en/meteonorm-version-8 (accessed on 30 June 2021).
- Autodesk—Autodesk Ecotect Analysis. Available online: http://wayback.vefsafn.is/wayback/20091118210953/http://usa.autodesk.com/adsk/servlet/pc/index?id=12602821&siteID=123112 (accessed on 30 June 2021).
- ISO—ISO 9060:1990. Solar Energy—Specification and Classification of Instruments for Measuring Hemispherical Solar and Direct Solar Radiation. Available online: https://www.iso.org/standard/16629.html (accessed on 30 June 2021).
- Yin, S.; Lang, W.; Xiao, Y.; Xu, Z. Correlative Impact of Shading Strategies and Configurations Design on Pedestrian-Level Thermal Comfort in Traditional Shophouse Neighbourhoods, Southern China. Sustainability 2019, 11, 1355. [Google Scholar] [CrossRef] [Green Version]
- Elwy, I.; Ibrahim, Y.; Fahmy, M.; Mahdy, M. Outdoor microclimatic validation for hybrid simulation workflow in hot arid climates against ENVI-met and field measurements. Energy Procedia 2018, 153, 29–34. [Google Scholar] [CrossRef]
- Battisti, A.; Laureti, F.; Volpicelli, G. Plug&Play: Self-Sufficient Technological Devices for Outdoor Spaces to Mitigate the UHI Effect. In Renewable Energy and Sustainable Buildings; Sayigh, A., Brighton, U., World Renewable Energy Congress, Eds.; Elsevier: Cham, Switzerland, 2018; pp. 59–67. [Google Scholar]
- Coccolo, S.; Pearlmutter, D.; Kämpf, J.; Scartezzini, J.-L. Thermal Comfort Maps to estimate the impact of urban greening on the outdoor human comfort. Urban For. Urban Green. 2018, 35, 91–105. [Google Scholar] [CrossRef]
- Chatzipoulka, C.; Compagnon, R.; Kämpf, J.; Nikolopoulou, M. Sky view factor as predictor of solar availability on building façades. Sol. Energy 2018, 170, 1026–1038. [Google Scholar] [CrossRef]
- Monam, A.; Rückert, K. The Dependence of Outdoor Thermal Comfort on Urban Layouts. Young Cities–Dev. Urban Energy Effic. 2013. [Google Scholar] [CrossRef]
- Martins, T.A.; Adolphe, L.; Bonhomme, M.; Bonneaud, F.; Faraut, S.; Ginestet, S.; Michel, C.; Guyard, W. Impact of Urban Cool Island measures on outdoor climate and pedestrian comfort: Simulations for a new district of Toulouse, France. Sustain. Cities Soc. 2016, 26, 9–26. [Google Scholar] [CrossRef]
- ENVI-Met—Decode Urban Nature with ENVI-Met Software. Available online: https://www.envi-met.com/ (accessed on 30 June 2021).
- Tsoka, T.; Tsiikaloudaki, S.; Theodosiou, A. Analyzing the ENVI-met microclimate model’s performance and assessing cool materials anf urban vegetation applications—A review. Sustain. Cities Soc. 2018, 43, 55–76. [Google Scholar] [CrossRef]
- Operating Manual for Humidity & Temperature Measuring Device BC20—TROTEC. Available online: https://uk.trotec.com/products-services/services/downloads/operating-manuals/measuring-devices/multifunction/operating-manual-for-humidity-temperature-measuring-device-bc20/ (accessed on 30 June 2021).
- Yan, H.; Wang, X.; Hao, P.; Dong, L. Study on the microclimatic characteristics and human comfort of park plant communities in summer. Procedia Environ. Sci. 2012, 13, 755–765. [Google Scholar] [CrossRef] [Green Version]
- Technoline Wind Anemometer. Available online: https://www.technoline-berlin.de/manual/EA-3000(e1).pdf (accessed on 30 June 2021).
- Groat, L. Correlational Research. In Architectural Research Methods, 2nd ed.; John Wiley & Sons, Inc.: Toronto, ON, Canada, 2013; pp. 263–312. [Google Scholar]
- Index of Agreement Calculator. Available online: https://agrimetsoft.com/calculators/Index of Agreement (accessed on 30 June 2021).
- Ruiz, M.A.; Sosa, M.B.; Cantaloube, E.N.C.; Cantón, M.A. Urban Climate Suitable configurations for forested urban canyons to mitigate the UHI in the city of Mendoza, Argentina. Urban Clim. 2015, 14, 197–212. [Google Scholar] [CrossRef]
- Ng, E.; Chen, L.; Wang, Y.; Yuan, C. A study on the cooling effects of greening in a high-density city: An experience from Hong Kong. Build. Environ. 2012, 47, 256–271. [Google Scholar] [CrossRef]
- Jackson, S.L. Correlational Methods and Statistics. In Research Methods and Statistics, 3rd ed.; Macnamee, J., Ed.; Wadsworth Cengage Learning: Belmont, CA, USA, 2012; pp. 140–162. [Google Scholar]
- Perini, K.; Chokhachian, A.; Dong, S.; Auer, T. Modeling and simulating urban outdoor comfort: Coupling ENVI-Met and TRNSYS by grasshopper. Energy Build. 2017, 152, 373–384. [Google Scholar] [CrossRef]
- Chen, H.; Yang, T.; Chen, H.; Lam, G.; Hang, C.K.C.; Wang, J.; Liu, X.; Ling, Y. Integrated impacts of tree planting and aspect ratios on thermal environment in street canyons by scaled outdoor experiments. Sci. Total Environ. 2021, 764, 142920. [Google Scholar] [CrossRef]
- Sodoudi, S.; Zhang, H.; Chi, X.; Müller, F.; Li, H. The influence of spatial configuration of green areas on microclimate and thermal comfort. Urban For. Urban Green. 2018, 34, 85–96. [Google Scholar] [CrossRef]
- Morakinyo, T.E.; Lau, K.K.L.; Ren, C.; Ng, E. Performance of Hong Kong’s common trees species for outdoor temperature regulation, thermal comfort and energy saving. Build. Environ. 2018, 137, 157–170. [Google Scholar] [CrossRef]
- Koerniawan, M.D. The Climate Sensitive Design in Hot-Humid Urban Design. Dimens. J. Archit. Built Environ. 2018, 44. [Google Scholar] [CrossRef] [Green Version]
- Wang, C.; Wang, Z.H.; Wang, C.; Myint, S.W. Environmental cooling provided by urban trees under extreme heat and cold waves in U.S. cities. Remote Sens. Environ. 2019, 227, 28–43. [Google Scholar] [CrossRef]


| Tree | No. of Trees | Canopy | ||||||
|---|---|---|---|---|---|---|---|---|
| Tree Details and Code | East Side | Middle Island | West Side | Total No. | Coverage (m2) | % | Albedo | Shape and Size |
| Evergreen (small), SS | 58 | 0 | 18 | 76 | 532 | 12% | 0.12 | Conic, small trunk, sparse, small (5 m) |
| Palm (large), DM | 0 | 26 | 2 | 28 | 1781.36 | 41% | 0.18 | Palm |
| Evergreen (medium), SM | 0 | 6 | 21 | 27 | 1717.74 | 40% | 0.12 | Conic, large trunk, sparse, medium (15 m) |
| Evergreen (large), SL | 0 | 2 | 0 | 2 | 190.06 | 4% | 0.12 | Spherical, large trunk, sparse, large (25 m) |
| Deciduous dense (small), DS | 0 | 0 | 18 | 18 | 126 | 3% | 0.18 | Spherical, small trunk, dense, small (5 m) |
| Specification | Proposed Tree |  |
| Name | Cassia nodosa | |
| Alternative Name | Pink shower | |
| Foliage profile based on [30], analyzed by LAI2200 data analyzer |  | |
| Total tree height | 7 | |
| Maximum LAD at height | 5 | |
| Foliage height | 3 | |
| Foliage Albedo | 0.18 | |
| LAI Leaf Area Index | 1.61 | |
| LAD Leaf Area Density | ||
| 1 m | 0 | |
| 2 m | 0 | |
| 3 m | 0.189712729 | |
| 4 m | 0.392133918 | |
| 5 m | 0.604495398 | |
| 6 m | 0.518514321 | |
| 7 m | 0 |
| Input Parameter | Value(s) Used |
|---|---|
| City location | Cairo, Egypt (Lat: 30.06°; Long: 31.25°) |
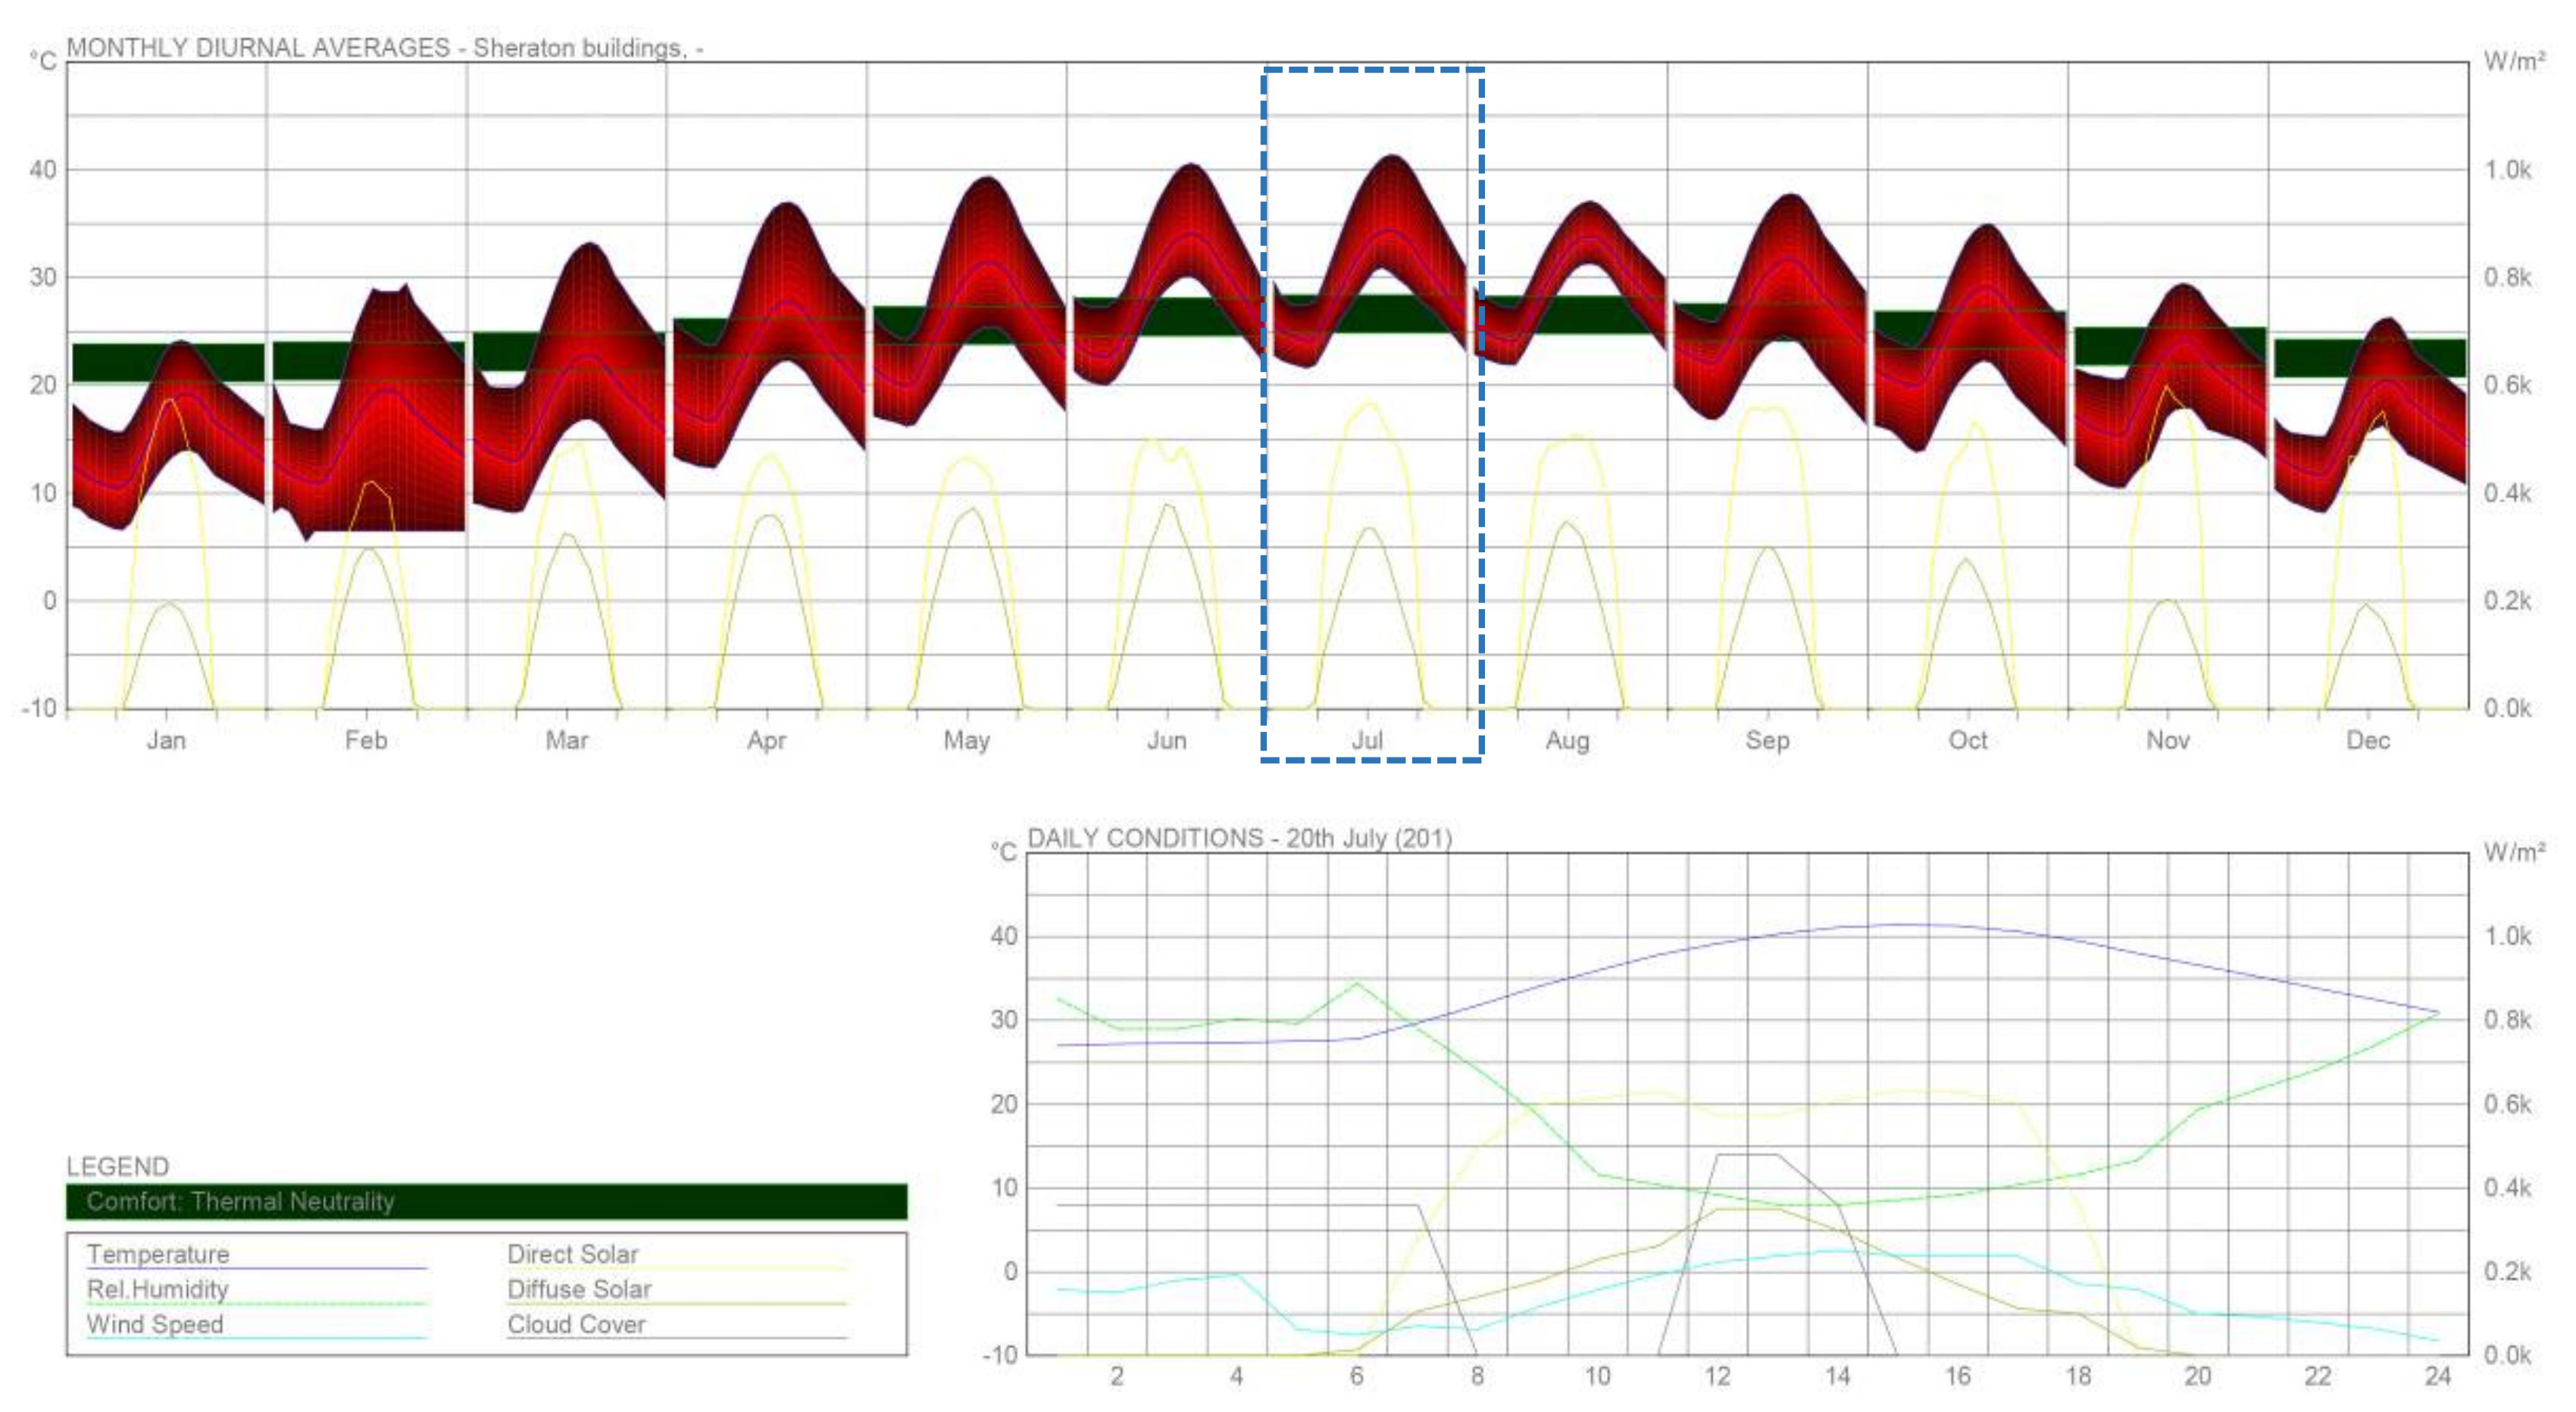
| Simulation day | 20th July, 2020 |
| Simulation duration | 24 h |
| Model resolution | 42 × 191 × 12 m |
| Climate system | Hot arid |
| Windspeed and direction | 3 m/s at 240° |
| Temperature | Min: 26.4 °C; Max: 39.70 °C (forced sampling) |
| Relative humidity | Min: 27%; Max: 59% |
| Cloud cover | Default setting in ENVI-met |
| Material albedo | Grass = 0.2; yellow tiles = 0.5; asphalt = 0.2 |
| Soil | Sandy soil (physical properties based on ENVI-met database) |
| Building wall and roof materials | Default settings in ENVI-met |
| Green Design Scenario | Description | Vegetative Share (%) (inc. (a) Grass Area. (b) Canopy Coverage) | Number of Trees | Visualization |
|---|---|---|---|---|
| Sc_0 | Current greening pattern within the street. | (a) 17% (b) 2% | 151 |  |
| No_Veg | No vegetation | 0% | 0 |  |
| Sc_1 | Single-side trees with 5 m spacing | (a) 17% (b) 3% | 224 |  |
| Sc_2 | Single centered tree with 5 m spacing | (a) 17% (b) 2% | 112 |  |
| Sc_3 | Clustered trees on side | (a) 17% (b) 4% | 252 |  |
| Sc_4 | Clustered trees centered | (a) 17% (b) 2% | 126 |  |
| Sc_5 | Side staggered clustered trees | (a) 17% (b) 3% | 231 |  |
| Sc_6 | Side clustered trees and single tree centered | (a) 17% (b) 4% | 315 |  |
| Sc_7 | Single-side trees clustered center trees | (a) 17% (b) 4% | 252 |  |
| Measurement Instrument | Measuring Parameter | Accuracy | Photo |
|---|---|---|---|
| Portable TroTec Bc 20 | Air Temperature Relative humidity | ±1 °C ±2% |  |
| Techno Line ea3000 | Wind speed | ±5% |  |
| Parameter/Error | R2 | IA | RMSE |
|---|---|---|---|
| Wind Speed (m/s) | 0.6957 | 0.177 | 0.4 |
| Air Temperature (°C) | 0.8946 | 0.5 | 5.6 |
| Relative Humidity (%) | 0.971 | 0.839 | 8.5 |
| PET (°C) | Ta (°C) | Tmrt (°C) | RH (%) | ||
|---|---|---|---|---|---|
| 11:00 | PET (°C) | 1 | −0.02 | −0.88 | −0.24 |
| V (m/s) | −0.95 | −0.21 | 0.97 | 0.46 | |
| Ta (°C) | −0.02 | 1.00 | −0.28 | −0.95 | |
| Tmrt (°C) | −0.88 | −0.28 | 1.00 | 0.50 | |
| 16:00 | PET (°C) | 1 | 0.93 | 0.90 | −0.91 |
| V (m/s) | 0.26 | −0.09 | 0.65 | 0.16 | |
| Ta (°C) | 0.93 | 1.00 | 0.69 | −1.00 | |
| Tmrt (°C) | 0.90 | 0.69 | 1.00 | −0.64 | |
| 19:00 | PET (°C) | 1 | 0.48 | 0.56 | −0.70 |
| V (m/s) | 0.54 | −0.48 | 0.71 | 0.22 | |
| Ta (°C) | 0.48 | 1.00 | −0.16 | −0.95 | |
| Tmrt (°C) | 0.56 | −0.16 | 1.00 | −0.11 | |
| Strong correlation | Moderate correlation | Same parameters | |||
| PET (°C) | Ta (°C) | Tmrt (°C) | RH (%) | ||
|---|---|---|---|---|---|
| 11:00 | PET (°C) | 1.00 | −0.14 | 0.54 | −0.21 |
| V (m/s) | −0.66 | −0.19 | 0.24 | 0.50 | |
| Ta (°C) | −0.14 | 1.00 | −0.22 | −0.90 | |
| Tmrt (°C) | 0.54 | −0.22 | 1.00 | 0.12 | |
| 16:00 | PET (°C) | 1.00 | 0.84 | 0.94 | −0.89 |
| V (m/s) | 0.19 | 0.07 | 0.52 | 0.00 | |
| Ta (°C) | 0.84 | 1.00 | 0.75 | −0.98 | |
| Tmrt (°C) | 0.94 | 0.75 | 1.00 | −0.77 | |
| 19:00 | PET (°C) | 1.00 | −0.06 | 0.99 | −0.34 |
| V (m/s) | 0.62 | −0.21 | 0.60 | −0.14 | |
| Ta (°C) | −0.06 | 1.00 | −0.19 | −0.15 | |
| Tmrt (°C) | 0.99 | −0.19 | 1.00 | −0.32 | |
| Strong correlation | Moderate correlation | Same parameters | |||
Publisher’s Note: MDPI stays neutral with regard to jurisdictional claims in published maps and institutional affiliations. |
© 2021 by the authors. Licensee MDPI, Basel, Switzerland. This article is an open access article distributed under the terms and conditions of the Creative Commons Attribution (CC BY) license (https://creativecommons.org/licenses/by/4.0/).
Share and Cite
Elbardisy, W.M.; Salheen, M.A.; Fahmy, M. Solar Irradiance Reduction Using Optimized Green Infrastructure in Arid Hot Regions: A Case Study in El-Nozha District, Cairo, Egypt. Sustainability 2021, 13, 9617. https://0-doi-org.brum.beds.ac.uk/10.3390/su13179617
Elbardisy WM, Salheen MA, Fahmy M. Solar Irradiance Reduction Using Optimized Green Infrastructure in Arid Hot Regions: A Case Study in El-Nozha District, Cairo, Egypt. Sustainability. 2021; 13(17):9617. https://0-doi-org.brum.beds.ac.uk/10.3390/su13179617
Chicago/Turabian StyleElbardisy, Wesam M., Mohamed A. Salheen, and Mohammed Fahmy. 2021. "Solar Irradiance Reduction Using Optimized Green Infrastructure in Arid Hot Regions: A Case Study in El-Nozha District, Cairo, Egypt" Sustainability 13, no. 17: 9617. https://0-doi-org.brum.beds.ac.uk/10.3390/su13179617