Article

Fertilization Failed to Make Positive Effects on Torreya grandis in Severe N-Deposition Subtropics

1
Jiyang College, Zhejiang A&F University, Zhuji 311800, China
2
State Key Laboratory of Subtropical Silviculture, School of Forestry and Biotechnology, Zhejiang A&F University, Hangzhou 311300, China
3
Department of Forestry and Environmental Conservation, Clemson University, Clemson, SC 29634, USA
4
East China Coastal Forest Ecosystem Long-Term Research Station, Research Institute of Subtropical Forestry, Chinese Academy of Forestry, Hangzhou 311400, China
*
Author to whom correspondence should be addressed.
Sustainability 2021, 13(17), 9736; https://0-doi-org.brum.beds.ac.uk/10.3390/su13179736
Submission received: 1 August 2021 / Revised: 26 August 2021 / Accepted: 27 August 2021 / Published: 30 August 2021

Abstract

:
In managed orchards, fertilization brings out not only high productivity expectations but also severe environmental pollution. Because economic profit takes priority over environmental cost, increasing amounts of fertilizer have been used in mature subtropical Torreya grandis orchards. However, given the magnitude of global nitrogen deposition, it’s worth considering whether heavy fertilizer treatment is necessary. To elucidate the balance between T. grandis nutrient demands and fertilizer supply, we determined the C, N, and P concentrations of foliar and soil ([C], [N], [P]) at 9 orchards undergoing long-term fertilizer treatments in two scenarios of N and N + P addition with different intensity. After documenting the dynamic variation of plant growth, nutrients characteristic, and the corresponding resorption efficiency, we found that excessive N addition interfered T. grandis’ sensibility to P availability in this N-enrichment area, leading to an increasing foliar [P] and resorption efficiency (PRE) and decoupling plant C:N:P ratios. As a result, enhanced fertilizer supply failed to improve carbon accumulation, plant growth, and yield effectively. These results demonstrate that extra fertilization in the N-saturated study area highly reduced the economic and ecological efficiency of fertilizers. Thus, our research suggests that N addition in the studied orchards should be rejected, and we recommend organic management as a more conducive method to achieve sustainable development.

1. Introduction

Torreya grandis (T. grandis) is an old relict species within the family of Taxaceae that is endemic in China, often referred to as Chinese Torreya. It has been one of the most economically important tree species in the subtropical region of China. The Kuaijishan Ancient Chinese Torreya Community was listed in China National Important Agricultural Heritage and Globally Important Agricultural Heritage Systems (GIAHS) in 2013 [1,2]. Trees in the community area are considered ‘living fossils’ because they originated from the application of grafting and artificial selection techniques in ancient China. Many of those trees are over one thousand years economic old but still sustain a high yield of seed production. The Chinese Torreya community is highly valued both ecologically (e.g., water and soil conservation, climate regulation, biodiversity maintaining) and economically (e.g., nuts, medicine, oil, and as an ornamental tree). As a result, the planting area of T. grandis has steadily increased in several provinces during the past three decades. However, the old Torreya plantation in the Kuaijishan Ancient Chinese Torreya Community is facing severe degradation due to nature aging, climate change, and inappropriate management, such as overfertilization.
Alternate bearing phenomenon loom large, due to the overexploitation of T. grandis seeds; to improve this, escalating amounts of chemical nitrogen (N) and phosphorus (P) rich fertilizer have been applied by the local manager, without any scientific management guidance (e.g., supplying based on the demands of plants). N and P are key nutrients that play pivotal roles in controlling plant growth and litter decomposition, as well as in ecosystems’ biochemical cycles [3,4,5]. However, the indiscriminate use of chemical fertilizer (including quantity and proportion) has caused abnormally high concentrations of N and P to accumulate in the soil, which has severely stressed the terrestrial plants’ multiple physiological processes. Furthermore, the excessive use of chemical fertilizer has also generated serious adverse environmental consequences, such as non-point source pollution [6] and N-induced soil acidification (especially due to NH4+), both of which have been observed in multiple ecosystems [7,8,9]. It should be noted that soil acidification would change ecosystem biogeochemistry, accelerating cationic nutrient (such as Ca2+, Mg2+) leaching and thereby, reducing plant productivity in turn [10,11] and negatively affecting local biodiversity [12,13].
Under natural conditions, N input to an N-limited ecosystem (such as boreal forests) will improve net primary productivity (NPP) through a direct fertilizing effect on vegetation [14]. As a direct result from global change, N deposition in many regions of the world (i.e., United States, western Europe, and China) currently exceeds 10 kg N ha−1 yr−1, especially in tropical and subtropical areas of China [15,16],where over 80–120 kg N ha−1 yr−1 has been reported [17]. China has become one of the highest N deposition area, and N deposition has increased by approximately 60% over the past three decades [16]. A meta-analysis has reported an N saturation threshold of 50–60 kg ha−1 yr−1 across the entire terrestrial ecosystem [18]. Therefore, as N deposition levels continue to accelerate, N-limitation has been subsequently alleviated [19], and there is a high likelihood that the ecosystem is shifting to an N-enriched status [20]. Unlike N, which can be accumulated through biological fixation and increasing deposition, available soil P comes from slow parent mineral weathering and a low rate of atmospheric deposition from wildfires. Based on nutrient demand balance theory, excessive N input has been reported to not only disturb the balance in the biogeochemical cycles of essential plant nutrients [21,22,23], but also initiate P-limitation in forest ecosystems [24,25,26,27]. Fang et al. [28] reported N saturation in three subtropical sites and noted that P deficiency is becoming progressively more problematic. The anthropogenic alternation of regional P and N cycling has led to large areas of southern China forests shifting to human-induced P-limitation [27]. NPP/GPP has transformed from being N-limited to P-limited in many forest ecosystems [4,26,29,30].
Soil N and P availability, especially when combined with N deposition and/or external addition, can influence forest productivity and ecosystem processes [3,31]. Trees can keep leaf nutrient concentrations and their ratios stable by modulating the nutrients coming from branches, roots or senescent leaves [32,33]. Recently, foliar N and P concentration stoichiometry ratios (i.e., N:P, C:N, C:P) have been used to indicate soil N- and/or P-limitations on plant growth [24,34,35]. In addition, nutrient resorption [nitrogen (NRE) and/or phosphorus (PRE)] from senescing plant tissues and the proficiency of nutrient conservation [36], are also widely used as indicators in studies of nutrient cycling between plants and soil in fluctuating environments. Generally, nutrients would transfer from senescent leaf to trunk before falling off, thereby maintaining the plant nutrients at a favorable level. The NRE and PRE might depend on the type of nutrient limitation [37] and vary in response to the plant’s intrinsic genetic characteristics [38,39]. NRE/PRE is commonly employed to determine the relative limitation between N and P; NRE/PRE values > 1 imply a stronger N-limitation at the ecosystem scale [26]. However, previous studies predominantly focused on the effect of single N or P addition on leaf nutrients or resorption; thus, the effect of multiple nutrient addition on NRE and/or PRE in subtropical forests is not well understood.
Meanwhile, the relationship between plant P uptake and nutrient environmental supply is more comprehensive than N. Under intensive management, the long-term addition of balanced compound fertilizer may cause excess P in orchards, as plants generally require less P than N [40]. P is an essential element for nucleic acids and membrane lipids. Although P sensing and signaling are not fully understood, there appears to be a series of physiological processes in plants that are either stimulated or suppressed in response to P supply [41]. Unlike the immobile N in the plant cell wall, most leaf P is hydrolyzable and, therefore, more easily resorbed [42,43]. In fact, due to its indiscriminate uptake, greater variability of foliar P has been reported even in growth stages in which it is not needed [44]. Species in P-poor environments, such as subtropical evergreen trees, are equipped with a corresponding adaptation mechanism that makes them more susceptible to toxic eutrophication under excessive P addition [45].
At present, there is not even a clear relationship between N and P fertilization with economic benefit (such as seed yield) in our research area; furthermore, an excessive or unreasonable rate of fertilizer consumption faces both increasing economic investments and the deterioration of the soil’s physical and chemical properties, let alone its internal nutrient influence mechanism. Thus, it is critical to determine the optimal amount of fertilizer necessary to achieve ideal growth. A comprehensive understanding of fertilizer impact on crop quantity and soil quality is critical for improving fertilizer treatment strategies in economic consideration and maintaining a healthy soil environment. To solve the above problems, we examined the C, N, and P stoichiometry of soil, as well as the green and senescent leaf of mature T. grandis trees, in nine orchards with varying N and N + P fertilizer treatments. The objective of this study was to: (1) evaluate whether the continuously increasing N deposition in subtropical forests has alleviated the N-limitation and excessive N applications causing nutrients imbalances with that restricting plant growth, and (2) whether P additions can relieve this condition and improve growth or seed yields. These results are expected to provide fertilization guidelines and recommendations to help farmers reduce costs and soil pollution while ensuring optimal production.

2. Materials and Methods
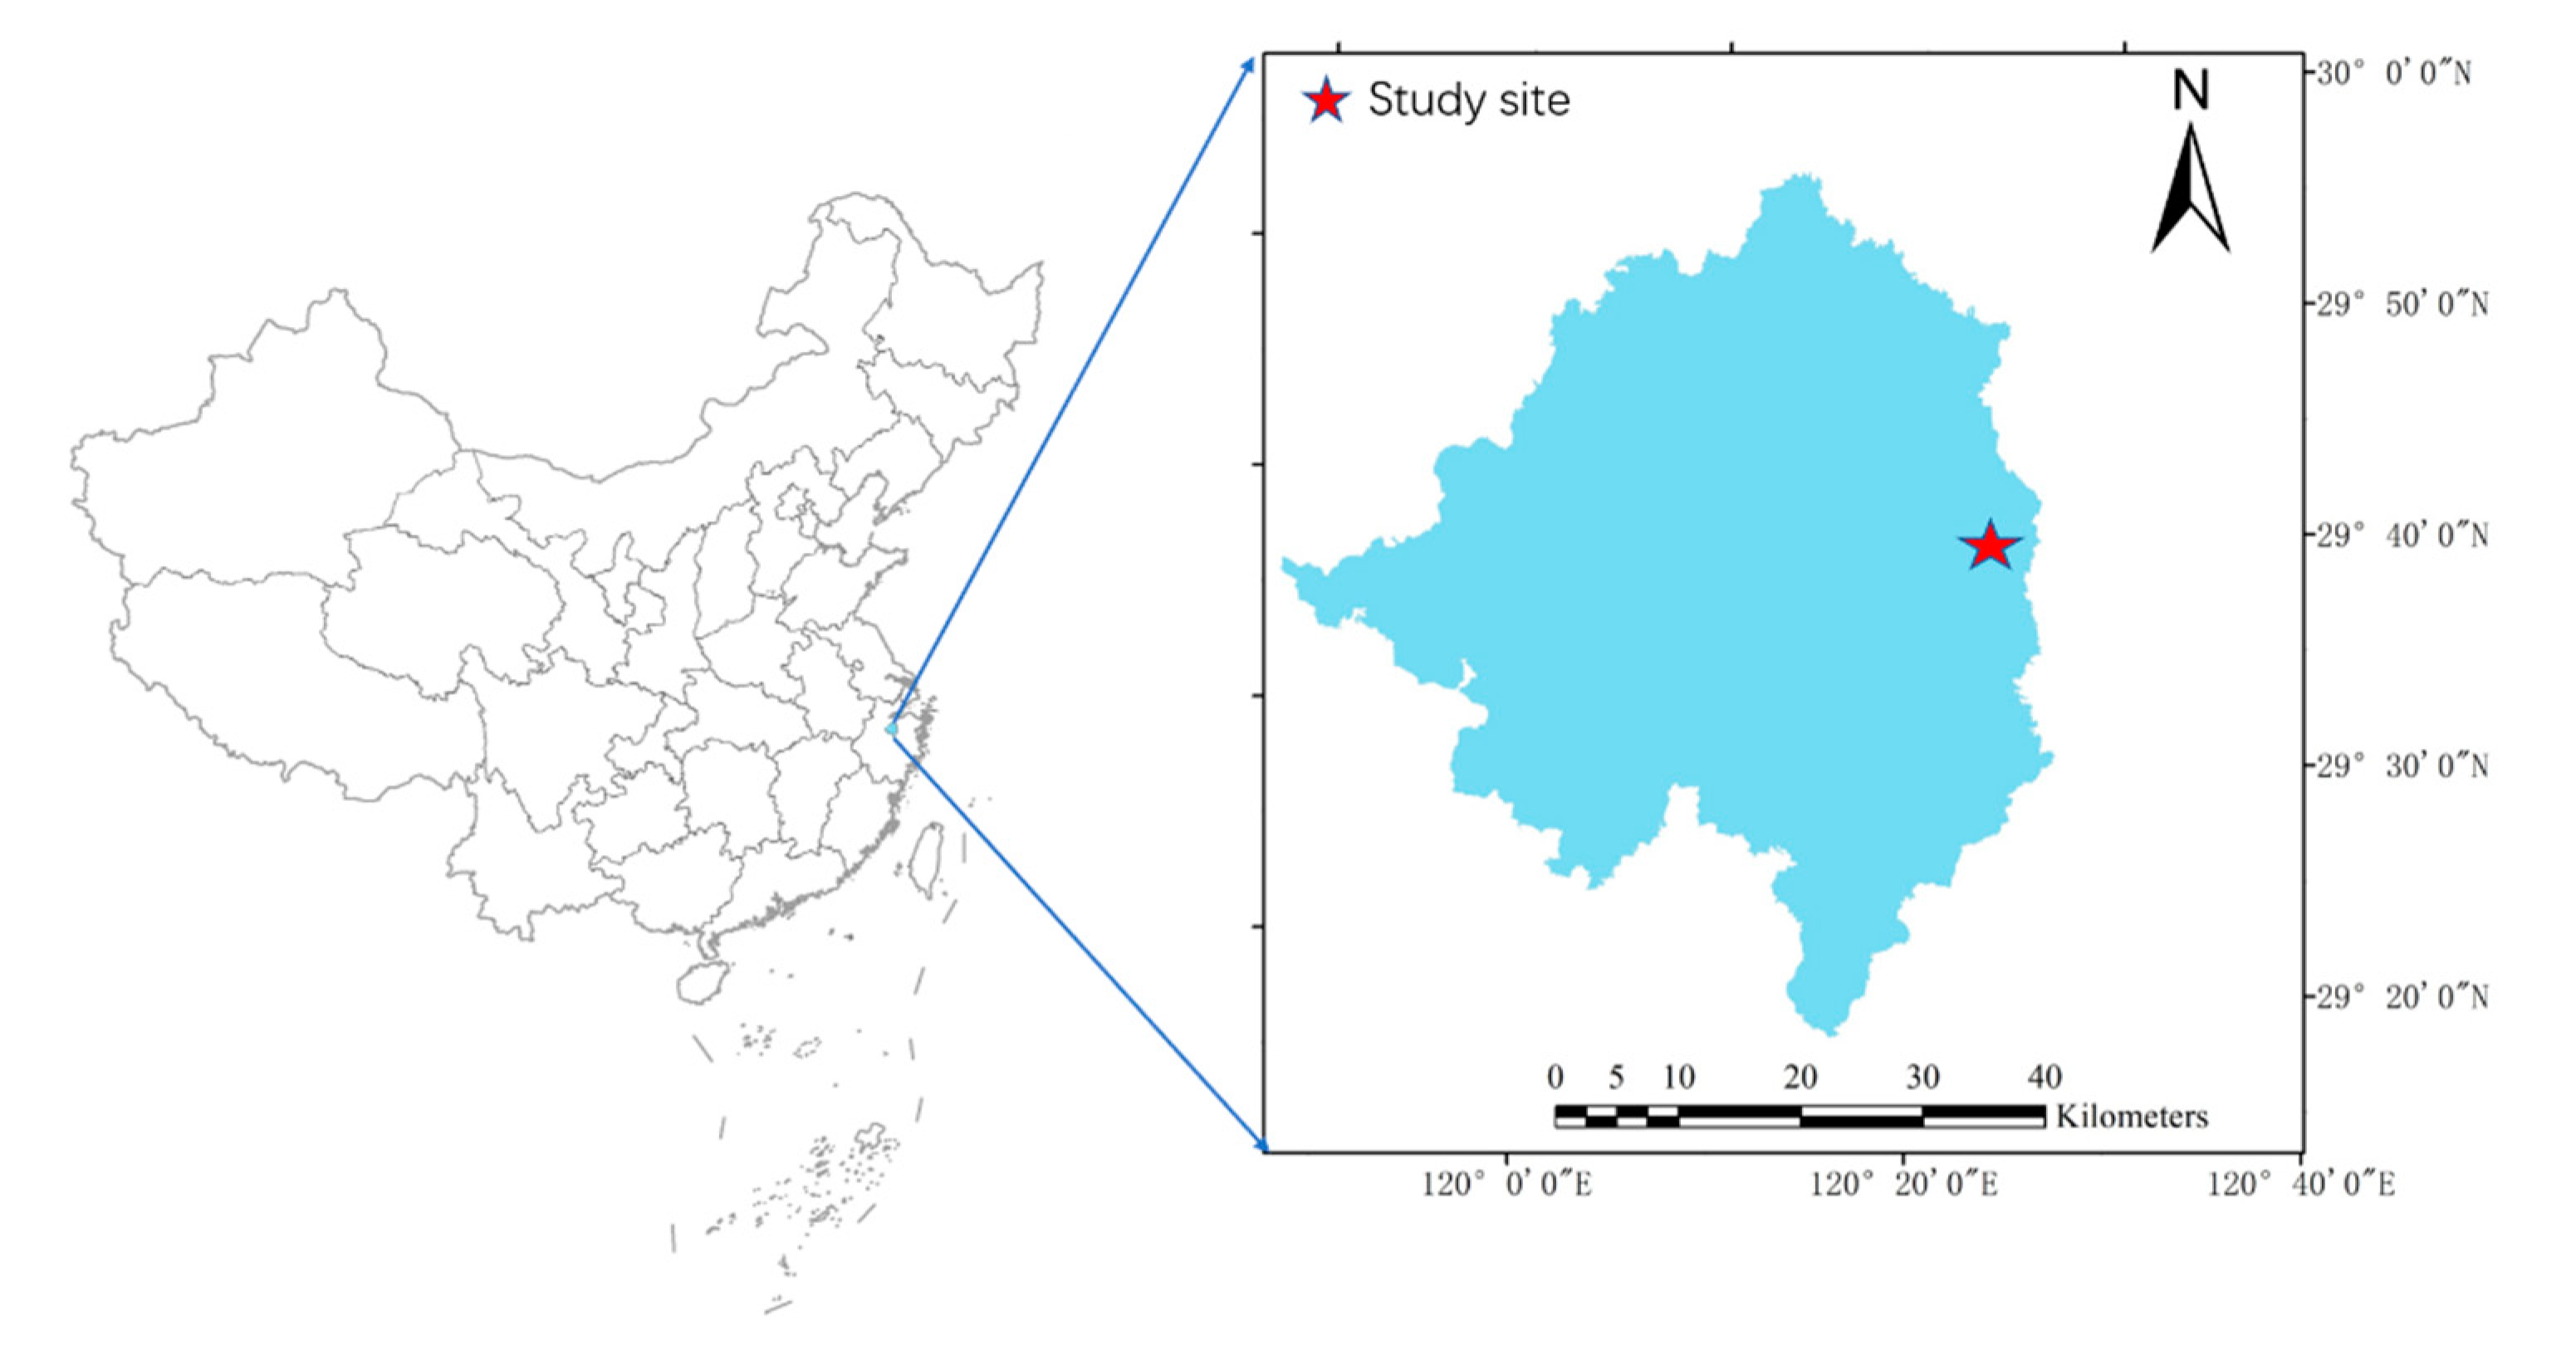
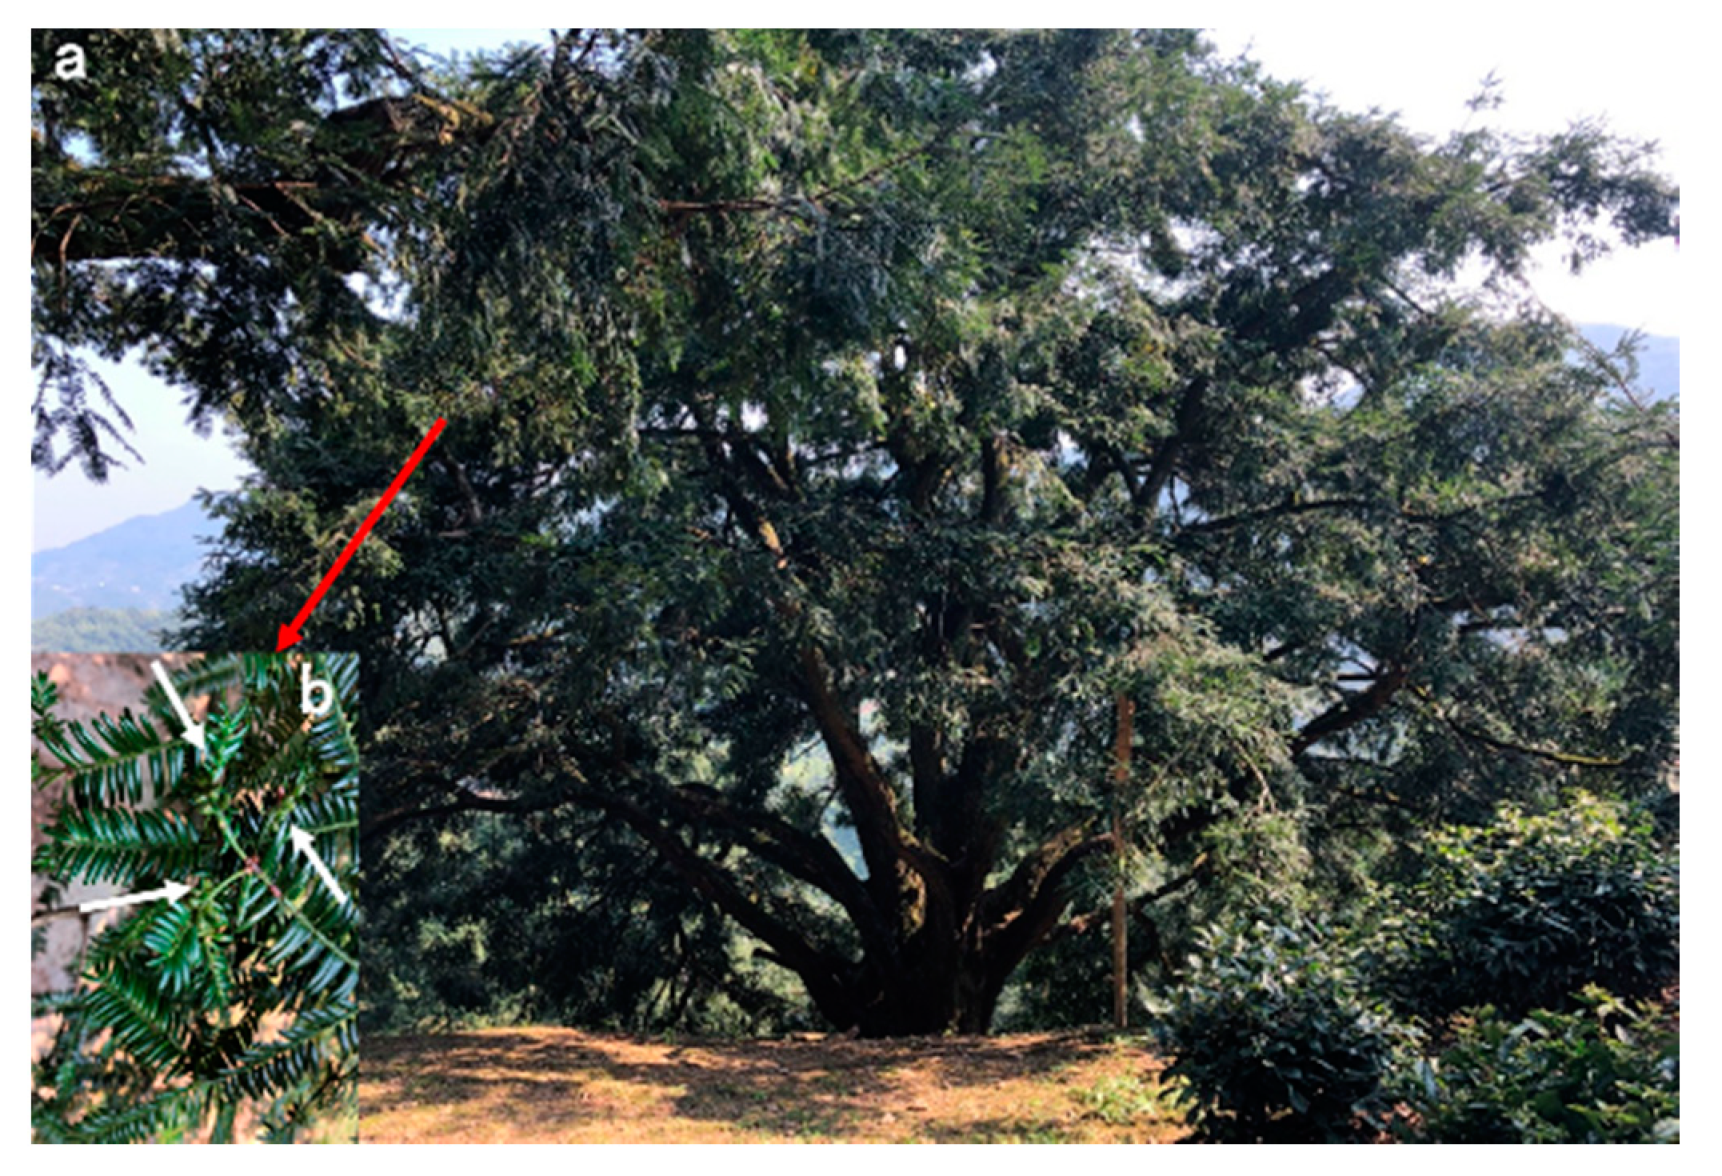
2.1. Study Site

The study was conducted at the origination locale of T. grandis—Chinese Torreya Forest Park (29.69–29.73° N, 120.49–51° E), in Shaoxing, Zhejiang Province, China (Figure 1). This study comes from our investigation on local ancient trees. There are several orchards with different intensities of management. The physical and chemical properties of the soil in the study area before management (2009) was provided by the local forestry bureau. It consisted of: organic carbon (OC)-18.2 g/kg; total N (TN)-1.67 g/kg; total P (TP)-1.56 g/kg; hydrologic N (HN)-132 mg/kg; and Olmes-P (AP)-225 mg/kg; pH-5.25. The soil was acidic and characterized as the Hapludult soil type with respect to Chinese Soil Taxonomy [46]. T. grandis trees of over 130 years old with a distribution density of 22–55 trees per hectare were selected as the study object. The average tree height was 7.8 ± 0.5 m (mean ± SD); the diameter at breast height (DBH) was 46.2 ± 2.2 cm, and the average crown breadth of the trees was 6.0 ± 0.6 × 7.0 ± 0.5 m.

2.2. Nutrient Addition

Based on different fertilization habits, we selected 2 groups of orchards: N addition only and N + P addition according to a fixed ratio of N:P2O5. Each nutrient included 5 gradients: 0, 27, 48, 54, 108 kg/ha·a (N0, N1, N2, N3, N4) and 0, 11.8, 21, 23.6, 47.2 kg/ha·a (P0, P1, P2, P3, P4). These fertilization modes have lasted more than ten years. Two fertilizer scenarios share an unfertilized control designated “N0P0”. The experimental design included 9 treatments (P0N0, P0N1, P0N2, P0N3, P0N4; P1N1, P2N2, P3N3, P4N4) and five replicates in each treatment, totaling 45 (100 m × 100 m) plots. Each plot had 25–32 mature T. grandis trees and were subjected to the same management practices except for nutrient addition. N and P fertilization was applied in the form of urea and superphosphate twice (April and July) a year, at a depth of 10 cm below the soil’s surface.

2.3. Sample Collection and Measurements

In each plot, five green leaf sample groups (50 leaves for each group) were collected from the apricus healthy shoots of random plants in the middle of the canopy in September 2019. Similarly, five 1 m × 1 m litter collection boxes were arranged along the diagonal of each plot. Both sample sets—the green leaf samples and the mixed litter samples—were individually oven-dried at 60 °C to a constant weight. Then they were respectively ground and sieved through a 1 mm mesh screen for further analyses. Soil samples were collected at the same time when leaf samples were collected. Each soil sample was a mixture of five soil collections from a 20–40 cm depth (main root absorption area), and each location was randomly selected along the diagonal of each plot. The soil was dried and sieved to measure the particle size distribution and other soil chemical properties. Considering the difficulty of non-destructive biomass estimation of these old trees, annual shoots were used to evaluate the growth characteristic. The annual shoots are the main sites bearing seeds. The number of annual shoots were determined by five 0.5 m-long branches in the middle of canopies selected randomly (Figure 2).
The foliar and soil nutrient properties (i.e., total N~TN, total P~TP, hydrolyzable N~HN, Olsen-P~AP, and soil organic carbon~SOC), as well as soil pH, were measured in accordance with national forestry industry standards [47,48,49,50].

2.4. Data Analysis

To examine the relative nutrient limitation among the treatments, we calculated nutrient resorption efficiency (NuRE) using the following equation:
NuRE = 1 NuSENESCENT NuGREEN × MLCF × 100 %
where NuGREEN and NuSCENESCENT are the nutrient concentrations ([N], [P]) in green and senesced leaves, respectively, and MLCF is the mass loss correction factor with a value of 0.780 for evergreen species [51].
Given the large data set collected, we also tested the relationships between the log-transformed nutrient stoichiometry of green and senescent leaves by applying a type II linear regression model (SMA, standardized major axis; Y~X) using the lmodel2 package in R (3.6.1). Y is the [C], [N], [P] or stoichiometry ratios in the foliar samples and X is the related variables in the senescent leaves; slope >1 indicated slower increase of Y than X; slope < 1 indicated a faster increase of Y than X, and slope = 1 indicated a synchronous change of X and Y [52].
Significant difference of each dependent variable (C, N, P stoichiometry of soil, foliar, and nutrient resorption) among fertilizer treatments were tested by one-way analysis of variance (ANOVA) followed by least significant difference (LSD) and Tamhane’s T2. Distance correlation analysis was performed to assess the nutrient content correlation among the soil, green leaves, and senescent leaves. Results were considered significant when p < 0.05. All statistical analysis was performed using the SPSS software (version 20.0, SPSS Inc., Chicago, IL, USA) and R (3.6.1).

3. Results

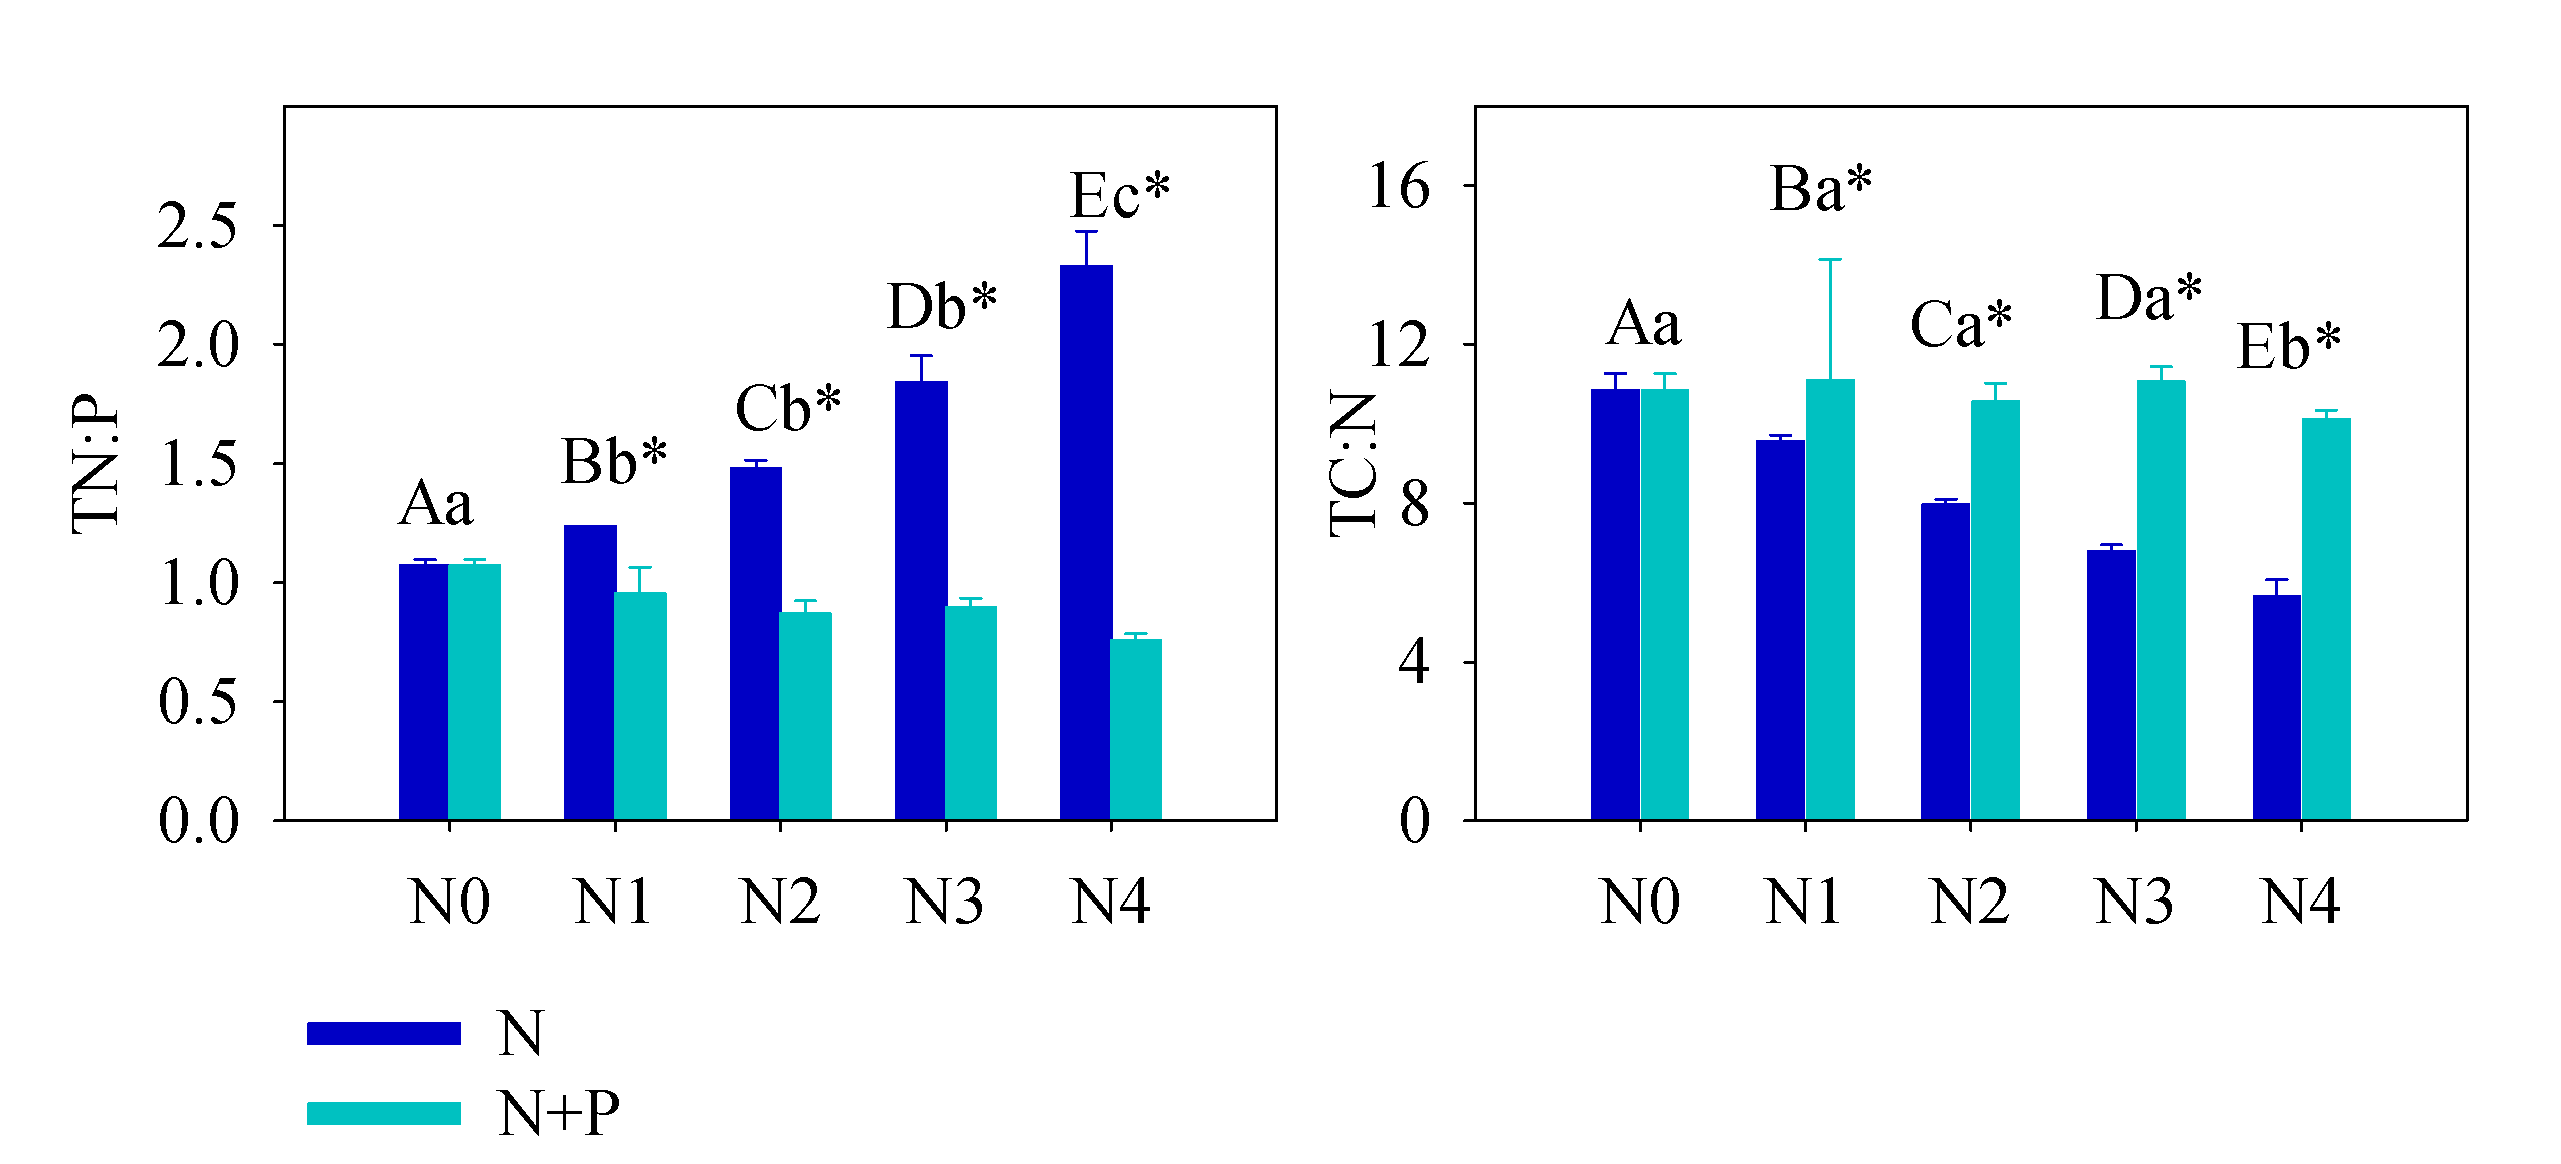
3.1. Soil Nutrient Characteristics

Fertilization treatments affected soil properties, such as nutrient content and N:P stoichiometry, but not C:N ratios (Figure 3). N addition increased soil TN and HN content and decreased TN:P; but as P addition was proportional, the soil TN:P increased because of the obvious increase in soil P (Table 1). SOC contents were also increased with both N and N + P addition, while soil pH decreased with fertilizer addition.

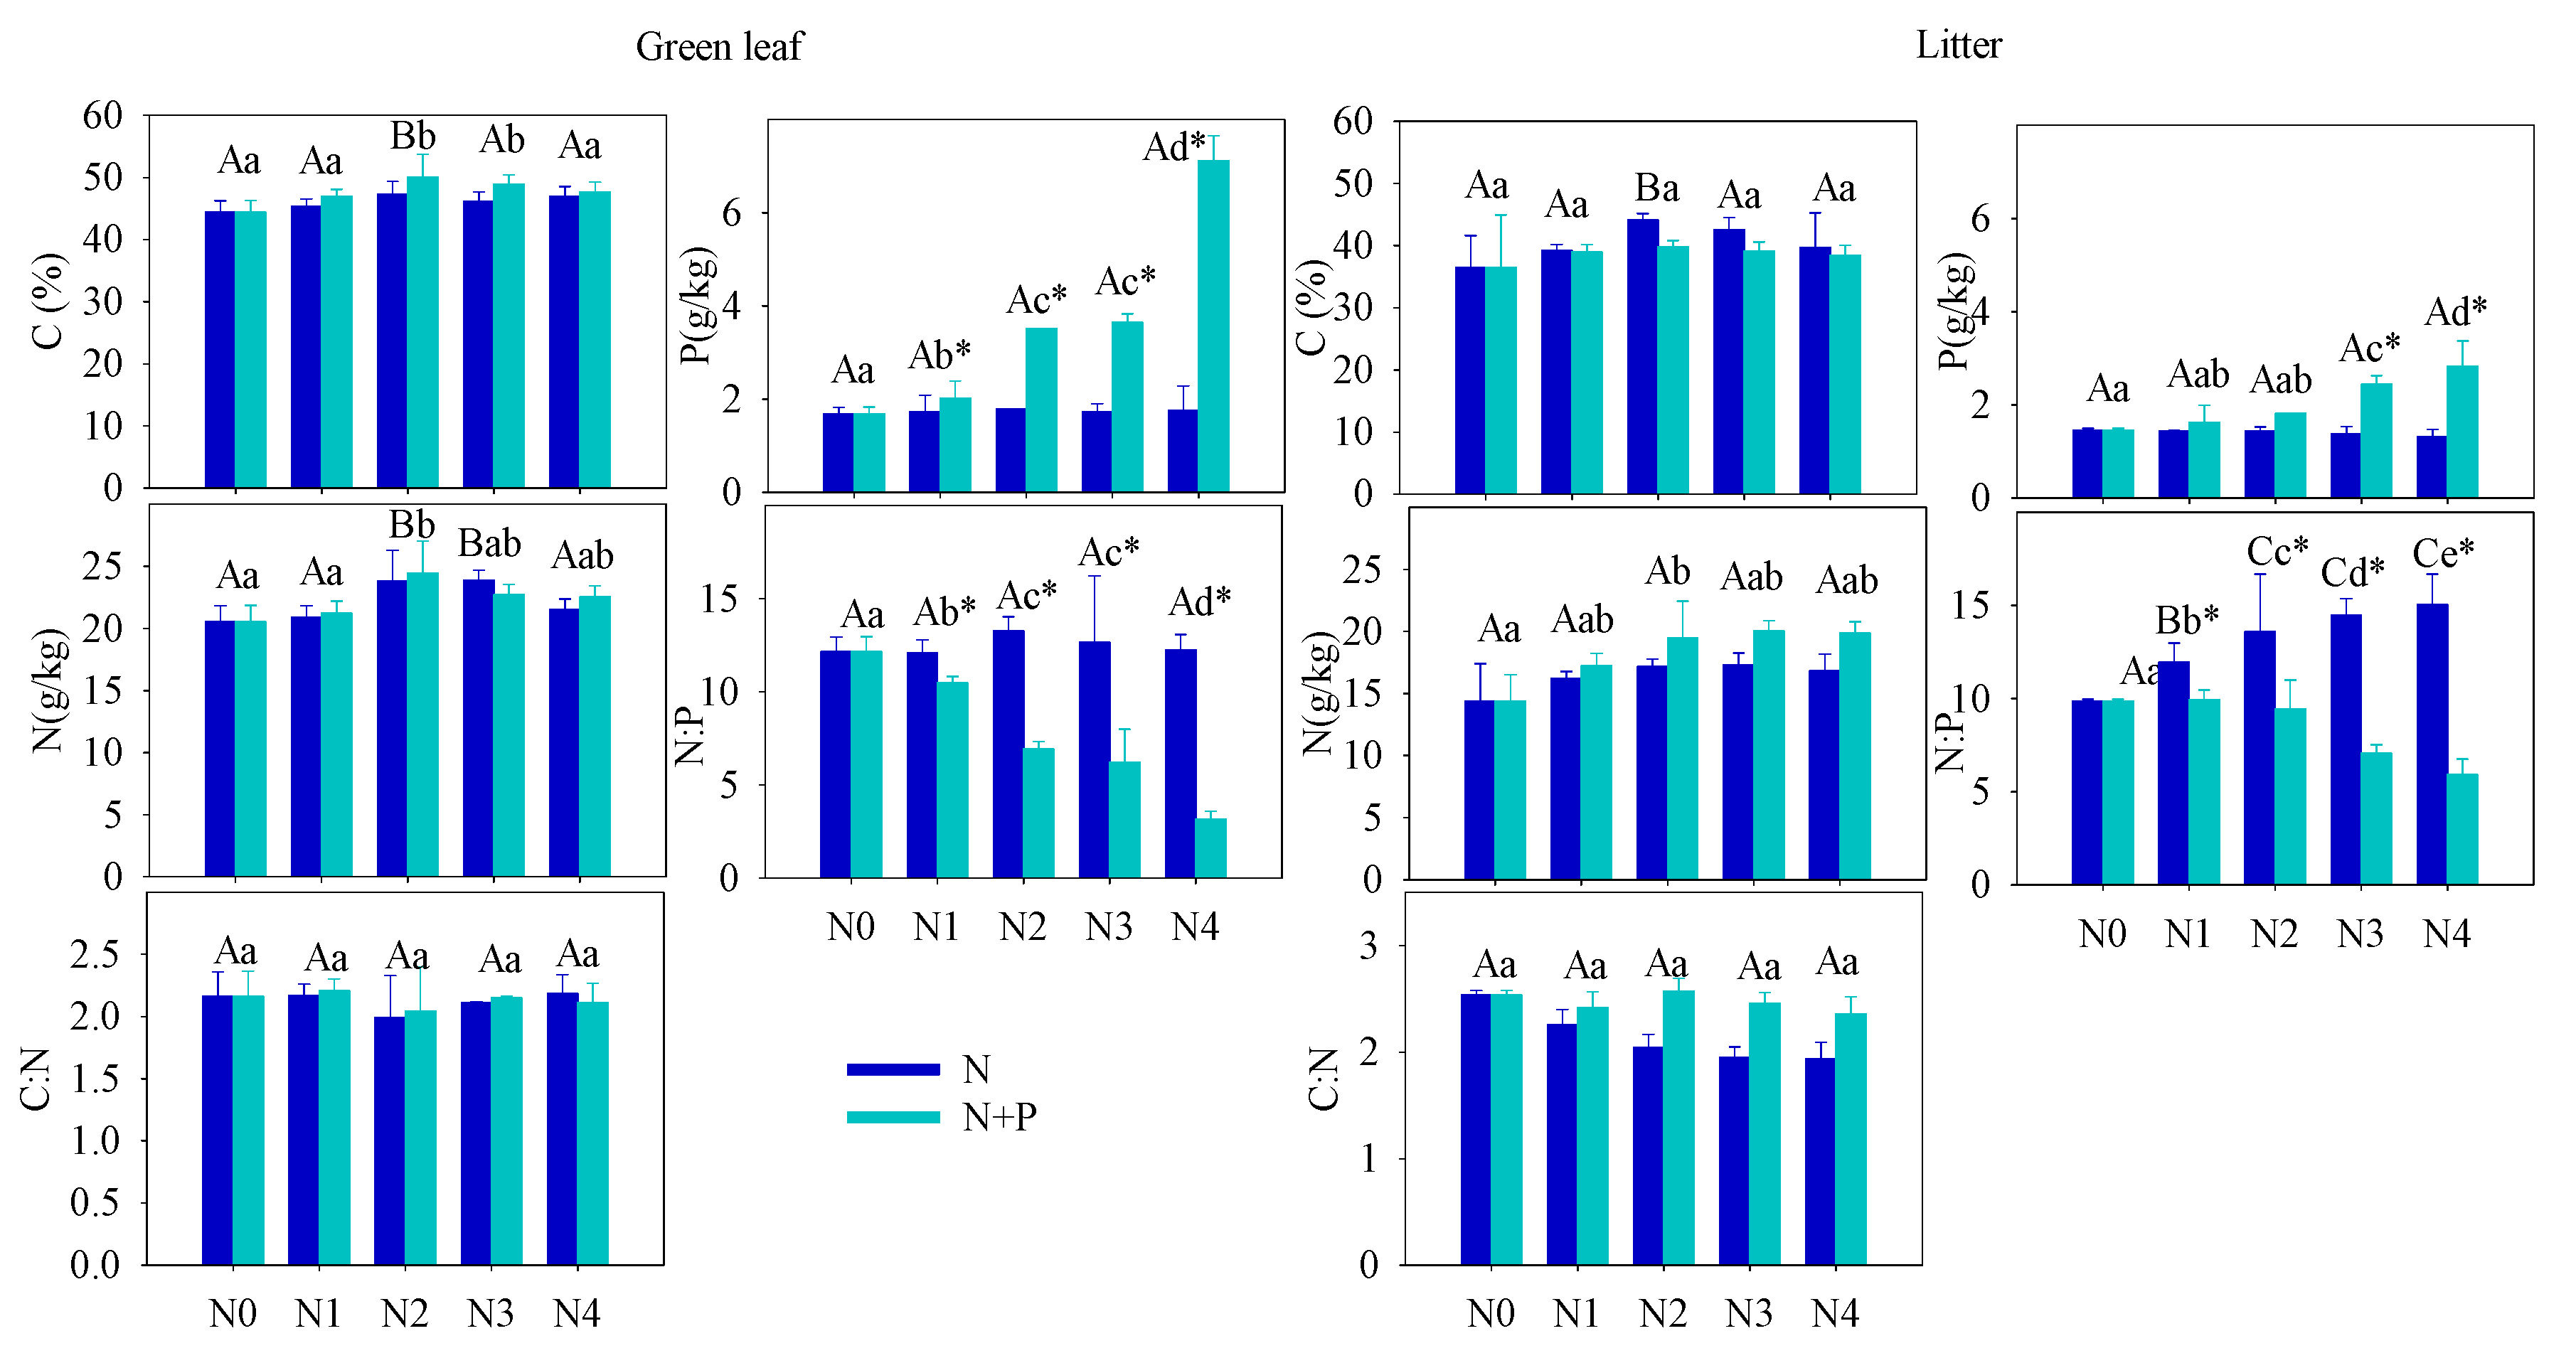
3.2. Plant Nutrient and Growth Characteristics

Fertilizer addition increased foliar nutrient content to some extent, which depended on the nutrient element and leaf life stage (Figure 4). Green leaf uniformly exhibited a higher nutrient concentration ([C], [N], and [P]) than senescent leaf, but nutrients showed different patterns under the two fertilization scenarios. For green leaf, moderate fertilization increased leaf [N] and [C] in both N and N + P addition scenarios, while there was no significant difference among other treatments conditions (p > 0.05, Figure 4). For senescent leaf, the resorption proficiency ([C], [N] and [P]) trend paralleled that of the green leaf, although the magnitudes differed. Similarly, there was no significant difference in [C] and [N] among different treatments in the senescent leaf. While P addition increased [P] in both green and senescent leaf, [P] exponentially increased with the N + P fertilizer supply gradient (Figure 4). Green leaf [P] was significantly correlated with soil inorganic nitrogen concentration (indicated by soil hydrolyzable nitrogen, HN) rather than inorganic phosphorus (indicated by soil AP) (Table 2), while there was no correlation of leaf [N] with either soil P or N content.
The C:N ratio of both green (2.15 ± 0.05 under N + P treatments; 2.12 ± 0.08 under N treatments) and senescent (2.47 ± 0.09 under N + P treatments; 2.15 ± 0.25 under N treatments) leaves showed no significant difference among the treatments (Figure 4). The significant increase in [P] under N + P treatments led to big variations in foliar N:P (Figure 4), which declined with increasing fertilizer addition. There was no significant effect of fertilization treatments on nutrient utilization efficiency in carbon fixation indicated by C:P and C:N.
The fresh seed yields of T. grandis in these orchards averaged 203.2 ± 15.0–230.2 ± 8.4 kg/tree (Table 3), with a significant decrease under high fertilization (P0N4 and P1N4), while moderate N + P fertilization increased seed yield. The number of annual shoots per 0.5 m-long branch ranged between 57.0 ± 2.3 and 60.5 ± 4.2 and showed no significant difference under fertilizer treatments (p > 0.1).

4. Discussion

4.1. Effects of Fertilizer on Soil Condition

Long-term N deposition and fertilization could elevate soil nutrient concentration beyond the demand of the plant, altering the soil nutrient cycles [53]. Because most soils in subtropical areas are severely acidic, improper and excessive use of fertilizers could further deteriorate soil physical, chemical, and biological properties, especially aggravating soil acidification and soil hardening. Decreases in soil pH caused by fertilizer will likely reduce soil microbial and enzyme activities, which subsequently reduces organic matter mineralization and ultimately reduces “chemical facilitation” [54], which presented obviously with intensifying N fertilization in this study.

4.2. Effect of Fertilizer on Plant C, N, and P Stoichiometry

One of the primary goals of this research is to evaluate whether T. grandis requires extra fertilization or whether adding additional nutrients can improve seed production. In the present study, fertilization tended to increase the foliar nutrients ([C], [N], [P]), but only the increase in [P] was statistically significant in the N + P addition scenario. The steady foliar [N] under increasing fertilization may indicate diminished N-limitation to plant growth, which can be explained by a plant behavior developed from adjusting to nutrient-abundant environments. A significant increase of leaf [P] in N + P scenario resulted in a distinct decrease in the C:P and N:P ratios. According to the growth-rate hypothesis, plant invests more phosphorus to RNA for rapid protein synthesis in fast-growing organisms [55]. Hence, the opposite condition, high leaf [P], indicated a low-growing condition of T. grandis under high fertilization, which was confirmed by the statistical results of annual shoots (Table 3).
The soil nutrient pool (TN, TP, HN, and SOC), under long-term fertilizer treatment, was much higher than that in other subtropical areas [56,57]. Long-term soil nutrient enrichment resulted in much higher T. grandis foliar nutrient (N and P) contents than the average values of 753 terrestrial species [58] and other subtropical evergreen trees [59]. Due to the different N and P utility patterns in physiological processes, regardless of species and site fertilizer supply, plants can store a greater percentage of inorganic P than N. Thus, with increasing fertilizer addition, foliage accumulated more P than N [44]. It was also observed that some plant species growing in P-limited environments might not downregulate P uptake when a higher supply of P is available [44,60,61]. When the environment P supply shifts from P-limited to non-limited condition, the plants may undergo an excessive P uptake, even to saturated or toxic levels. Hence, foliar [P] usually displays a much higher variation after fertilizer treatments. Therefore, it is not surprised that the foliar [P] nearly doubled after a high fertilizer treatment compared to the control group (Figure 4). Given the generally low bioavailability of P in subtropical soils, T. grandis may have developed an efficient mechanism to take up and accumulate P in response to the strong selective pressure [62,63]. Unlike previous studies [21,64,65,66,67,68,69], leaf [N] of T. grandis didn’t change much in response to the increasing soil [N] availability, which implied that fertilizer treatments had no effect on T. grandis N absorption (Table 1; Figure 3). In this scenario, relatively stable leaf [C] and [N], but increased leaf [P], led to opposite trends between C:P and N:P and soil nutrient content (Table 1; Figure 3). Therefore, our findings answered the first question, that long-term fertilization, combined with increasing nitrogen deposition, results in a N-enriched environment. This result also confirms that N-limitation has been generally alleviated in this subtropical forest; while P-limitation in the study area was aggravated by N enrichment [58,67,68].
Stoichiometry homeostasis was used to analyze plant composition, ecosystem function, and nutrient limitation, especially for key elements such as C, N, and P ratios [69,70]. Generally, plants uptake nutrients in appropriate proportions to maintain nutritional balance, depending on physiological consumption [13,22]. The inherently higher variability of P concentration in plants, relative to N, was illustrated in a survey of European wetlands [71]. Similarly, our findings demonstrated that the correlations between foliar [P]-[C] and [P]-[N] were decoupled due to a more sensitive response of foliar [P] to the N + P fertilizer supply (Figure 3 and Figure 4). This suggests that the balance of biogeochemical C, N, and P cycles were broken by the fertilizer treatments, which could decrease ecosystem stability [72] and alter the N and P cycles [73], leading to degenerative feedback between the plant and the ecosystem [74]. Under these circumstances, foliar [P] or the N:P ratio may not reflect the actual demands of the plant under P addition conditions [75]. Although many studies indicate that the N:P ratio of mature leaves has been widely used to diagnose plant growth nutrient limitations, with thresholds (such as 10 and 20) to classify the plants into N-limited, N and P co-limited, and P limited plants [24,76,77].

4.3. Effect of Fertilizer on Plant Nutrient Resorption

Acquisition (root uptake) and conservation (resorption from senescent tissue) are two important biological strategies for plants to maintain balanced nutrition where soil nutrients are deficient. These processes are also important in cycling nutrients between the soil and plants [78]. Choosing between alternative strategies for plants depends on the cost (time and energy) of each process and the species characteristics. Short-term experiments have demonstrated that, generally, plants will reduce nutrient utilization efficiency when the surrounding nutrient availability increases [73], while the relationship between foliar resorption and soil nutrient concentration is not consistent [34,79,80].
Nutrient resorption was another important index indicating environmental nutrient deficiency or not. Our results indicated a constant or slight decreased NRE, which further verified our supposition concerning N enrichment in these orchards (Figure 5). According to nutrient balance theory, N addition aggravated P-limitation that was illustrated by increasing PRE. However, increased P migration from senescent leaf to green leaf (PRE) in response to increasing N + P fertilizer supply conflicts with the negative correlation between fertilizer treatment and nutrient resorption [73]. This kind of counterintuitive result has been observed in a single-resource conservation standpoint in previous studies [81,82]; yet multiple-element theory much more appropriately explains variability in foliar nutrient resorption [67]. Based on a Pearson correlation analysis, we found that green leaf [P] was not related to soil [AP], but it was highly correlated with soil N content (Table 3). It should be noted that the root system can directly uptake inorganic nutrients (AP and HN) and therefore plays a more important role in nutrient absorption than organic nutrients. This inorganic nutrient preference may help explain the absence of a common trend in studies comparing P resorption to soil P availability [34,80]. In our study, although the soil and leaves were characterized by a higher [P] compared to other studies of evergreen trees [52], excess N addition was responsible for the amplified P-limitation (Figure 5), which subsequently elevated leaf P uptake directly [83,84].
The standardized major axis (SMA) analysis showed that leaf [P] is independent of soil [P], which supports the above hypothesis. Strong dependencies, indicated by a slope > 1, were found only between senescent and green leaf [C] (Table 4). For an evergreen species with a long leaf life span, T. grandis exhibited a more conservative P use strategy as opposed to the external root uptake strategy, regardless of soil P availability. Similar results were also reported in some non-mycorrhizal species [85]. This mechanism allows plants to maintain a higher nutrient absorption efficiency with relatively less cost (energy and time) but lowers the utilization efficiency and productivity [86].
On these bases, contrary to previous research [87], fertilizer treatment in this study also failed to increase the vegetative (indicated by the annual shoots) and reproductive growth (indicated by the yield of fresh seeds) of T. grandis. Although moderate P addition improved foliar nutrients content and seed yields slightly, while high intensity fertilization in both scenarios showed negative effects on seed yield (Table 3). Moreover, the fertilizer significantly reduced the C:P (indicating the P utilization efficiency in productivity) of T. grandis in this study, suggesting that the P utilization efficiency of plants was reduced by the increased nutrient supply [88]. Our analysis suggested that both P and N fertilizer might be unnecessary for T. grandis.

5. Conclusions

Long-term fertilizer treatments increased soil N and P significantly in T. grandis orchards, which increased leaf N and P concentrations, but there was no obvious positive impact on T. grandis growth but only a negative impact on seed yield under heavy fertilizer application. In our study, N enrichment was indicated by stable and decoupling relationships between the soil and leaf [N]. Leaf [P] was highly correlated with soil [N], and N enrichment amplified the physiological P limitation (deficiency). Excessive N addition interfered T. grandis’s sensibility to P availability in this N-enrichment area, which is indicated by increasing PRE with both modes of fertization intensity. Therefore, leaf [P] or the N:P ratio may not reflect the actual demands of the plant under the P addition conditions in our study. Furthermore, large amount of fertilizer application might waste resources and alter soil physicochemical properties (e.g., soil acidification). Decreasing fertilizer application should be taken into consideration to accomplish the sustainable development of the orchard ecosystems.

Author Contributions

Idea development, G.G.W. and T.W.; field experiment design, S.J., W.C. and Y.J.; data collection, W.C. and Y.J.; data interpretation, Y.H. and S.J.; data analysis, Y.H.; writing—original draft preparation, Y.H.; writing—revision and editing, G.G.W. and T.W. All authors have read and agreed to the published version of the manuscript.

Funding

The National Key Research and Development Program of China (2019YFE0118900), the National Natural Science Foundation of China (31971641), Jiyang College of Zhejiang A&F University under Grant ( 0525170003 ), and the Young People Fund of Natural Science Foundation of Zhejiang province, China (LQ19C160011).

Institutional Review Board Statement

Not applicable.

Informed Consent Statement

Not applicable.

Data Availability Statement

The data supporting reported results can be supplied by the authors upon request.

Conflicts of Interest

The authors declare no conflict of interest.

References

  1. FAO. Kuaijishan Ancient Chinese Torreya, China. Available online: http://www.fao.org/giahs/giahsaroundtheworld/designated-sites/asia-and-the-pacific/kuajishan-ancient-chinese-torreya/en (accessed on 10 May 2020).
  2. MOA. Available online: http://www.moa.gov.cn/ztzl/zywhycsl/dypzgzywhyc/ (accessed on 10 May 2020).
  3. Finzi, A.C.; Austin, A.; Cleland, E.E.; Frey, S.; Houlton, B.Z.; Wallenstein, M.D. Responses and feedbacks of coupled biogeochemical cycles to climate change: Examples from terrestrial ecosystems. Front. Ecol. Environ. 2011, 9, 61–67. [Google Scholar] [CrossRef] [Green Version]
  4. Penuelas, J.; Poulter, B.; Sardans, J.; Ciais, P.; van der Velde, M.; Bopp, L.; Boucher, O.; Godderis, Y.; Hinsinger, P.; Llusia, J.; et al. Human-induced nitrogen-phosphorus imbalances alter natural and managed ecosystems across the globe. Nat. Commun. 2013, 4, 1–10. [Google Scholar] [CrossRef] [PubMed] [Green Version]
  5. You, C.; Wu, F.; Yang, W.; Xu, Z.; Tan, B.; Zhang, L.; Yue, K.; Ni, X.; Li, H.; Chang, C. Does foliar nutrient resorption regulate the coupled relationship between nitrogen and phosphorus in plant leaves in response to nitrogen deposition? Sci. Total Environ. 2018, 645, 733–742. [Google Scholar] [CrossRef]
  6. Sun, Y.; Hu, R.; Zhang, C. Does the adoption of complex fertilizers contribute to fertilizer overuse? Evidence from rice production in China. J. Clean. Prod. 2019, 219, 677–685. [Google Scholar] [CrossRef]
  7. Zhu, Z.; Chen, D. Nitrogen fertilizer use in China–Contributions to food production, impacts on the environment and best management strategies. Nutr. Cycl. Agroecosystems 2002, 63, 117–127. [Google Scholar] [CrossRef]
  8. Fernández-Escobar, R.; Marin, L.; Sánchez-Zamora, M.; García-Novelo, J.; Molina-Soria, C.; Parra, M. Long-term effects of N fertilization on cropping and growth of olive trees and on N accumulation in soil profile. Eur. J. Agron. 2009, 31, 223–232. [Google Scholar] [CrossRef]
  9. Zhao, Q.; Zeng, D.-H. Nitrogen addition effects on tree growth and soil properties mediated by soil phosphorus availability and tree species identity. For. Ecol. Manag. 2019, 449, 117478. [Google Scholar] [CrossRef]
  10. Dai, Z.; Zhang, X.; Tang, C.; Muhammad, N.; Wu, J.; Brookes, P.C.; Xu, J. Potential role of biochars in decreasing soil acidification-A critical review. Sci. Total Environ. 2017, 581, 601–611. [Google Scholar] [CrossRef]
  11. Zhang, Y.; He, X.; Liang, H.; Zhao, J.; Zhang, Y.; Xu, C.; Shi, X. Long-term tobacco plantation induces soil acidification and soil base cation loss. Environ. Sci. Pollut. Res. 2016, 23, 5442–5450. [Google Scholar] [CrossRef]
  12. Peppler-Lisbach, C.; Stanik, N.; Konitz, N.; Rosenthal, G. Long-term vegetation changes inNardusgrasslands indicate eutrophication, recovery from acidification, and management change as the main drivers. Appl. Veg. Sci. 2020, 23, 508–521. [Google Scholar] [CrossRef]
  13. Phoenix, G.K.; Emmett, B.A.; Britton, A.J.; Caporn, S.J.M.; Dise, N.B.; Helliwell, R.; Jones, L.; Leake, J.R.; Leith, I.D.; Sheppard, L.J.; et al. Impacts of atmospheric nitrogen deposition: Responses of multiple plant and soil parameters across contrasting ecosystems in long-term field experiments. Glob. Chang. Biol. 2012, 18, 1197–1215. [Google Scholar] [CrossRef]
  14. Lebauer, D.; Treseder, K. Nitrogen Limitation of Net Primary Productivity in Terrestrial Ecosystems is Globally Distributed. Ecology 2008, 89, 371–379. [Google Scholar] [CrossRef] [PubMed] [Green Version]
  15. Meunier, C.L.; Gundale, M.J.; Sánchez, I.S.; Liess, A. Impact of nitrogen deposition on forest and lake food webs in nitrogen-limited environments. Glob. Chang. Biol. 2016, 22, 164–179. [Google Scholar] [CrossRef] [PubMed]
  16. Liu, X.; Zhang, Y.; Han, W.; Tang, A.; Shen, J.; Cui, Z.; Vitousek, P.; Erisman, J.W.; Goulding, K.; Christie, P.; et al. Enhanced nitrogen deposition over China. Nature 2013, 494, 459. [Google Scholar] [CrossRef]
  17. Yu, L.; Zhu, J.; Mulder, J.; Dörsch, P. Multiyear dual nitrate isotope signatures suggest that N-saturated subtropical forested catchments can act as robust N sinks. Glob. Chang. Biol. 2016, 22, 3662–3674. [Google Scholar] [CrossRef]
  18. Tian, D.; Wang, H.; Sun, J.; Niu, S. Global evidence on nitrogen saturation of terrestrial ecosystem net primary productivity. Environ. Res. Lett. 2016, 11, 024012. [Google Scholar] [CrossRef] [Green Version]
  19. Tao, L.; Hunter, M.D. Does anthropogenic nitrogen deposition induce phosphorus limitation in herbivorous insects? Glob. Chang. Biol. 2012, 18, 1843–1853. [Google Scholar] [CrossRef] [Green Version]
  20. Yu, Q.; Duan, L.; Yu, L.; Chen, X.; Si, G.; Ke, P.; Ye, Z.; Mulder, J. Threshold and multiple indicators for nitrogen saturation in subtropical forests. Environ. Pollut. 2018, 241, 664–673. [Google Scholar] [CrossRef]
  21. Ferretti, M.; Marchetto, A.; Arisci, S.; Bussotti, F.; Calderisi, M.; Carnicelli, S.; Cecchini, G.; Fabbio, G.; Bertini, G.; Matteucci, G. On the tracks of Nitrogen deposition effects on temperate forests at their southern European range—An observational study from Italy. Glob. Chang. Biol. 2015, 20, 3423–3438. [Google Scholar] [CrossRef] [Green Version]
  22. Sardans, J.; Alonso, R.; Janssens, I.; Carnicer, J.; Vereseglou, S.; Rillig, M.C.; Fernández-Martínez, M.; Sanders, T.G.M.; Peñuelas, J. Foliar and soil concentrations and stoichiometry of nitrogen and phosphorous across European Pinus sylvestris forests: Relationships with climate, N deposition and tree growth. Funct. Ecol. 2016, 30, 676–689. [Google Scholar] [CrossRef] [Green Version]
  23. Gilliam, F.S.; Billmyer, J.H.; Walter, C.A.; Peterjohn, W.T. Effects of excess nitrogen on biogeochemistry of a temperate hardwood forest: Evidence of nutrient redistribution by a forest understory species. Atmos. Environ. 2016, 146, 261–270. [Google Scholar] [CrossRef] [Green Version]
  24. Güsewell, S. N:P ratios in terrestrial plants: Variation and functional significance. New Phytol. 2004, 164, 243–266. [Google Scholar] [CrossRef]
  25. Vitousek, P.; Porder, S.; Houlton, B.; Chadwick, O. Terrestrial phosphorus limitation: Mechanisms, implications, and nitrogen-phosphorus interactions. Ecol. Appl. A Publ. Ecol. Soc. Am. 2010, 20, 5–15. [Google Scholar] [CrossRef] [PubMed] [Green Version]
  26. Du, E.; Terrer, C.; Pellegrini, A.F.; Ahlström, A.; van Lissa, C.J.; Zhao, X.; Xia, N.; Wu, X.; Jackson, R.B. Global patterns of terrestrial nitrogen and phosphorus limitation. Nat. Geosci. 2020, 13, 221–226. [Google Scholar] [CrossRef]
  27. Du, E.; Vries, W.D.; Han, W.; Liu, X.; Yuan, J. Imbalanced phosphorus and nitrogen deposition in China’s forests. Atmos. Chem. Phys. 2016, 16, 8571–8579. [Google Scholar] [CrossRef] [Green Version]
  28. Fang, X.-M.; Zhang, X.-L.; Chen, F.-S.; Zong, Y.-Y.; Bu, W.-S.; Wan, S.-Z.; Luo, Y.; Wang, H. Phosphorus addition alters the response of soil organic carbon decomposition to nitrogen deposition in a subtropical forest. Soil Biol. Biochem. 2019, 133, 119–128. [Google Scholar] [CrossRef]
  29. Zhan, S.; Wang, Y.; Zhu, Z.; Li, W.; Bai, Y. Nitrogen enrichment alters plant N: P stoichiometry and intensifies phosphorus limitation in a steppe ecosystem. Environ. Exp. Bot. 2017, 134, 21–32. [Google Scholar] [CrossRef]
  30. Du, E.; van Doorn, M.; de Vries, W. Spatially divergent trends of nitrogen versus phosphorus limitation across European forests. Sci. Total Environ. 2021, 771, 145391. [Google Scholar] [CrossRef]
  31. Elser, J.J.; Sterner, R.; Gorokhova, E.; Fagan, W.F.; Markow, T.; Coter, J.; Harrison, J.; Hobbie, S.; Odell, G.M.; Weider, L. Biological Stoichiometry from Genes to Ecosystems. Ecol. Lett. 2000, 3, 540–550. [Google Scholar] [CrossRef] [Green Version]
  32. Yan, Z.; Li, P.; Chen, Y.; Han, W.; Fang, J. Nutrient allocation strategies of woody plants: An approach from the scaling of nitrogen and phosphorus between twig stems and leaves. Sci. Rep. 2016, 6, 1–9. [Google Scholar] [CrossRef] [Green Version]
  33. Cernusak, L.A.; Winter, K.; Turner, B.L. Leaf nitrogen to phosphorus ratios of tropical trees: Experimental assessment of physiological and environmental controls. New Phytol. 2010, 185, 770–779. [Google Scholar] [CrossRef]
  34. Aerts, R.; Chapin III, F.S. The mineral nutrition of wild plants revisited: A re-evaluation of processes and patterns. Adv. Ecol. Res. 1999, 30, 1–67. [Google Scholar]
  35. Koerselman, W.; Meuleman, A.F. The vegetation N: P ratio: A new tool to detect the nature of nutrient limitation. J. Appl. Ecol. 1996, 33, 1441–1450. [Google Scholar] [CrossRef]
  36. Lin, Y.-M.; Liu, X.-W.; Zhang, H.; Fan, H.-Q.; Lin, G.-H. Nutrient conservation strategies of a mangrove species Rhizophora stylosa under nutrient limitation. Plant Soil 2010, 326, 469–479. [Google Scholar] [CrossRef] [Green Version]
  37. Güsewell, S. Nutrient resorption of wetland graminoids is related to the type of nutrient limitation. Funct. Ecol. 2005, 19, 344–354. [Google Scholar] [CrossRef]
  38. Silla, F.; Escudero, A. Uptake, demand and internal cycling of nitrogen in saplings of Mediterranean Quercus species. Oecologia 2003, 136, 28–36. [Google Scholar] [CrossRef]
  39. Sadanandan Nambiar, E.K.; Fife, D.N. Nutrient retranslocation in temperate conifers. Tree Physiol. 1991, 9, 185–207. [Google Scholar] [CrossRef] [PubMed]
  40. Macy, P. The quantitative mineral nutrient requirements of plants. Plant Physiol. 1936, 11, 749. [Google Scholar] [CrossRef] [PubMed] [Green Version]
  41. Fang, Z.; Shao, C.; Meng, Y.; Wu, P.; Chen, M. Phosphate signaling in Arabidopsis and Oryza sativa. Plant Sci. 2009, 176, 170–180. [Google Scholar] [CrossRef]
  42. McGroddy, M.E.; Daufresne, T.; Hedin, L.O. Scaling of C: N: P stoichiometry in forests worldwide: Implications of terrestrial redfield-type ratios. Ecology 2004, 85, 2390–2401. [Google Scholar] [CrossRef]
  43. Ågren, G.I. Stoichiometry and nutrition of plant growth in natural communities. Annu. Rev. Ecol. Evol. Syst. 2008, 39, 153–170. [Google Scholar] [CrossRef]
  44. Ostertag, R. Foliar nitrogen and phosphorus accumulation responses after fertilization: An example from nutrient-limited Hawaiian forests. Plant Soil 2010, 334, 85–98. [Google Scholar] [CrossRef]
  45. Musick, H.B. Phosphorus toxicity in seedlings of Larrea divaricata grown in solution culture. Bot. Gaz. 1978, 139, 108–111. [Google Scholar] [CrossRef]
  46. Gong, Z. Chinese Soil Taxonomy; Science Press: Beijing, China, 1999. [Google Scholar]
  47. SFA. Determination of organic matter in forest soil and calculation carbon-nitrogen ratio. In LY/T 1237–1999; China Standards Press: Beijing, China, 1999. [Google Scholar]
  48. SFA. Phosphorus Determination Methods of Forest Soils; China Standards Press: Beijing, China, 2015. [Google Scholar]
  49. SFA. Nitrogen Determination Methods of Forest Soils; China Standards Press: Beijing, China, 2015. [Google Scholar]
  50. SFA. Determination of pH Value in Forest Soil; China Standards Press: Beijing, China, 1999. [Google Scholar]
  51. Vergutz, L.; Manzoni, S.; Porporato, A.; Novais, R.F.; Jackson, R.B. Global resorption efficiencies and concentrations of carbon and nutrients in leaves of terrestrial plants. Ecol. Monogr. 2012, 82, 205–220. [Google Scholar] [CrossRef] [Green Version]
  52. Tang, Z.; Xu, W.; Zhou, G.; Bai, Y.; Li, J.; Tang, X.; Chen, D.; Liu, Q.; ma, W.; Xiong, G.; et al. Patterns of plant carbon, nitrogen, and phosphorus concentration in relation to productivity in China’s terrestrial ecosystems. Proc. Natl. Acad. Sci. USA 2018, 115, 4033–4038. [Google Scholar] [CrossRef] [Green Version]
  53. Huang, J.; Wang, X.; Yan, E. Leaf nutrient concentration, nutrient resorption and litter decomposition in an evergreen broad-leaved forest in eastern China. For. Ecol. Manag. 2007, 239, 150–158. [Google Scholar] [CrossRef]
  54. Yang, H. Effects of nitrogen and phosphorus addition on leaf nutrient characteristics in a subtropical forest. Trees 2018, 32, 383–391. [Google Scholar] [CrossRef]
  55. Matzek, V.; Vitousek, P.M. N:P stoichiometry and protein:RNA ratios in vascular plants: An evaluation of the growth-rate hypothesis. Ecol. Lett. 2009, 12, 765–771. [Google Scholar] [CrossRef] [PubMed]
  56. Zhang, Q.F.; Xie, J.S.; Lyu, M.K.; Xiong, D.C.; Wang, J.; Chen, Y.M.; Li, Y.Q.; Wang, M.K.; Yang, Y.S. Short-term effects of soil warming and nitrogen addition on the N:P stoichiometry of Cunninghamia lanceolata in subtropical regions. Plant Soil 2017, 411, 395–407. [Google Scholar] [CrossRef]
  57. Kou, L.; Wang, H.; Gao, W.; Chen, W.; Yang, H.; Li, S. Nitrogen addition regulates tradeoff between root capture and foliar resorption of nitrogen and phosphorus in a subtropical pine plantation. Trees 2016, 31, 77–91. [Google Scholar] [CrossRef]
  58. Han, W.; Fang, J.; Guo, D.; Zhang, Y. Leaf nitrogen and phosphorus stoichiometry across 753 terrestrial plant species in China. New Phytol. 2005, 168, 377–385. [Google Scholar] [CrossRef] [PubMed]
  59. Tang, X.; Zhao, X.; Bai, Y.; Tang, Z.; Wang, W.; Zhao, Y.; Wan, H.; Xie, Z.; Shi, X.; Wu, B.; et al. Carbon pools in China’s terrestrial ecosystems: New estimates based on an intensive field survey. Proc. Natl. Acad. Sci. USA 2018, 115, 4021–4026. [Google Scholar] [CrossRef] [PubMed] [Green Version]
  60. Shane, M.; Lambers, H. Phosphorus nutrition of Australian Proteaceae and Cyperaceae: A strategy on old landscapes with prolonged oceanically buffered climates. South Afr. J. Bot. 2007, 73, 274–275. [Google Scholar]
  61. Standish, R.; Stokes, B.; Tibbett, M.; Hobbs, R. Seedling response to phosphate addition and inoculation with arbuscular mycorrhizas and the implications for old-field restoration in Western Australia. Environ. Exp. Bot. 2007, 61, 58–65. [Google Scholar] [CrossRef]
  62. Ingestad, T. Towards optimum fertilization. Ambio 1974, 3, 49–54. [Google Scholar]
  63. Chapin, F.S., III; Schulze, E.; Mooney, H.A. The ecology and economics of storage in plants. Annu. Rev. Ecol. Syst. 1990, 21, 423–447. [Google Scholar] [CrossRef]
  64. Mulligan, D.; Sands, R. Dry matter, phosphorus and nitrogen partitioning in three Eucalyptus species grown under a nutrient deficit. New Phytol. 1988, 109, 21–28. [Google Scholar] [CrossRef]
  65. Zhang, R.; Zhao, Y.; Lin, J.; Hu, Y.; Hänninen, H.; Wu, J. Biochar application alleviates unbalanced nutrient uptake caused by N deposition in Torreya grandis trees and seedlings. For. Ecol. Manag. 2019, 432, 319–326. [Google Scholar] [CrossRef]
  66. Huang, Z.; Liu, B.; Davis, M.; Sardans, J.; Peñuelas, J.; Billings, S. Long-term nitrogen deposition linked to reduced water use efficiency in forests with low phosphorus availability. New Phytol. 2016, 210, 431–442. [Google Scholar] [CrossRef] [Green Version]
  67. Wang, M.; Murphy, M.T.; Moore, T.R. Nutrient resorption of two evergreen shrubs in response to long-term fertilization in a bog. Oecologia 2014, 174, 365–377. [Google Scholar] [CrossRef]
  68. See, C.R.; Yanai, R.D.; Fisk, M.C.; Vadeboncoeur, M.A.; Quintero, B.A.; Fahey, T.J. Soil nitrogen affects phosphorus recycling: Foliar resorption and plant–soil feedbacks in a northern hardwood forest. Ecology 2015, 96, 2488–2498. [Google Scholar] [CrossRef] [Green Version]
  69. Allen, A.P.; Gillooly, J.F. Towards an integration of ecological stoichiometry and the metabolic theory of ecology to better understand nutrient cycling. Ecol. Lett. 2009, 12, 369–384. [Google Scholar] [CrossRef]
  70. Hessen, D.O.; Ågren, G.I.; Anderson, T.R.; Elser, J.J.; De Ruiter, P.C. Carbon sequestration in ecosystems: The role of stoichiometry. Ecology 2004, 85, 1179–1192. [Google Scholar] [CrossRef]
  71. Güsewell, S.; Koerselman, W. Variation in nitrogen and phosphorus concentrations of wetland plants. Perspect. Plant Ecol. Evol. Syst. 2002, 5, 37–61. [Google Scholar] [CrossRef]
  72. Demars, B.O.; Edwards, A. Tissue nutrient concentrations in freshwater aquatic macrophytes: High inter-taxon differences and low phenotypic response to nutrient supply. Freshw. Biol. 2007, 52, 2073–2086. [Google Scholar] [CrossRef]
  73. Yuan, Z.Y.; Chen, H.Y.H. Negative effects of fertilization on plant nutrient resorption. Ecology 2015, 96, 373–380. [Google Scholar] [CrossRef] [PubMed]
  74. Sistla, S.A.; Schimel, J.P. Stoichiometric flexibility as a regulator of carbon and nutrient cycling in terrestrial ecosystems under change. New Phytol. 2012, 196, 68–78. [Google Scholar] [CrossRef] [PubMed]
  75. Greenwood, D.J.; Karpinets, T.V.; Zhang, K.; Bosh-Serra, A.; Boldrini, A.; Karawulova, L. A unifying concept for the dependence of whole-crop N: P ratio on biomass: Theory and experiment. Ann. Bot. 2008, 102, 967–977. [Google Scholar] [CrossRef]
  76. Xu, S.; Zhou, G.; Tang, X.; Wang, W.; Wang, G.; Ma, K.; Han, S.; Du, S.; Li, S.; Yan, J. Different spatial patterns of nitrogen and phosphorus resorption efficiencies in China’s forests. Sci. Rep. 2017, 7, 10584. [Google Scholar] [CrossRef] [Green Version]
  77. Rejmánková, E. Nutrient resorption in wetland macrophytes: Comparison across several regions of different nutrient status. New Phytol. 2005, 167, 471–482. [Google Scholar] [CrossRef]
  78. Killingbeck, K.T. The terminological jungle revisited: Making a case for use of the term resorption. Oikos 1986, 46, 263–264. [Google Scholar] [CrossRef]
  79. Yuan, Z. Decoupling of nitrogen and phosphorus in terrestrial plants associated with global changes. Nat. Clim. Chang. 2015, 5, 465–469. [Google Scholar] [CrossRef]
  80. Aerts, R. Nutrient resorption from senescing leaves of perennials: Are there general patterns? J. Ecol. 1996, 597–608. [Google Scholar] [CrossRef]
  81. Boerner, R.E. Seasonal nutrient dynamics, nutrient resorption, and mycorrhizal infection intensity of two perennial forest herbs. Am. J. Bot. 1986, 73, 1249–1257. [Google Scholar] [CrossRef]
  82. Sabaté, S.; Sala, A.; Gracia, C.A. Nutrient content in Quercus ilex canopies: Seasonal and spatial variation within a catchment. Plant. Soil 1995, 168, 297–304. [Google Scholar] [CrossRef]
  83. Agüero, M.L.; Puntieri, J.; Mazzarino, M.J.; Grosfeld, J.; Barroetaveña, C. Seedling response of Nothofagus species to N and P: Linking plant architecture to N/P ratio and resorption proficiency. Trees 2014, 28, 1185–1195. [Google Scholar] [CrossRef]
  84. Tian, D.; Reich, P.B.; Chen, H.Y.; Xiang, Y.; Luo, Y.; Shen, Y.; Meng, C.; Han, W.; Niu, S. Global changes alter plant multi-element stoichiometric coupling. New Phytol. 2019, 221, 807–817. [Google Scholar] [CrossRef] [PubMed]
  85. Laliberté, E.; Turner, B.L.; Costes, T.; Pearse, S.J.; Wyrwoll, K.H.; Zemunik, G.; Lambers, H. Experimental assessment of nutrient limitation along a 2-million-year dune chronosequence in the south-western Australia biodiversity hotspot. J. Ecol. 2012, 100, 631–642. [Google Scholar] [CrossRef]
  86. Wright, I.J.; Westoby, M. Nutrient concentration, resorption and lifespan: Leaf traits of Australian sclerophyll species. Funct. Ecol. 2003, 17, 10–19. [Google Scholar] [CrossRef] [Green Version]
  87. Li, Y.; Niu, S.; Yu, G. Aggravated phosphorus limitation on biomass production under increasing nitrogen loading: A meta-analysis. Glob. Chang. Biol. 2016, 22, 934–943. [Google Scholar] [CrossRef]
  88. Dijkstra, F.A.; Carrillo, Y.; Aspinwall, M.J.; Maier, C.; Canarini, A.; Tahaei, H.; Choat, B.; Tissue, D.T. Water, nitrogen and phosphorus use efficiencies of four tree species in response to variable water and nutrient supply. Plant. Soil 2016, 406, 187–199. [Google Scholar] [CrossRef]
Figure 1. Location of the study site.
Sustainability 13 09736 g001
Figure 2. General view of a mature T. grandis tree (a) and its annual shoots (b).
Sustainability 13 09736 g002
Figure 3. Soil total N:P and total C:N under different treatment. Error bars refer to ±1 standard error (different capital letters indicate a significant difference among factors under N addition only; lowercase letters indicate a significant difference among factors under N + P addition; * indicate a significant difference between two fertilization scenarios under same addition intensity, p < 0.05).
Sustainability 13 09736 g003
Figure 4. Effect of different fertilizer treatments on the green (left) and senescent (right) leaf nutrient content ([C], [N] and [P]) and C:N, N:P ratios. Error bars refer to ±1 standard error (different capital letters indicate a significant difference among factors under N addition only; lowercase letters indicate a significant difference among factors under N + P addition; * indicate a significant difference between two fertilization scenarios under same addition intensity, p < 0.05).
Sustainability 13 09736 g004
Figure 5. Nutrients resorption efficiency of N (NRE), P (PRE) and relative nutrient resorption (RR = NRE − PRE) of T. grandis under different fertilizer treatment scenarios. The lowercase letters indicate a significant difference among treatments, p < 0.05.
Sustainability 13 09736 g005
Table 1. Soil nutrient contents under different treatment. SOC (g/kg), TN (g/kg), TP (mg/kg), HN (mg/kg), and AP (mg/kg) denote total soil organic C, total N, total P, hydrolyzable N, and olsen-P, respectively. Error bars refer to ±1 standard error, p < 0.05, n = 5; different letters indicate significant difference among N addition gradients with or without P addition separately; * indicates a significant difference between P treatments in the same N treatment.
N
P0N0
P0N1P0N2P0N3P0N4N + P
P1N1
P2N2P3N3P4N4
SOC18.2 a ± 2.017.2 a* ± 0.418.0 a* ± 0.519.5 b* ± 0.921.0 b* ± 0.323.2 b* ± 2.822.6 b* ± 1.030.8 c* ± 2.134.2 d* ± 0.6
TN1.67 a ± 0.11.79 a2.3 b ± 0.12.9 c ± 0.23.7 d ± 0.31.9 b ± 0.22.1 b2.8 c ± 0.13.4 d ± 0.1
TP1.56 a* ± 0.11.45 a*1.52 a*1.56 a*1.6 a*2.1 a* ± 0.12.46 b* ± 0.13.1 c* ± 0.24.45 d* ± 0.1
HN132 a ± 3.5145 b ± 11.2175 c ± 10.6208.7d ± 13.2299 e ± 11.7130.8 a ± 3.5163.6 b ± 13.2207 d ± 13.1266.4 d ± 5.6
AP225 a ± 15269.1 b ± 6.4282.8 b ± 5245.4 b ± 11.9274.6 b ± 9.6362 a ± 4.4609.7 b ± 25615.3 b ± 10.31081 c ± 22.7
pH6.7 a3.9 b4.1 b4.98 b4.4 b3.7 b5.0 a4.0 b5.5 a
Table 2. Pearson correlation coefficients of the nutrients in leaves and soil in the N + P addition scenario.
Soil TNSoil TPSoil HNSoil APSOC
Leaf P0.789 **0.809 **0.906 *0.5410.691 **
Leaf C:P−0.564 *−0.548 *−0.917 *−0.507−0.476
Leaf N:P−0.582 *−0.549 *−0.900 *−0.488−0.512
** and * indicate statistical significances at α 0.01 and 0.05.
Table 3. Annual shoots on each 0.5 m branch and yield per tree (kg) under different fertilizer treatments.
N
P0N0
P0N1P0N2P0N3P0N4N + P
P1N1
P2N2P3N3P4N4
Shoots59.6 ± 3.058.3 ± 3.360.5 ± 4.257.6 ± 2.157.9 ± 3.159.2 ± 4.258.2 ± 2.359.0 ± 2.757.0 ± 2.3
Yield219 ± 8.9228.8 ± 6.3226 ± 9.2217.6 ± 3.2203.2 ± 15.0 *233.2 ± 4.6 *230.2 ± 8.4 *227.4 ± 8.9 *214.4 ± 9.6
* indicates a significant difference between the treatment and control.
Table 4. Relationships of nutrients among soil, leaves, and litter through SMA analyses.
YXSlopeInterceptR2
Leaf NSoil TP0.241.260.63 *
Leaf NSoil HN0.210.870.48 *
Litter NLeaf N0.90.250.72 **
Litter PSoil TP0.69−0.020.59 *
Litter CLeaf C1.63−1.120.51 *
Leaf CSOC0.181.420.88 **
Leaf C:PLeaf P−1.031.700.99 **
Leaf C:PLeaf P−1.021.360.98 **
PRELeaf P−1.021.360.98 **
* and ** are 2-tail sig. p < 0.1 and 0.05.
Publisher’s Note: MDPI stays neutral with regard to jurisdictional claims in published maps and institutional affiliations.

